Attached files
| file | filename |
|---|---|
| 8-K - 8-K - Agiliti Health, Inc. | a13-12548_18k.htm |
| EX-99.1 - EX-99.1 - Agiliti Health, Inc. | a13-12548_1ex99d1.htm |
Exhibit 99.2
|
|
UHOS Q1 2013 Earnings Teleconference May 16, 2013 |
|
|
Safe Harbor Statement under the Private Securities Litigation Reform Act of 1995: Universal Hospital Services, Inc. believes statements in this presentation looking forward in time involve risks and uncertainties based on management’s current views and assumptions. Actual events may differ materially. Please refer to the cautionary statement regarding forward-looking statements and risk factors that appear in the Company’s Annual Report on Form 10-K for the year ended December 31, 2012, and other filings with the SEC, which can be accessed at www.UHS.com under “Financials.” This presentation contains non-GAAP measures as defined by SEC rules. Reconciliations of these measures to the most directly comparable GAAP measures are contained in the appendix. Forward Looking Statements |
|
|
2013 Results (Adjusted EBITDA) $31.9 $32.5 2012 2013 $31.9 $35.0 $2.5 $121.6 $120.5 2012 2013 $16.7 $137.7 $137.2 $16.1 1st Quarter Q1 LTM Base + 0.9% Recall Gains Solid flu season was offset by continued investment in our growth platform Hospital volumes remain relatively flat to down On track with expected full year performance |
|
|
Asset360 Signings Approaching the Tipping Point 2007 2012 First Half 2013 E 30 20 10 40 Average 6-14 Q2 Estimate Q1 Actual |
|
|
Comprehensive Solutions Evolution Surgical Equipment Management NPWT Rental NPWT 360 |
|
|
Jim Pekarek, Executive Vice President & Chief Financial Officer Full Contingent of Executive Management on Board Patrick Sinclair, President, UHS Surgical Services Bob Creviston Chief Human Resources Officer |

|
|
Rex Clevenger, Executive Vice President & Chief Financial Officer (Retiring 5-30-13) Fond Farewell Thanks Rex and enjoy the ride! |

|
|
Rex’s Clip Art Collection Katrina Rita Wilma UHS UHS 10 20 30 40 40 30 20 10 Asset360 Field UHS > $3 billion Market 50 UHS UHS Equipment Recalls Weak Flu Weak Census |

|
|
Financial Review 1st Quarter 2013 |
|
|
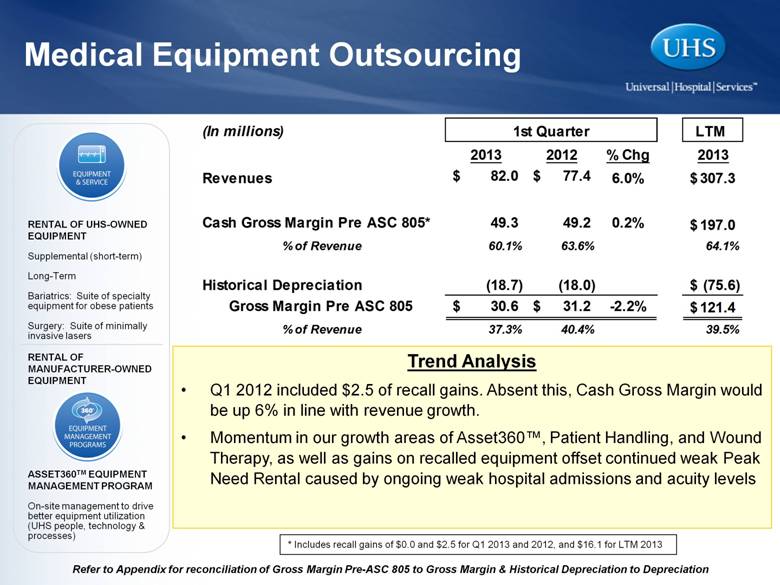
Refer to Appendix for reconciliation of Gross Margin Pre-ASC 805 to Gross Margin & Historical Depreciation to Depreciation Medical Equipment Outsourcing RENTAL OF UHS-OWNED EQUIPMENT Supplemental (short-term) Long-Term Bariatrics: Suite of specialty equipment for obese patients Surgery: Suite of minimally invasive lasers RENTAL OF MANUFACTURER-OWNED EQUIPMENT ASSET360TM EQUIPMENT MANAGEMENT PROGRAM On-site management to drive better equipment utilization (UHS people, technology & processes) Trend Analysis Q1 2012 included $2.5 of recall gains. Absent this, Cash Gross Margin would be up 6% in line with revenue growth. Momentum in our growth areas of Asset360™, Patient Handling, and Wound Therapy, as well as gains on recalled equipment offset continued weak Peak Need Rental caused by ongoing weak hospital admissions and acuity levels * Includes recall gains of $0.0 and $2.5 for Q1 2013 and 2012, and $16.1 for LTM 2013 (In millions) LTM 2013 2012 % Chg 2013 Revenues 82.0 $ 77.4 $ 6.0% 307.3 $ Cash Gross Margin Pre ASC 805* 49.3 49.2 0.2% 197.0 $ % of Revenue 60.1% 63.6% 64.1% Historical Depreciation (18.7) (18.0) (75.6) $ Gross Margin Pre ASC 805 30.6 $ 31.2 $ -2.2% 121.4 $ % of Revenue 37.3% 40.4% 39.5% 1st Quarter |
|
|
Technical and Professional Services TECHNICAL SERVICES Maintain & Repair Customer owned Equipment: Non-resident, response based/ scheduled Biomedical Services Manufacturer Services BIOMED360TM EQUIPMENT MAINTENANCE PROGRAM Customizable on-site biomedical services program Refer to Appendix for reconciliation of Gross Margin Pre-ASC 805 to Gross Margin & Historical Depreciation to Depreciation Trend Analysis Will be “lumpy” going forward with large BioMed360 signings and Manufacturer Services projects (In millions) LTM 2013 2012 % Chg 2013 Revenues 21.2 $ 20.1 $ 5.6% 83.3 $ Cash Gross Margin Pre ASC 805 4.4 4.5 -2.2% 20.4 $ % of Revenue 20.8% 22.4% 24.5% Historical Depreciation (0.2) (0.1) (0.8) $ Gross Margin Pre ASC 805 4.2 $ 4.4 $ -3.3% 19.6 $ % of Revenue 19.9% 21.7% 23.5% 1st Quarter |
|
|
Medical Equipment Sales and Remarketing ASSET RECOVERY & EQUIPMENT BROKERAGE NEW EQUIPMENT SALES DISPOSABLE SALES Refer to Appendix for reconciliation of Gross Margin Pre-ASC 805 to Gross Margin & Historical Depreciation to Depreciation Trend Analysis Results in this segment will fluctuate based on equipment availability, transactional size and the transactional nature of the business (In millions) LTM 2013 2012 % Chg 2013 Revenues 7.1 $ 6.4 $ 11.7% 31.1 $ Cash Gross Margin Pre ASC 805 1.5 1.7 -11.8% 6.9 $ % of Revenue 21.1% 26.6% 22.2% Historical Depreciation (0.1) (0.1) (0.4) $ Gross Margin Pre ASC 805 1.4 $ 1.6 $ -12.1% 6.5 $ % of Revenue 20.0% 25.4% 20.9% 1st Quarter |
|
|
Selected Financial Data * Includes recall gains of $0.0 and $2.5 for Q1 2013 and 2012, and $16.1 for LTM 2013 (In millions) LTM 2013 2012 % Chg 2013 Consolidated Revenues 110.4 $ 103.9 $ 6.2% 421.7 $ Cash Gross Margin Pre-ASC 805* 55.2 55.4 -0.4% 224.3 % of Revenues 50.0% 53.3% 53.2% Historical Depreciation (19.0) (18.2) (76.8) Gross Margin Pre-ASC 805 36.2 37.2 -2.7% 147.5 % of Revenues 32.8% 35.8% 35.0% Cash SG&A 23.1 20.2 14.4% 85.8 % of Revenues 20.9% 19.4% 20.3% Non Controlling Interest 0.2 0.2 0.8 % of Revenues 0.2% 0.2% 0.2% Adjusted EBITDA* Actual 31.9 $ 35.0 $ -8.9% 137.7 $ Pro forma Adjustment 0.2 Pro forma Adjusted EBITDA 137.9 $ 1st Quarter |
|
|
$235 Bank Line (as of March 31) Liquidity Profile Remains Solid (Includes LOCs of $3) (In millions) 7.625% Fixed Rate Notes $235 Revolver Additional Commitment = $30 Available Liquidity = ~ $168 Used = ~ $37 Borrowing Base = $205 |
|
|
Cash Flow from Operations: Decline Due to Timing of Interest Payments (In millions) $24.0 $7.0 2013 2012 $20.1 1st Quarter Impacts Q1 yet neutral for year New 7.625% Notes Called Notes |

|
|
Leverage Trend Refer to Appendix for reconciliation of Adjusted EBIDTA to Cash Flow from Operations and pro forma calculation Note that our calculations include accrued interest for conservatism (In millions) (In millions) 3/31/2013 12/31/2012 Floating Rate Notes - $ 230.0 $ 2012 Notes - 7.625% 425.0 425.0 Add-on Notes - 7.625% 220.0 - Bank Line 33.5 28.0 Consolidated Capital Leases 15.2 16.0 Subtotal Debt 693.7 699.0 Unamortized Bond Premium 13.8 - Total Debt 707.5 699.0 Less: Cash On Hand - - Add: Accrued Interest 6.5 13.8 Net Debt 714.0 $ 712.8 $ Pro forma Adj EBITDA 137.9 $ 141.3 $ Leverage 5.2 5.0 UHS Debt Structure |
|
|
2011 2012 2013 E Adjusted EBITDA Base: $118.0 Recall: $15.4 Total: $133.4 Pro forma: 136.8* Base: $122.2 Recall: $18.6 Total: $140.8 Pro forma: 141.3* $130 + / - (Recall: $0) Accrual CAPEX $80.2 $55.4 $70 + / - Year-end Leverage 4.9x* 5.0x* Mid to Upper 5’s Street Guidance for 2013 * Refer to later slide for pro forma calculations (In millions) |
|
|
Consolidating Reconciliations EBITDA Reconciliation: 2013 & 2012 EBITDA Reconciliation: 2004 – 2013 Selected Reconciliations Gross Margin Pre-ASC 805 to Gross Margin Depreciation and Amortization Reconciliation Other Reconciliations Appendix |
|
|
Consolidating Reconciliations * Includes recall gains of $0.0 for Q1 2013 and $16.1 for LTM 2013 (In millions) Surgical Surgical Actual: UHS Services Total UHS Services Total Cash Gross Margin* 49.1 $ 6.1 $ 55.2 $ 200.6 $ 23.7 $ 224.3 $ Depreciation - Historical (17.8) (1.2) (19.0) (72.0) (4.8) (76.8) Gross Margin Pre ASC 805 31.3 4.9 36.2 128.6 18.9 147.5 Adj Cash SGA 20.3 2.8 23.1 75.0 10.8 85.8 Non Controlling Interest in LLC's - 0.2 0.2 - 0.8 0.8 EBITDA* 25.6 2.7 28.3 99.3 10.8 110.1 Management, board, and strategic fees 1.4 - 1.4 3.0 0.2 3.2 Loss on extinguishment of debt 1.9 - 1.9 14.2 - 14.2 Reorganization costs (0.2) 0.3 0.1 6.1 1.0 7.1 Stock options expense 0.1 0.1 0.2 3.0 0.1 3.1 Adjusted EBITDA* 28.8 $ 3.1 $ 31.9 $ 125.6 12.1 137.7 Surgical laser services acquisition purchased on 7/1/12 - 0.2 0.2 ** Pro forma Adjusted EBITDA 125.6 $ 12.3 $ 137.9 $ ** Pro forma adjustments include the 3 months prior to the 7/1/12 acquisition Consolidated Q1 2013 Consolidated LTM 2013 |
|
|
EBITDA Reconciliation Adjusted EBITDA Reconciliation. Adjusted EBITDA is defined by UHS as Earnings Before Interest, Taxes, Depreciation and Amortization (“EBITDA”), before management, board and strategic fees, stock option expense, reorganization costs, ASC 805 impact, loss on extinguishment of debt, transaction and related costs and other. In addition to using Adjusted EBITDA internally as a measure of operational performance, we disclose Adjusted EBITDA externally to assist analysts, investors and lenders in their comparisons of operational performance, valuation and debt capacity across companies with differing capital, tax and legal structures. Management also understands that some industry analysts and investors consider Adjusted EBITDA as a supplementary non-GAAP financial measure useful in analyzing a company’s ability to service debt. Adjusted EBITDA, however, is not a measure of financial performance under Generally Accepted Accounting Principals (“GAAP”) and should not be considered as an alternative to, or more meaningful than, net income as a measure of operating performance or to cash flows from operating, investing or financing activities or as a measure of liquidity. Since Adjusted EBITDA is not a measure determined in accordance with GAAP and is thus susceptible to varying interpretations and calculations, Adjusted EBITDA, as presented, may not be comparable to other similarly titled measures of other companies. Adjusted EBITDA does not represent an amount of funds that is available for management’s discretionary use. A reconciliation of consolidated net income (loss) to EBITDA and Adjusted EBITDA is included below. * Includes recall gains of $0.0 and $2.5 for Q1 2013 and 2012, and $16.1 for LTM 2013 (In millions) LTM 2013 2012 2013 Net loss attributable to UHS* (10.4) $ (3.1) $ (42.2) $ Interest expense 13.9 15.5 54.1 Provision (benefit) for income taxes 0.7 (3.2) 1.0 Depreciation and amortization 24.1 23.6 97.2 EBITDA* 28.3 32.8 110.1 Management, board & strategic fees 1.4 1.0 3.2 Loss on extinguishment of debt 1.9 - 14.2 Reorganization costs 0.1 - 7.1 Stock option expense 0.2 1.1 3.1 Other ASC 805 Impact - 0.1 - Adjusted EBITDA* 31.9 $ 35.0 $ 137.7 $ 7/1/12 Epic/Rogue pro forma EBITDA (3 mos) 0.2 Pro forma Adjusted EBITDA 137.9 $ 1st Quarter |
|
|
EBITDA Reconciliation: 2004 – 2013 * Includes recall gains of $18.6, $15.4, and $4.4 for 2012, 2011, and 2010 LTM Q1 (In millions) 2004 2005 2006 2007 2008 2009 2010 2011 2012 2013 Net Cash provided by Operating Activities 38.0 $ 44.0 $ 48.9 $ 29.8 $ 56.2 $ 56.0 $ 76.2 $ 57.7 $ 72.5 $ 55.5 $ Changes in Operating Assets and Liabilities 2.2 2.3 0.7 6.7 3.6 6.2 (2.1) 0.6 10.7 6.4 Other and Non-Cash Expenses (3.4) (3.3) (4.1) (28.5) 6.5 6.3 (11.5) 15.9 (21.7) (6.9) Income Tax Expense 1.2 0.8 0.6 (9.7) (15.4) (11.5) 1.7 (8.3) (2.6) 1.0 Interest Expense 30.5 31.1 31.6 40.2 46.9 46.5 46.5 55.0 55.7 54.1 EBITDA* 68.5 74.9 77.7 38.5 97.8 103.5 110.8 120.9 114.6 110.1 Recapitalization, company sale, stock compensation and severance expenses - - - 27.2 - - - - - - Loss on extinguishment of debt - - - 23.4 - - - - 12.3 14.2 Financing and Reorganization Charges - - - 50.6 - - - - 12.3 14.2 Management, board & strategic fees 0.7 0.8 1.6 1.0 1.3 1.3 2.4 7.3 2.8 3.2 Reorganization costs - - - - - - - - 7.0 7.1 Stock option expense - - 1.7 3.7 2.5 1.3 7.3 4.3 4.0 3.1 ASC 805 impact - - - 2.4 2.3 2.0 1.1 0.9 0.1 - Other - - - (0.7) 0.1 - - - - - Adjusted EBITDA* 69.2 $ 75.7 $ 81.0 $ 95.5 $ 104.0 $ 108.1 $ 121.6 $ 133.4 140.8 137.7 Surgical Services LTM pro forma EBITDA 3.4 0.5 0.2 Pro forma Adjusted EBITDA 136.8 $ 141.3 $ 137.9 $ Total Revenue 199.6 $ 215.9 $ 225.1 $ 264.0 $ 289.1 $ 297.2 $ 312.1 $ 355.2 $ 415.3 $ 421.7 $ Total Debt & Accrued Int, Less Cash & Investments 301.9 $ 305.0 $ 315.0 $ 501.1 $ 521.7 $ 522.3 $ 528.6 $ 674.8 $ 712.8 $ 714.0 $ Leverage (Total Net Debt & Accrued Interest Less Cash & Investments/ LTM adj EBITDA) 4.4 4.0 3.9 5.2 5.0 4.8 4.3 4.9 5.0 5.2 |
|
|
Selected Reconciliations (In millions) LTM Q1 2013 2012 2013 Gross Margin ASC 805 Impact Depreciation 0.3 $ 0.1 $ 1.0 $ Total Gross Margin ASC 805 Impact 0.3 0.1 1.0 SG&A per GAAP to Cash SG&A SG&A per GAAP 31.5 27.7 132.8 Management, Board, & Strategic Fees (1.4) (1.0) (3.2) Loss on extinguishment of debt (1.9) - (14.2) Reorganization costs (0.1) - (7.1) Stock Option Expense (0.2) (1.1) (3.1) Other ASC 805 Impact - (0.1) - Historical Depreciation & Amortization (1.3) (1.2) (5.0) ASC 805 Depreciation & Amortization (3.5) (4.1) (14.4) Adjusted Cash SG&A 23.1 $ 20.2 $ 85.8 $ 1st Quarter |
|
|
Selected Reconciliations: Gross Margin Pre-ASC 805 to Gross Margin (In millions) 1st Quarter LTM Q1 2013 2012 2013 Medical Equipment Outsourcing Gross Margin Pre-ASC 805 30.6 $ 31.2 $ 121.4 $ ASC 805 Outsourcing Depreciation 0.3 0.1 1.0 Gross Margin per GAAP 30.3 31.1 120.4 Technical & Professional Services Gross Margin Pre-ASC 805 4.2 4.4 19.6 Gross Margin per GAAP 4.2 4.4 19.6 Medical Equipment Sales & Remarketing Gross Margin Pre-ASC 805 1.4 1.6 6.5 Gross Margin per GAAP 1.4 1.6 6.5 Total Gross Margin Pre-ASC 805 36.2 37.2 147.5 Total ASC 805 Depreciation 0.3 0.1 1.0 Total Gross Margin per GAAP 35.9 $ 37.1 $ 146.5 $ |
|
|
Depreciation & Amortization Reconciliations (In millions) LTM Q1 2013 2012 2013 Historical Outsourcing Depreciation 18.7 $ 18.0 $ 75.6 $ ASC 805 Outsourcing Depreciation 0.3 0.1 1.0 Total Outsourcing Depreciation 19.0 18.1 76.6 Historical Technical & Professional Services Depreciation 0.2 0.1 0.8 Total Technical & Professional Services Depreciation 0.2 0.1 0.8 Historical Sales & Remarketing Depreciation 0.1 0.1 0.4 Total Sales & Remarketing Depreciation 0.1 0.1 0.4 Historical Gross Margin Depreciation 19.0 18.2 76.8 Gross Margin ASC 805 Depreciation 0.3 0.1 1.0 Total Gross Margin Depreciation 19.3 18.3 77.8 Historical Selling, General, and Admin Depreciation 1.3 1.2 5.0 Total Selling, General, and Admin Depreciation 1.3 1.2 5.0 Total ASC 805 Selling, General, and Admin Amortization 3.5 4.1 14.4 Total Depreciation and Amortization 24.1 $ 23.6 $ 97.2 $ 1st Quarter |
|
|
Other Reconciliations LTM (In millions) 2004 2005 2006 2007 2008 2009 2010 2011 2012 2013 Cash used in Investing Activities 65.2 $ 40.6 $ 51.7 $ 418.9 $ 71.4 $ 50.6 $ 74.2 $ 153.2 $ 73.6 $ 60.9 $ - Acquisitions (15.1) (1.1) - (349.7) - - - (70.0) (14.4) (3.0) - / + Other - - - 1.4 - 1.5 3.3 - - - - ME in A/P prior period (10.5) (3.8) (5.8) (7.4) (9.0) (5.7) (4.7) (11.8) (8.8) (5.0) + ME in A/P current period 3.8 5.8 7.4 9.0 5.7 4.7 11.8 8.8 5.0 11.1 Accrual CAPEX 43.4 $ 41.5 $ 53.3 $ 72.2 $ 68.1 $ 51.1 $ 84.6 $ 80.2 $ 55.4 $ 64.0 $ Certain Intellamed Assets - $ - $ - $ (14.6) $ - $ - $ - $ - $ - $ - $ UHS by Parent - - - (335.1) - - - - - - Emergent, net of cash received - - - - - - - (58.5) - - SLS, net of cash received - - - - - - - - (11.4) (0.4) Epic Rogue, net of cash received - - - - - - - - (2.6) (2.6) Other (15.1) (1.1) - - - - - (11.5) (0.4) - Total Acquisitions (15.1) $ (1.1) $ - $ (349.7) $ - $ - $ - $ (70.0) $ (14.4) $ (3.0) $ ACCRUAL CAPEX RECONCILIATION ACQUISITIONS |