Attached files
| file | filename |
|---|---|
| 8-K - 8-K - CLOUD PEAK ENERGY INC. | a13-11832_28k.htm |
Exhibit 99.1
|
|
Annual Meeting of Stockholders May 14, 2013 |

|
|
1 Cloud Peak Energy Inc. Financial Data Cloud Peak Energy Inc. is the sole owner of Cloud Peak Energy Resources LLC. Unless expressly stated otherwise in this presentation, all financial data included herein is consolidated financial data of Cloud Peak Energy Inc. Cautionary Note Regarding Forward-Looking Statements This presentation contains “forward-looking statements” within the meaning of the safe harbor provisions of Section 27A of the Securities Act of 1933 and Section 21E of the Securities Exchange Act of 1934. Forward-looking statements are not statements of historical facts, and often contain words such as “may,” “will,” “expect,” “believe,” “anticipate,” “plan,” “estimate,” “seek,” “could,” “should,” “intend,” “potential,” or words of similar meaning. Forward-looking statements are based on management’s current expectations, beliefs, assumptions and estimates regarding our company, industry, economic conditions, government regulations, energy policies and other factors. These statements are subject to significant risks, uncertainties and assumptions that are difficult to predict and could cause actual results to differ materially and adversely from those expressed or implied in the forward-looking statements. For a description of some of the risks and uncertainties that may adversely affect our future results, refer to the risk factors described from time to time in the reports and registration statements we file with the Securities and Exchange Commission, including those in Item 1A "Risk Factors" of our most recent Form 10-K and any updates thereto in our Forms 10-Q and current reports on Forms 8-K. There may be other risks and uncertainties that are not currently known to us or that we currently believe are not material. We make forward-looking statements based on currently available information, and we assume no obligation to, and expressly disclaim any obligation to, update or revise publicly any forward-looking statements made in our presentation, whether as a result of new information, future events or otherwise, except as required by law. Non-GAAP Financial Measures This presentation includes the non-GAAP financial measures of (1) Adjusted EBITDA (on a consolidated basis and for our reporting segments) and (2) Adjusted Earnings Per Share (“Adjusted EPS”). Adjusted EBITDA and Adjusted EPS are intended to provide additional information only and do not have any standard meaning prescribed by generally accepted accounting principles in the U.S. (“GAAP”). A quantitative reconciliation of historical net income to Adjusted EBITDA and EPS (as defined below) to Adjusted EPS is found in the tables accompanying this presentation. EBITDA represents net income, or income from continuing operations, as applicable, before (1) interest income (expense) net, (2) income tax provision, (3) depreciation and depletion, (4) amortization, and (5) accretion. Adjusted EBITDA represents EBITDA as further adjusted to exclude specifically identified items that management believes do not directly reflect our core operations. For the periods presented herein, the specifically identified items are: (1) adjustments to exclude the updates to the tax agreement liability, including tax impacts of our 2009 initial public offering and 2010 secondary offering, (2) adjustments for derivative financial instruments, excluding fair value mark-to-market gains or losses and including cash amounts received or paid, and (3) adjustments to exclude a significant broker contract that expired in the first quarter of 2010. Because of the inherent uncertainty related to the items identified above, management does not believe it is able to provide a meaningful forecast of the comparable GAAP measures or a reconciliation to any forecasted GAAP measures. Adjusted EBITDA is an additional tool intended to assist our management in comparing our performance on a consistent basis for purposes of business decision-making by removing the impact of certain items that management believes do not directly reflect our core operations. Adjusted EBITDA is a metric intended to assist management in evaluating operating performance, comparing performance across periods, planning and forecasting future business operations and helping determine levels of operating and capital investments. Period-to-period comparisons of Adjusted EBITDA are intended to help our management identify and assess additional trends potentially impacting our company that may not be shown solely by period-to-period comparisons of net income or income from continuing operations. Our chief operating decision maker uses Adjusted EBITDA as a measure of segment performance. Consolidated Adjusted EBITDA is also used as part of our incentive compensation program for our executive officers and others. We believe Adjusted EBITDA and Adjusted EPS are also useful to investors, analysts and other external users of our consolidated financial statements in evaluating our operating performance from period to period and comparing our performance to similar operating results of other relevant companies. Adjusted EBITDA allows investors to measure a company’s operating performance without regard to items such as interest expense, taxes, depreciation and depletion, amortization and accretion and other specifically identified items that are not considered to directly reflect our core operations. Similarly, we believe our use of Adjusted EPS provides an appropriate measure to use in assessing our performance across periods given that this measure provides an adjustment for certain specifically identified significant items that are not considered to directly reflect our core operations, the magnitude of which may vary significantly from period to period and, thereby, have a disproportionate effect on the earnings per share reported for a given period. Our management recognizes that using Adjusted EBITDA and Adjusted EPS as performance measures has inherent limitations as compared to net income, income from continuing operations, EPS or other GAAP financial measures, as these non-GAAP measures exclude certain items, including items that are recurring in nature, which may be meaningful to investors. Adjusted EBITDA and Adjusted EPS should not be considered in isolation and do not purport to be alternatives to net income, income from continuing operations, EPS or other GAAP financial measures as a measure of our operating performance. Because not all companies use identical calculations, our presentations of Adjusted EBITDA and Adjusted EPS may not be comparable to other similarly titled measures of other companies. Moreover, our presentation of Adjusted EBITDA is different than EBITDA as defined in our debt financing agreements. |
|
|
2012 Highlights 2 (1) Reconciliation tables for Adjusted EBITDA are included in the Appendix. Adjusted EBITDA(1) of $339 million. Generated $247 million in cash from operations for 2012. Liquidity was $778 million as of December 31, 2012. Shipments of 90.6 million tons – our three operated mines. 4.4 million tons – Asian exports. Acquired Youngs Creek project with 287 million tons of non-reserve coal deposits, along with 38,800 acres of surface land. Signed option and exploration agreements with the Crow Indian Tribe covering up to 1.4 billion tons of in-place coal. Announced an option with SSA Marine for up to 16 million tonnes of annual capacity at the planned Gateway Pacific Terminal. Announced an agreement to sell our 50% interest in the Decker mine to Ambre Energy including option for up to 5 million tonnes of annual capacity at their planned Millennium Bulk Terminal. |

|
|
Solid Operating Performance 3 (1) Includes tons sold from Antelope, Cordero Rojo, and Spring Creek mines. (2) Reconciliation tables for Adjusted EBITDA are included in the Appendix. Tons Sold from Company-Owned and Operated Mines (1) (in millions) Total Gross Revenues from Continuing Operations (in millions) Adjusted EBITDA(2) (in millions) |
|
|
4 Cloud Peak Energy Profile One of the largest U.S. coal producers 2012 coal shipments from Owned and Operated Mines of 90.6 million tons 2012 proven & probable reserves of 1.3 billion tons Only pure-play PRB coal company Extensive NPRB base for long-term growth opportunities Employs approximately 1,700 people NYSE: CLD (4/30/13) $19.54 Market Capitalization (4/30/13) ~$1.2 billion Total Available Liquidity (3/31/13) $851 million 2012 Revenue $1.5 billion Senior Debt (B1/BB-) (3/31/13) $600 million Market and Financial Overview Company Overview |
|
|
5 Top Coal Producing Companies - 2011 Incident Rates (MSHA) Source: MSHA. Note: Total Incident Rate = (total number of employee incidents x 200,000) / total man-hours. Good Safety Record Indicates Well-Run Operations Full Year 2012 MSHA AIFR 0.82 April 30, 2013 YTD MSHA AIFR 0.80 |
|
|
6 Cloud Peak Energy’s Strategy Focus on operational/financial performance Disciplined approach to capital expenditures Generating liquidity for growth opportunities Optimize demand for low-sulfur, pure-play PRB reserves Build from Existing Foundation Optimize Development Opportunities Business Development Evaluate numerous options to develop NPRB projects around Spring Creek complex Support low sodium domestic demand Support potential for expanded export demand Target acquisitions building on core operational strengths Aim to increase export exposure Develop opportunities through acquisition of complementary operations or companies, e.g., Western U.S., Canada Maximize Exports Leverage NPRB’s advantageous location and coal quality Optimize export logistics (rails and ports) Expand/develop other port options (U.S. Pacific Northwest, Canada) Have established in-country Korean representative to build export opportunities for our Logistics business Foster relationships for new export opportunities in China and other Asian countries, including Taiwan |
|
|
7 Domestic Strategy Consistent Forward Selling Strategy Focus on Matching Production to Market Demand Optimize Operational Focus on Cost Control and Improvement Programs Disciplined Capital Expenditures and Significant Reserve Base |

|
|
8 Reliable and Productive Operations Procedures and inspections protect equipment Advanced testing supports comparison vs. baseline (vibration, fluid analysis, ultrasound, infrared, etc.) Track component life and degradation to avoid unplanned failures Continuous improvement Strain gauge monitoring Scorecards (operator and mechanical feedback) Preventive Maintenance (change fluids, inspect thoroughly, etc.) Understanding equipment allows for better utilization Example, payload measurement supports better loading procedures leading to tighter distribution and increased payloads on haul trucks Centralized GPS dispatch optimizes truck & shovel productivity Improving Coal Load Per Haul Truck Improved asset utilization 320 280 240 200 160 120 3.0% 2.5% 2.0% 1.5% 1.0% 0.5% 2007 2012 |
|
|
9 Strong Forward Sales Position (tons in millions) (1) Production from Owned and Operated Mines. 2013 has 85.2 million tons committed at weighted-average price of $13.21/ton 2014 has 49.3 million tons committed at weighted-average price of $14.07/ton Coal - Total Committed Tons (as of 4/10/13)(1) Predictive Analysis Preventative Maintenance Improve Utilization Result: Reliable and Highly Productive Operations |
|
|
10 Todd Myers Senior Vice President Business Development Committed tons with variable pricing Committed tons with fixed pricing |

|
|
11 Export Strategy Strong International Demand Cloud Peak Energy Logistics established as the Primary Exporter of PRB Coal Youngs Creek Asset Acquisition Crow Exploration and Option Agreements Secured Port Throughput |
|
|
China and India’s Strong Demand Requires Increasing Thermal Imports 12 China Net Imports Urban and industrialization investment will continue to fuel these economies Importing coal essential for anticipated future electric generation growth Production costs in Australia and Indonesia rapidly increasing making PRB coal importing more financially viable Diversity of supply crucial +63% Source: Fenwel Energy Consulting and Industry Reports Estimated Asian Coal-Fired Generation (BkW) Source: AME India Net Imports |
|
|
13 Asian utilities seeking diversity and surety of long-term supply Our logistics business is the largest U.S. exporter of thermal coal into South Korea Other Asian countries form a growing pipeline for our targeted future exports Taiwan India Australia Indonesia Increasing International Demand Supports PRB Exports |

|
|
14 Spring Creek Complex Export Assets – Geographic Advantage Spring Creek Complex to Ridley - 1,893 or 2,697 Miles Spring Creek Complex to Westshore - 1,591 Miles Spring Creek Complex 235 miles closer than SPRB SPRB to NPRB rail is some of the busiest in U.S. Logistically more complex to ship from SPRB to Pacific Northwest Source: SNL Energy |
|
|
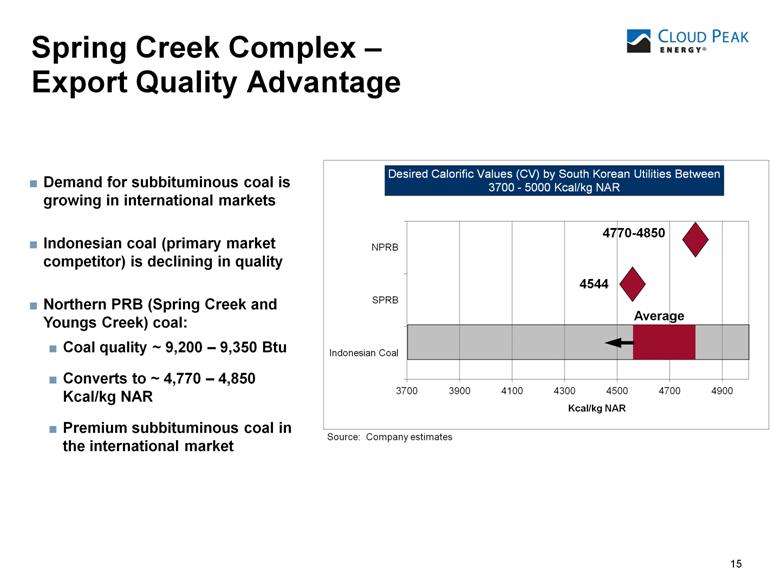
Spring Creek Complex – Export Quality Advantage 15 Demand for subbituminous coal is growing in international markets Indonesian coal (primary market competitor) is declining in quality Northern PRB (Spring Creek and Youngs Creek) coal: Coal quality ~ 9,200 – 9,350 Btu Converts to ~ 4,770 – 4,850 Kcal/kg NAR Premium subbituminous coal in the international market 15 4770-4850 4544 Average Source: Company estimates |
|
|
Youngs Creek Coal Assets Acquired June 2012 16 Greenfield project seven miles south of Spring Creek 287 million tons non-reserve coal deposits at YE 2012 Northern PRB coal at 9,200 Btu but lower sodium than Spring Creek mine Complementary to existing reserves of 293 million tons* at Spring Creek Multiple development options, production rates, timing and capex Permitted at 6 million tons in 2015, increasing to 14 million tons by 2019 * As of 12/31/2012 Youngs Creek coal assets in blue |
|
|
Youngs Creek Land Assets Acquired June 2012 17 38,800 acres of surface land Key location connecting Spring Creek, Youngs Creek, and potential Crow Exploration Area Will support access for Multiple development options of Youngs Creek Existing Spring Creek operations Future Spring Creek federal leases Air permits Rail corridors and access |
|
|
Crow Tribal Agreements January 2013 and Pending 18 Exploration Agreement and Option Agreement to lease up to 1.4 billion tons of in-place Northern PRB coal Approved by the Crow Tribal Legislature, signed by the Crow Tribe and Cloud Peak Energy on January 24, 2013 Cloud Peak Energy paid the Crow Tribe $2.25 million upon signing The executed agreements have been submitted to the U.S. Department of the Interior for review and requested approval. On approval, a further $1.5 million payment to the Crow Tribe will be made Leases, if exercised, provide for preferential hiring of Indians, scholarships, and other benefits for the Tribe Crow exploration area |

|
|
19 Spring Creek Complex – Potential Development Options |
|
|
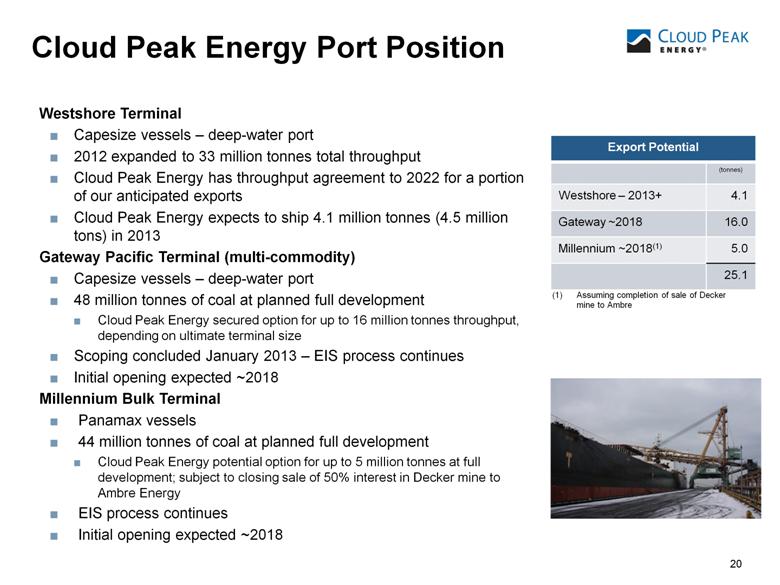
20 Cloud Peak Energy Port Position 20 Westshore Terminal Capesize vessels – deep-water port 2012 expanded to 33 million tonnes total throughput Cloud Peak Energy has throughput agreement to 2022 for a portion of our anticipated exports Cloud Peak Energy expects to ship 4.1 million tonnes (4.5 million tons) in 2013 Gateway Pacific Terminal (multi-commodity) Capesize vessels – deep-water port 48 million tonnes of coal at planned full development Cloud Peak Energy secured option for up to 16 million tonnes throughput, depending on ultimate terminal size Scoping concluded January 2013 – EIS process continues Initial opening expected ~2018 Millennium Bulk Terminal Panamax vessels 44 million tonnes of coal at planned full development Cloud Peak Energy potential option for up to 5 million tonnes at full development; subject to closing sale of 50% interest in Decker mine to Ambre Energy EIS process continues Initial opening expected ~2018 Export Potential (tonnes) Westshore – 2013+ 4.1 Gateway ~2018 16.0 Millennium ~2018(1) 5.0 25.1 (1) Assuming completion of sale of Decker mine to Ambre |
|
|
21 Growing “Pro-Coal” Efforts 21 Cloud Peak Energy is working with others to counter opposition of export development and to further expansion of ports, construction of new ports, and alternative shipping options Count on Coal Count on Coal was established to promote pro-coal messages, specifically highlighting the direct benefits to the local MT economy during the run up to the ’12 election. Based upon interest levels, there is now an effort underway to create a new cross-industry organization, promoting the broad economic benefits to MT from coal. www.countoncoal.org Alliance for Northwest Jobs and Exports The Alliance for Northwest Jobs and Exports is a non-profit trade organization that supports new export projects in Oregon and Washington State that will create thousands of new jobs and raise millions in tax revenue for local schools and other services. The Alliance has a diverse cross section of 52 members, representing more than 396,000 workers and 41,000 businesses across WA, OR, ID and MT. www.createnwjobs.com |
|
|
22 Executing on our Export Strategy Strong International Demand Cloud Peak Energy Logistics Established as the Primary Exporter of PRB Coal Youngs Creek Asset Acquisition Crow Exploration and Option Agreements Secured Port Throughput China and India expected to continue to drive significant demand growth Other Asian countries seeking security and diversity of supply Australian and Indonesian supply being hit by increasing capital and operating costs and regulatory uncertainty U.S. PRB coal no longer at top of cost curve Geographic advantage of Spring Creek complex, closer to ports Quality advantage compares well with seaborne competitive coal 287 million tons non-reserve coal deposits 38,800 acres strategic land Multiple development options with Spring Creek complex 1.4 billion in-place tons Exploration agreement Option to lease agreement Multiple development options with Spring Creek complex Subject to BIA regulatory approval Westshore 2022 Gateway Pacific option for up to 16 million tonnes Millennium potential option for up to 5 million tonnes Other opportunities |

|
|
23 Colin Marshall President and Chief Executive Officer |

|
|
24 External Environment (1) + Extended winter and high heating degree days + Increasing natural gas prices + Increasing PRB coal burn + Declining domestic utility stockpiles ̶ Low Newcastle benchmark pricing persists ̶ Long permitting process for proposed terminals in Pacific Northwest ̶ Regulatory EPA regulations for MATS effective March 2015 Retiring coal plants Further unknown requirements by new EPA directives |
|
|
25 Looking Forward - 2013 (1) Large, resilient domestic business 90 million tons committed for 2013 Strong balance sheet provides financial flexibility Actively working on terminal projects in Pacific Northwest Increasing PRB coal burn Declining domestic utility stockpiles |
|
|
Annual Meeting of Stockholders May 14, 2013 |
|
|
Appendices (Cloud Peak Energy Inc.) 27 |
|
|
28 Reconciliation of Non-GAAP Measures – Adjusted EBITDA (in millions) Year Ended December 31, 2012 2011 2010 2009 2008 Net income $ 173.7 $ 189.8 $ 117.2 $ * $ * Net income from continuing operations * * * 182.5 88.3 Interest income (1.1) (0.6) (0.6) (0.3) (2.9) Interest expense 36.3 33.9 46.9 6.0 20.4 Income tax expense (benefit) 62.6 11.4 32.0 68.2 25.3 Depreciation and depletion 94.6 87.1 100.0 97.9 89.0 Amortization — — 3.2 28.7 46.0 Accretion 13.2 12.5 12.5 12.6 12.7 EBITDA $ 379.3 $ 334.1 $ 311.3 $ 395.6 $ 278.9 Tax agreement expense(1) (29.0) 19.9 19.7 — — Derivative financial instruments: Exclusion of fair value mark-to-market (gains) losses(2) (22.8) (2.3) — — — Inclusion of cash amounts received (paid)(3) 11.2 — — — — Total derivative financial instruments (11.5) (2.3) — — — Expired significant broker contract — — (8.2) (75.0) (71.6) Adjusted EBITDA $ 338.8 $ 351.7 $ 322.7 $ 320.6 $ 207.2 * For 2009 and prior periods, Cloud Peak Energy reported discontinued operations. Accordingly, for such periods, net income from continuing operations is the comparable U.S. GAAP financial measure for Adjusted EBITDA. (1) Changes to related deferred taxes are included in income tax expense. (2) Derivative fair value mark-to-market (gains) losses reflected on the statement of operations. (3) Derivative cash gains and losses reflected within operating cash flows. |
|
|
29 Diluted earnings per common share attributable to controlling interest $ 2.85 $ 3.13 $ 1.06 $ * $ * Diluted earnings per common share attributable to controlling interest from continuing operations * * * 2.97 1.47 Tax agreement expense including tax impacts of IPO and Secondary Offering (0.58) (0.63) 0.78 — — Derivative financial instruments: Exclusion of fair value mark-to-market (gains) losses (0.24) (0.02) — — — Inclusion of cash amounts received (paid) 0.12 — — — — Total derivative financial instruments (0.12) (0.02) — — — Expired significant broker contract — — (0.10) (0.49) (0.41) Adjusted EPS $ 2.15 $ 2.47 $ 1.74 $ 2.48 $ 1.06 Weighted-average shares outstanding (in millions) 60.9 60.6 31.9 60.0 60.0 Reconciliation of Non-GAAP Measures – Adjusted EPS Year Ended December 31, 2012 2011 2010 2009 2008 * For 2009 and prior periods, Cloud Peak Energy reported discontinued operations. Accordingly, for such periods, diluted earnings (loss) per share attributable to controlling interest from continuing operations is the comparable U.S. GAAP financial measure for Adjusted EPS. |