Attached files
| file | filename |
|---|---|
| 8-K - FIRST QUARTER RESULTS - KBR, INC. | form8k.htm |
FOR IMMEDIATE RELEASE Contact: Zac Nagle
April 25, 2013 Vice President,
Investor Relations and Communications
713-753-5082
Rob Kukla, Jr.
Director, Investor Relations
713-753-5082
KBR ANNOUNCES FIRST QUARTER 2013 RESULTS
|
§
|
Earnings per diluted share of $0.59
|
|
§
|
Operating income up 19% year-over-year
|
|
§
|
Operating income margin up 156 basis points year-over-year
|
|
§
|
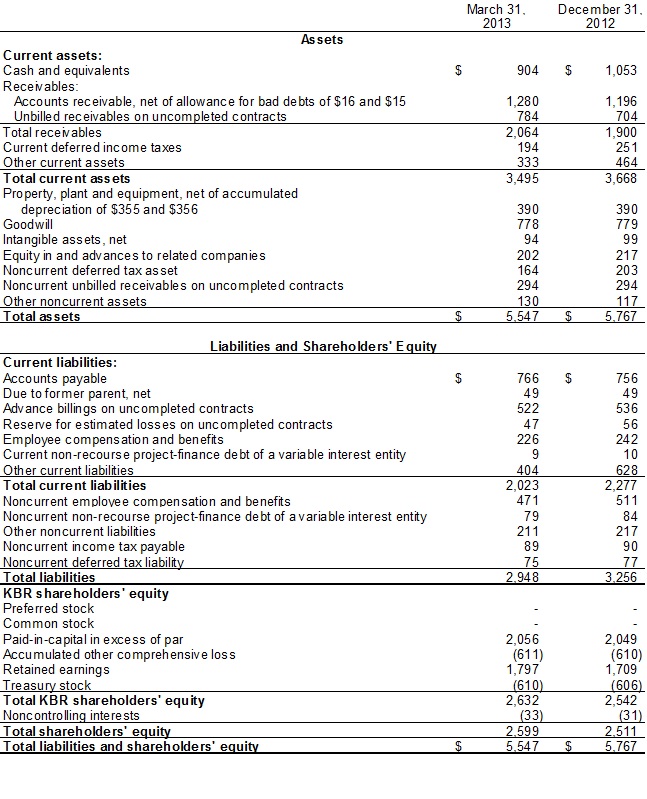
Cash and equivalents of $904 million at March 31, 2013
|
|
§
|
2013 earnings per diluted share guidance remains $2.45 to $2.90
|
HOUSTON, Texas – KBR (NYSE:KBR) announced today that first quarter 2013 net income attributable to KBR was $88 million, or $0.59 per diluted share, compared to net income attributable to KBR of $91 million, or $0.61 per diluted share, in the first quarter of 2012.
Consolidated revenue in the first quarter 2013 was $1.9 billion compared to $2.0 billion in the first quarter of 2012. Operating income in the first quarter 2013 was $133 million compared to operating income of $112 million in the prior year first quarter.
“KBR’s first quarter performance was consistent with our expectations. We delivered $0.59 of EPS on strong project execution across all of KBR’s businesses, including on the five problem projects we discussed in the fourth quarter where no incremental provisions were taken in the first quarter,” said Bill Utt, Chairman, President, and Chief Executive Officer of KBR. “We continue to see strong prospects for growth across our businesses and remain confident in our ability to successfully win and execute new work going forward.”
Business Discussion (All comparisons are first quarter 2013 versus first quarter 2012, unless otherwise noted).
Hydrocarbons Results
Hydrocarbons revenue was $947 million, down $169 million, or 15%. Hydrocarbons job income was $180 million, up $44 million, or 32%.
|
·
|
Gas Monetization job income was $104 million, up $25 million, or 32%, primarily related to continued strong execution, increased volumes at several LNG projects, and the close out of projects nearing completion.
|
|
·
|
Oil and Gas job income was $25 million, up $2 million, or 9%, primarily related to higher work volumes on the Shah Deniz project, FEED work for an FPSO in Angola and engineering and design work for a semi-submersible unit and a drilling platform. Partially offsetting the increase was the completion or near completion of several projects.
|
|
·
|
Downstream job income was $26 million, up $12 million, or 86%, primarily related to increased profits from an ethylene project in Uzbekistan, a gasifier FEED in Saudi Arabia, and the KBR-AMCDE entity in Saudi Arabia. Partially offsetting the increase was the completion of engineering on a refinery project in Africa.
|
|
·
|
Technology job income was $25 million, up $5 million, or 25%, primarily related to several new ammonia projects in the United States, Bolivia, Nigeria, Indonesia, India and Hungary as well as an ethylene project in Uzbekistan and a VCC project in Russia. Partially offsetting the increase was the completion of ammonia projects in Brazil and Egypt and an aniline project in China.
|
Infrastructure, Government and Power (IGP) Results
IGP revenue was $407 million, down $111 million, or 21%. IGP job income was $63 million, down $12 million, or 16%.
|
·
|
North American Government and Logistics (NAGL) job income was $20 million, up $5 million, or 33%, primarily related to award fee and base fee close-out items on the completed LogCAP III program in Iraq.
|
|
·
|
International Government, Defence and Support Services (IGDSS) job income was $22 million, down $14 million, or 39%, primarily related to lower work volumes on the Allenby & Connaught and Afghanistan ISP projects.
|
|
·
|
Infrastructure job income was $10 million, down $5 million, or 33%, primarily related to lower work volumes on water, transportation and facilities projects. The decrease was partially offset by higher activity on the Doha Expressway project in Qatar.
|
|
·
|
Power and Industrial (P&I) job income was $8 million, down $2 million, or 20%. Higher activity on a waste-to-energy expansion project and work performed on an emissions control EPC project was more than offset by the substantial completion of engineering activity on a coal gasification project and the completion of an industrial project in Louisiana.
|
|
·
|
Minerals job income was $3 million, up $4 million, or 400%, primarily related to charges taken on a legacy EPC project in the first quarter of 2012 that did not recur in the first quarter of 2013.
|
Services Results
Services revenue was $485 million, up $137 million, or 39%. Services job income was $31 million, up $3 million, or 11%, primarily related to several new module fabrication and turnaround projects ramping in Canada.
Ventures Results
Ventures job income was $8 million, flat with the prior year.
Corporate
First quarter of 2013 corporate general and administrative expense was $52 million.
First quarter of 2013 labor cost absorption expense was $15 million due to expected under-absorption of KBR’s centralized engineering resources.
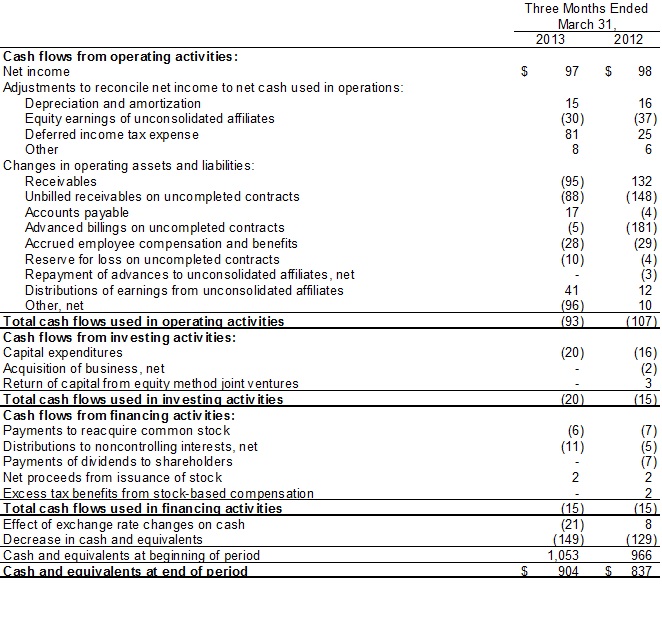
Total cash used in operating activities in the first quarter of 2013 was $93 million.
The effective tax rate for the first quarter of 2013 was approximately 23% compared to 9% for the first quarter of 2012.
During the first quarter of 2013, KBR had share repurchases of $6 million, capital expenditures of $20 million and pension contributions of $7 million for total cash deployment of $33 million.
Full Year 2013 Guidance
|
§
|
2013 earnings per diluted share guidance remains $2.45 to $2.90.
|
Significant Achievements and Awards
|
§
|
KBR was awarded a three-year agreement to provide turnaround services for Suncor Energy’s refinery in Edmonton, AB, Canada. KBR will assist with turnaround planning review, maintenance, pipe fabrication and long-term execution plans for the Suncor Edmonton refinery.
|
|
§
|
KBR was selected by Shell Canada Energy to perform off-site modularization and pipe fabrication using Shell Quest Carbon Capture and Storage technologies to reduce CO2 emissions at Shell’s Upgrader. KBR will provide pipe spool fabrication and module assembly for pipe, process, equipment and building modules as well as the fabrication of several unique and innovative vertical modules.
|
|
§
|
KBR was selected by Subsea 7 to perform the topsides design for the Chevron Lianzi development project in a unitized offshore zone between the Republic of Congo and the Republic of Angola. KBR will provide laser scanning of the entire Benguela Belize Lobito Tomboco topsides, FEED verification, detailed engineering, procurement services, and assistance during fabrication, installation, pre-commissioning and commissioning phases of the project.
|
|
§
|
KBR was awarded a task order by the U.S. Army Rock Island Contracting Command under its current Logistics Civil Augmentation Program (LOGCAP) IV contract for U.S. forces in Sheik Isa Airbase and Riffa Army support and Raydome. The period of performance is one base year, plus four option years and is valued at $53.5 million. Under the task order KBR will provide support to the U.S. forces in the Kingdom of Bahrain. Services will include facilities maintenance, operations and maintenance, food service, billeting, power generation, and waste management.
|
|
§
|
KBR was selected by PT Panca Amara Utama (PAU) to provide licensing, engineering services and proprietary equipment for a new grassroots ammonia plant in Sulawesi, Indonesia. PAU’s plan for a world scale grassroots plant with Ammonia capacity of 2000 Metric tonnes per day, will be built by Toyo Engineering Corporation and will be designed using KBR’s Reforming Exchanger System and Purifier Technology.
|
|
§
|
KBR was selected by PT Pupuk Sriwidjaja Palembang, to provide licensing, engineering services and proprietary equipment for a new 2000 MTPD ammonia and 2750 MTPD urea plant located in Palembang, South Sumatra, Indonesia. The plant will be designed using KBR’s Purifier technology, which has demonstrated higher reliability than conventional designs and offers the lowest proven energy consumption in the industry.
|
|
§
|
KBR was awarded a contract by Samsung Engineering Company, Ltd. to provide a technology license, basic engineering design package, and supply of proprietary equipment for a 1,200 MTPD ammonia fertilizer plant in Carrasco, Bolivia. The fertilizer ammonia complex will be designed using KBR’s Purifier Technology.
|
|
§
|
KBR was awarded the Djibouti Base Operation Support Services contract for services at Camp Lemonnier in Djibouti, Africa and Manda Bay, Kenya, under a contract valued at $127 million. KBR will provide services to include public safety, air operations, facility support, vehicle maintenance, environmental services as well as supply operations, housing, utilities, and laundry, food and recreation services.
|
KBR is a global engineering, construction and services company supporting the energy, hydrocarbons, power, industrial, civil infrastructure, minerals, government services and commercial markets. For more information, visit www.kbr.com.
NOTE: The statements in this press release that are not historical statements, including statements regarding future financial performance and backlog information, are forward-looking statements within the meaning of the federal securities laws. These statements are subject to numerous risks and uncertainties, many of which are beyond the company’s control, that could cause actual results to differ materially from the results expressed or implied by the statements. These risks and uncertainties include, but are not limited to: the outcome of and the publicity surrounding audits and investigations by domestic and foreign government agencies and legislative bodies; potential adverse proceedings by such agencies and potential adverse results and consequences from such proceedings; the scope and enforceability of the company’s indemnities from Halliburton Company; changes in capital spending by the company’s customers; the company’s ability to obtain contracts from existing and new customers and perform under those contracts; structural changes in the industries in which the company operates, escalating costs associated with and the performance of fixed-fee projects and the company’s ability to control its cost under its contracts; claims negotiations and contract disputes with the company’s customers; changes in the demand for or price of oil and/or natural gas; protection of intellectual property rights; compliance with environmental laws; changes in government regulations and regulatory requirements; compliance with laws related to income taxes; unsettled political conditions, war and the effects of terrorism; foreign operations and foreign exchange rates and controls; the development and installation of financial systems; increased competition for employees; the ability to successfully complete and integrate acquisitions; and operations of joint ventures, including joint ventures that are not controlled by the company.
KBR’s Annual Report on Form 10-K dated February 20, 2013, recent Current Reports on Forms 8-K, and other Securities and Exchange Commission filings discuss some of the important risk factors that KBR has identified that may affect the business, results of operations and financial condition. KBR undertakes no obligation to revise or update publicly any forward-looking statements for any reason.
KBR, Inc.: Condensed Consolidated Statements of Income
(Millions, except per share data) (Unaudited)

KBR, Inc.: Condensed Consolidated Balance Sheets
(Millions) (Unaudited)
KBR, Inc.: Condensed Consolidated Statements of Cash Flows
(Millions) (Unaudited)
KBR, Inc.: Revenue and Operating Results by Business Unit
(Millions)(Unaudited)

KBR, Inc.: Backlog Information (a)
(Millions)(Unaudited)

|
(a)
|
Backlog is presented differently depending on whether the contract is consolidated by KBR or is accounted for under the equity method of accounting. Backlog related to consolidated projects is presented as 100% of the expected revenue from the project. Backlog generally includes total expected revenue in backlog when a contract is awarded and/or the scope is definitized. Where contract duration is indefinite, projects included in backlog are limited to the estimated amount of expected revenue within the following twelve months. Certain contracts provide maximum dollar limits, with actual authorization to perform work under the contract being agreed upon on a periodic basis with the customer. In these arrangements, only the amounts authorized are included in backlog. For projects where KBR acts solely in a project management capacity, KBR only includes the management fee revenue of each project in backlog. For certain long-term service contracts with a defined contract term, such as those associated with privately financed projects, the amount included in backlog is limited to five years.
|
Backlog related to unconsolidated joint ventures is presented as KBR’s percentage ownership of the joint venture’s estimated revenue. However, because these projects are accounted for under the equity method, only KBR’s share of future earnings from these projects will be recorded in revenue. Our backlog for projects related to unconsolidated joint ventures totaled $5.5 billion, $5.8 billion and $1.7 billion at March 31, 2013, December 31, 2012, and December 31, 2011, respectively. Our backlog related to consolidated joint ventures with noncontrolling interest totaled $2.3 billion, $2.1 billion and $3.4 billion at March 31, 2013, December 31, 2012, and December 31, 2011, respectively.
As of March 31, 2013, 43% of our backlog was attributable to fixed-price contracts and 57% was attributable to cost-reimbursable contracts. For contracts that contain both fixed-price and cost-reimbursable components, we classify the components as either fixed-price or cost-reimbursable according to the composition of the contract except for smaller contracts where we characterize the entire contract based on the predominate component.
All backlog is attributable to firm orders as of March 31, 2013, December 31, 2012, and December 31, 2011.
|
(b)
|
Backlog attributable to unfunded government orders was $0.3 billion, $0.2 billion and $0.4 billion as of March 31, 2013, December 31, 2012, and December 31, 2011, respectively.
|