Attached files
| file | filename |
|---|---|
| EX-32.2 - EXHIBIT 32.2 - KBR, INC. | kbr-ex322x20161231.htm |
| EX-32.1 - EXHIBIT 32.1 - KBR, INC. | kbr-ex321x20161231.htm |
| EX-31.2 - EXHIBIT 31.2 - KBR, INC. | kbr-ex312x20161231.htm |
| EX-31.1 - EXHIBIT 31.1 - KBR, INC. | kbr-ex311x20161231.htm |
| EX-23.1 - EXHIBIT 23.1 - KBR, INC. | kbr-ex231x20161231.htm |
| EX-21.1 - EXHIBIT 21.1 - KBR, INC. | kbr-ex211x20161231.htm |
UNITED STATES
SECURITIES AND EXCHANGE COMMISSION
Washington, D.C. 20549
FORM 10-K
ý | Annual Report Pursuant to Section 13 or 15(d) of the Securities Exchange Act of 1934 |
For the fiscal year ended December 31, 2016
OR
¨ | Transition Report Pursuant to Section 13 or 15(d) of the Securities Exchange Act of 1934 for the transition period from to |
Commission File Number: 1-33146

KBR, Inc.
(Exact name of registrant as specified in its charter)
Delaware | 20-4536774 | |
(State of incorporation or organization) | (I.R.S. Employer Identification No.) | |
601 Jefferson Street, Suite 3400, Houston, Texas | 77002 | |
(Address of principal executive offices) | (Zip Code) | |
(713) 753-3011
(Registrant's telephone number including area code)
Securities registered pursuant to Section 12(b) of the Act:
Title of each class | Name of each exchange on which registered | |
Common Stock par value $0.001 per share | New York Stock Exchange | |
Securities registered pursuant to Section 12(g) of the Act: None
Indicate by check mark if the registrant is a well-known seasoned issuer, as defined in Rule 405 of the Securities Act. Yes ý No ¨
Indicate by check mark if the registrant is not required to file reports pursuant to Section 13 or Section 15(d) of the Act. Yes ¨ No ý
Indicate by check mark whether the registrant (1) has filed all reports required to be filed by Section 13 or 15(d) of the Securities Exchange Act of 1934 during the preceding 12 months (or for such shorter period that the registrant was required to file such reports), and (2) has been subject to such filing requirements for the past 90 days. Yes ý No ¨
Indicate by check mark whether the registrant has submitted electronically and posted on its corporate Web site, if any, every Interactive Data File required to be submitted and posted pursuant to Rule 405 of Regulation S-T (§232.405 of this chapter) during the preceding 12 months (or for such shorter period that the registrant was required to submit and post such files). Yes ý No ¨
Indicate by check mark if disclosure of delinquent filers pursuant to Item 405 of Regulation S-K is not contained herein, and will not be contained, to the best of registrant’s knowledge, in definitive proxy or information statements incorporated by reference in Part III of this Form 10-K or any amendment to this Form 10-K. ý
Indicate by check mark whether the registrant is a large accelerated filer, an accelerated filer, a non-accelerated filer, or a smaller reporting company. See the definitions of “large accelerated filer,” “accelerated filer” and “smaller reporting company” in Rule 12b-2 of the Exchange Act.
Large accelerated filer | ý | Accelerated filer | ¨ | ||
Non-accelerated filer | ¨ (Do not check if a smaller reporting company) | Smaller reporting company | ¨ | ||
Indicate by check mark whether the registrant is a shell company (as defined in Rule 12b-2 of the Exchange Act). Yes ¨ No ý
The aggregate market value of the voting stock held by non-affiliates on June 30, 2016 was approximately $1.9 billion, determined using the closing price of shares of the registrant's common stock on the New York Stock Exchange on that date of $13.24.
As of January 31, 2017, there were 142,878,363 shares of KBR, Inc. Common Stock, par value $0.001 per share, outstanding.
DOCUMENTS INCORPORATED BY REFERENCE
Portions of the registrant's Proxy Statement for its 2017 Annual Meeting of Stockholders are incorporated by reference into Part III of this report.
TABLE OF CONTENTS
Page | |
FINANCIAL STATEMENTS | |
Consolidated Statements of Operations | |
2
Forward-Looking and Cautionary Statements
This Annual Report on Form 10-K contains certain statements that are, or may be deemed to be, "forward-looking statements" within the meaning of Section 27A of the Securities Act of 1933, as amended, and Section 21E of the Securities Exchange Act of 1934, as amended. The Private Securities Litigation Reform Act of 1995 provides safe harbor provisions for forward-looking information. Some of the statements contained in this Annual Report on Form 10-K are forward-looking statements. All statements other than statements of historical fact are, or may be deemed to be, forward-looking statements. The words "believe," "may," "estimate," "continue," "anticipate," "intend," "plan," "expect" and similar expressions are intended to identify forward-looking statements. Forward-looking statements include information concerning our possible or assumed future financial performance and results of operations.
We have based these statements on our assumptions and analyses in light of our experience and perception of historical trends, current conditions, expected future developments and other factors we believe are appropriate in the circumstances. Forward-looking statements by their nature involve substantial risks and uncertainties that could significantly affect expected results, and actual future results could differ materially from those described in such statements. While it is not possible to identify all factors, factors that could cause actual future results to differ materially include the risks and uncertainties disclosed under “Item 1A. Risk Factors” contained in Part I of this Annual Report on Form 10-K.
Many of these factors are beyond our ability to control or predict. Any of these factors, or a combination of these factors, could materially and adversely affect our future financial condition or results of operations and the ultimate accuracy of the forward-looking statements. These forward-looking statements are not guarantees of our future performance, and our actual results and future developments may differ materially and adversely from those projected in the forward-looking statements. We caution against putting undue reliance on forward-looking statements or projecting any future results based on such statements or on present or prior earnings levels. In addition, each forward-looking statement speaks only as of the date of the particular statement, and we undertake no obligation to publicly update or revise any forward-looking statement.
3
PART I
Item 1. Business
General
KBR, Inc. and its subsidiaries (collectively, "KBR" or "the Company") is a global provider of differentiated, professional services and technologies across the asset and program life-cycle within the government services and hydrocarbons industries. Our capabilities include highly-specialized engineering services, mission and logistics support solutions, technology licensing, specialized consulting, procurement, construction, construction management, program management, operations, maintenance and other support services to a diverse customer base, including domestic and foreign governments, international and national oil and gas companies, independent refiners, petrochemical producers, fertilizer producers and manufacturers. Information regarding business segment disclosures included in Note 2 to our consolidated financial statements and "Item 7. Management’s Discussion and Analysis of Financial Condition and Results of Operations" contained in Part II of this Annual Report on Form 10-K is incorporated by reference into this Part I, Item 1.
KBR, Inc. is a global company headquartered in Houston, TX, USA, with offices around the world operations in over 40 countries and serving customers in over 70 countries. We were incorporated in Delaware on March 21, 2006 prior to an exchange offer transaction that separated us from our former parent, Halliburton Company, which was completed on April 5, 2007. We trace our history and culture to two businesses, The M.W. Kellogg Company ("Kellogg") and Brown & Root, Inc. ("Brown & Root"). Kellogg was founded in New York in 1901 and evolved into a technology and service provider for petroleum refining and petrochemicals processing. Brown & Root was founded in Houston, Texas in 1919 and built the world’s first offshore platform in 1947. Brown & Root was acquired by Halliburton in 1962 and Kellogg was acquired by Halliburton in 1998 through its merger with Dresser Industries. In 2016, we made two substantial acquisitions in the government services sector, which fundamentally and materially re-balanced our portfolio to a greater mix of long-term, cost reimbursable and synergistic professional services business base. This new business base, added to KBR’s existing portfolio, leverages our program and life-cycle management expertise across a much larger addressable market for expanded customer offerings and attendant growth opportunities.
Our Business Strategy
KBR’s vision is to be a global provider of professional services, across the asset life-cycle, from project inception, to facility implementation to asset maintenance and program management integration. We aim to execute a majority of our portfolio through contracts that are long-term, reimbursable, service contracts with a low-risk profile and predictable cash flows. Our key areas of strategic focus are as follows:
• | Government Services: A wide range of professional services across defense, space and government embracing research and development, test and evaluation, program acquisition, program management integration, and program sustainment. These services are mainly for governmental agencies in the United States ("U.S."), United Kingdom ("U.K.") and Australia and also cover other selective countries. These programs are frequently provided on long-term service contracts, with key scientific, technical and program management differentiation. Key customers include U.S. Department of Defense agencies such as the Missile Defense Agency, U.S. Army, U.S. Navy and U.S. Air Force as well as NASA, the U.K. Ministry of Defence, London Metropolitan Police, U.K. Army, other U.K. Crown Services, and the Royal Australian Air Force, Navy and Army. |
• | Hydrocarbons: In the global hydrocarbons sector we offer four primary services: |
◦ | Proprietary Technology: A broad spectrum of front-end services and solutions, including licensing of technologies, basic engineering and design services ("BED"), proprietary equipment ("PEQ"), plant automation services, remote monitoring of plant operations, catalysts, solvents and vessel internals together with specialist consulting services to the hydrocarbons, petrochemicals, chemicals and fertilizer markets. Key technologies in our portfolio are ammonia, nitric acid, ammonia nitrate, ethylene, phenol, bis-phenol A, polycarbonate, catalytic cracking, isomerization, alkylation, solvent de-asphalting and coal degasification. |
◦ | Specialized Consulting: A broad range of specialized consulting services across upstream, midstream, downstream and specialty chemicals; which includes: |
• | Front-end consulting services related to field development planning, technology selection and capital expenditure optimization; |
• | Plant integrity management; |
4
• | Specialized naval architecture technology (drillships, floating production, storage and offshore ("FPSO"), floating production units ("FPUs") and structural engineering); |
• | Feasibility studies, revamp studies, planning/development and construction studies for oil and gas (upstream industry), liquefied natural gas ("LNG"), refining, petrochemicals, chemicals and fertilizers (downstream industries). |
◦ | Project Delivery Solutions: From conceptual design, through front end engineering design and execution planning, to full engineering, procurement and construction ("EPC")/engineering, procurement, construction and maintenance ("EPCM") delivery for the development, construction and commissioning of projects across the entire hydrocarbons value chain, including offshore and onshore oil and gas industries, LNG/ gas to liquids ("GTL") markets, as well as for refining, petrochemicals, chemicals, specialty chemicals and fertilizers industries. KBR has licensed its market leading Ammonia Technology to over 225 Plants globally, and has constructed around 35% of the world’s LNG Capacity. |
◦ | Maintenance and Asset Services: Through our Brown & Root Industrial Services joint venture in North America and through KBR’s wholly owned Brown & Root entities in the Middle East, Europe (including Poland, Russia and the Netherlands) and APAC, we are a leading provider of engineering, construction, and reliability-driven maintenance solutions for the refinery, petrochemical, chemical, specialty chemicals and fertilizer markets. The focus is on customers seeking to achieve greater asset utilization and reliability to cut costs and increase production from existing assets, including small projects, sustaining capital, turnarounds, maintenance, specialty welding services, and high quality scaffolding. These contracts are generally long-term service contracts. |
◦ | Over the last few years, KBR has migrated into training simulators for a variety of process plants, and remote monitoring operations as part of its journey to digitalization. |
Competitive Advantages
We operate in global markets with customers who demand added value, know-how, technology and delivery solutions, and we seek to differentiate ourselves in areas we believe we have a competitive advantage, including:
• | Health, Safety, Security & Environment |
◦ | World-class planning, assessment, and execution practices and performance ('Zero Harm') |
• | People |
◦ | Distinctive, competitive and customer-focused culture, through our people ('One KBR') |
◦ | Large numbers of employees with U.S. government-issued security clearances |
• | Customer Relationships |
◦ | Customer objectives are placed at the center of our planning and delivery |
◦ | Long-term relationships in government services (for example, we have had a contract with NASA since the beginning of the space program) and with major oil and gas customers such as British Petroleum, Chevron Corporation and Shell Corporation. |
• | Project Delivery |
◦ | A reputation for successful delivery of large, complex and difficult projects globally - using world-class processes (the 'KBR Way'), including program management integrator |
• | Technical Excellence |
◦ | Quality, world-class technology, know-how and technical solutions |
• | Full Life-cycle Asset Support |
◦ | Comprehensive asset services through long-term contracts |
• | Financial Strength |
◦ | Through liquidity, capital capacity and ability to support warranties |
5
Our Business Segments
Our business is organized into three core and two non-core business segments as follows:
Core business segments
• | Government Services |
• | Technology & Consulting |
• | Engineering & Construction |
Non-core business segments
• | Non-strategic Business |
• | Other |
Our business segments are described below.
Government Services ("GS"). Our GS business segment provides full life-cycle support solutions to defense, space, aviation and other programs and missions for government agencies in the U.S., U.K. and Australia. As program management integrator, KBR covers the full spectrum of defense, space, aviation and other government programs and missions from research and development; through systems engineering; test and evaluation; systems integration; program management; to operations support, maintenance and field logistics. Our recent acquisitions, as described in Note 3 to our consolidated financial statements, have been combined with our existing U.S. operations within this business segment and operate under the single "KBRwyle" brand.
Technology & Consulting ("T&C"). Our T&C business segment combines proprietary KBR technologies, knowledge-based services and our three specialty consulting brands, Granherne, Energo and GVA, under a single customer-facing global business. This segment provides licensed technologies and consulting services to the hydrocarbons value chain, from wellhead to crude refining and through refining and petrochemicals to specialty chemicals production. In addition to sharing many of the same customers, these brands share the approach of early and continuous customer involvement to deliver an optimal solution to meet the customers' objectives through early planning and scope definition, advanced technologies and project life-cycle support.
Engineering & Construction ("E&C"). Our E&C business segment provides comprehensive project and program delivery capability globally. Our key capabilities leverage our operational and technical excellence as a global provider of EPC for onshore oil and gas; LNG/GTL; oil refining; petrochemicals; chemicals; fertilizers; offshore oil and gas (shallow-water, deep-water, subsea); floating solutions (FPU, FPSO, floating liquefied natural gas ("FLNG") & floating storage and regasification unit ("FSRU")); and maintenance services (via the “Brown & Root Industrial Services” brand).
Non-strategic Business. Our Non-strategic Business segment represents the operations or activities that we intend to exit upon completion of existing contracts. This segment also included businesses we exited upon sale to third parties during 2015.
Other. Our Other business segment includes our corporate expenses and general and administrative expenses not allocated to the business segments above and any future activities that do not individually meet the criteria for segment presentation.
Based on the location of projects executed, our operations in countries other than the U.S. accounted for 51%, 57% and 63% of our consolidated revenues during 2016, 2015 and 2014, respectively. See Note 2 to our consolidated financial statements for selected geographic information.
6
We have summarized our revenues by geographic location as a percentage of total revenues below:
Years ended December 31, | ||||||||
2016 | 2015 | 2014 | ||||||
Revenues: | ||||||||
United States | 49 | % | 43 | % | 37 | % | ||
Middle East | 20 | % | 15 | % | 11 | % | ||
Europe | 12 | % | 10 | % | 10 | % | ||
Australia | 9 | % | 16 | % | 22 | % | ||
Canada | 3 | % | 4 | % | 12 | % | ||
Africa | 3 | % | 3 | % | 4 | % | ||
Other | 4 | % | 9 | % | 4 | % | ||
Total | 100 | % | 100 | % | 100 | % | ||
We market substantially all of our project and service offerings through our business segments. The markets we serve are highly competitive and for the most part require substantial resources and highly skilled and experienced technical personnel. A large number of companies are competing in the markets served by our business, including U.S. based companies such as Fluor Corporation, Jacobs Engineering, AECOM, Science Applications International Corporation ("SAIC"), Booz Allen Hamilton and international-based companies such as AMEC Foster Wheeler, Chicago Bridge and Iron, Chiyoda Corporation ("Chiyoda"), JGC Corporation ("JGC"), McDermott International, TechnipFMC and Worley-Parsons. Since the markets for our services are vast and extend across multiple geographic regions, we cannot make a definitive estimate of the total number of our competitors.
Our operations in some countries may be adversely affected by unsettled political conditions, acts of terrorism, civil unrest, war or other armed conflict, expropriation or other governmental actions, inflation and foreign currency exchange controls and fluctuations. We strive to manage or mitigate these risks through a variety of means including contract provisions, contingency planning, insurance schemes, hedging and other risk management activities. See "Item 1A. Risk Factors" contained in Part I of this Annual Report on Form 10-K, "Item 7A. Quantitative and Qualitative Discussion about Market Risk" contained in Part II of this Annual Report on Form 10-K and Note 21 to our consolidated financial statements for information regarding our exposures to foreign currency fluctuations, risk concentration and financial instruments used to manage our risks.
Acquisitions, Dispositions and Other Transactions
Acquisitions
During the first quarter of 2016, we acquired 100% of the outstanding common stock of three subsidiaries of Connell Chemical Industry LLC (through its subsidiary, Chematur Technologies AB): Plinke GmbH ("Plinke"), Weatherly Inc. ("Weatherly") and Chematur Ecoplanning Oy ("Ecoplanning") for net cash consideration of $23 million within our T&C business segment.
During the third quarter of 2016, we acquired 100% of the equity interests of Wyle Inc. ("Wyle") from its shareholders, including Court Square Capital Partners and certain officers of Wyle, pursuant to an agreement and plan of merger for net cash consideration of $623 million, and we acquired 100% of the outstanding common stock of Honeywell Technology Solutions Inc. from Honeywell International Inc. for net cash consideration of $280 million, both within our GS business segment.
See Note 3 to our consolidated financial statements for more information.
Dispositions
During the fourth quarter of 2015, we completed the sale of our Infrastructure Americas business for $18 million in net cash proceeds within our Non-strategic Business segment. See Note 3 to our consolidated financial statements for more information. We also closed on the sale of our U.K. office facility located in Greenford for net cash proceeds of $33 million within our E&C business segment and a U.S. office facility located in Birmingham, Alabama for net cash proceeds of $6 million within our Non-strategic Business segment. See Note 8 to our consolidated financial statements for more information.
7
During the second quarter of 2015, we completed the sale of our Building Group subsidiary for $23 million in net cash proceeds within our Non-strategic Business segment. See Note 3 to our consolidated financial statements for more information.
Other Transactions
During the first quarter of 2016 we executed agreements to establish Affinity Flying Training Services Ltd. ("Affinity"), a joint venture between KBR and Elbit Systems, within our GS business segment.
During the third quarter of 2015, we executed an agreement with Bernhard Capital Partners ("BCP") to establish the Brown & Root Industrial Services joint venture in North America which is accounted for within our E&C business segment. In connection with the formation of the joint venture, we contributed our Industrial Services Americas business and received cash consideration of $48 million and a 50% interest in the joint venture. During the fourth quarter of 2016, we contributed an additional $56 million to the joint venture to acquire a turnaround and specialty welding company.
Also during the third quarter of 2015, we acquired a minority interest in EPIC Piping LLC ("EPIC"), a pipe fabrication business, within our E&C business segment. We contributed the majority of our Canadian pipe fabrication and module assembly business to EPIC, excluding certain completed loss projects, and $19 million in cash.
See Note 11 to our consolidated financial statements for more information.
Joint Ventures and Alliances
We enter into joint ventures and alliances with other industry participants in order to reduce exposure and diversify risk, increase the number of opportunities that can be pursued, capitalize on the strengths of each party and provide greater flexibility in delivering our services based on cost and geographical efficiency. Clients of our E&C business segment frequently require EPC contractors to work in teams given the size and complexity of global projects that may cost billions of dollars to complete. Our significant joint ventures and alliances are described below. All joint venture ownership percentages presented are stated as of December 31, 2016.
Aspire Defence Holdings Limited ("Aspire Defence") is a joint venture currently owned by KBR and two financial investors to upgrade and provide a range of services to the British Army’s garrisons at Aldershot and around the Salisbury Plain in the U.K. We own a 45% interest in Aspire Defence and a 50% interest in each of the two joint ventures that provide the construction and related support services to Aspire Defence. The investments are accounted for within our GS business segment using the equity method of accounting.
Affinity is a joint venture between KBR and Elbit Systems to procure, operate and maintain aircraft, and aircraft-related assets over an 18-year contract period, in support of the U.K. Military Flying Training System ("UKMFTS") project. KBR owns a 50% interest in Affinity. In addition, KBR owns a 50% interest in the two joint ventures, Affinity Capital Works and Affinity Flying Services, which provide procurement, operations and management support services under subcontracts with Affinity. The investments are accounted for within our GS business segment using the equity method of accounting.
We are working with JGC, Hatch Associates and Clough Projects Australia for the design, procurement, fabrication, construction, commissioning and testing of the Gorgon Onshore LNG project located on Barrow Island off the northwest coast of Western Australia. We hold a 30% interest in the joint venture which is reported within our E&C business segment and consolidated for financial accounting purposes.
We are working with JGC and Chiyoda for the design, procurement, fabrication, construction, commissioning and testing of the Ichthys Onshore LNG export facility in Darwin, Australia. The project is being executed through two joint ventures in which we own a 30% equity interest. The investments are accounted for within our E&C business segment using the equity method of accounting.
Mantenimiento Marino de Mexico (“MMM”) is a joint venture formed under a Partners Agreement with Grupo R affiliated entities. The Partners Agreement covers five joint venture entities executing Mexican contracts with Petróleos Mexicanos ("PEMEX"). MMM was set up under Mexican maritime law in order to hold navigation permits to operate in Mexican waters. The scope of the business is to render maintenance, repair and restoration services of offshore oil and gas platforms and provisions of quartering in the territorial waters of Mexico. We own a 50% interest in MMM and in each of the four other joint ventures and account for our investment in these entities within our E&C business segment using the equity method of accounting.
8
Brown & Root Industrial Services is a joint venture with BCP and offers maintenance services, turnarounds and small capital expenditure projects, primarily in North America. We own a 50% interest in this joint venture and account for this investment within our E&C business segment using the equity method of accounting.
We have a minority interest in EPIC, in which BCP also holds a controlling interest. We entered into an agreement with EPIC that gives us access to EPIC's pipe fabrication facilities in Louisiana and Texas. We account for our interest in EPIC within our E&C business segment using the equity method of accounting.
Backlog of Unfulfilled Orders
Backlog is our estimate of the U.S. dollar amount of revenues we expect to realize in the future as a result of performing work on contracts. For projects within our unconsolidated joint ventures, we have included our percentage ownership of the joint venture’s estimated revenues in backlog to provide an indication of future work to be performed. Our backlog was $10.9 billion and $12.3 billion at December 31, 2016 and 2015, respectively. We estimate that, as of December 31, 2016, 38% of our backlog will be recognized as revenues within one year. For additional information regarding backlog see our discussion within “Item 7. Management’s Discussion and Analysis of Financial Condition and Results of Operations” contained in Part II of this Annual Report on Form 10-K.
Contracts
Our contracts are broadly categorized as cost-reimbursable, fixed-price or “hybrid” contracts containing both cost-reimbursable and fixed-price scopes of work. Our fixed-price contracts may include cost escalation and other features that allow for increases in price should certain events occur or conditions change. Change orders on fixed-price contracts are routinely approved as work scopes change resulting in adjustments to our fixed price.
Cost-reimbursable contracts include contracts where the price is variable based upon our actual costs incurred for materials, equipment and for reimbursable labor hours. Profit on cost-reimbursable contracts may be a fixed amount, a mark-up applied to costs incurred or a combination of the two. Cost-reimbursable contracts are generally less risky than fixed-price contracts because the owner/customer retains many of the project risks.
Our GS business segment primarily performs work under cost-reimbursable contracts with the U.S. Department of Defense (“DoD”), U.K. Ministry of Defence ("MoD") and other governmental agencies that are generally subject to applicable statutes and regulations. If the government concludes costs charged to a contract are not reimbursable under the terms of the contract or applicable procurement regulations, these costs are disallowed or, if already reimbursed, we may be required to refund the reimbursed amounts to the customer. Such conditions may also include interest and other financial penalties. If performance issues arise under any of our government contracts, the government retains the right to pursue remedies, which could include termination under any affected contract. Generally, our customers have the contractual right to terminate or reduce the amount of work under our contracts at any time. See “Item 1A. Risk Factors” for more information contained in Part I of this Annual Report on Form 10-K.
Fixed-price contracts, which include unit-rate contracts (essentially a fixed-price contract with the only variable being units of work to be performed), are for a fixed sum to cover all costs and any profit element for a defined scope of work. Fixed-price contracts entail significant risk to us because they require us to predetermine the work to be performed, the project execution schedule and all the costs associated with the work. Although fixed-price contracts involve greater risk than cost-reimbursable contracts, they also are potentially more profitable since the owner/customer pays a premium to transfer project risks to us.
Also within our GS business segment, we participate in Private Finance Initiatives (“PFIs”) contracts, such as the Aspire Defense and UKMFTS projects. PFIs are long-term contracts that outsource the responsibility for the construction, procurement, financing, operation and maintenance of government-owned assets to the private sector. The PFI projects in which KBR participates are located in the U.K. and Ireland with contractual terms ranging from 15 to 35 years and involve the provision of services to various types of assets ranging from acquisition and maintenance of major military equipment and housing to transportation infrastructure. Under most of these PFI arrangements, the primary deliverables of the contracting entity are the initial provision of the asset to the customer and the subsequent provision of operations and maintenance services related to the asset once it is ready for its intended use through the remaining life of the arrangement. The amount of reimbursement from the customer to the contracting entity is negotiated on each contract and varies depending on the specific terms for each PFI.
9
Significant Customers
We provide services to a diverse customer base, including:
• | domestic and foreign governments; |
• | international oil companies and national oil companies; |
• | independent refiners; |
• | petrochemical and fertilizer producers; |
• | developers; and |
• | manufacturers. |
We generated significant revenues from transactions with the U.S. government within our GS business segment and with Chevron Corporation ("Chevron") within our E&C business segment, primarily from a major LNG project in Australia which is nearing completion. No other customers represented 10% or more of consolidated revenues in any of the periods presented. The information in the following table has summarized data related to our revenues from the U.S. government and Chevron.
Revenues and percent of consolidated revenues attributable to major customers by year: | ||||||||||||||||||||
Years ended December 31, | ||||||||||||||||||||
Dollars in millions, except percentage amounts | 2016 | 2015 | 2014 | |||||||||||||||||
U.S. government | $ | 1,090 | 26 | % | $ | 378 | 7 | % | $ | 321 | 5 | % | ||||||||
Chevron | $ | 105 | 2 | % | $ | 523 | 10 | % | $ | 1,069 | 17 | % | ||||||||
Information relating to our customer concentration is described in “Item 1A. Risk Factors” contained in Part II of this Annual Report on Form 10-K. Also, see further explanations in "Item 7. Management’s Discussion and Analysis of Financial Condition and Results of Operations" contained in Part II of this Annual Report on Form 10-K.
Raw Materials and Suppliers
Equipment and materials essential to our business are obtained from a variety of sources throughout the world. The principal equipment and materials we use in our business are subject to availability and price fluctuations due to customer demand, producer capacity and market conditions. We monitor the availability and price of equipment and materials on a regular basis. Our procurement department seeks to leverage our size and buying power to ensure that we have access to key equipment and materials at the best possible prices and delivery schedules. While we do not currently foresee any significant lack of availability of equipment and materials in the near term, the availability of these items may vary significantly from year to year and any prolonged unavailability or significant price increases for equipment and materials necessary to our projects and services could have a material adverse effect on our business. See “Item 1A. Risk Factors” contained in Part I of this Annual Report on Form 10-Kfor more information.
Intellectual Property
We have developed, acquired or otherwise have the right to license leading technologies, including technologies held under license from third parties, used for the production of a variety of petrochemicals and chemicals and in the areas of olefins, refining, fertilizers, coal gasification, semi-submersibles and specialty chemicals. We also license a variety of technologies for the transformation of raw materials into commodity chemicals such as phenol used in the production of consumer end products. In addition, we are a licensor of ammonia process technologies used in the conversion of natural gas to ammonia. We also offer technologies for crystallization and evaporation, as well as concentration and purification of strong inorganic acids. We believe our technology portfolio and experience in the commercial application of these technologies and related know-how differentiates us, enhances our margins and encourages customers to utilize our broad range of EPC and construction services.
Our rights to make use of technologies licensed to us are governed by written agreements of varying durations, including some with fixed terms that are subject to renewal based on mutual agreement. Generally, each agreement may be further extended and we have historically been able to renew existing agreements before they expire. We expect these and other similar agreements to be extended so long as it is mutually advantageous to both parties at the time of renewal. However, the majority of our license fees tend to result in a one-time payment per agreement rather than ongoing royalty-type payments. For technologies we own, we protect our rights, know-how and trade secrets through patents and confidentiality agreements. Our expenditures for research and development activities were immaterial in each of the past three fiscal years.
10
Seasonality
Our operations are not generally affected by seasonality. However, weather and natural phenomena can temporarily affect the performance of our services.
Employees
As of December 31, 2016, we had approximately 27,500 employees world-wide, of which approximately 10% were subject to collective bargaining agreements. Additionally, our Brown & Root Industrial Services joint venture employs approximately 9,000 employees. Based upon the geographic diversification of our employees, we believe any risk of loss from employee strikes or other collective actions would not be material to the conduct of our operations taken as a whole.
Worker Health and Safety
We are subject to numerous worker health and safety laws and regulations and value achieving a strong track record of health and safety are fundamental to our culture. In the U.S., these laws and regulations include the Federal Occupational Safety and Health Act and comparable state legislation, the Mine Safety and Health Administration laws, and safety requirements of the Departments of State, Defense, Energy and Transportation of the U.S. government. We are also subject to similar requirements in other countries in which we have extensive operations, including the U.K. where we are subject to the various regulations enacted by the Health and Safety Act of 1974.
These laws and regulations are frequently changing and it is impossible to predict the effect of such laws and regulations on us in the future. In 2015, we embarked on a global Zero Harm initiative in order to reinforce health, safety, security and environment as key components of the KBR culture and lifestyle. This initiative incorporates three dynamic components: "Zero Harm", "24/7" and "Courage to Care" which empower individuals to take responsibility for their health and safety, as well as that of their colleagues. However, we cannot guarantee that our efforts will always be successful and from time to time we may experience accidents or unsafe work conditions may arise. Our project sites often put our employees and others in close proximity with mechanized equipment, moving vehicles, chemical and manufacturing processes, and highly regulated materials. We actively seek to maintain a safe, healthy and environmentally friendly work place for all of our employees and those who work with us. However, we provide some of our services in high-risk locations and may incur substantial costs to maintain the safety and security of our personnel in these locations.
Environmental Regulation
Our business involves the planning, design, program management, construction and construction management, and operations and maintenance at various project sites, including oil field and related energy infrastructure construction services in and around sensitive environmental areas, such as rivers, lakes and wetlands. Our operations may require us to manage, handle, remove, treat, transport and dispose of toxic or hazardous substances, which are subject to stringent and complex laws relating to the protection of the environment and prevention of pollution.
Significant fines, penalties and other sanctions may be imposed for non-compliance with environmental and worker health and safety laws and regulations, and some laws provide for joint and several strict liabilities for remediation of releases of hazardous substances, rendering a person liable for environmental damage, without regard to negligence or fault on the part of such person. These laws and regulations may expose us to liability arising out of the conduct of operations or conditions caused by others, or for our acts that were in compliance with all applicable laws at the time these acts were performed. For example, there are a number of governmental laws that strictly regulate the handling, removal, treatment, transportation and disposal of toxic and hazardous substances, such as the Comprehensive Environmental Response Compensation and Liability Act of 1980, and comparable national and state laws, that impose strict, joint and several liabilities for the entire cost of cleanup, without regard to whether a company knew of or caused the release of hazardous substances. In addition, some environmental regulations can impose liability for the entire clean-up upon owners, operators, generators, transporters and other persons arranging for the treatment or disposal of such hazardous substances costs related to contaminated facilities or project sites. Other environmental laws applicable to our operations and the operations of our customers include affecting us include, but are not limited to, the Resource Conservation and Recovery Act, the National Environmental Policy Act, the Clean Air Act, the Clean Water Act, the Occupational Safety and the Toxic Substances Control as well as other comparable foreign and state laws. Liabilities related to environmental contamination or human exposure to hazardous substances, comparable foreign and state laws or a failure to comply with applicable regulations could result in substantial costs to us, including cleanup costs, fines and civil or criminal sanctions, third-party claims for property damage or personal injury, or cessation of remediation activities.
11
Additional information relating to environmental regulations is described in "Item 1A. Risk Factors” contained in Part I of this Annual Report on Form 10-K and in Note 16 to our consolidated financial statements, and the information discussed therein is incorporated by reference into this Part I, Item 1.
Compliance
Conducting our business with ethics and integrity is a key priority for KBR. We are subject to numerous compliance-related laws and regulations, including the U.S. Foreign Corrupt Practices Act (the "FCPA"), the U.K. Bribery Act, other applicable anti-bribery legislation and laws and regulations regarding trade and exports. We are also governed by our own Code of Business Conduct and other compliance-related corporate policies and procedures that mandate compliance with these laws. Our Code of Business Conduct is a guide for every employee in applying legal and ethical practices to our everyday work. The Code of Business Conduct describes not only our standards of integrity but also some of the specific principles and areas of the law that are most likely to affect our business. We regularly train our employees regarding our Code of Business Conduct and other specific areas including anti-bribery compliance and international trade compliance.
The services we provide to the U.S. federal government are subject to the Federal Acquisition Regulation ("FAR"), the Truth in Negotiations Act, Cost Accounting Standards ("CAS"), the Services Contract Act and DoD security regulations, and many other laws and regulations. These laws and regulations affect how we transact business with our clients and, in some instances, impose additional costs on our business operations.
Website Access
Our Annual Report on Form 10-K, Quarterly Reports on Form 10-Q, Current Reports on Form 8-K and amendments to those reports filed or furnished pursuant to Section 13(a) or 15(d) of the Securities Exchange Act of 1934 are made available free of charge on our website at www.kbr.com as soon as reasonably practicable after we have electronically filed the material with, or furnished it to, the U.S. Securities and Exchange Commission (the "SEC"). The public may read and copy any materials we have filed with the SEC at the SEC’s Public Reference Room at 100 F Street, NE, Washington, DC 20549. Information on the operation of the Public Reference Room may be obtained by calling the SEC at 1-800-SEC-0330. The SEC maintains a website that contains our reports, proxy and information statements and our other SEC filings. The address of that website is www.sec.gov. We have posted on our external website our Code of Business Conduct, which applies to all of our employees and Directors and serves as a code of ethics for our principal executive officer, principal financial officer, principal accounting officer and other persons performing similar functions.
Item 1A. Risk Factors
Risks Related to Operations of our Business
Our results of operations depend on the award of new contracts and the timing of the performance of these contracts.
A portion of our revenues is directly or indirectly derived from new contract awards. Reductions in the number and amounts of new awards, delays in the timing of the awards or potential cancellations of such prospects as a result of economic conditions, material and equipment pricing and availability or other factors could adversely impact our long-term projected results. It is particularly difficult to predict whether or when we will receive large-scale international and domestic projects as these contracts frequently involve a lengthy and complex bidding and selection process, which is affected by a number of factors, such as market conditions as well as governmental and environmental approvals. Since a portion of our revenues is generated from such projects, our results of operations and cash flows can fluctuate significantly from quarter to quarter depending on the timing of our contract awards and the commencement or progress of work under awarded contracts. In addition, many of these contracts are subject to financing contingencies and, as a result, we are subject to the risk that the customer will not be able to secure the necessary financing for the project to proceed.
The uncertainty of our contract award timing can also present difficulties in matching workforce size with contract needs. In some cases, we maintain and bear the cost of a ready workforce that is larger than necessary under existing contracts in anticipation of future workforce needs for expected contract awards. If an expected contract award is delayed or not received, we may incur additional costs resulting from reductions in staff or redundancy of facilities which could have a material adverse effect on our business, financial condition and results of operations.
12
If we are unable to attract and retain a sufficient number of affordable trained engineers, craft labor, and other skilled workers, our ability to pursue projects may be adversely affected and our costs may increase.
Our rate of growth and the success of our business depend upon our ability to attract, develop and retain a sufficient number of affordable trained engineers, craft labor and other skilled workers either through direct hire or acquisition of other firms employing such professionals. The market for these professionals is competitive. If we are unable to attract and retain a sufficient number of skilled personnel, our ability to pursue projects may be adversely affected, the costs of executing our existing and future projects may increase and our financial performance may decline.
Dependence on craft labor, subcontractors and equipment manufacturers could adversely affect our profits.
We rely on local craft labor, third-party subcontractors as well as third party equipment manufacturers to complete many of our projects. To the extent that we cannot engage qualified craft labor, subcontractors or acquire equipment or materials in the amounts and at the costs originally estimated, our ability to complete a project in a timely fashion or at a profit may be impaired. If the amount we are required to pay for these goods and services exceeds the amount we have estimated in bidding for fixed-price contracts, we could experience losses in the performance of these contracts. In addition, if a subcontractor or a manufacturer is unable to deliver its services, equipment or materials according to the negotiated terms for any reason including, but not limited to, the deterioration of its financial condition, we may be required to purchase the services, equipment or materials from another source at a higher price. This may reduce the profit we expect to realize or result in a loss on a project for which the services, equipment or materials were needed.
Some of our U.S. government work requires KBR and certain of its employees to qualify for and retain a government-issued security clearance.
We currently hold a U.S. government-issued facility security clearance and certain of our employees have qualified for and hold U.S. government-issued personal security clearances which are necessary in order to qualify for and ultimately perform certain of our U.S. government contracts. Obtaining and maintaining security clearances for employees involves lengthy processes, and it is difficult to identify, recruit and retain employees who already hold security clearances. If our employees are unable to obtain or retain security clearances or if our employees who hold security clearances terminate employment with us and we are unable to find replacements with equivalent security clearances, we may be unable to perform our obligations to customers whose work requires cleared employees, or such customers could terminate their contracts or decide not to renew them upon their expiration. Our facility security clearance could be marked as "invalid" for several reasons including unapproved foreign ownership, control or influence, mishandling of classified materials, or failure to properly report required activities. An inability to obtain or retain our facility security clearances or engage employees with the required security clearances for a particular contract could disqualify us from bidding for and winning new contracts with security requirements as well as termination of any existing contracts requiring such clearances.
Our use of the percentage-of-completion method of revenue recognition could result in a reduction or reversal of previously recorded revenues and profits.
A portion of our revenues and profits are measured and recognized using the percentage-of-completion method of revenue recognition. Our use of this accounting method results in recognition of revenues and profits over the life of a contract, based generally on the proportion of costs incurred to date to total costs expected to be incurred for the entire project, the ratio of hours performed to date to our estimate of total expected hours at completion, or the physical progress on the project. The effects of revisions to estimated revenues and estimated costs are recorded when the amounts are known or can be reasonably estimated. Such revisions could occur in any period and their effects could be material. The uncertainties inherent in estimating the progress towards completion of long-term engineering, program management, construction management or construction contracts make it possible for actual costs to vary materially from estimates, including reductions or reversals of previously recorded revenues and profits.
13
We conduct a portion of our engineering and construction operations through joint ventures and partnerships exposing us to risks and uncertainties, many of which are outside of our control.
We conduct a portion of our EPC operations through large project-specific joint ventures where control may be shared with unaffiliated third parties. As with any joint venture arrangement, differences in views among the joint venture participants may result in delayed decisions or in failures to agree on major issues. We also cannot control the actions of our joint venture partners, including any nonperformance, default or bankruptcy of our joint venture partners, and we typically share liabilities on a joint and several basis with our joint venture partners under these arrangements. If our partners do not meet their contractual obligations, the joint venture may be unable to adequately perform and deliver its contracted services, requiring us to make additional investments or perform additional services to ensure the adequate performance and delivery of services to our customer. We could be liable for both our obligations and those of our partners, which may result in reduced profits or, in some cases, significant losses on the project. Additionally, these factors could have a material adverse effect on the business operations of the joint venture and, in turn, our business operations and reputation.
Operating through joint ventures in which we have a minority interest could result in us having limited control over many decisions made with respect to projects and internal controls relating to projects. These joint ventures may not be subject to the same requirements regarding internal controls and internal control reporting that we follow. As a result, internal control issues may arise, which could have a material adverse effect on our financial condition and results of operations. Additionally, in order to establish or preserve relationships with our joint venture partners, we may agree to risks and contributions of resources that are proportionately greater than the returns we could receive, which could reduce our income and returns on these investments compared to what we may have received if the risks and resources we contributed were always proportionate to our returns.
The nature of our contracts, particularly those that are fixed-price, subjects us to risks associated with cost over-runs, operating cost inflation and potential claims for liquidated damages.
We conduct our business under various types of contracts where costs must be estimated in advance of our performance. Approximately 16% of the value of our backlog is attributable to fixed-price contracts where we bear a significant portion of the risk of cost over-runs. These types of contracts are priced, in part, on cost and scheduling estimates that are based on assumptions including prices and availability of experienced labor, equipment and materials as well as productivity, performance and future economic conditions. If these estimates prove inaccurate, if there are errors or ambiguities as to contract specifications or if circumstances change due to, among other things, unanticipated technical problems, poor project execution, difficulties in obtaining permits or approvals, changes in local laws or labor conditions, weather delays, changes in the costs of equipment and materials or our suppliers’ or subcontractors’ inability to perform, then cost overruns may occur. We may not be able to obtain compensation for additional work performed or expenses incurred. Additionally, we may be required to pay liquidated damages upon our failure to meet schedule or performance requirements of our contracts. Our failure to accurately estimate the resources and time required for fixed-price contracts or our failure to complete our contractual obligations within the time frame and costs committed could result in reduced profits or, in certain cases, a loss for that contract. If the contract is significant, or we encounter issues that impact multiple contracts, cost overruns could have a material adverse effect on our business, financial condition and results of operations.
The nature of our engineering and construction business exposes us to potential liability claims and contract disputes which may exceed or be excluded from existing insurance coverage.
We engage in engineering and construction activities for large facilities where design, construction or systems failures can result in substantial injury or damage to employees or other third parties or delays in completion or commencement of commercial operations, exposing us to legal proceedings, investigations and disputes. The nature of our business results in clients, subcontractors and vendors occasionally presenting claims against us for recovery of costs they incurred in excess of what they expected to incur or for which they believe they are not contractually liable. When it is determined that we have liability, we may not be covered by insurance or, if covered, the dollar amount of these liabilities may exceed our policy limits. Our professional liability coverage is on a “claims-made” basis covering only claims actually made during the policy period currently in effect. In addition, even where insurance is maintained for such exposures, the policies have deductibles, which result in our assumption of exposure for a layer of coverage with respect to any such claims. Any liability not covered by our insurance, in excess of our insurance limits or if covered by insurance but subject to a high deductible could result in a significant loss for us, which may reduce our profits and cash available for operations.
14
We occasionally bring claims against project owners for additional costs exceeding the contract price or for amounts not included in the original contract price. These types of claims occur due to matters such as owner-caused delays or changes from the initial project scope which may result in additional direct and indirect costs. Often these claims can be the subject of lengthy arbitration or litigation proceedings, and it is difficult to accurately predict when these claims will be fully resolved. When these types of events occur and unresolved claims are pending, we may invest significant working capital in projects to cover cost overruns pending the resolution of the relevant claims. A failure to promptly recover on these types of claims could have a material adverse impact on our liquidity and financial results.
Our U.S. government contract work is regularly reviewed and audited by our customer, U.S. government auditors and others, and these reviews can lead to withholding or delay of payments to us, non-receipt of award fees, legal actions, fines, penalties and liabilities and other remedies against us.
U.S. government contracts are subject to specific regulations such as the FAR, the Truth in Negotiations Act, CAS, the Service Contract Act and DoD security regulations. Failure to comply with any of these regulations, requirements or statutes may result in contract price adjustments, financial penalties or contract termination. Our U.S. government contracts are subject to audits, cost reviews and investigations by U.S. government contracting oversight agencies such as the Defense Contract Audit Agency (the "DCAA"). The DCAA reviews the adequacy of, and our compliance with, our internal control systems and policies, including our labor, billing, accounting, purchasing, property, estimating, compensation and management information systems. The DCAA has the authority to conduct audits and reviews to determine if KBR is complying with the requirements under the FAR and CAS, pertaining to the allocation, period assignment and allowability of costs assigned to U.S. government contracts. The DCAA presents its report findings to the Defense Contract Management Agency ("DCMA"). Should the DCMA determine that we have not complied with the terms of our contract and applicable statutes and regulations, payments to us may be disallowed, which could result in adjustments to previously reported revenues and refunding of previously collected cash proceeds. Additionally, we may be subject to qui tam litigation brought by private individuals on behalf of the U.S. government under the Federal False Claims Act, which could include claims for treble damages.
Given the demands of working for the U.S. government, we may have disagreements or experience performance issues. When performance issues arise under any of our U.S. government contracts, the U.S. government retains the right to pursue remedies, which could include termination under any affected contract. If any contract were so terminated, our ability to secure future contracts could be adversely affected. Other remedies that could be sought by our government customers for any improper activities or performance issues include sanctions such as forfeiture of profits, suspension of payments, fines and suspensions or debarment from doing business with the government. Further, the negative publicity that could arise from disagreements with our customers or sanctions as a result thereof could have an adverse effect on our reputation in the industry, reduce our ability to compete for new contracts and may also have a material adverse effect on our business, financial condition, results of operations and cash flows.
International and political events may adversely affect our operations.
A portion of our revenues is derived from foreign operations, which exposes us to risks inherent in doing business in each of the countries where we transact business. The occurrence of any of the risks described below could have a material adverse effect on our business operations and financial performance. With respect to any particular country, these risks may include, but not be limited to:
• | expropriation and nationalization of our assets in that country; |
• | political and economic instability; |
• | civil unrest, acts of terrorism, war or other armed conflict; |
• | currency fluctuations, devaluations and conversion restrictions; |
• | confiscatory taxation or other adverse tax policies; or |
• | governmental activities or judicial actions that limit or disrupt markets, restrict payments, limit the movement of funds, result in the deprivation of contract rights or result in the inability for us to obtain or retain licenses required for operation. |
Due to the unsettled political conditions in many oil-producing countries and other countries where we provide governmental logistical support, our financial performance is subject to the adverse consequences of war, the effects of terrorism, civil unrest, strikes, currency controls and governmental actions. Our operations are conducted in areas that have significant political risk. In addition, military action or unrest in such locations could restrict the supply of oil and gas, disrupt our operations in such locations and elsewhere and increase our costs related to security worldwide.
15
The Referendum of the United Kingdom's Membership of the European Union could adversely affect our revenues and results of operations.
The June 23, 2016 referendum by the British voters to exit the European Union ("Brexit") adversely impacted global markets, including currencies, and resulted in the weakening of the British pound against other currencies. A weaker British pound compared to the U.S. dollar during a reporting period causes local currency results of our U.K. operations and contracts, denominated in the British pound sterling, to be translated into fewer U.S. dollars. This mainly impacts the U.K. portion of our GS business segment where both revenues and costs tend to be denominated in British pounds. Volatility in exchange rates may continue as the U.K. negotiates its exit from the European Union. In the longer term, any impact from Brexit on our international operations will depend, in part, on the outcome of tariff, trade, regulatory and other negotiations and could adversely affect our revenues and results of operations.
Changes in our effective tax rate and tax positions may vary.
We are subject to income taxes in the U.S. and numerous foreign jurisdictions, many of which are developing countries. Significant judgment is required in determining our worldwide provision for income taxes and a change in tax laws, treaties or regulations, or their interpretation, in any country in which we operate could result in a higher tax rate on our earnings, which could have a material impact on our earnings and cash flows from operations. In the ordinary course of our business, there are many transactions and calculations where the ultimate tax determination is uncertain. We are audited by various U.S. and foreign tax authorities in the ordinary course of business, and our tax estimates and tax positions could be materially affected by many factors including the final outcome of tax audits and related litigation, the introduction of new tax accounting standards, legislation, regulations and related interpretations, our global mix of earnings, the realizability of deferred tax assets and changes in uncertain tax positions. A significant increase in our tax rate could have a material adverse effect on our profitability and liquidity.
We work in international locations where there are high security risks, which could result in harm to our employees and contractors or substantial costs.
Some of our services are performed in high-risk locations, including but not limited to, Iraq, Afghanistan, certain parts of Africa and the Middle East, where the country or surrounding area is suffering from political, social or economic issues, war or civil unrest. In those locations where we have employees or operations, we have and may continue to incur substantial costs to maintain the safety of our personnel. Despite these precautions, we have suffered the loss of employees and contractors that has resulted in claims and litigation. In the future, the safety of our personnel in these and other locations may continue to be at risk, exposing us to the potential loss of additional employees and contractors that could lead to future claims and litigation.
We ship a significant amount of cargo using seagoing vessels exposing us to certain maritime risks.
We execute different projects in remote locations around the world and procure equipment and materials on a global basis. Depending on the type of contract, location, nature of the work and the sourcing of equipment and materials, we may charter seagoing vessels under time and bareboat charter arrangements and assume certain risks typical of those agreements. Such risks may include damage to the ship, liability for cargo and liability which charterers and vessel operators have to third parties “at law.” In addition, we ship a significant amount of cargo and are subject to hazards of the shipping and transportation industry.
Demand for our services provided under government contracts are directly affected by spending by our customers.
We derive a portion of our revenues from contracts with agencies and departments of the U.S., U.K. and Australia governments, which is directly affected by changes in government spending and availability of adequate funding. Additionally, government regulations generally include the right for government agencies to modify, delay, curtail, renegotiate or terminate contracts at their convenience any time prior to their completion. As a significant government contractor, our financial performance is affected by the allocation and prioritization of government spending. Factors that could affect current and future government spending include:
• | policy or spending changes implemented by the current administration, defense department or other government agencies; |
• | changes, delays or cancellations of government programs or requirements; |
• | adoption of new laws or regulations that affect companies providing services to the governments; |
• | curtailment of the governments’ outsourcing of services to private contractors; or |
• | level of political instability due to war, conflict or natural disasters. |
16
We face uncertainty with respect to our government contracts due to the fiscal and economic and budgetary challenges facing our customers. Potential contract cancellations, modifications or terminations may arise from resolution of these issues and could cause our revenues, profits and cash flows to be lower than our current projections. The loss of work we perform for governments or decreases in governmental spending and outsourcing could have a material adverse effect on our business, results of operations and cash flows.
Crude oil and natural gas prices are extremely volatile. A decline in the price of oil and natural gas could adversely affect our results of operations.
Current global economic conditions, including oil and gas price volatility, have reduced and continue to negatively impact our customers' willingness and ability to fund their projects. These conditions reduce customer's revenues and earnings and make it difficult for our customers to accurately forecast and plan future business trends and activities, thereby causing our clients to slow or curtail spending on our services, or seek contract terms more favorable to them.
Our revenues are dependent on capital expenditures for LNG, refining and distribution facilities and other investments by oil and gas companies. The demand for these facilities and the ability of our customers to obtain capital on attractive terms to finance these projects is also substantially dependent upon crude oil and natural gas prices. These commodities are subject to large fluctuations in response to changes in supply and demand, market uncertainty and a variety of other factors that are beyond our control. Demand for the services we provide could significantly decrease in the event of a sustained reduction in demand for crude oil or natural gas, or a decline in oil and gas prices. Oil and gas companies (our customers) have reduced or deferred their major expenditures due to declines in crude oil and natural gas prices and other market uncertainties.
Demand for our services depends on demand and capital spending by customers in their target markets, many of which are cyclical in nature.
Demand for many of our services in our commodity-based markets depends on capital spending by oil and natural gas companies, including national and international oil companies, and by industrial companies, which is directly affected by trends in oil, natural gas and commodities prices. Market prices for oil, natural gas and commodities have significantly declined in recent years reducing the revenues and earnings of our customers. As a result, several leading international and national oil companies have reduced capital expenditures. Capital expenditures for refining and distribution facilities by large oil and gas companies have a significant impact on the activity levels of our businesses. Demand for LNG facilities for which we provide services could decrease in the event of a sustained reduction in the price and demand for crude oil or natural gas. Perceptions of longer-term lower oil and natural gas prices by oil and gas companies or longer-term higher material and contractor prices impacting facility costs can similarly reduce or defer major expenditures given the long-term nature of many large-scale projects. Prices of oil, natural gas and commodities are subject to large fluctuations in response to relatively minor changes in supply and demand, market uncertainty and a variety of other factors that are beyond our control. Factors affecting the prices of oil, natural gas and other commodities include, but are not limited to:
• | worldwide or regional political, social or civil unrest, military action and economic conditions; |
• | the level of demand for oil, natural gas, and industrial services; |
• | governmental regulations or policies, including the policies of governments regarding the use of energy and the exploration for and production and development of their oil and natural gas reserves; |
• | a reduction in energy demand as a result of energy taxation or a change in consumer spending patterns; |
• | global economic growth or decline; |
• | the global level of oil and natural gas production; |
• | global weather conditions and natural disasters; |
• | oil refining capacity; |
• | shifts in end-customer preferences toward fuel efficiency and the use of natural gas; |
• | potential acceleration of the development and expanded use of alternative fuels; |
• | environmental regulation, including limitations on fossil fuel consumption based on concerns about its relationship to climate change; and |
• | reduction in demand for the commodity-based markets in which we operate. |
17
Our backlog of unfilled orders is subject to unexpected adjustments and cancellations and, therefore, may not be a reliable indicator of our future revenues or earnings.
As of December 31, 2016, our backlog was approximately $10.9 billion. We cannot guarantee that the revenues projected in our backlog will be realized or that the projects will be profitable. Many of our contracts are subject to cancellation, termination or suspension at the discretion of the customer. From time to time, changes in project scope may occur with respect to contracts reflected in our backlog and could reduce the dollar amount of our backlog and the timing of the revenues and profits that we actually earn. Projects may remain in our backlog for an extended period of time because of the nature of the project and the timing of the particular services or equipment required by the project. Delays, suspensions, cancellations, payment defaults, scope changes and poor project execution could materially reduce or eliminate profits that we actually realize from projects in backlog. We cannot predict the impact that future economic conditions may have on our backlog, which could include a diminished ability to replace backlog once projects are completed or could result in the termination, modification or suspension of projects currently in our backlog. Such developments could have a material adverse effect on our financial condition, results of operations and cash flows.
Intense competition could reduce our market share and profits.
We serve markets that are global and highly competitive and in which a large number of multinational companies compete. These highly competitive markets require substantial resources and capital investment in equipment, technology and skilled personnel. Our projects are frequently awarded through a competitive bidding process, which is standard in the industries we compete in. We are constantly competing for project awards based on pricing, schedule and the breadth and technical sophistication of our services. Any increase in competition or reduction in our competitive capabilities could have a material adverse effect on the margins we generate from our projects as well as our ability to maintain or increase market share.
The U.S. government awards its contracts through a rigorous competitive process and our efforts to obtain future contracts from the U.S. government may be unsuccessful.
The U.S. government conducts a rigorous competitive process for awarding most contracts. In the services arena, the U.S. government uses multiple contracting approaches. Historically, omnibus contract vehicles have been used for work that is done on a contingency or as-needed basis. In more predictable “sustainment” environments, contracts may include both fixed-price and cost-reimbursable elements. The U.S. government has also favored multiple award task order contracts in which several contractors are selected as eligible bidders for future work. Such processes require successful contractors to continually anticipate customer requirements and develop rapid-response bid and proposal teams as well as have supplier relationships and delivery systems in place to react to emerging needs. We face rigorous competition and pricing pressures for any additional contract awards from the U.S. government, and we may be required to qualify or continue to qualify under the various multiple award task order contract criteria. It may be more difficult for us to win future awards from the U.S. government and we may have other contractors sharing in any U.S. government awards that we win. In addition, negative publicity regarding findings stemming from audits by the DCAA, congressional investigations and litigation may adversely affect our ability to obtain future awards.
A portion of our revenues is generated by large, recurring business from certain significant customers. A loss, cancellation or delay in projects by our significant customers in the future could negatively affect our revenues.
While we provide services to a diverse customer base, including international and national oil and gas companies, independent refiners, petrochemical producers, fertilizer producers and domestic and foreign governments, a considerable percentage of our revenues is generated from transactions with certain significant customers. Revenues from the U.S. government represented 26% of our total consolidated revenues for the year ended December 31, 2016. The loss of our significant customers, or the cancellation or delay in their projects, could adversely affect our revenues and results of operations.
18
If we are unable to enforce our intellectual property rights, or if our intellectual property rights become obsolete, our competitive position could be adversely impacted.
We utilize a variety of intellectual property rights in providing services to our customers. We view our portfolio of process and design technologies as one of our competitive strengths and we use it as part of our efforts to differentiate our service offerings. We may not be able to successfully preserve these intellectual property rights in the future, and these rights could be invalidated, circumvented, challenged or infringed upon. In addition, the laws of some foreign countries in which our services may be sold do not protect intellectual property rights to the same extent as the laws of the U.S. Since we license technologies from third parties, there is a risk that our relationships with licensors may terminate, expire or be interrupted or harmed. In some, but not all cases, we may be able to obtain the necessary intellectual property rights from alternative sources. If we are unable to protect and maintain our intellectual property rights, or if there are any successful intellectual property challenges or infringement proceedings against us, our ability to differentiate our service offerings could diminish. In addition, if our intellectual property rights or work processes become obsolete, we may not be able to differentiate our service offerings and some of our competitors may be able to offer more attractive services to our customers. As a result, our business and financial performance could be materially and adversely affected.
Our current business strategy includes the possibility of acquisitions, which may present certain risks and uncertainties.
We may seek business acquisitions as a means of broadening our offerings and capturing additional market opportunities by our business segments and we may be exposed to certain additional risks resulting from these activities. These risks include, but are not limited to the following:
• | valuation methodologies may not accurately capture the value proposition; |
• | future completed acquisitions may not be integrated within our operations with the efficiency and effectiveness initially expected, resulting in a potentially significant detriment to the associated product/service line financial results and posing additional risks to our operations as a whole; |
• | we may have difficulty managing our growth from acquisition activities; |
• | key personnel within an acquired organization may resign from their related positions resulting in a significant loss to our strategic and operational efficiency associated with the acquired company; |
• | the effectiveness of our daily operations may be reduced by the redirection of employees and other resources to acquisition activities; |
• | we may assume liabilities of an acquired business (e.g. litigation, tax liabilities, contingent liabilities, environmental issues), including liabilities that were unknown at the time of the acquisition, that pose future risks to our working capital needs, cash flows and the profitability of related operations; |
• | we may assume unprofitable projects that pose future risks to our working capital needs, cash flows and the profitability of related operations; |
• | business acquisitions may include substantial transactional costs to complete the acquisition that exceed the estimated financial and operational benefits; or |
• | future acquisitions may require us to obtain additional equity or debt financing, which may not be available on attractive terms, if at all. Moreover, to the extent an acquisition results in additional goodwill, it will reduce our tangible net worth, which might have an adverse effect on our credit capacity. |
We rely on information technology ("IT") systems to conduct our business, and disruption, failure or security breaches of these systems could adversely affect our business and results of operations.
We rely heavily on IT systems in order to achieve our business objectives. We also rely upon industry accepted security measures and technology to secure confidential and proprietary information maintained on our IT systems. However, our portfolio of hardware and software products, solutions and services and information contained within our enterprise IT systems may be vulnerable to damage or disruption caused by circumstances beyond our control such as catastrophic events, cyber-attacks, other malicious activities from unauthorized third parties, power outages, natural disasters, computer system or network failures, or computer viruses. The failure of our IT systems to perform as anticipated for any reason could disrupt our business and result in decreased performance, significant remediation costs, transaction errors, loss of data, processing inefficiencies, downtime, litigation and the loss of suppliers or customers. We have experienced security threats in the past, none of which we considered to be significant to our business or results of operations, but future significant disruptions or failures could have a material adverse effect on our business operations, financial performance and financial condition.
19
An impairment of all or part of our goodwill or our intangible assets could have a material adverse impact on our net earnings and net worth.
As of December 31, 2016, we had $959 million of goodwill and $248 million of intangible assets recorded on our consolidated balance sheets. Goodwill represents the excess of cost over the fair market value of net assets acquired in business combinations. If our market capitalization drops significantly below the amount of net equity recorded on our balance sheets, it might indicate a decline in our fair value and would require us to further evaluate whether our goodwill has been impaired. We perform an annual and an interim analysis, as appropriate, of our goodwill to determine if it has become impaired. The analysis requires us to make assumptions in estimates of fair value of our reporting units. If actual results are significantly different from the estimates, we may be required to write down the impaired portion of goodwill. An impairment of all or a part of our goodwill or intangible assets could have a material adverse effect on our net earnings and net worth.
Our reorganization activities may not achieve the results we expect, which could materially and adversely affect our results of operations and financial condition.
In 2014, we announced and implemented reorganization activities, which included the decision to no longer bid on certain types of work and exit certain non-strategic businesses. This decision resulted in a significant reduction in our forecasts of future cash flows for three of our previous reporting units and triggered a goodwill impairment test. There can be no assurance that our reorganization activities will produce the long-term benefits we anticipate.
Risks Related to Governmental Regulations and Law
We could be adversely impacted if we fail to comply with international export and domestic laws, which are the subject of rigorous enforcement by the U.S. government.
To the extent that we export products, technical data and services outside of the U.S., we are subject to laws and regulations governing trade and exports, including, but not limited to, the International Traffic in Arms Regulations, the Export Administration Regulations and trade sanctions against embargoed countries, which are administered by the Office of Foreign Asset Control within the Department of the Treasury. A failure to comply with these laws and regulations could result in civil or criminal sanctions, including the imposition of fines upon us as well as the denial of export privileges and debarment from participation in U.S. government contracts. U.S. government contract violations could result in the imposition of civil and criminal penalties or sanctions, contract termination, forfeiture of profit or suspension of payment, any of which could make us lose our status as an eligible U.S. government contractor and cause us to suffer serious harm to our reputation. Any suspension or termination of our U.S. government contractor status could have a material adverse effect on our business, financial condition or results of operations.
We are subject to anti-bribery laws in the U.S. and other jurisdictions, violations of which could include suspension or debarment of our ability to contract with the U.S. state or local governments, U.S. government agencies or the U.K. MoD, third-party claims, loss of customers, adverse financial impact, damage to reputation and adverse consequences on financing for current or future projects.
The FCPA, the U.K. Bribery Act and similar anti-bribery laws ("Anti-bribery Laws") in other jurisdictions generally prohibit companies and their intermediaries from making improper payments to government officials for the purpose of obtaining or retaining business. Our policies mandate compliance with these Anti-bribery Laws. We operate in many parts of the world that have experienced governmental corruption to some degree and, in certain circumstances, strict compliance with Anti-bribery Laws may conflict with local customs and practices. We train our staff concerning Anti-bribery Laws and we also inform our partners, subcontractors, agents and other third parties who work for us or on our behalf that they must comply with the requirements of these Anti-bribery Laws. We also have procedures and controls in place to monitor internal and external compliance. We cannot provide complete assurance that our internal controls and procedures will always protect us from the reckless or criminal acts committed by our employees or third parties working on our behalf. If we are found to be liable for violations of these laws (either due to our own acts or our inadvertence, or due to the acts or inadvertence of others), we could suffer from criminal or civil penalties or other sanctions, which could have a material adverse effect on our business.
20
Our work sites are inherently dangerous and we are subject to various environmental, worker health and safety laws and regulations. If we fail to maintain safe work sites or to comply with these laws and regulations, we may incur significant costs and penalties that could have a material adverse effect on our business, financial condition, results of operations and cash flows.
Our work sites often expose our employees and others to chemical and manufacturing processes, large pieces of mechanized equipment, and moving vehicles. Failure to implement effective safety procedures may result in injury, disability or loss of life to these parties. In addition, the projects may be delayed and we may be exposed to litigation or investigations.
Our operations are subject to a variety of environmental, worker health and safety laws and regulations governing the generation, management and use of regulated materials, the discharge of materials into the environment, the remediation of environmental contamination associated with the release of hazardous substances and human health and safety. Violations of these laws and regulations can cause significant delays and additional costs to a project. When we perform our services, our personnel and equipment may be exposed to radioactive and hazardous materials and conditions. We may be subject to claims alleging personal injury, property damage or natural resource damages by employees, customers and third parties as a result of alleged exposure to or contamination by hazardous substances. In addition, we may be subject to fines, penalties or other liabilities arising under environmental and employee safety laws. A claim, if not covered by insurance at all or only partially, could have a material adverse impact on our financial condition, results of operations and cash flows. In addition, more stringent regulation of our customers operations with respect to the protection of the environment could also adversely affect their operations and reduce demand for our services.
Various U.S. federal, state, local, and foreign environmental laws and regulations may impose liability for property damage and costs of investigation and cleanup of hazardous or toxic substances on property currently or previously owned by us or arising out of our waste management or environmental remediation activities. These laws may impose responsibility and liability without regard to knowledge or causation of the presence of contaminants. The liability under these laws is joint and several. The ongoing costs of complying with existing environmental laws and regulations could be substantial and have a material adverse impact on our financial condition, results of operations and cash flows. Changes in the environmental laws and regulations, remediation obligations, enforcement actions, stricter interpretations of existing requirements, future discovery of contamination or claims for damages to persons, property, natural resources or the environment could result in material costs and liabilities that we currently do not anticipate.
We may be affected by market or regulatory responses to climate change.
Continued attention to issues concerning climate change may result in the imposition of additional environmental regulations that seek to restrict, or otherwise impose limitations or costs upon, the emission of greenhouse gases. International agreements and national, regional and state legislation and regulatory measures or other restrictions on emissions of greenhouse gases could affect our clients, including those who are involved in the exploration, production or refining of fossil fuels, emit greenhouse gases through the combustion of fossil fuels, or emit greenhouse gases through the mining, manufacture, utilization or production of materials or goods. Such legislation or restrictions could increase the costs of projects for us and our clients or, in some cases, prevent a project from going forward, thereby potentially reducing the need for our services which could in turn have a material adverse effect on our operations and financial condition. We cannot predict when or whether any of these various legislative and regulatory proposals may become law or what their effect will be on us and our customers.
Risks Related to Financial Conditions and Markets
Current or future economic conditions in the credit markets may negatively affect the ability to operate our or our customers’ businesses, finance working capital, implement our acquisition strategy and access our cash and short-term investments.
We finance our business using cash provided by operations, but also depend on the availability of credit, including letters of credit and surety bonds. Our ability to obtain capital or financing on satisfactory terms will depend in part upon prevailing market conditions as well as our operating results. If adequate credit or funding is not available, or is not available on terms satisfactory to us, there could be a material adverse effect on our business and financial performance.
Disruptions of the capital markets could also adversely affect our clients’ ability to finance projects and could result in contract cancellations or suspensions, project delays and payment delays or defaults by our clients. In addition, clients may be unable to fund new projects, may choose to make fewer capital expenditures or otherwise slow their spending on our services or to seek contract terms more favorable to them. Our government clients may face budget deficits that prohibit them from funding proposed and existing projects or that cause them to exercise their right to terminate our contracts with little or no prior notice.
21
Furthermore, any financial difficulties suffered by our subcontractors or suppliers could increase our cost or adversely impact project schedules. These disruptions could materially impact our backlog and financial performance.
In addition, we are subject to the risk that the counterparties to our Credit Agreement (as defined below) may be unable to meet their contractual obligations to us if they suffer catastrophic demands on their liquidity. We also routinely enter into contracts with counterparties, including vendors, suppliers and subcontractors that may be negatively affected by events in the capital markets. If those counterparties are unable to perform their obligations to us or our clients, we may be required to provide additional services or make alternate arrangements on less favorable terms with other parties to ensure adequate performance and delivery of service to our clients. These circumstances could also lead to disputes and litigation with our partners or clients, which could have a material adverse effect on our reputation, business, financial condition and results of operations.
Furthermore, our cash balances and short-term investments are maintained in accounts held at major banks and financial institutions located primarily in North America, the U.K. and Australia. Deposits are in amounts that exceed available insurance. Although none of the financial institutions in which we hold our cash and investments have gone into bankruptcy, been forced into receivership or have been seized by their governments, there is a risk that this may occur in the future. If this were to occur, we would be at risk of not being able to access our cash and investments which may result in a temporary liquidity crisis that could impede our ability to fund operations.
We may be unable to obtain new contract awards if we are unable to provide our customers with letters of credit, surety bonds or other credit enhancements.
Customers may require us to provide credit enhancements, including letters of credit, bank guarantees or surety bonds. We are often required to provide performance guarantees to customers to indemnify the customer should we fail to perform our obligations under the contract. Failure to provide the required credit enhancements on terms required by a customer may result in an inability to bid, win or comply with the contract. Historically, we have had adequate letters of credit capacity but such capacity beyond our Credit Agreement is generally at the provider’s sole discretion. Due to events that affect the banking and insurance markets generally, letters of credit or surety bonds may be difficult to obtain or may only be available at significant cost. Moreover, many projects are often very large and complex, which often necessitates the use of a joint venture, often with a market competitor, to bid on and perform the contract. However, entering into joint ventures or partnerships exposes us to the credit and performance risk of third parties, many of whom may not be financially strong. If our joint ventures or partners fail to perform, we could suffer negative results. In addition, future projects may require us to obtain letters of credit that extend beyond the term of our current Credit Agreement. Any inability to bid for or win new contracts due to the failure of obtaining adequate letters of credit, surety bonding or other customary credit enhancements could have a material adverse effect on our business prospects and future revenues.
Our Credit Agreement imposes restrictions that limit our operating flexibility and may result in additional expenses, and this credit agreement may not be available if financial covenants are violated or if an event of default occurs.
Our Credit Agreement provides a credit line up to $1 billion and matures in September 2020 (our "Credit Agreement"). It contains a number of covenants restricting, among other things, our ability to incur liens and indebtedness, sell assets, repurchase our equity shares and make certain types of investments. We are also subject to certain financial covenants, including maintenance of a maximum ratio of consolidated debt to consolidated EBITDA and a minimum consolidated net worth, all as defined in the Credit Agreement.
A breach of any covenant or our inability to comply with the required financial ratios could result in a default under our Credit Agreement, and we can provide no assurance that we will be able to obtain the necessary waivers or amendments from our lenders to remedy a default. In the event of any default not cured or waived, the lenders are not obligated to provide funding or issue letters of credit and could elect to require us to apply available cash to collateralize any outstanding letters of credit and declare any outstanding borrowings, together with accrued interest and other fees, to be immediately due and payable, thus requiring us to apply available cash to repay any borrowings then outstanding. If we are unable to cash collateralize our letters of credit or repay borrowings with respect to our Credit Agreement when due, our lenders could proceed against the guarantees of our major domestic subsidiaries. If any future indebtedness under our Credit Agreement is accelerated, we can provide no assurance that our assets would be sufficient to repay such indebtedness in full.
22
Our debt levels have increased as a result of our recent acquisitions.
Our increased debt levels and related debt service obligations could have negative consequences, including:
• | requiring us to dedicate cash flow from operations to the repayment of debt, interest and other related amounts, which reduces the funds we have available for other purposes, such as working capital, capital expenditures, acquisitions, payment of dividends and share repurchase programs; |
• | making it more difficult or expensive for us to obtain any necessary future financing for working capital, capital expenditures, debt service requirements, debt refinancing, acquisitions or other purposes; |
• | reducing our flexibility in planning for or reacting to changes in our industry and market conditions; |
• | causing us to be more vulnerable in the event of a downturn in our business; |
• | exposing us to increased interest rate risk given that a portion of our debt obligations are at variable interest rates; and |
• | increasing our risk of a covenant violation under our Credit Agreement. |
Provisions in our charter documents, Delaware law and our Credit Agreement may inhibit a takeover or impact operational control which could adversely affect the value of our common stock.
Our certificate of incorporation and bylaws, as well as Delaware corporate law, contain provisions that could delay or prevent a change of control or changes in our management that a stockholder might consider favorable. These provisions include, among others, prohibiting stockholder action by written consent, advance notice for making nominations at meetings of stockholders, providing for the state of Delaware as the exclusive forum for lawsuits concerning certain corporate matters and the issuance of preferred stock with rights that may be senior to those of our common stock without stockholder approval. These provisions would apply even if a takeover offer may be considered beneficial by some of our stockholders. If a change of control or change in management is delayed or prevented, the market price of our common stock could decline. Additionally, our Credit Agreement contains a default provision that is triggered upon a change in control of at least 25%, which would impede a takeover and/or make a takeover more costly.
We are subject to foreign exchange and currency risks that could adversely affect our operations and our ability to reinvest earnings from operations. Our ability to mitigate our foreign exchange risk through hedging transactions may be limited.
We generally attempt to denominate our contracts in U.S. Dollars or in the currencies of our costs. However, we do enter into contracts that subject us to currency risk exposure, primarily when our contract revenues are denominated in a currency different from the contract costs. A portion of our consolidated revenues and consolidated operating expenses are in foreign currencies. As a result, we are subject to foreign currency risks, including risks resulting from changes in currency exchange rates and limitations on our ability to reinvest earnings from operations in one country to fund the financing requirements of our operations in other countries.
The governments of certain countries have or may in the future impose restrictive exchange controls on local currencies and it may not be possible for us to engage in effective hedging transactions to mitigate the risks associated with fluctuations of a particular currency. We are often required to pay all or a portion of our costs associated with a project in the local currency. As a result, we generally attempt to negotiate contract terms with our customer, who is often affiliated with the local government, or has a significant local presence, to provide that we are only paid in the local currency for amounts that match our local expenses. If we are unable to match our local currency costs with revenues in the local currency, we would be exposed to the risk of adverse changes in currency exchange rates.
If we need to sell or issue additional common shares to refinance existing debt or to finance future acquisitions, our existing shareholder ownership could be diluted.
Part of our business strategy is to expand into new markets and enhance our position in existing markets, both domestically and internationally, which may include the acquiring and merging of complementary businesses. To successfully fund and complete such potential acquisitions, we may issue additional equity securities that may result in dilution of our existing shareholder ownership's earnings per share.
23
We make equity investments in privately financed projects in which we could sustain significant losses.
We participate in privately financed projects that enable governments and other customers to finance large-scale projects, such as the acquisition and maintenance of major military equipment, capital projects and service purchases. These projects typically include the facilitation of nonrecourse financing, the design and construction of facilities and the provision of operation and maintenance services for an agreed-upon period after the facilities have been completed. We may incur contractually reimbursable costs and typically make investments prior to an entity achieving operational status or receiving project financing. If a project is unable to obtain financing, we could incur losses on our investments and any related contractual receivables. After completion of these projects, the return on our investments can be dependent on the operational success of the project and market factors which may not be under our control. As a result, we could sustain a loss on our equity investment in these projects.
Item 1B. Unresolved Staff Comments
None.
24
Item 2.Properties
We own or lease the following major properties in domestic and foreign locations:
Location | Owned/Leased | Description | Business Segment | |||
North America: | ||||||
Arlington, Virginia | Leased | Office facilities | Government Services | |||
Birmingham, Alabama | Leased | Office facilities | Engineering & Construction | |||
Colorado Springs, Colorado | Leased | Office facilities | Government Services | |||
Columbia, Maryland | Leased | Office facilities | Government Services | |||
Huntsville, Alabama | Leased | Office facilities | Government Services | |||
Houston, Texas | Leased | Office facilities | All | |||
Monterrey, Nuevo Leon, Mexico | Leased | Office facilities | Engineering & Construction | |||
Newark, Delaware | Leased | Office facilities | Engineering & Construction | |||
Europe, Middle East and Africa: | ||||||
Leatherhead, United Kingdom | Owned | Office facilities | All | |||
Al Khobar, Saudi Arabia | Leased | Office facilities | Engineering & Construction | |||
Asia-Pacific: | ||||||
Singapore | Leased | Office facilities | Engineering & Construction | |||
South Brisbane, Australia | Leased | Office facilities | Engineering & Construction | |||
Sydney, Australia | Leased | Office facilities | Engineering & Construction | |||
Perth, Australia | Leased | Office and project facilities | Technology & Consulting and Engineering & Construction | |||
Chennai, India | Leased | Office and project facilities | All | |||
We also own or lease numerous small facilities that include sales offices and project offices throughout the world and lease office space in other buildings owned by unrelated parties. Our owned property is pledged to secure certain pension obligations in the U.K. and we believe all properties that we currently occupy are suitable for their intended use.
25
Item 3.Legal Proceedings
Information relating to various commitments and contingencies is described in “Item 1A. Risk Factors” contained in Part I of this Annual Report on Form 10-K and in Notes 15 and 16 to our consolidated financial statements in Part II, Item 8 of this Annual Report on Form 10-K and the information discussed therein is incorporated by reference into this Part I, Item 3.
Item 4.Mine Safety Disclosures
Not applicable.
26
PART II
Item 5. | Market for Registrant’s Common Equity, Related Stockholder Matters and Issuer Purchases of Equity Securities |
Our common stock is traded on the New York Stock Exchange under the symbol “KBR.” The following table sets forth, on a per share basis for the periods indicated, the high and low sales prices for our common stock as reported by the New York Stock Exchange and dividends declared. In the fourth quarter of 2016, we declared a dividend of $0.08 per share on October 25, 2016.
Common Stock Price Range | Dividends Declared Per Share | |||||||||||
High | Low | |||||||||||
Fiscal Year 2016 | ||||||||||||
First quarter ended March 31, 2016 | $ | 17.10 | $ | 11.60 | $ | 0.08 | ||||||
Second quarter ended June 30, 2016 | $ | 15.92 | $ | 12.08 | $ | 0.08 | ||||||
Third quarter ended September 30, 2016 | $ | 15.89 | $ | 12.69 | $ | 0.08 | ||||||
Fourth quarter ended December 31, 2016 | $ | 17.95 | $ | 13.16 | $ | 0.08 | ||||||
Fiscal Year 2015 | ||||||||||||
First quarter ended March 31, 2015 | $ | 18.35 | $ | 14.00 | $ | 0.08 | ||||||
Second quarter ended June 30, 2015 | $ | 20.77 | $ | 14.30 | $ | 0.08 | ||||||
Third quarter ended September 30, 2015 | $ | 19.65 | $ | 15.64 | $ | 0.08 | ||||||
Fourth quarter ended December 31, 2015 | $ | 19.94 | $ | 16.34 | $ | 0.08 | ||||||
At January 31, 2017, there were 100 shareholders of record. In calculating the number of shareholders, we consider clearing agencies and security position listings as one shareholder for each agency or listing.
Share Repurchases
On February 25, 2014, our Board of Directors authorized a $350 million share repurchase program, which replaced and terminated the August 26, 2011 share repurchase program. The authorization does not obligate the Company to acquire any particular number of common shares and may be commenced, suspended or discontinued without prior notice. The share repurchases are intended to be funded through the Company’s current and future cash and the authorization does not have an expiration date.
Under our Credit Agreement, we are permitted to repurchase our equity shares provided that no such repurchases shall be made from the proceeds borrowed under the Credit Agreement and that the aggregate purchase price and dividends paid after September 25, 2015 does not exceed the Distribution Cap. As of December 31, 2016, the remaining availability under the Distribution Cap was approximately $652 million. The declaration, payment or increase of any future dividends will be at the discretion of our Board of Directors and will depend upon, among other things, future earnings, general financial condition and liquidity, success in business activities, capital requirements and general business conditions. Since January 2007, we have repurchased $797 million of our outstanding common stock and have paid $332 million in dividends.
The following is a summary of share repurchases of our common stock settled during the three months ended December 31, 2016 and the amount available to be repurchased under the authorized share repurchase program:
Purchase Period | Total Number of Shares Purchased (1) | Average Price Paid per Share | Total Number of Shares Purchased as Part of Publicly Announced Plan | Dollar Value of Maximum Number of Shares that May Yet Be Purchased Under the Plan | |||||||||
October 1 – 31, 2016 | 29,916 | $ | 14.90 | — | $ | 208,030,228 | |||||||
November 1 – 30, 2016 | 226 | $ | 16.99 | — | $ | 208,030,228 | |||||||
December 1 – 31, 2016 | 58,596 | $ | 17.55 | — | $ | 208,030,228 | |||||||
(1) | The shares reported herein consist solely of shares acquired from employees in connection with the settlement of income tax and related benefit withholding obligations arising from issuance of share-based equity awards under the KBR Stock and Incentive Plan. A total of 88,738 shares were acquired from employees during the three months ended December 31, 2016 at an average price of $16.66 per share. |
27
Performance Graph
The chart below compares the cumulative total shareholder return on shares of our common stock for the five-year period ended December 31, 2016, with the cumulative total return on the Dow Jones Heavy Construction Industry Index and the Russell 1000 Index for the same period. The comparison assumes the investment of $100 on December 31, 2011 and reinvestment of all dividends. The shareholder return is not necessarily indicative of future performance.
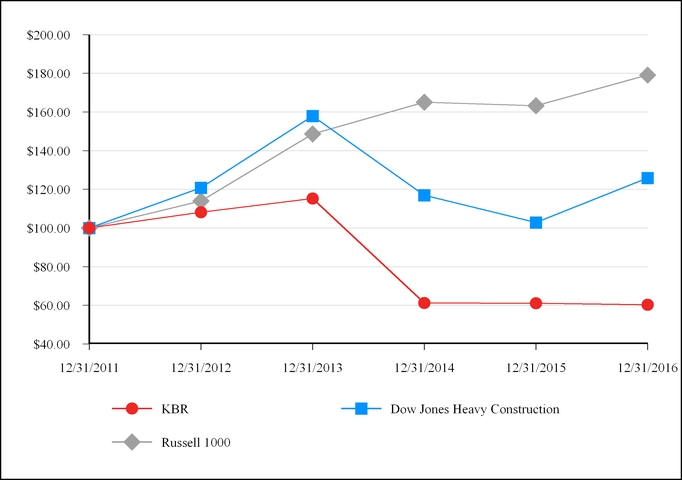
12/31/2011 | 12/31/2012 | 12/31/2013 | 12/31/2014 | 12/31/2015 | 12/31/2016 | ||||||||||||||||||
KBR | $ | 100.00 | $ | 108.09 | $ | 115.21 | $ | 61.24 | $ | 61.13 | $ | 60.30 | |||||||||||
Dow Jones Heavy Construction | $ | 100.00 | $ | 120.81 | $ | 157.90 | $ | 116.99 | $ | 102.82 | $ | 125.91 | |||||||||||
Russell 1000 | $ | 100.00 | $ | 113.92 | $ | 148.60 | $ | 165.05 | $ | 163.25 | $ | 179.08 | |||||||||||
28
Item 6.Selected Financial Data
The following table presents selected financial data for the last five years and should be read in conjunction with “Item 7. Management’s Discussion and Analysis of Financial Condition and Results of Operations” contained in Part II of this Annual Report on Form 10-K and the consolidated financial statements and the related notes to the consolidated financial statements included in Part II, Item 8 in this Annual Report on Form 10-K.
Years Ended December 31, | ||||||||||||||||||||
Dollars in millions, except per share amounts | 2016 | 2015 | 2014 | 2013 | 2012 | |||||||||||||||
Statements of Operations Data: | ||||||||||||||||||||
Revenues | $ | 4,268 | $ | 5,096 | $ | 6,366 | $ | 7,214 | $ | 7,770 | ||||||||||
Gross profit (loss) | 112 | 325 | (65 | ) | 417 | 518 | ||||||||||||||
Equity in earnings of unconsolidated affiliates | 91 | 149 | 163 | 137 | 151 | |||||||||||||||
Impairment of goodwill, asset impairments and restructuring charges (a) | (39 | ) | (70 | ) | (660 | ) | — | (180 | ) | |||||||||||
Operating income (loss) (b) | 28 | 310 | (794 | ) | 308 | 299 | ||||||||||||||
Net income (loss) (c) | (51 | ) | 226 | (1,198 | ) | 171 | 202 | |||||||||||||
Net income attributable to noncontrolling interests | (10 | ) | (23 | ) | (64 | ) | (96 | ) | (58 | ) | ||||||||||
Net income (loss) attributable to KBR | (61 | ) | 203 | (1,262 | ) | 75 | 144 | |||||||||||||
Basic net income (loss) attributable to KBR per share | $ | (0.43 | ) | $ | 1.40 | $ | (8.66 | ) | $ | 0.50 | $ | 0.97 | ||||||||
Diluted net income (loss) attributable to KBR per share | $ | (0.43 | ) | $ | 1.40 | $ | (8.66 | ) | $ | 0.50 | $ | 0.97 | ||||||||
Cash dividends declared per share | $ | 0.32 | $ | 0.32 | $ | 0.32 | $ | 0.24 | $ | 0.28 | ||||||||||
Balance Sheet Data (as of the end of period): | ||||||||||||||||||||
Total assets (d) | $ | 4,144 | $ | 3,412 | $ | 4,078 | $ | 5,422 | $ | 5,752 | ||||||||||
Long-term nonrecourse project-finance debt | 34 | 51 | 63 | 78 | 84 | |||||||||||||||
Long-term revolving credit agreement debt | 650 | — | — | — | — | |||||||||||||||
Total shareholders’ equity | $ | 745 | $ | 1,052 | $ | 935 | $ | 2,439 | $ | 2,511 | ||||||||||
Other Financial Data (as of the end of period): | ||||||||||||||||||||
Backlog of unfulfilled orders (e) | $ | 10,938 | $ | 12,333 | $ | 10,859 | $ | 14,118 | $ | 14,931 | ||||||||||
(a) | Included in 2016 and 2015 are asset impairment and restructuring charges of $39 million and $70 million, respectively. The 2014 balance includes a goodwill impairment charge of $446 million related to three of our previous reporting units, long-lived assets impairment charge of $171 million and restructuring charges of $43 million. Included in 2012 is a goodwill impairment charge of $178 million related to one of our previous reporting units and a $2 million long-lived asset impairment charge. |
(b) | Includes gains on disposal of assets of $7 million, $61 million, $7 million, $2 million and $32 million for the years ended 2016, 2015, 2014, 2013, and 2012, respectively. |
(c) | Included in 2014 is $421 million of tax expense primarily related to valuation allowance on U.S. federal, foreign and state net operating loss carryforwards, foreign tax credit carryforwards, other deferred tax assets and foreign tax expense. |
(d) | The impact of adopting Accounting Standards Update ("ASU") 2015-17 resulted in a decrease in total assets of $121 million, $16 million, and $15 million for the years ended 2014, 2013 and 2012, respectively. |
(e) | Prior to the second quarter of 2015, the amount included in backlog for long-term contracts associated with the U.K. government's PFIs was limited to five years. In the second quarter of 2015, we modified our backlog policy to record the estimated value of all work forecasted to be performed under these arrangements. |
29
Item 7. | Management’s Discussion and Analysis of Financial Condition and Results of Operations |
Introduction
Management’s discussion and analysis (“MD&A”) should be read in conjunction with Part I of this Annual Report on Form 10-K as well as the consolidated financial statements and related notes included in Part II Item 8 in this Annual Report on Form 10-K.
Business Environment
Our portfolio includes highly specialized mission and logistics support solutions, engineering services, process technologies, energy project technical consulting, program management, construction, asset life-cycle solutions and other related services. We provide these services to various international and domestic governmental agencies and a wide range of customers across the hydrocarbons value chain. The demand for our services depends on the level of capital and operating expenditures of our customers, which is often considered alongside prevailing market conditions and the availability of resources to support and fund projects. Significant volatility in commodity prices has resulted in many of our oil and gas customers taking steps to defer, suspend or terminate capital expenditures which result in delayed or reduced volumes of business for us.
We expect continued opportunities within our global government services business as we drive higher value and lower cost solutions to support governments’ increasing training, operation, maintenance and sustainment requirements. The acquisition of Wyle Inc. ("Wyle") and Honeywell Technology Solutions Inc. ("HTSI"), which we have converted to KBRwyle Technology Solutions, LLC ("KTS") in the third quarter of 2016 moves KBR’s GS business into the domestic high value engineering services industry for such clients as NASA and U.S. government military agencies. International tensions are also likely to contribute to increased demand for our international military support services.
Upstream oil projects have experienced the largest reductions in capital expenditures, as the effect of volatile oil prices has been more pronounced in this sector. We continue to see opportunities in the hydrocarbons market, including midstream gas projects such as LNG to satisfy future demand, particularly at locations where major supporting infrastructure already exists (i.e. near existing gas pipelines and electric power grids, port facilities, etc.). Additionally, the downstream sector, which generally benefits from low feedstock prices, should also be positively impacted. We seek to collaborate with our customers in developing these prospects by using integrated teams, from project conceptualization and technical solutions selection through project award and implementation.
We believe KBR has a balanced portfolio of recurring government services outsourcing opportunities as well as upstream, midstream and downstream solutions.
Overview of Financial Results
While the financial results were lower than our expectations in 2016, we were successful from a long-term strategic perspective with efforts to expand our government services offering and our Brown & Root Industrial Services model as well as broaden our technology portfolio. During the year, we acquired two significant, well established and highly technical government services companies and three smaller technology driven entities. Through our Brown & Root Industrial Services joint venture in North America, we acquired a turnaround and specialty welding company. All of these acquisitions are part of our strategy to pivot the company to become a global leader in differentiated professional services in the Government Services and Global Hydrocarbons industries. These businesses have historically provided stable earnings and cash flows which we expect will reduce volatility of our financial results associated with large EPC projects traditionally executed by our E&C business segment. The steady earnings and cash flows from these acquisitions also provide us with the financial flexibility to be selective in determining which EPC sales prospects we pursue in the future. As a result, we expect more than fifty percent of our 2017 revenues to come from our GS business segment which tends to have a large percentage of its work being executed under smaller reimbursable type contracts. Finally, we made significant progress in completing our last domestic EPC power project which is the final step in exiting this non-strategic business.
30
Revenues | |||||||||||||||||||||||||
2016 vs. 2015 | 2015 vs. 2014 | ||||||||||||||||||||||||
Dollars in millions | 2016 | 2015 | $ | % | 2014 | $ | % | ||||||||||||||||||
Revenues | $ | 4,268 | $ | 5,096 | $ | (828 | ) | (16 | )% | $ | 6,366 | $ | (1,270 | ) | (20 | )% | |||||||||
The decrease in consolidated revenues in 2016 was primarily driven by lower activity on our two LNG projects in Australia one of which was substantially completed at the end of 2016 as well as reduced activities on two ammonia projects in the U.S. The reduction in activities on these four projects resulted in combined lower revenues of approximately $759 million. Revenues declined by $367 million related to the deconsolidation of our Industrial Services Americas business that was contributed in the formation of the unconsolidated Brown & Root Industrial Services joint venture in North America and another $178 million as a result the sale of the Building Group and Infrastructure Americas businesses in 2015. Lower activity on fixed-price EPC power projects nearing completion in 2015 within our Non-strategic Business segment also contributed to the decrease. These revenue decreases were partially offset by the expansion of existing U.S government contracts, revenues generated by the newly acquired Wyle and KTS and a favorable settlement with the U.S. government regarding reimbursement of previously expensed legal fees and interest incurred related to the sodium dichromate case within our GS business segment. Revenues increased by $64 million due to closeout activities on an LNG project in Africa within our E&C business segment. Revenue in our T&C business segment was favorably impacted by new acquisitions and higher proprietary equipment sales.
Consolidated revenues in 2015 decreased primarily due to reduced activity within our E&C business segment on one of our major LNG projects in Australia that was nearing completion. The decrease in revenues was also attributable to the completion or substantial completion of several projects in the U.S., Middle East and Canada. The contribution of our Industrial Services Americas business to an unconsolidated joint venture in the third quarter of 2015 resulted in decreased revenues of $126 million as compared to 2014. These decreases were partially offset by increased work or ramp up on various chemicals and ammonia projects in the U.S. and a new oil and gas project in Europe. Our revenues were negatively impacted by activity within our Non-strategic Business segment, including the reduction of $141 million of revenues related to the sale of two businesses and the wind-down of two fixed-price EPC power projects that were nearing completion in 2015. In addition, proprietary equipment sales and awards of new consulting contracts from upstream oil related projects declined within our T&C business segment contributed to the decrease.
Gross Profit (Loss) | |||||||||||||||||||||||||
2016 vs. 2015 | 2015 vs. 2014 | ||||||||||||||||||||||||
Dollars in millions | 2016 | 2015 | $ | % | 2014 | $ | % | ||||||||||||||||||
Gross profit (loss) | $ | 112 | $ | 325 | $ | (213 | ) | (66 | )% | $ | (65 | ) | $ | 390 | 600 | % | |||||||||
The decrease in consolidated gross profit in 2016 was primarily due to reduced activity as a result of the completion or substantial completion of several projects, including one of our LNG projects in Australia, and the contribution of our Industrial Services Americas business to an unconsolidated joint venture discussed above. Increased costs estimates to complete several U.S. projects in our E&C business segment led to further declines in gross profit and included a decrease of $114 million resulting from an unforeseen equipment failure and other items during plant start-up on an EPC ammonia project and $112 million resulting from cost increases on a downstream EPC project due to significant weather delays and lower than expected construction productivity rates. In our Non-strategic business segment, an increase in subcontractor costs as a result of lower than anticipated productivity on a power project also negatively impacted consolidated gross profit for the period. Consolidated gross profit was positively impacted by increased activity from new awards, expansions on existing U.S. government contracts, settlement of the sodium dichromate legal matter with the U.S. government, results from the recent acquisitions within our GS business segment and the settlement on closeout of an LNG project in Africa within our E&C business segment discussed above.
The increase in consolidated gross profit in 2015 was primarily due to losses and charges that were recognized during 2014 on projects within our E&C and Non-strategic Business segments. Gross profit was also impacted by the recognition of favorable settlements in the third quarter of 2015 within our Non-strategic Business segment, ongoing execution on base operations and other contracts within our GS business segment and reduced overhead spending within our E&C business segment. This increase was partially offset by the reduced activity on the major LNG project discussed above.
31
Equity in Earnings of Unconsolidated Affiliates | |||||||||||||||||||||||||
2016 vs. 2015 | 2015 vs. 2014 | ||||||||||||||||||||||||
Dollars in millions | 2016 | 2015 | $ | % | 2014 | $ | % | ||||||||||||||||||
Equity in earnings of unconsolidated affiliates | $ | 91 | $ | 149 | $ | (58 | ) | (39 | )% | $ | 163 | $ | (14 | ) | (9 | )% | |||||||||
The decrease in equity in earnings of unconsolidated affiliates in 2016 was primarily due to lower progress and increased reimbursable cost estimates on an LNG project joint venture in Australia within our E&C business segment that reduced the percentage of completion and delays profit to future periods (See "Changes in Project-related Estimates" within the Results of Operations section for further discussion). Also, within our E&C business segment, we benefited from a $15 million favorable adjustment in 2015 to correct transactions between unconsolidated affiliates associated with our offshore maintenance joint venture in Mexico that did not recur in 2016.
The decrease in equity in earnings of unconsolidated affiliates in 2015 was primarily due to an insurance recovery and reduced costs on a joint venture project within our GS business segment in 2014 that did not recur in 2015 as well as a reduction in volume due to the substantial completion of construction activities on this project during 2015. This decrease was offset by increased earnings due to a correction on our offshore maintenance joint venture in Mexico in our E&C business segment as noted above.
General and Administrative Expenses | |||||||||||||||||||||||||
2016 vs. 2015 | 2015 vs. 2014 | ||||||||||||||||||||||||
Dollars in millions | 2016 | 2015 | $ | % | 2014 | $ | % | ||||||||||||||||||
General and administrative expenses | $ | (143 | ) | $ | (155 | ) | $ | (12 | ) | (8 | )% | $ | (239 | ) | $ | (84 | ) | (35 | )% | ||||||
The decrease in general and administrative expenses in 2016 was primarily due to reduced overhead costs resulting from continued headcount reductions and other cost savings initiatives implemented throughout 2015 and 2016, partially offset by a $7 million increase due to the acquisition of Wyle and HTSI in 2016. General and administrative expenses in 2016 included $88 million related to corporate activities and $55 million related to the business segments.
The decrease in general and administrative expenses in 2015 was primarily due to lower information technology support costs resulting from the cancellation of our enterprise resource planning ("ERP") implementation project in the fourth quarter of 2014, reduced overhead costs resulting from headcount reductions and other cost savings initiatives implemented at the end of 2014 and during 2015. General and administrative expenses in 2015 included $113 million related to corporate activities and $42 million related to the business segments.
Impairment and Restructuring Charges | |||||||||||||||||||||||||
2016 vs. 2015 | 2015 vs. 2014 | ||||||||||||||||||||||||
Dollars in millions | 2016 | 2015 | $ | % | 2014 | $ | % | ||||||||||||||||||
Impairment of goodwill | $ | — | $ | — | $ | — | —% | $ | (446 | ) | $ | (446 | ) | (100 | )% | ||||||||||
Asset impairment and restructuring charges | $ | (39 | ) | $ | (70 | ) | $ | (31 | ) | (44 | )% | $ | (214 | ) | $ | (144 | ) | (67 | )% | ||||||
Asset impairment and restructuring charges in 2016 includes $21 million in charges associated with impairments of leasehold improvements and lease terminations within our E&C and Other business segments. Additionally, we recognized $18 million of additional severance costs associated with workforce reduction efforts during the year primarily within our E&C business segment.
Asset impairment and restructuring charges in 2015 reflects $22 million of charges within our E&C and Other business segments to write off the remaining portion of one of our ERP assets which we abandoned during the year. We also recognize $21 million in charges for impairments of leasehold improvements and lease termination costs associated with lease terminations during 2015 within our E&C and Other business segments. Within our E&C and T&C business segments, we recognized severance costs of $27 million as the result of workforce reduction efforts primarily related to our announcement at the end of 2014.
In 2014, we recognized goodwill impairment of $446 million related to the remaining goodwill associated with our Roberts and Schaefer ("R&S") and BE&K, Inc. acquisitions as a result of our decision to exit related businesses and the continued business decline in certain markets.
32
Asset impairment and restructuring charges in 2014 reflects the impairment of $135 million for a portion of our ERP project we did not expect would provide us any future benefits, the recognition of a $31 million impairment of R&S intangible assets and $19 million of charges related to impairment of leasehold improvements and costs associated with terminated leases and other properties. We also recognized $29 million of severance charges as a result of workforce reductions.
See Notes 10 to our consolidated financial statements for further discussion on asset impairment and restructuring charges.
Gain on Disposition of Assets | |||||||||||||||||||||||||
2016 vs. 2015 | 2015 vs. 2014 | ||||||||||||||||||||||||
Dollars in millions | 2016 | 2015 | $ | % | 2014 | $ | % | ||||||||||||||||||
Gain on disposition of assets | $ | 7 | $ | 61 | $ | (54 | ) | (89 | )% | $ | 7 | $ | 54 | 771 | % | ||||||||||
The gain on disposition of assets in 2016 primarily reflects working capital adjustments in the first quarter of 2016 associated with the sale of our Infrastructure Americas business within our Non-strategic Business segment.
The gain on disposition of assets in 2015 primarily reflects the gain recognized on the sale of our U.K. office location within our E&C business segment and our Infrastructure Americas business within our Non-strategic Business segment. This also includes the gain recognized in our E&C business segment for the deconsolidation and transfer of our Industrial Services Americas business to the Brown & Root Industrial Services joint venture in North America and the sale of our Building Group subsidiary within our Non-strategic Business segment in the second quarter. See Notes 3 and 11 to our consolidated financial statements for additional information.
Non-operating Income | |||||||||||||||||||||||||
2016 vs. 2015 | 2015 vs. 2014 | ||||||||||||||||||||||||
Dollars in millions | 2016 | 2015 | $ | % | 2014 | $ | % | ||||||||||||||||||
Non-operating income | $ | 5 | $ | 2 | $ | 3 | 150 | % | $ | 17 | $ | (15 | ) | (88 | )% | ||||||||||
Non-operating income includes interest income, interest expense, foreign exchange gains and losses and other non-operating income or expense items. The increase in non-operating income in 2016 compared to 2015 was primarily due to the strengthening of the U.S. dollar against the majority of our foreign currencies. This increase was partially offset by an increase in interest expense related to borrowings under our credit agreement.
The decrease in non-operating income in 2015 was primarily due to the gain on a negotiated settlement with our former parent as well as the reversal of associated interest under a tax sharing agreement recognized in 2014 that did not recur in 2015. Also contributing to operating income were foreign exchange gains of $9 million in 2015 due to the strengthening of the U.S. dollar against the majority of our foreign currencies compared to losses in 2014.
Provision for Income Taxes | |||||||||||||||||||||||
2016 vs. 2015 | 2015 vs. 2014 | ||||||||||||||||||||||
Dollars in millions | 2016 | 2015 | $ | % | 2014 | $ | % | ||||||||||||||||
Income (loss) before provision for income taxes | $ | 33 | $ | 312 | $ | (279 | ) | (89)% | $ | (777 | ) | $ | 1,089 | 140% | |||||||||
Provision for income taxes | $ | (84 | ) | $ | (86 | ) | $ | (2 | ) | (2)% | $ | (421 | ) | $ | (335 | ) | (80)% | ||||||
Provision for income taxes in 2016 and 2015 consists primarily of $87 million and $77 million, respectively, on our foreign earnings. The provision for income taxes in 2016 is impacted by $343 million of project losses in the U.S. for which we recognize no tax benefit.
33
The decrease in provision for income taxes in 2015 compared to 2014 was primarily due to the absence of the nondeductible goodwill impairment loss, the increase in our valuation allowance for deferred tax assets and the recognition of taxes on undistributed earnings which increased 2014 income taxes.
A reconciliation of our effective tax rates for 2016, 2015 and 2014 to the U.S. statutory federal rate is presented in Note 14 to our consolidated financial statements.
Net Income Attributable to Noncontrolling Interests | |||||||||||||||||||||||||
2016 vs. 2015 | 2015 vs. 2014 | ||||||||||||||||||||||||
Dollars in millions | 2016 | 2015 | $ | % | 2014 | $ | % | ||||||||||||||||||
Net income attributable to noncontrolling interests | $ | (10 | ) | $ | (23 | ) | $ | (13 | ) | (57 | )% | $ | (64 | ) | $ | (41 | ) | (64 | )% | ||||||
The decreases in net income attributable to noncontrolling interests in 2016 compared to 2015 and 2015 compared to 2014 were due to reduced joint venture earnings resulting from lower activity on our major LNG project in Australia in our E&C business segment.
34
Results of Operations by Business Segment
We analyze the financial results for each of our five business segments. The business segments presented are consistent with our reportable segments discussed in Note 2 to our consolidated financial statements.
Years Ended December 31, | |||||||||||||||||||||||||
2016 vs. 2015 | 2015 vs. 2014 | ||||||||||||||||||||||||
Dollars in millions | 2016 | 2015 | $ | % | 2014 | $ | % | ||||||||||||||||||
Revenues | |||||||||||||||||||||||||
Government Services | $ | 1,359 | $ | 663 | $ | 696 | 105 | % | $ | 638 | $ | 25 | 4 | % | |||||||||||
Technology & Consulting | 347 | 324 | 23 | 7 | % | 353 | (29 | ) | (8 | )% | |||||||||||||||
Engineering & Construction | 2,352 | 3,454 | (1,102 | ) | (32 | )% | 4,584 | (1,130 | ) | (25 | )% | ||||||||||||||
Other | — | — | — | — | % | — | — | — | % | ||||||||||||||||
Subtotal | $ | 4,058 | $ | 4,441 | $ | (383 | ) | (9 | )% | $ | 5,575 | $ | (1,134 | ) | (20 | )% | |||||||||
Non-strategic Business | 210 | 655 | (445 | ) | (68 | )% | 791 | (136 | ) | (17 | )% | ||||||||||||||
Total | $ | 4,268 | $ | 5,096 | $ | (828 | ) | (16 | )% | $ | 6,366 | $ | (1,270 | ) | (20 | )% | |||||||||
Gross profit (loss) | |||||||||||||||||||||||||
Government Services | $ | 137 | $ | (3 | ) | 140 | n/m | $ | (32 | ) | $ | 29 | 91 | % | |||||||||||
Technology & Consulting | 73 | 77 | (4 | ) | (5 | )% | 53 | 24 | 45 | % | |||||||||||||||
Engineering & Construction | 7 | 224 | (217 | ) | (97 | )% | 141 | 83 | 59 | % | |||||||||||||||
Other | — | — | — | — | % | — | — | — | % | ||||||||||||||||
Subtotal | $ | 217 | $ | 298 | $ | (81 | ) | (27 | )% | $ | 162 | $ | 136 | 84 | % | ||||||||||
Non-strategic Business | (105 | ) | 27 | (132 | ) | (489 | )% | (227 | ) | 254 | 112 | % | |||||||||||||
Total | $ | 112 | $ | 325 | $ | (213 | ) | (66 | )% | $ | (65 | ) | $ | 390 | n/m | ||||||||||
Equity in earnings of unconsolidated affiliates | |||||||||||||||||||||||||
Government Services | $ | 39 | $ | 45 | $ | (6 | ) | (13 | )% | $ | 73 | $ | (28 | ) | (38 | )% | |||||||||
Technology & Consulting | — | — | — | — | % | — | — | — | % | ||||||||||||||||
Engineering & Construction | 52 | 104 | (52 | ) | (50 | )% | 90 | 14 | 16 | % | |||||||||||||||
Other | — | — | — | — | % | — | — | — | % | ||||||||||||||||
Subtotal | $ | 91 | $ | 149 | $ | (58 | ) | (39 | )% | $ | 163 | $ | (14 | ) | (9 | )% | |||||||||
Non-strategic Business | — | — | — | — | % | — | — | — | % | ||||||||||||||||
Total | $ | 91 | $ | 149 | $ | (58 | ) | (39 | )% | $ | 163 | $ | (14 | ) | (9 | )% | |||||||||
Total general and administrative expense | $ | (143 | ) | $ | (155 | ) | $ | (12 | ) | (8 | )% | $ | (239 | ) | $ | (84 | ) | (35 | )% | ||||||
Impairment of goodwill | $ | — | $ | — | $ | — | — | % | $ | (446 | ) | $ | (446 | ) | (100 | )% | |||||||||
Asset impairment and restructuring charges | $ | (39 | ) | $ | (70 | ) | $ | (31 | ) | (44 | )% | $ | (214 | ) | $ | (144 | ) | (67 | )% | ||||||
Gain on disposition of assets | $ | 7 | $ | 61 | $ | (54 | ) | (89 | )% | $ | 7 | $ | 54 | 771 | % | ||||||||||
Total operating income (loss) | $ | 28 | $ | 310 | $ | (282 | ) | (91 | )% | $ | (794 | ) | $ | 1,104 | 139 | % | |||||||||
n/m - not meaningful
35
Government Services
GS revenues increased by $696 million, or 105%, to $1.4 billion in 2016 compared to $663 million in 2015. This increase was driven primarily by the addition of $487 million of revenues related to the newly acquired Wyle and KTS in the third quarter of 2016 and $148 million of revenue associated with continued expansion under existing U.S. government contracts. A favorable settlement with the U.S. government on reimbursement of $33 million in previously expensed legal fees plus interest related to the sodium dichromate case and the approval of a change order on a road construction project in the Middle East also contributed to this increase.
GS gross profit increased by $140 million, to a profit of $137 million in 2016 compared to a loss of $3 million in 2015. This increase was primarily due to the continued expansion under existing U.S. government contracts, acquisitions, the favorable settlement and the approval of the change order discussed above.
GS equity in earnings in unconsolidated affiliates decreased by $6 million, or 13%, to $39 million in 2016 compared to $45 million in 2015. This decrease was primarily due to reduced equity earnings from the construction phase of a U.K. MoD project that was substantially completed in 2015.
GS revenues increased by $25 million, or 4%, to $663 million in 2015 compared to $638 million in 2014. This increase was primarily due to the expansion of existing U.S. government contracts, partially offset by the effect of reduced troop numbers on services under U.K. MoD and NATO contracts in Afghanistan. Revenues were also positively impacted by favorable settlement of disputes with the U.S. government on some of our legacy projects.
GS gross loss decreased by $29 million, or 91%, to a loss of $3 million in 2015 compared to a loss of $32 million in 2014. This improvement was driven by increased activity on U.S. government contracts discussed above, partially offset by the reduction in Afghanistan-related support activities. The positive impact of the favorable settlement of disputes with the U.S. government on some of our legacy projects includes the recognition of $18 million in legal fees related to these legacy contracts during 2015.
GS equity in earnings in unconsolidated affiliates decreased by $28 million, or 38%, to $45 million in 2015 compared to $73 million in 2014. This decrease was driven primarily by an insurance recovery on a joint venture for a U.K. MoD project in 2014 that did not recur in 2015 as well as the impact of reaching substantial completion of construction activities on this project.
Technology & Consulting
T&C revenues increased by $23 million, or 7%, to $347 million in 2016 compared to $324 million in 2015 due to an increase in proprietary equipment sales offset by lower engineering and technology license fee revenues related to several petrochemicals, ammonia and refining projects. The three technology companies acquired in the first quarter of 2016 contributed $28 million in revenues during 2016.
T&C gross profit decreased by $4 million, or 5%, to $73 million in 2016 compared to $77 million in 2015 due to lower profitability on the proprietary equipment sales versus technology license fees.
T&C revenues decreased by $29 million, or 8%, to $324 million in 2015 compared to $353 million in 2014 due to a decrease in proprietary equipment sales and awards of new consulting contracts from upstream oil projects partially offset by higher technology revenues related to several petrochemicals, ammonia and refining projects.
T&C gross profit increased by $24 million, or 45%, to $77 million in 2015 compared to $53 million in 2014 due to higher profitability on the mix of projects executed, a larger number of license milestones achieved and significant overhead reductions during 2015.
Engineering & Construction
E&C revenues decreased by $1.1 billion, or 32%, to $2.4 billion in 2016 compared to $3.5 billion in 2015. This decrease was primarily due to the elimination of $367 million of revenues resulting from the deconsolidation of our Industrial Services Americas business in the third quarter of 2015, as well as reduced activity and the completion or near completion of several projects in Australia, U.S. and Europe including our two LNG projects in Australia and an EPC ammonia project. These decreases were partially offset by new chemical and various other projects in the U.S. and a new oil and gas project in Europe.
36
E&C gross profit decreased by $217 million, or 97%, to $7 million in 2016 compared to $224 million in 2015. This decrease was primarily due to increased costs of $114 million resulting from the mechanical failure of a vendor supplied compressor and pumps during commissioning as well as various mechanical issues encountered during start-up on an EPC ammonia project in the U.S., reduced activity on an LNG project in Australia and the deconsolidation of our Industrial Services Americas business discussed above. Gross profit was also impacted by cost increases of $112 million resulting from significant weather delays and less than expected construction productivity rates on a downstream EPC project in the U.S. These decreases were partially offset by a settlement on closeout of an LNG project in Africa of $64 million as well as reduced overhead costs resulting from our previously announced restructuring plan.
E&C equity in earnings in unconsolidated affiliates decreased by $52 million, or 50%, to $52 million in 2016 compared to $104 million in 2015. The decrease was due to a non-recurring $15 million favorable adjustment recognized in the second quarter of 2015 on our offshore maintenance joint venture in Mexico, as well as lower progress and increased reimbursable cost estimates on an LNG project joint venture in Australia which reduces percentage of completion and delays profits into future periods.
E&C revenues decreased by $1.1 billion, or 25%, to $3.5 billion in 2015 compared to $4.6 billion in 2014. This decrease resulted primarily from reduced activity on a major LNG project in Australia, the completion of Canadian pipe fabrication and module assembly projects which had peak activity in 2014, reduced activity in the construction market and the elimination of revenues resulting from the deconsolidation of our Industrial Services Americas business during the third quarter.
E&C gross profit increased by $83 million, or 59%, to $224 million in 2015 compared to $141 million in 2014. This increase was primarily due to Canadian pipe fabrication and module assembly projects, which had profit in 2015 resulting from negotiated settlements and closeout activities compared to recognition of losses in 2014, and reduced overheads in 2015. This increase was partially offset by reduced activity on a major LNG project in Australia.
E&C equity in earnings in unconsolidated affiliates increased by $14 million, or 16%, to $104 million in 2015 compared to $90 million in 2014. The increase was primarily attributable to our offshore maintenance joint venture in Mexico, which had increased earnings in 2015 due to the vessels being in dry dock during 2014 and the non-recurring $15 million favorable adjustment associated with our Mexican joint venture. The increase was partially offset by reduced earnings on an LNG project joint venture in Australia and reduced earnings on our ammonia plant joint venture in Egypt.
Non-strategic Business
Non-strategic Business revenues decreased by $445 million, or 68%, to $210 million in 2016 compared to $655 million in 2015. This decrease was due to the elimination of revenues of $178 million due to the sale of the Building Group and Infrastructure Americas businesses in the second and fourth quarters of 2015, respectively, and the completion or near completion of several EPC power projects as we exit that business.
Non-strategic Business gross profit decreased by $132 million to a loss of $105 million in 2016 compared to a profit of $27 million in 2015. This decrease was primarily due to increased forecasted costs of $117 million to complete a power project due to poor subcontractor construction productivity, resulting schedule delays and changes in the project execution strategy.
Non-strategic Business revenues decreased by $136 million, or 17%, to $655 million in 2015 compared to $791 million in 2014. This decrease was due to the sale of Building Group in the second quarter of 2015 and the near completion of several power and construction projects partially offset by increased activity on power and infrastructure projects that began in the second half of 2014.
Non-strategic Business gross profit increased by $254 million to a profit of $27 million in 2015 compared to a loss of $227 million in 2014. This increase was due to non-recurring charges recognized during 2014 on a power project, improved performance and favorable settlements on power projects in the third quarter of 2015 as well as overhead savings resulting from the Building Group sale mentioned above and headcount reductions which began in late 2014.
37
Changes in Project-related Estimates
With a portfolio of more than one thousand contracts, we generally realize both lower and higher than expected margins on projects in any given period due to judgments and estimates inherent in revenue recognition for our contracts. We recognize revisions of revenues and costs in the period in which the revisions are known. This may result in the recognition of costs before the recognition of related revenue recovery, if any.
During the year ended December 31, 2016, we recognized unfavorable changes in estimates of losses of $231 million on an EPC ammonia project and a power project within our E&C and Non-strategic Business segments. We also recognized a decrease in gross profit of $112 million on a downstream EPC project in the U.S. which resulted in this project becoming a loss project. See Note 2 to our consolidated financial statements for additional information related to changes in project-related estimates. Information discussed therein is incorporated by reference into this Part II, Item 7.
In addition to the changes in project-related estimates discussed above, we have recorded contract price adjustments in the estimates of revenues and costs at completion on the Ichthys LNG project which we believe we are contractually entitled to but our client has disputed. The client has agreed to a contractual mechanism (“Deed of Settlement”) to facilitate the continuation of work under the contract while we work to resolve this dispute. See Note 6 for additional information related to the unapproved change orders and claims related to the Ichthys project. Information discussed therein is incorporated by reference into this Part II, Item 7.
Acquisitions, Dispositions and Other Transactions
Information relating to various acquisitions, dispositions and other transactions is described in Notes 3, 8 and 11 to our consolidated financial statements in Part II, Item 8 of this Annual Report on Form 10-K and the information discussed therein is incorporated by reference into this Part II, Item 7.
Backlog of Unfilled Orders
Backlog generally represents the dollar amount of revenues we expect to realize in the future as a result of performing work on contracts and our pro-rata share of work to be performed by unconsolidated joint ventures. We generally include total expected revenues in backlog when a contract is awarded under a legally binding agreement. In many instances, arrangements included in backlog are complex, nonrepetitive and may fluctuate over the contract period due to the release of contracted work in phases by the customer. Additionally, nearly all contracts allow customers to terminate the agreement at any time for convenience. Where contract duration is indefinite and clients can terminate for convenience without compensating us for periods beyond the date of termination, backlog is limited to the estimated amount of expected revenues within the following twelve months. Certain contracts provide maximum dollar limits, with actual authorization to perform work under the contract agreed upon on a periodic basis with the customer. In these arrangements, only the amounts authorized are included in backlog. For projects where we act solely in a project management capacity, we only include the expected value of our services in backlog.
In connection with our acquisitions of Wyle and HTSI, we determined that our then-existing backlog policy differed from those utilized by Wyle and HTSI. We concluded that the methodology utilized by Wyle and HTSI provided a better estimate of future revenues, and accordingly, we modified our backlog policy for U.S. government contracts in our GS business segment to reflect both the funded and unfunded portions of future revenue from existing contracts for which the customer has determined scope and price. We define backlog, as it relates to U.S. government contracts, as our estimate of the remaining future revenue from existing signed contracts over the remaining base contract performance period (including customer approved option periods) for which work scope and price have been agreed with the customer. We define funded backlog as the portion of backlog for which funding currently is appropriated, less the amount of revenue we have previously recognized. We define unfunded backlog as the total backlog less the funded backlog. Our previous backlog policy for U.S. government contracts only included estimated future revenues for which funding had been appropriated by the customer. Our GS backlog does not include any estimate of future potential delivery orders that might be awarded under our government-wide acquisition contracts, agency-specific indefinite delivery/indefinite quantity contracts, or other multiple-award contract vehicles nor does it include option periods that have not been exercised by the customer. The modification to our backlog policy did not have a material impact to our historical GS backlog when implemented in the period ended September 30, 2016.
Within our GS business segment, we calculate estimated backlog for long-term contracts associated with the U.K. government's PFIs based on the aggregate amount that our client would contractually be obligated to pay us over the life of the project. We update our estimates of the future work to be executed under these contracts on a quarterly basis and adjust backlog if necessary.
38
We have included in the table below our proportionate share of unconsolidated joint ventures' estimated revenues. Since these projects are accounted for under the equity method, only our share of future earnings from these projects will be recorded in our results of operations. Our proportionate share of backlog for projects related to unconsolidated joint ventures totaled $7.4 billion at December 31, 2016 and $8.5 billion at December 31, 2015. We consolidate joint ventures which are majority-owned and controlled or are variable interest entities ("VIEs") in which we are the primary beneficiary. Our backlog included in the table below for projects related to consolidated joint ventures with noncontrolling interests includes 100% of the backlog associated with those joint ventures and totaled $151 million at December 31, 2016 and $285 million at December 31, 2015.
The following table summarizes our backlog by business segment:
Dollars in millions | December 31, 2015 | New Awards | Other (a) | Net Workoff (b) | December 31, 2016 | ||||||||||||||
Government Services | $ | 6,516 | $ | 1,847 | $ | 856 | $ | (1,398 | ) | $ | 7,821 | ||||||||
Technology & Consulting | 430 | 228 | 2 | (347 | ) | 313 | |||||||||||||
Engineering & Construction | 5,148 | 526 | (501 | ) | (2,404 | ) | 2,769 | ||||||||||||
Subtotal | 12,094 | 2,601 | 357 | (4,149 | ) | 10,903 | |||||||||||||
Non-strategic Business | 239 | — | 6 | (210 | ) | 35 | |||||||||||||
Total backlog | $ | 12,333 | $ | 2,601 | $ | 363 | $ | (4,359 | ) | $ | 10,938 | ||||||||
(a) | Other includes adjustments for (i) backlog acquired from acquisitions during the period of $1.0 billion, (ii) effects of changes in foreign exchange rates, primarily related to adverse movements in the British pound of $(1.1) billion, (iii) changes in scope on existing projects of $2.1 billion and (iv) elimination of our proportionate share of revenue workoff from our unconsolidated joint ventures of $(1.7) billion less equity in earnings |
(b) | These amounts represent the revenue workoff on our projects plus equity earnings from our unconsolidated joint venture projects. |
We estimate that as of December 31, 2016, 38% of our backlog will be executed within one year. Of this amount, 62% will be recognized in revenues on our consolidated statement of operations and 38% will be recorded by our unconsolidated joint ventures. As of December 31, 2016, $248 million of our backlog relates to active contracts that are in a loss position.
As of December 31, 2016, 16% of our backlog was attributable to fixed-price contracts, 55% was attributable to PFIs and 29% of our backlog was attributable to cost-reimbursable contracts. For contracts that contain both fixed-price and cost-reimbursable components, we classify the individual components as either fixed-price or cost-reimbursable according to the composition of the contract; however, for smaller contracts, we characterize the entire contract based on the predominant component. As of December 31, 2016, $7.1 billion of our GS backlog was currently funded by our customers.
Liquidity and Capital Resources
Engineering and construction projects generally require us to provide credit support for our performance obligations to our customers in the form of letters of credit, surety bonds or guarantees. Our ability to obtain new project awards in the future may be dependent on our ability to maintain or increase our letter of credit and surety bonding capacity, which may be further dependent on the timely release of existing letters of credit and surety bonds. As the need for credit support arises, letters of credit will be issued under our $1 billion Credit Agreement or arranged with our banks on a bilateral, syndicated or other basis. We believe we have adequate letter of credit capacity under our existing Credit Agreement and bilateral lines, as well as adequate surety bond capacity under our existing lines to support our operations and current backlog for the next 12 months.
Cash generated from operations and our Credit Agreement are our primary sources of liquidity. Our operating cash flow can vary significantly from year to year and is affected by the mix, terms, timing and percentage of completion of our engineering and construction projects. We sometimes receive cash in the early phases of our larger engineering and construction fixed-price projects and those of our consolidated joint ventures in advance of incurring related costs. On reimbursable contracts, we may utilize cash on hand or availability under our Credit Agreement to satisfy any periodic operating cash requirements for working capital, as we frequently incur costs and subsequently invoice our customers. We believe that existing cash balances, internally generated cash flows and our Credit Agreement availability are sufficient to support our day-to-day domestic and foreign business operations for at least the next 12 months.
39
Cash and equivalents totaled $536 million at December 31, 2016 and $883 million December 31, 2015 and consisted of the following:
December 31, | |||||||
Dollars in millions | 2016 | 2015 | |||||
Domestic cash | $ | 249 | $ | 360 | |||
International cash | 231 | 470 | |||||
Joint venture cash | 56 | 53 | |||||
Total | $ | 536 | $ | 883 | |||
Our cash balances are held in numerous accounts throughout the world to fund our global activities. Domestic cash relates to cash balances held by U.S. entities and is largely used to support project activities of those businesses as well as general corporate needs such as the payment of dividends to shareholders, repayment of debt and potential repurchases of our outstanding common stock.
Our international cash balances may be available for general corporate purposes but are subject to local restrictions, such as capital adequacy requirements and local obligations, including maintaining sufficient cash balances to support our underfunded U.K. pension plan and other obligations incurred in the normal course of business by those foreign entities. Repatriated foreign cash may become subject to U.S. income taxes. During 2016, as a result of strategic business acquisitions and previously announced estimated contract losses, we reevaluated our permanent reinvestment assertion of certain undistributed foreign earnings. As a result, we provided cumulative income taxes of $51 million on certain foreign earnings which provide us, if necessary, the ability to repatriate an additional $300 million of international cash without recognizing additional tax expense. As of December 31, 2016, we have repatriated approximately $93 million of this international cash. See Note 14 to our consolidated financial statements for further discussion regarding undistributed foreign earnings.
Joint venture cash balances reflect the amounts held by joint venture entities that we consolidate for financial reporting purposes. These amounts are limited to joint venture activities and are not readily available for general corporate purposes; however, portions of such amounts may become available to us in the future should there be a distribution of dividends to the joint venture partners. We expect that the majority of the joint venture cash balances will be utilized for the corresponding joint venture projects.
As of December 31, 2016, substantially all of our excess cash was held in commercial bank time deposits or interest bearing short-term investment accounts with the primary objectives of preserving capital and maintaining liquidity.
Cash Flows
Cash flows activities summary | ||||||||||||
Years ended December 31, | ||||||||||||
Dollars in millions | 2016 | 2015 | 2014 | |||||||||
Cash flows provided by operating activities | $ | 61 | $ | 47 | $ | 170 | ||||||
Cash flows (used in) provided by investing activities | (981 | ) | 101 | (44 | ) | |||||||
Cash flows provided by (used in) financing activities | 584 | (192 | ) | (210 | ) | |||||||
Effect of exchange rate changes on cash | (11 | ) | (43 | ) | (52 | ) | ||||||
Decrease in cash and equivalents | $ | (347 | ) | $ | (87 | ) | $ | (136 | ) | |||
Operating Activities. Cash flows from operating activities result primarily from earnings and are affected by changes in operating assets and liabilities which consist primarily of working capital balances for projects. Working capital levels vary from year to year and are primarily affected by the company's volume of work. These levels are also impacted by the mix, stage of completion and commercial terms of engineering and construction projects. Working capital requirements also vary by project depending on the type of client and location throughout the world. Most contracts require payments as the projects progress. Additionally, certain projects receive advance payments from clients. A normal trend for these projects is to have higher cash balances during the initial phases of execution which then decline to equal project earnings at the end of the construction phase. As a result, our cash position is reduced as customer advances are worked off, unless they are replaced by advances on other projects.
40
The primary components of our working capital accounts are accounts receivable, which includes retainage and trade receivables, costs and estimated earnings in excess of billings on uncompleted contracts ("CIE"), accounts payable and billings in excess of costs and estimated earnings on uncompleted contracts ("BIE"). These components are impacted by the size and changes in the mix of our cost reimbursable versus fixed price projects, and as a result, fluctuations in these components are not uncommon in our business.
Cash provided by operations totaled $61 million in 2016, primarily resulting from favorable net changes of $156 million in working capital balances for projects which were partially offset by a decrease in cash resulting from a net loss in 2016 as well as cash used in the items specified below:
• | Accounts receivable is impacted by the timing and collections on billings to our customers. The decrease in accounts receivable in 2016 is primarily due to collections from customers on three large EPC projects within our E&C business segment as well as collections of retainage and trade receivables associated with the substantial completion of a power project within our Non-strategic business segment. We also increased collections from customers on various projects in our T&C business segment. These decreases in accounts receivable were partially offset by increased billings on various Wyle and KTS projects and the expansion of existing U.S. government and other contracts within our GS business segment in 2016. |
• | Our CIE was impacted by the timing of billings to our customers and is generally related to our cost reimbursable projects where we bill as we incur project costs. In 2016, CIE decreased in our T&C and E&C business segments and was partially offset by the expansion of existing U.S. government and other projects in our GS business. |
• | Accounts payable is impacted by the timing of receipts of invoices from our vendors and subcontractors and payments on these invoices. The increase in accounts payable in 2016 was primarily due to a U.S. government project and other projects from the Wyle and KTS acquired within our GS business segment as well as the timing of invoicing and payments within the normal course of business. |
• | BIE is associated with our fixed price projects, which we generally structure to be cash positive, and is impacted by the timing of achievement of billing of milestones and payments received from our customers in advance of incurring project costs. The increase in BIE is due primarily to increases associated with two EPC ammonia projects in the U.S. in our E&C business segment partially offset by decreases from various projects in our T&C business segment and a power project in our Non-strategic business unit. |
• | In addition, we received distributions of earnings from our unconsolidated affiliates of $56 million and contributed $41 million to our pension funds in 2016. |
Cash provided by operations totaled $47 million in 2015. Cash generated from our earnings and net changes in working capital balances for projects remained relatively flat in 2015. The cash generated by earnings was partially offset by the other items as specified below:
• | Accounts receivable decreased primarily due to the timing of collections on customer billings related to projects within our E&C business segment including an EPC LNG project in Australia as well as several EPC power projects in the U.S. in our Non-strategic business segment. |
• | The decrease in CIE primarily reflected the timing of billings as we substantially completed execution of several major EPC projects within our E&C business segment. Additionally, CIE decreased on various projects in Canada prior to the deconsolidation of our Industrial Services Americas business in the third quarter of 2015. |
• | Accounts payable decreased in 2015 due to the timing of invoicing and payments within the normal course of business on an EPC LNG project in Australia and several EPC projects in the U.S. within our E&C business segment. Also contributing to the decrease were certain projects in Canada from our Industrial Services Americas business as well as various projects in the U.K. in our GS business segment and a power project in our Non-strategic business segment. |
• | In 2015, we received distributions of earnings from our unconsolidated affiliates of $92 million. We used $44 million for the net settlement of derivative contracts and contributed approximately $48 million to our pension funds in 2015. |
Cash provided by operations totaled $170 million in 2014. We generated cash from the net changes in working capital balances for projects of approximately $197 million in 2014. The cash generated by earnings was partially offset by the other items as specified below:
41
• | Accounts receivable decreased primarily due to the timing of collections on customer billings related to projects within our E&C business segment including an LNG project in Africa that was nearing completion and various other projects in Canada and the U.S. |
• | The increase in CIE in 2014 primarily reflected the timing of billings as we substantially completed execution of major projects within our E&C business segment partially offset by increases on U.S government contracts in our GS business segment. |
• | BIE increased in 2014, reflecting the timing of our achievement of billing milestones and the receipt of payment in advance of incurring costs related to a power project within our Non-strategic Business segment as well as several projects in our E&C business segment. |
• | We received distributions of earnings from our unconsolidated affiliates of $249 million. We used $40 million for the net settlement of derivative contracts and contributed approximately $48 million to our pension funds in 2014. |
Investing activities. Cash used in investing activities totaled $981 million in 2016 and was primarily due to the $911 million used in the acquisitions of Wyle and HTSI within our GS business segment and the acquisition of the three technology companies in our T&C business segment. We also invested an additional $56 million in the Brown & Root Industrial Services joint venture in North America within our E&C business segment for its acquisition of a turnaround and specialty welding company.
Cash provided by investing activities totaled $101 million in 2015 and was primarily due to proceeds from the sale of assets and investments within our Non-strategic Business segment.
Cash used in investing activities totaled $44 million in 2014 which was primarily due to purchases of property, plant and equipment associated with information technology projects which have now largely been canceled.
Financing activities. Cash provided by financing activities totaled $584 million in 2016 primarily due to $700 million in cash proceeds from borrowings under our Credit Agreement. These sources of cash were partially offset by payments on borrowings of $50 million and dividend payments to shareholders of $46 million.
Cash used in financing activities totaled $192 million in 2015 and included $40 million for our purchase of a noncontrolling interest in a joint venture, $47 million for dividend payments to shareholders, $62 million for the purchase of treasury stock and $28 million for distributions to noncontrolling interests.
Cash used in financing activities totaled $210 million in 2014 and included $106 million for the purchase of treasury stock, $47 million for dividend payments to shareholders and $61 million for distributions to noncontrolling interests. The uses of cash were partially offset by $10 million of investments from noncontrolling interests and $4 million of proceeds from the exercise of stock options.
Future sources of cash. We believe that future sources of cash include cash flows from operations, cash derived from working capital management, cash borrowings under our Credit Agreement and other permanent financing activities, as well as potential litigation proceeds including potential settlement of the PEMEX litigation discussed in Note 16 to our consolidated financial statements.
Future uses of cash. We believe that future uses of cash include working capital requirements, funding of recognized project losses, capital expenditures, dividends, repayments of borrowings under our Credit Agreement, share repurchases and strategic investments including acquisitions. Our capital expenditures will be focused primarily on facilities and equipment to support our businesses. In addition, we will use cash to fund pension obligations, payments under operating leases and various other obligations, including potential litigation payments, as they arise.
Other factors potentially affecting liquidity
Cash from operations can be significantly impacted by our primary working capital accounts as previously described. We expect unfavorable working capital impacts in 2017 related to project losses in our E&C business segment. These impacts on liquidity could be mitigated by proceeds from resolution of the EPC1 matter. See Note 16 to our consolidated financial statements under PEMEX and PEP Arbitration for further discussion.
42
Credit Agreement
Information relating to our Credit Agreement is described in Note 13 to our consolidated financial statements in Part II, Item 8 of this Annual Report on Form 10-K and the information discussed therein is incorporated by reference into this Part II, Item 7.
Nonrecourse Project Finance Debt
Information relating to our nonrecourse project debt is described in Note 13 to our consolidated financial statements in Part II, Item 8 of this Annual Report on Form 10-K and the information discussed therein is incorporated by reference into this Part II, Item 7.
Off-Balance Sheet Arrangements
Letters of credit, surety bonds and guarantees. Information relating to our nonrecourse project debt is described in Note 13 to our consolidated financial statements in Part II, Item 8 of this Annual Report on Form 10-K and the information discussed therein is incorporated by reference into this Part II, Item 7.
Commitments and other contractual obligations. The following table summarizes our significant contractual obligations and other long-term liabilities as of December 31, 2016:
Payments Due | |||||||||||||||||||||||||||
Dollars in millions | 2017 | 2018 | 2019 | 2020 | 2021 | Thereafter | Total | ||||||||||||||||||||
Operating leases (a) | $ | 97 | $ | 85 | $ | 75 | $ | 66 | $ | 61 | $ | 324 | $ | 708 | |||||||||||||
Purchase obligations (b) | 8 | 6 | 5 | 3 | 3 | 1 | 26 | ||||||||||||||||||||
Pension funding obligation (c) | 36 | 35 | 35 | 35 | 35 | 240 | 416 | ||||||||||||||||||||
Revolving credit agreement | — | — | — | 650 | — | — | 650 | ||||||||||||||||||||
Interest (d) | 15 | 15 | 15 | 11 | — | — | 56 | ||||||||||||||||||||
Nonrecourse project finance debt | 8 | 9 | 10 | 10 | 5 | 1 | 43 | ||||||||||||||||||||
Total (e) | $ | 164 | $ | 150 | $ | 140 | $ | 775 | $ | 104 | $ | 566 | $ | 1,899 | |||||||||||||
(a) | Amounts presented are net of subleases. |
(b) | In the ordinary course of business, we enter into commitments for the purchase or lease of software, materials, supplies and similar items. The purchase obligations can span several years depending on the duration of the projects. The purchase obligations disclosed above do not include purchase obligations that we enter into with vendors in the normal course of business that support existing contracting arrangements with our customers. We expect to recover such obligations from our customers. |
(c) | Included in our pension obligations are payments related to our agreement with the trustees of our international plan. The agreement calls for minimum contributions of £28 million in 2016 through 2028. The foreign funding obligations were converted to U.S. dollars using the conversion rate as of December 31, 2016. KBR, Inc. has provided a guarantee for up to £95 million in support of Kellogg Brown & Root (U.K.) Limited's obligation to make payments to the plan in respect of its liability under the U.K. Pensions Act 1995. |
(d) | Determined based on borrowings outstanding at the end of 2016 using the interest rate in effect at that time and, for our outstanding long-term debt, concluding with the expiration date of the Credit Agreement. |
(e) | Not included in the total are uncertain tax positions recorded pursuant to Financial Accounting Standards Board ("FASB") Accounting Standards Codification ("ASC") 740 - Income Taxes, which totaled $261 million as of December 31, 2016. The ultimate timing of settlement of these obligations cannot be determined with reasonable assurance and have been excluded from the table above. See Note 14 to our consolidated financial statements for further discussion on income taxes. |
43
Transactions with Joint Ventures
We perform many of our projects through incorporated and unincorporated joint ventures. In addition to participating as a joint venture partner, we often provide engineering, procurement, construction, operations or maintenance services to the joint venture as a subcontractor. Where we provide services to a joint venture that we control and therefore consolidate for financial reporting purposes, we eliminate intercompany revenues and expenses on such transactions. In situations where we account for our interest in the joint venture under the equity method of accounting, we do not eliminate any portion of our subcontractor revenues or expenses. We recognize the profit on our services provided to joint ventures that we consolidate and joint ventures that we record under the equity method of accounting primarily using the percentage-of-completion method. See Note 11 to our consolidated financial statements in Part II, Item 8 of this Annual Report on Form 10-K for more information. The information discussed therein is incorporated by reference into this Part II, Item 7.
Recent Accounting Pronouncements
Information relating to recent accounting pronouncements is described in Note 22 to our consolidated financial statements in Part II, Item 8 of this Annual Report on Form 10-K and the information discussed therein is incorporated by reference into this Part II, Item 7.
U.S. Government Matters
Information relating to U.S. government matters commitments and contingencies is described in Note 15 to our consolidated financial statements in Part II, Item 8 of this Annual Report on Form 10-K and the information discussed therein is incorporated by reference into this Part II, Item 7.
Legal Proceedings
Information relating to various commitments and contingencies is described in Note 15 and 16 to our consolidated financial statements in Part II, Item 8 of this Annual Report on Form 10-K and the information discussed therein is incorporated by reference into this Part II, Item 7.
Critical Accounting Policies and Estimates
The discussion and analysis of our financial condition and results of operations is based upon our consolidated financial statements which have been prepared in conformity with accounting principles generally accepted in the U.S. ("U.S. GAAP"). The preparation of our consolidated financial statements requires us to make estimates and judgments that affect the determination of financial positions, cash flows, results of operations and related disclosures. Our accounting policies are more fully described in Note 1 to our consolidated financial statements. Our critical accounting policies are described below to provide a better understanding of our estimates and assumptions about future events that affect the amounts reported in the consolidated financial statements and accompanying notes. Significant accounting estimates are important to the representation of our financial position and results of operations and involve our most difficult, subjective or complex judgments. We base our estimates on historical experience and on various other assumptions we believe to be reasonable according to the current facts and circumstances through the date of the issuance of our financial statements.
Accounting for Government Contracts. Some of the services provided to the U.S. government are performed on cost-reimbursable contracts. Generally, these contracts may contain base fees (a fixed profit percentage applied to our estimated costs to complete the work).
Revenues are recognized at the time services are performed, and such revenues include base fees, estimated direct project costs incurred and an allocation of indirect costs. Indirect costs are applied using rates approved by our government customers. The general, administrative and overhead cost reimbursement rates are estimated periodically in accordance with government contract accounting regulations and may change based on actual costs incurred or based upon the volume of work performed. Revenues are reduced for our estimate of costs that either are in dispute with our customer or have been identified as potentially unallowable pursuant to the terms of the contract or the federal acquisition regulations.
44
Some of our U.S. government contracts include award fees, which are earned based on the client’s evaluation of our performance. When we have significant history with the client on which we earn award fees, we recognize award fees as work on the contracts is performed. That history and management's evaluation and monitoring of performance form the basis for our ability to estimate such fees over the life of the contract. Where we do not have significant history with the client, we recognize award fees when they are awarded by the client. Revisions to these estimates may result in increases or decreases to revenue and income, and are reflected in the financial statements in periods in which they are identified. Historically, revisions to these estimates have not had a material effect on our results of operations.
Similar to many cost-reimbursable contracts, these government contracts are typically subject to audit and adjustment by our customer. Each contract is unique; therefore, the level of confidence in our estimates for audit adjustments varies depending on how much historical data we have with a particular contract. KBR excludes from billings to the U.S. government costs that are expressly unallowable, or mutually agreed to be unallowable, or not allocable to government contracts based on the applicable regulations. Revenues recorded for government contract work are reduced for our estimate of potentially unallowable costs related to issues that may be categorized as disputed or unallowable as a result of cost overruns or the audit process. Our estimates of potentially unallowable costs are based upon, among other things, our internal analysis of the facts and circumstances, terms of the contracts and the applicable provisions of the FAR, quality of supporting documentation for costs incurred and subcontract terms, as applicable. From time to time, we engage outside counsel to advise us in determining whether certain costs are allowable. We also review our analysis and findings with the administrative contracting officer ("ACO"), as appropriate. In some cases, we may not reach agreement with the DCAA or the ACO regarding potentially unallowable costs which may result in our filing of claims in various courts such as the Armed Services Board of Contract Appeals ("ASBCA") or the U.S. Court of Federal Claims ("COFC"). We only include amounts in revenues related to disputed and potentially unallowable costs when we determine it is probable that such costs will result in revenue. We generally do not recognize additional revenues for disputed or potentially unallowable costs for which revenues have been previously reduced until we reach agreement with the DCAA or the ACO that such costs are allowable.
Engineering and Construction Contracts. Revenues from the performance of contracts for which specifications are provided by the customer for the construction of facilities, the production of goods or the provision of related services is accounted for using the percentage-of-completion method. These contracts include services essential to the construction or production of tangible property, such as design, EPC and EPC management. We account for these contracts in accordance with ASC 605-35, Revenue Recognition, Construction-Type and Production-Type Contracts.
At the outset of each contract, we prepare a detailed analysis of our estimated cost to complete the project. Risks relating to service delivery, cost and usage of materials, labor cost and productivity, the impact of change orders, liability claims, contract disputes, achievement of contractual performance requirements and other factors require judgment in the estimation process. On certain projects, we provide guaranteed completion dates and/or achievement of other performance criteria. Failure to meet schedule or performance guarantees could result in unrealized incentives or liquidated damages. Additionally, increases in contract cost can result in non-recoverable cost which could exceed revenue realized from the projects. We generally provide limited warranties for work performed under engineering and construction contracts. The warranty periods typically extend for a limited duration following substantial completion of our work on the project. Historically, warranty claims have not resulted in material costs incurred, and any estimated costs for warranties are included in the individual project cost estimates for purposes of accounting long-term contracts.
We measure the progress towards completion of the project to determine the amount of revenues and profit to be recognized in each reporting period. Profit is recorded based upon the product of estimated contract profit-at-completion times the current percentage-complete for the contract. Our progress estimates are based upon estimates of the total cost to complete the project, which considers, among other things, the current project schedule and anticipated completion date, as well as estimates of the extent of progress toward completion. While progress is generally based upon costs incurred in relation to total estimated costs at completion, we also use alternative methods including physical progress, labor hours incurred to total estimated labor hours at completion or others depending on the type of project.
Our estimate of total revenues includes estimates of probable liquidated damages and certain probable claims and unapproved change orders. When estimating the amount of total gross profit or loss on a contract, we include certain probable unapproved change orders or claims to our clients as adjustments to revenues and claims to vendors, subcontractors and others as adjustments to total estimated costs. Probable claims against our clients are recorded up to the extent of the lesser of the amounts management expects to recover or actual costs incurred and include no profit until such time as they are finalized and approved. As of December 31, 2016 and 2015, we had recorded $28 million and $46 million, respectively, of claim revenue for costs incurred to date and such costs are included in the contract cost estimates. See Note 6 to our consolidated financial statements for our discussion on unapproved change orders and claims.
45
At least quarterly, significant projects are reviewed by management. We have a long history of working with multiple types of projects and in preparing cost estimates. However, there are many factors that impact future costs, including but not limited to weather, inflation, labor and community disruptions, timely availability of materials, productivity and other factors as outlined in “Item 1A. Risk Factors” contained in Part I of this Annual Report on Form 10-K. These factors can affect the accuracy of our estimates and materially impact our future reported earnings.
For contracts containing multiple deliverables we analyze each activity within the contract to ensure that we adhere to the separation guidelines of ASC 605 - Revenue Recognition and ASC 605-25 - Multiple-Element Arrangements.
Estimated Losses on Uncompleted Contracts and Changes in Contract Estimates. We record provisions for total estimated losses on uncompleted contracts in the period in which such losses are identified. The cumulative effects of revisions to contract revenues and estimated completion costs are recorded in the accounting period in which the amounts become evident and can be reasonably estimated. These revisions can include such items as the effects of change orders and claims, warranty claims, liquidated damages or other contractual penalties, adjustments for audit findings on U.S. government contracts and contract closeout settlements. Information relating to our changes in estimates is discussed in Note 2 to our consolidated financial statements in Part II, Item 8 of this Annual Report on Form 10-K and the information discussed therein is incorporated by reference into this Part II, Item 7.
Purchased intangible assets. When determining the fair values of assets acquired, liabilities assumed and non-controlling interests in the acquiree, management makes significant estimates and assumptions, especially with respect to intangible assets. Critical estimates in valuing intangible assets include, but are not limited to, expected future cash flows, which includes consideration of future growth rates and margins, attrition rates, future changes in technology and brand awareness, loyalty and position, and discount rates. Fair value estimates are based on the assumptions management believes a market participant would use in pricing the asset or liability. Amounts recorded in a business combination may change during the measurement period, which is a period not to exceed one year from the date of acquisition, as additional information about conditions existing at the acquisition date becomes available.
Goodwill Impairment Testing. Our October 1, 2016 annual impairment test for goodwill was a quantitative analysis using a two-step process that involves comparing the estimated fair value of each reporting unit to its carrying value, including goodwill. The fair values of reporting units were determined using a combination of two methods, one utilizing market revenue and earnings multiples (the market approach) and the other derived from discounted cash flow models with estimated cash flows based on internal forecasts of revenues and expenses over a specified period plus a terminal value (the income approach).
Under the market approach, we estimate fair value by applying earnings and revenue market multiples ranging from 3.78 to 11.39 times earnings and 0.27 to 2.02 times revenue. The income approach estimates fair value by discounting each reporting unit’s estimated future cash flows using a weighted-average cost of capital that reflects current market conditions and the risk profile of the reporting unit. To arrive at our future cash flows, we use estimates of economic and market assumptions, including growth rates in revenues, costs, estimates of future expected changes in operating margins, tax rates and cash expenditures. Future revenues are also adjusted to match changes in our business strategy. The risk-adjusted discount rates applied to our future cash flows under the income approach ranged from 10.4% to 12.8%. We believe these two approaches are appropriate valuation techniques and we generally weight the two resulting values equally as an estimate of a reporting unit's fair value for the purposes of our impairment testing. However, we may weigh one value more heavily than the other when conditions merit doing so. Other significant estimates and assumptions include terminal value growth rates, future estimates of capital expenditures and changes in future working capital requirements. The fair value derived from the weighting of these two methods provides appropriate valuations that, in the aggregate, reasonably reconcile to our market capitalization, taking into account observable control premiums.
In addition to the earnings and revenue multiples and the discount rates disclosed above, certain other judgments and estimates are used in our goodwill impairment test. Given this, if market conditions change compared to those used in our market approach, or if actual future results of operations fall below the projections used in the income approach, our goodwill could become impaired in the future.
At the annual testing date of October 1, 2016, our market capitalization exceeded the carrying value of our consolidated net assets by $1 billion and the fair value of all our reporting units exceeded their respective carrying amounts as of that date.
The fair value for two reporting units in our E&C business segment with goodwill of $57 million and $65 million, exceeded their carrying values by 36% and 65%, respectively, based on projected growth rates and other market inputs that are more sensitive to the risk of future variances due to competitive market conditions and reporting unit project execution. If future variances for these assumptions are negative and significant, the fair value of these reporting units may not substantially exceed their carrying values in future periods.
46
Deferred Taxes and Tax Contingencies. As discussed in Note 14 to our consolidated financial statements, deferred tax assets and liabilities are recognized for the expected future tax consequences of events that have been recognized in our consolidated financial statements or tax returns. As of December 31, 2016, we had deferred tax assets of $757 million which were partially offset by a valuation allowance of $542 million and further reduced by deferred tax liabilities of $245 million. The valuation allowance reduces certain deferred tax assets to amounts that are more-likely-than-not to be realized. The allowance for 2016 primarily relates to the deferred tax assets on certain net operating loss carryforwards for U.S. and non-U.S. subsidiaries. We evaluate the realizability of our deferred tax assets by assessing the valuation allowance and by adjusting the amount of such allowance, if necessary. The factors used to assess the likelihood of realization are the company's forecast of future taxable income and available tax planning strategies that could be implemented to realize the net deferred tax assets. Failure to achieve forecasted taxable income in the applicable taxing jurisdictions could affect the ultimate realization of deferred tax assets and could result in an increase in the company's effective tax rate on future earnings.
Income tax positions must meet a more-likely-than-not recognition threshold to be recognized. Income tax positions that previously failed to meet the more-likely-than-not threshold are recognized in the first subsequent financial reporting period in which that threshold is met. Previously recognized tax positions that no longer meet the more-likely-than-not threshold are derecognized in the first subsequent financial reporting period in which that threshold is no longer met. We recognize potential interest and penalties related to unrecognized tax benefits in income tax expense.
Legal and Investigation Matters. As discussed in Notes 15 and 16 to our consolidated financial statements, as of December 31, 2016 and 2015, we have accrued an estimate of the probable and estimable costs for the resolution of some of our legal and investigation matters. For other matters for which the liability is not probable and reasonably estimable, we have not accrued any amounts. Attorneys in our legal department monitor and manage all claims filed against us and review all pending investigations. Generally, the estimate of probable costs related to these matters is developed in consultation with internal and external legal counsel representing us. Our estimates are based upon an analysis of potential results, assuming a combination of litigation and settlement strategies. The precision of these estimates and the likelihood of future changes depend on a number of underlying variables and a range of possible outcomes. We attempt to resolve these matters through settlements, mediation and arbitration proceedings, when possible. If the actual settlement costs, final judgments or fines, differ from our estimates after appeals, our future financial results may be materially and adversely affected. We record adjustments to our initial estimates of these types of contingencies in the periods when the change in estimate is identified.
Pensions. Our pension benefit obligations and expenses are calculated using actuarial models and methods. Two of the more critical assumptions and estimates used in the actuarial calculations are the discount rate for determining the current value of benefit obligations and the expected rate of return on plan assets. Other assumptions and estimates used in determining benefit obligations and plan expenses include inflation rates and demographic factors such as retirement age, mortality and turnover. These assumptions and estimates are evaluated periodically and are updated accordingly to reflect our actual experience and expectations.
The discount rate used to determine the benefit obligations was computed using a yield curve approach that matches plan specific cash flows to a spot rate yield curve based on high quality corporate bonds. The expected long-term rate of return on assets was determined by a stochastic projection that takes into account asset allocation strategies, historical long-term performance of individual asset classes, an analysis of additional return (net of fees) generated by active management, risks using standard deviations and correlations of returns among the asset classes that comprise the plans' asset mix. Plan assets are comprised primarily of equity securities, fixed income funds and securities, hedge funds, real estate and other funds. As we have both domestic and international plans, these assumptions differ based on varying factors specific to each particular country or economic environment.
The discount rate utilized to calculate the projected benefit obligation at the measurement date for our U.S. pension plan increased to 3.73% at December 31, 2016 from 3.42% at December 31, 2015. The discount rate utilized to determine the projected benefit obligation at the measurement date for our U.K. pension plan, which constitutes 96% of all plans, decreased to 2.60% at December 31, 2016 from 3.75% at December 31, 2015. Our expected long-term rates of return on plan assets utilized at the measurement date increased to 5.00% from 4.81% for our U.S. pension plans and decreased to 6.10% from 6.25% for our U.K. pension plans, for the years ended December 31, 2016 and 2015, respectively.
47
The following table illustrates the sensitivity to changes in certain assumptions, holding all other assumptions constant, for our pension plans:
Effect on | |||||||||||
Pretax Pension Cost in 2017 | Pension Benefit Obligation at December 31, 2016 | ||||||||||
Dollars in millions | U.S. | U.K. | U.S. | U.K. | |||||||
25-basis-point decrease in discount rate | — | 1 | 2 | 99 | |||||||
25-basis-point increase in discount rate | — | (1 | ) | (2 | ) | (93 | ) | ||||
25-basis-point decrease in expected long-term rate of return | 1 | 3 | N/A | N/A | |||||||
25-basis-point increase in expected long-term rate of return | — | (3 | ) | N/A | N/A | ||||||
Unrecognized actuarial gains and losses are generally recognized using the corridor method over a period of approximately 25 years, which represents a reasonable systematic method for amortizing gains and losses for the employee group. Our unrecognized actuarial gains and losses arise from several factors, including experience and assumption changes in the obligations and the difference between expected returns and actual returns on plan assets. The difference between actual and expected returns is deferred as an unrecognized actuarial gain or loss on our consolidated statement of comprehensive income (loss) and is recognized as a decrease or an increase in future pension expense. Our pretax unrecognized actuarial loss in accumulated other comprehensive loss at December 31, 2016 was $1 billion, of which $30 million is expected to be recognized as a component of our expected 2017 pension expense compared to $31 million in 2016.
The actuarial assumptions used in determining our pension benefits may differ materially from actual results due to changing market and economic conditions, higher or lower withdrawal rates and longer or shorter life spans of participants. While we believe that the assumptions used are appropriate, differences in actual experience, expectations, or changes in assumptions may materially affect our financial position or results of operations. Our actuarial estimates of pension benefit expense and expected pension returns of plan assets are discussed in Note 12 in the accompanying financial statements.
Item 7A. Quantitative and Qualitative Discussion about Market Risk
We invest excess cash and equivalents in short-term securities, primarily time deposits and money market funds, which carry a fixed rate of return. Additionally, a substantial portion of our cash balances are maintained in foreign countries.
We are exposed to market risk associated with changes in foreign currency exchange rates, which may adversely affect our results of operations and financial condition.
We are exposed to and use derivative instruments, such as foreign exchange forward contracts and options to hedge foreign currency risk related to non-functional currency assets and liabilities on our balance sheet. Each period, these balance sheet hedges are marked to market through earnings and the change in their fair value is largely offset by remeasurement of the underlying assets and liabilities. The fair value of these derivatives was not material to our consolidated balance sheet for the periods presented. For more information see Note 21 to our consolidated financial statements in Part II, Item 8 of this Annual Report on Form 10-K and the information discussed therein is incorporated by reference into this Part II, Item 7A.
Where possible, we limit exposure to foreign currency fluctuations on forecasted transactions through provisions in our contracts that require client payments in currencies corresponding to the currency in which costs are incurred. In addition to this natural hedge, we use foreign exchange forward contracts and options to hedge forecasted foreign currency sales and purchase transactions. These derivatives are generally designated as cash flow hedges and are carried at fair value. The effective portion of the gain or loss is initially reported as a component of accumulated other comprehensive income (loss), and upon occurrence of the forecasted transaction, is subsequently reclassified into the income or expense line item to which the hedged transaction relates. Changes in the fair value of (1) credit risk and forward points, (2) instruments deemed ineffective during the period, and (3) instruments that we do not designate as cash flow hedges, are recognized within our consolidated statements of operations. We do not hold or issue derivatives for trading purposes or make speculative investments in foreign currencies. The impact of our hedging activities associated with our operating exposures was not material to our consolidated financial statements for and during the years ended December 31, 2016, 2015 and 2014.
48
We are exposed to the effects of fluctuations in foreign exchange rates (primarily Australian Dollar, British Pound, Canadian Dollar, and Euro) on the translation of the financial statements of our foreign operations into our reporting currency. The impact of this translation to U.S. dollars is recognized as a cumulative translation adjustment in accumulated other comprehensive income (loss). We do not hedge our exposure to potential foreign currency translation adjustments.
We are exposed to market risk for changes in interest rates for borrowings under our Credit Agreement, of which there were $650 million at of December 31, 2016. Borrowings under our Credit Agreement bear interest at variable rates. Our weighted average interest rate for the year ended December 31, 2016 was 2.00%. We had no derivative financial instruments to manage interest rate risk related to outstanding borrowings. If interest rates were to increase by 50 basis points, pre-tax interest expense would increase by approximately $3 million in the next twelve months.
49
Item 8. Financial Statements and Supplementary Data
Page No. | ||
50
Report of Independent Registered Public Accounting Firm
The Board of Directors and Shareholders
KBR, Inc.:
We have audited the accompanying consolidated balance sheets of KBR, Inc. and subsidiaries as of December 31, 2016 and 2015, and the related consolidated statements of operations, comprehensive income (loss), shareholders’ equity, and cash flows for each of the years in the three‑year period ended December 31, 2016. In connection with our audits of the consolidated financial statements, we also have audited financial statement schedule II. These consolidated financial statements and financial statement schedule, are the responsibility of the Company’s management. Our responsibility is to express an opinion on these consolidated financial statements and financial statement schedule based on our audits.
We conducted our audits in accordance with the standards of the Public Company Accounting Oversight Board (United States). Those standards require that we plan and perform the audit to obtain reasonable assurance about whether the financial statements are free of material misstatement. An audit includes examining, on a test basis, evidence supporting the amounts and disclosures in the financial statements. An audit also includes assessing the accounting principles used and significant estimates made by management, as well as evaluating the overall financial statement presentation. We believe that our audits provide a reasonable basis for our opinion.
In our opinion, the consolidated financial statements referred to above present fairly, in all material respects, the financial position of KBR, Inc. and subsidiaries as of December 31, 2016 and 2015, and the results of their operations and their cash flows for each of the years in the three‑year period ended December 31, 2016, in conformity with U.S. generally accepted accounting principles. Also in our opinion, the related financial statement schedule, when considered in relation to the basic consolidated financial statements taken as a whole, presents fairly, in all material respects, the information set forth therin.
We also have audited, in accordance with the standards of the Public Company Accounting Oversight Board (United States), KBR, Inc.’s internal control over financial reporting as of December 31, 2016, based on criteria established in Internal Control - Integrated Framework (2013) issued by the Committee of Sponsoring Organizations of the Treadway Commission (COSO), and our report dated February 24, 2017 expressed an unqualified opinion on the effectiveness of the Company’s internal control over financial reporting.
Our report dated February 24, 2017, on the effectiveness of internal control over financial reporting as of December 31, 2016, contains an explanatory paragraph which states KBR, Inc. acquired Wyle Inc. and KBRwyle Technology Solutions, LLC (formerly Honeywell Technology Solutions Inc.) during 2016, and management excluded from its assessment of the effectiveness of KBR, Inc.’s internal control over financial reporting as of December 31, 2016, Wyle Inc. and KBRwyle Technology Solutions, LLC’s internal control over financial reporting associated with total assets of $1.2 billion, and total revenues of $487 million included in the consolidated financial statements of KBR, Inc. and subsidiaries as of and for the year ended December 31, 2016. Our audit of internal control over financial reporting of KBR, Inc. also excluded an evaluation of the internal control over financial reporting of Wyle Inc. and KBRwyle Technology Solutions, LLC.
/s/ KPMG LLP
Houston, Texas
February 24, 2017
51
KBR, Inc.
Consolidated Statements of Operations
(In millions, except for per share data)
Years ended December 31, | |||||||||||
2016 | 2015 | 2014 | |||||||||
Revenues | $ | 4,268 | $ | 5,096 | $ | 6,366 | |||||
Cost of revenues | (4,156 | ) | (4,771 | ) | (6,431 | ) | |||||
Gross profit (loss) | 112 | 325 | (65 | ) | |||||||
Equity in earnings of unconsolidated affiliates | 91 | 149 | 163 | ||||||||
General and administrative expenses | (143 | ) | (155 | ) | (239 | ) | |||||
Impairment of goodwill | — | — | (446 | ) | |||||||
Asset impairment and restructuring charges | (39 | ) | (70 | ) | (214 | ) | |||||
Gain on disposition of assets | 7 | 61 | 7 | ||||||||
Operating income (loss) | 28 | 310 | (794 | ) | |||||||
Other non-operating income | 5 | 2 | 17 | ||||||||
Income (loss) before income taxes and noncontrolling interests | 33 | 312 | (777 | ) | |||||||
Provision for income taxes | (84 | ) | (86 | ) | (421 | ) | |||||
Net income (loss) | (51 | ) | 226 | (1,198 | ) | ||||||
Net income attributable to noncontrolling interests | (10 | ) | (23 | ) | (64 | ) | |||||
Net income (loss) attributable to KBR | $ | (61 | ) | $ | 203 | $ | (1,262 | ) | |||
Net income (loss) attributable to KBR per share: | |||||||||||
Basic | $ | (0.43 | ) | $ | 1.40 | $ | (8.66 | ) | |||
Diluted | $ | (0.43 | ) | $ | 1.40 | $ | (8.66 | ) | |||
Basic weighted average common shares outstanding | 142 | 144 | 146 | ||||||||
Diluted weighted average common shares outstanding | 142 | 144 | 146 | ||||||||
Cash dividends declared per share | $ | 0.32 | $ | 0.32 | $ | 0.32 | |||||
See accompanying notes to consolidated financial statements.
52
KBR, Inc.
Consolidated Statements of Comprehensive Income (Loss)
(In millions)
Years ended December 31, | |||||||||||
2016 | 2015 | 2014 | |||||||||
Net income (loss) | $ | (51 | ) | $ | 226 | $ | (1,198 | ) | |||
Other comprehensive income (loss), net of tax: | |||||||||||
Foreign currency translation adjustments: | |||||||||||
Foreign currency translation adjustments, net of tax | 7 | (68 | ) | (71 | ) | ||||||
Reclassification adjustment included in net income | — | 4 | 1 | ||||||||
Foreign currency translation adjustments, net of tax of $(3), $(3) and $4 | 7 | (64 | ) | (70 | ) | ||||||
Pension and post-retirement benefits, net of tax: | |||||||||||
Actuarial gains (losses), net of tax | (249 | ) | 71 | (96 | ) | ||||||
Reclassification adjustment included in net income | 24 | 39 | 34 | ||||||||
Pension and post-retirement benefits, net of taxes of $45, $(22) and $10 | (225 | ) | 110 | (62 | ) | ||||||
Changes in fair value of derivatives: | |||||||||||
Changes in fair value of derivatives, net of tax | — | — | (2 | ) | |||||||
Reclassification adjustment included in net income | (1 | ) | 1 | — | |||||||
Changes in fair value of derivatives, net of taxes of $0, $0 and $0 | (1 | ) | 1 | (2 | ) | ||||||
Other comprehensive income (loss), net of tax | (219 | ) | 47 | (134 | ) | ||||||
Comprehensive income (loss) | (270 | ) | 273 | (1,332 | ) | ||||||
Less: Comprehensive income attributable to noncontrolling interests | (10 | ) | (25 | ) | (66 | ) | |||||
Comprehensive income (loss) attributable to KBR | $ | (280 | ) | $ | 248 | $ | (1,398 | ) | |||
See accompanying notes to consolidated financial statements.
53
KBR, Inc.
Consolidated Balance Sheets
(In millions, except share data)
December 31, | |||||||
2016 | 2015 | ||||||
Assets | |||||||
Current assets: | |||||||
Cash and equivalents | $ | 536 | $ | 883 | |||
Accounts receivable, net of allowance for doubtful accounts of $14 and $17 | 592 | 628 | |||||
Costs and estimated earnings in excess of billings on uncompleted contracts ("CIE") | 416 | 224 | |||||
Claims receivable | 400 | — | |||||
Other current assets | 103 | 109 | |||||
Total current assets | 2,047 | 1,844 | |||||
Claims and accounts receivable | 131 | 526 | |||||
Property, plant, and equipment, net of accumulated depreciation of $324 and $352 (including net PPE of $36 and $48 owned by a variable interest entity) | 145 | 169 | |||||
Goodwill | 959 | 324 | |||||
Intangible assets, net of accumulated amortization of $100 and $91 | 248 | 35 | |||||
Equity in and advances to unconsolidated affiliates | 369 | 281 | |||||
Deferred income taxes | 118 | 99 | |||||
Other assets | 127 | 134 | |||||
Total assets | $ | 4,144 | $ | 3,412 | |||
Liabilities and Shareholders’ Equity | |||||||
Current liabilities: | |||||||
Accounts payable | $ | 535 | $ | 438 | |||
Billings in excess of costs and estimated earnings on uncompleted contracts ("BIE") | 552 | 509 | |||||
Accrued salaries, wages and benefits | 171 | 173 | |||||
Nonrecourse project debt | 9 | 10 | |||||
Other current liabilities | 292 | 263 | |||||
Total current liabilities | 1,559 | 1,393 | |||||
Pension obligations | 526 | 333 | |||||
Employee compensation and benefits | 113 | 105 | |||||
Income tax payable | 78 | 78 | |||||
Deferred income taxes | 149 | 94 | |||||
Nonrecourse project debt | 34 | 51 | |||||
Revolving credit agreement | 650 | — | |||||
Deferred income from unconsolidated affiliates | 90 | 100 | |||||
Other liabilities | 200 | 206 | |||||
Total liabilities | 3,399 | 2,360 | |||||
KBR shareholders’ equity: | |||||||
Preferred stock, $0.001 par value, 50,000,000 shares authorized, 0 shares issued and outstanding | — | — | |||||
Common stock, $0.001 par value, 300,000,000 shares authorized, 175,913,310 and 175,108,100 shares issued, and 142,803,782 and 142,058,356 shares outstanding | — | — | |||||
Paid-in capital in excess of par ("PIC") | 2,088 | 2,070 | |||||
Accumulated other comprehensive loss ("AOCL") | (1,050 | ) | (831 | ) | |||
Retained earnings | 488 | 595 | |||||
Treasury stock, 33,109,528 shares and 33,049,744 shares, at cost | (769 | ) | (769 | ) | |||
Total KBR shareholders’ equity | 757 | 1,065 | |||||
Noncontrolling interests | (12 | ) | (13 | ) | |||
Total shareholders’ equity | 745 | 1,052 | |||||
Total liabilities and shareholders’ equity | $ | 4,144 | $ | 3,412 | |||
See accompanying notes to consolidated financial statements.
54
KBR, Inc.
Consolidated Statements of Shareholders’ Equity
(In millions)
December 31, | |||||||||||
2016 | 2015 | 2014 | |||||||||
Balance at January 1, | $ | 1,052 | $ | 935 | $ | 2,439 | |||||
Acquisition of noncontrolling interest | — | (40 | ) | — | |||||||
Share-based compensation | 18 | 18 | 22 | ||||||||
Common stock issued upon exercise of stock options | — | 1 | 4 | ||||||||
Tax benefit decrease related to share-based plans | 1 | — | — | ||||||||
Dividends declared to shareholders | (46 | ) | (47 | ) | (47 | ) | |||||
Repurchases of common stock | (4 | ) | (62 | ) | (106 | ) | |||||
Issuance of employee stock purchase plan ("ESPP") shares | 3 | 5 | 4 | ||||||||
Investments by noncontrolling interests | — | — | 10 | ||||||||
Distributions to noncontrolling interests | (9 | ) | (28 | ) | (61 | ) | |||||
Other noncontrolling interests activity | — | (3 | ) | 2 | |||||||
Comprehensive income (loss) | (270 | ) | 273 | (1,332 | ) | ||||||
Balance at December 31, | $ | 745 | $ | 1,052 | $ | 935 | |||||
See accompanying notes to consolidated financial statements.
55
KBR, Inc. Consolidated Statements of Cash Flows (In millions) | |||||||||||
Years ended December 31, | |||||||||||
2016 | 2015 | 2014 | |||||||||
Cash flows from operating activities: | |||||||||||
Net income (loss) | $ | (51 | ) | $ | 226 | $ | (1,198 | ) | |||
Adjustments to reconcile net income to net cash provided by operating activities: | |||||||||||
Depreciation and amortization | 45 | 39 | 72 | ||||||||
Equity in earnings of unconsolidated affiliates | (91 | ) | (149 | ) | (163 | ) | |||||
Deferred income tax expense | 18 | 14 | 353 | ||||||||
Gain on disposition of assets | (7 | ) | (61 | ) | (7 | ) | |||||
Gain on negotiated settlement with former parent | — | — | (24 | ) | |||||||
Impairment of goodwill | — | — | 446 | ||||||||
Asset impairment | 16 | 31 | 171 | ||||||||
Other | 3 | 21 | 11 | ||||||||
Changes in operating assets and liabilities, net of acquired businesses: | |||||||||||
Accounts receivable, net of allowance for doubtful accounts | 121 | 41 | 170 | ||||||||
Costs and estimated earnings in excess of billings on uncompleted contracts | 8 | 224 | (107 | ) | |||||||
Accounts payable | (6 | ) | (274 | ) | (10 | ) | |||||
Billings in excess of costs and estimated earnings on uncompleted contracts | 33 | (2 | ) | 144 | |||||||
Accrued salaries, wages and benefits | (50 | ) | (8 | ) | (29 | ) | |||||
Reserve for loss on uncompleted contracts | (5 | ) | (94 | ) | 57 | ||||||
(Advances to) payments from unconsolidated affiliates, net | (1 | ) | 10 | 13 | |||||||
Distributions of earnings from unconsolidated affiliates | 56 | 92 | 249 | ||||||||
Income taxes payable | (52 | ) | 26 | 14 | |||||||
Pension funding | (41 | ) | (48 | ) | (48 | ) | |||||
Retainage payable | (2 | ) | (2 | ) | (16 | ) | |||||
Subcontractor advances | 8 | (12 | ) | (3 | ) | ||||||
Net settlement of derivative contracts | (9 | ) | (44 | ) | (40 | ) | |||||
Other assets and liabilities | 68 | 17 | 115 | ||||||||
Total cash flows provided by operating activities | 61 | 47 | 170 | ||||||||
Cash flows from investing activities: | |||||||||||
Purchases of property, plant and equipment | (11 | ) | (10 | ) | (53 | ) | |||||
Payments for investments in equity method joint ventures | (61 | ) | (19 | ) | — | ||||||
Proceeds from sale of assets or investments | 2 | 130 | 9 | ||||||||
Acquisitions of businesses, net of cash acquired | (911 | ) | — | — | |||||||
Total cash flows (used in) provided by investing activities | $ | (981 | ) | $ | 101 | $ | (44 | ) | |||
56
KBR, Inc. Consolidated Statements of Cash Flows (In millions) | |||||||||||
Years ended December 31, | |||||||||||
2016 | 2015 | 2014 | |||||||||
Cash flows from financing activities: | |||||||||||
Payments to reacquire common stock | (4 | ) | (62 | ) | (106 | ) | |||||
Acquisition of noncontrolling interest | — | (40 | ) | — | |||||||
Investments from noncontrolling interests | — | — | 10 | ||||||||
Distributions to noncontrolling interests | (9 | ) | (28 | ) | (61 | ) | |||||
Payments of dividends to shareholders | (46 | ) | (47 | ) | (47 | ) | |||||
Net proceeds from issuance of common stock | — | 1 | 4 | ||||||||
Excess tax benefits from share-based compensation | 1 | — | — | ||||||||
Borrowings on revolving credit agreement | 700 | — | — | ||||||||
Payments on revolving credit agreement | (50 | ) | — | — | |||||||
Payments on short-term and long-term borrowings | (9 | ) | (11 | ) | (11 | ) | |||||
Other | 1 | (5 | ) | 1 | |||||||
Total cash flows provided by (used in) financing activities | 584 | (192 | ) | (210 | ) | ||||||
Effect of exchange rate changes on cash | (11 | ) | (43 | ) | (52 | ) | |||||
Decrease in cash and equivalents | (347 | ) | (87 | ) | (136 | ) | |||||
Cash and equivalents at beginning of period | 883 | 970 | 1,106 | ||||||||
Cash and equivalents at end of period | $ | 536 | $ | 883 | $ | 970 | |||||
Supplemental disclosure of cash flows information: | |||||||||||
Cash paid for interest | $ | 12 | $ | 10 | $ | 11 | |||||
Cash paid for income taxes (net of refunds) | $ | 49 | $ | 66 | $ | 37 | |||||
Noncash financing activities | |||||||||||
Dividends declared | $ | 12 | $ | 12 | $ | 12 | |||||
See accompanying notes to consolidated financial statements.
57
KBR, Inc.
Notes to Consolidated Financial Statements
Note 1. Description of Company and Significant Accounting Policies
KBR, Inc., a Delaware corporation, was formed on March 21, 2006 and is headquartered in Houston, Texas. KBR, Inc. and its wholly owned and majority-owned subsidiaries (collectively referred to herein as "KBR", "the Company", "we", "us" or "our") is a global provider of differentiated, professional services and technologies across the asset and program life-cycle within the government services and hydrocarbons industries. Our capabilities include highly-specialized engineering services, mission and logistics support solutions, technology licensing, consulting, procurement, construction, construction management, program management, operations, maintenance and other support services to a diverse customer base, including domestic and foreign governments, international and national oil and gas companies, independent refiners, petrochemical producers, fertilizer producers and manufacturers.
Principles of Consolidation
Our consolidated financial statements have been prepared in accordance with accounting principles generally accepted in the United States ("U.S. GAAP") and include the accounts of KBR and our wholly owned and majority-owned, controlled subsidiaries and variable interest entities ("VIEs") of which we are the primary beneficiary. We account for investments over which we have significant influence but not a controlling financial interest using the equity method of accounting. See Note 11 to our consolidated financial statements for further discussion on our equity investments and VIEs. The cost method is used when we do not have the ability to exert significant influence. All material intercompany balances and transactions of consolidated subsidiaries are eliminated.
Certain prior year amounts have been reclassified to conform to the current year presentation on the consolidated statements of operations, consolidated balance sheets and the consolidated statements of cash flows.
We have evaluated all events and transactions occurring subsequent to the date of the financial statements through the filing date of this annual report on Form 10-K.
Use of Estimates
The preparation of our consolidated financial statements in conformity with U.S. GAAP requires us to make estimates and assumptions that affect the reported amounts of assets and liabilities and disclosures of contingent assets and liabilities at the date of the consolidated financial statements and the reported amounts of revenues and expenses during the reporting period. Actual results could differ from those estimates. Areas requiring significant estimates and assumptions by our management include the following:
• | project revenues, costs and profits on engineering and construction contracts, including recognition of estimated losses on uncompleted contracts |
• | project revenues, award fees, costs and profits on government services contracts |
• | provisions for uncollectible receivables and client claims and recoveries of costs from subcontractors, vendors and others |
• | provisions for income taxes and related valuation allowances and tax uncertainties |
• | recoverability of goodwill |
• | recoverability of other intangibles and long-lived assets and related estimated lives |
• | recoverability of equity method and cost method investments |
• | valuation of pension obligations and pension assets |
• | accruals for estimated liabilities, including litigation accruals |
• | consolidation of VIEs |
• | valuation of share-based compensation |
• | valuation of assets and liabilities acquired in business combinations |
In accordance with normal practice in the construction industry, we include in current assets and current liabilities amounts related to construction contracts realizable and payable over a period in excess of one year. If the underlying estimates and assumptions upon which the financial statements are based change in the future, actual amounts may differ from those included in the accompanying consolidated financial statements.
58
Cash and Equivalents
We consider highly liquid investments with an original maturity of three months or less to be cash equivalents. See Note 4 to our consolidated financial statements for our discussion on cash and equivalents.
Revenue Recognition
Government Contracts
Certain services provided to the United States ("U.S.") government are performed on cost-reimbursable contracts. Generally, these contracts may contain base fees (a fixed profit percentage applied to our estimates of costs to complete the work) and award fees (a variable profit percentage applied to definitized costs, which is subject to our customer's discretion and tied to the specific performance measures defined in the contract, such as adherence to schedule, health and safety, quality of work, responsiveness, cost performance and business management).
Revenues are recognized at the time services are performed, and such revenues include base fees, actual direct project costs incurred and an allocation of indirect costs. Indirect costs are applied using rates approved by our government customers. The general, administrative and overhead cost reimbursement rates are estimated periodically in accordance with government contract accounting regulations and may change based on actual costs incurred or based upon the volume of work performed. Award fees are recognized when such fees are probable and estimable. Estimates of the total fee to be earned are made based on contract provisions, prior experience with similar contracts or clients and management’s evaluation of the performance on such contracts. Revenues are reduced for our estimate of costs that either are in dispute with our customer or have been identified as potentially unallowable pursuant to the terms of the contract or the federal acquisition regulations.
Engineering and Construction Contracts
Contracts. Revenues from contracts to provide construction, engineering, design or similar services are recognized using the percentage-of-completion method of accounting in accordance with Financial Accounting Standards Board ("FASB") Accounting Standards Codification ("ASC") 605 - Revenue Recognition. Depending on the type of job, progress is generally measured based upon costs incurred to date to total estimated costs at completion, man-hours expended to date to total man-hours estimated at completion or physical progress. Changes in total estimated contract costs and losses, if any, are provided for in the period they are determined. Certain claims and change orders that are in the process of negotiation with customers for additional work or changes in the scope of work are included in contract value when collection is deemed probable and the value can be reliably estimated.
Our work is performed under three general types of contracts: fixed-price contracts, cost-reimbursable plus a fee or mark-up contracts and "hybrid" contracts containing cost-reimbursable and fixed-price scopes. All contract types may be modified by cost escalation provisions or other risk sharing mechanisms and incentive and penalty provisions. During the term of a project, the contract or components of the contract may be renegotiated to include characteristics of a different contract type. When we negotiate any type of contract, we frequently are required to accomplish the scope of work and meet certain performance criteria within a specified time frame; otherwise, we could be assessed damages, which in some cases are agreed-upon liquidated damages. We include an estimate of liquidated damages in our estimates as a reduction of total contract value when it is deemed probable that they will be assessed. Profit is recorded based upon the product of estimated contract profit-at-completion times the current percentage-complete for the contract.
Fixed-price contracts, which include unit-rate contracts (essentially a fixed-price contract with the only variable being units of work performed), are for a fixed sum to cover all costs and any profit element for a defined scope of work. Fixed-price contracts entail significant risk to us because they require us to predetermine the work to be performed, the project execution schedule and the costs associated with the work. As a result, we may benefit or be penalized for cost variations from our original estimates. However, these contract prices may be adjusted for changes in scope of work, new or changing laws and regulations and other negotiated events.
Cost-reimbursable contracts include contracts where the price is variable based upon our actual costs incurred for time and materials and for reimbursable labor hour contracts. Profit on cost-reimbursable contracts may be a fixed amount, a mark-up applied to costs incurred or a combination of the two. Cost-reimbursable contracts are generally less risky than fixed-price contracts because the owner/customer retains many of the project risks.
59
Unapproved Change Orders and Claims. Revenues and gross profit on contracts can be significantly affected by change orders and claims that may not be approved by the customer until the later stages of a contract or subsequent to the date a project is completed. If it is not probable that the costs will be recovered through a change in contract price, the costs attributable to unapproved change orders and claims are treated as contract costs without incremental revenue. For certain contracts where it is probable that the costs will be recovered through a change order or resolution of a claim, total estimated contract revenue is increased by the lesser of the amounts management expects to recover or the costs expected to be incurred.
When estimating the amount of total gross profit or loss on a contract, we include unapproved change orders or claims to our clients as adjustments to revenues. We include claims to vendors, subcontractors and others as adjustments to total estimated costs. If we have a reasonable legal basis and amounts are probable, claims against others are recorded up to the extent of the lesser of the amounts management expects to recover or to costs incurred and include no profit until such time as they are finalized and approved. See Note 6 to our consolidated financial statements for our discussion on unapproved change orders and claims.
Services Contracts
Revenues for our services contracts are recorded as the services are rendered and the amounts are deemed realized or realizable and earned. Revenues are recognized when persuasive evidence of a customer arrangement exists, delivery has occurred or services have been rendered, the price to the customer is fixed and determinable, and collection of revenues is reasonably assured. Revenues associated with incentive fees for these contracts are recognized when earned.
Gross Profit
Gross profit represents business segment revenues less the cost of revenues, which includes business segment overhead costs directly attributable to execution of contracts by the business segment.
Contract Costs
Contract costs include all direct material and labor costs and those indirect costs related to contract performance. Indirect costs, included in cost of revenues, include charges for such items as facilities, engineering, project management, quality control, bids and proposals and procurement.
General and Administrative Expenses
Our general and administrative expenses represent corporate and segment overhead expenses that are not associated with the execution of the contracts. General and administrative expenses include charges for such items as executive management, corporate business development, information technology, finance and accounting, human resources and various other corporate functions.
Accounts Receivable
Accounts receivable are recorded at the invoiced amount based on contracted prices. Amounts collected on accounts receivable are included in net cash provided by operating activities in the consolidated statements of cash flows.
We establish an allowance for doubtful accounts based on the assessment of the clients’ willingness and ability to pay. In addition to such allowances, there are often items in dispute or being negotiated that may require us to make an estimate as to the ultimate outcome. Past due receivable balances are written off when our internal collection efforts have been unsuccessful in collecting the amounts due. See Note 5 to our consolidated financial statements for our discussion on accounts receivable.
Retainage, included in accounts receivable, represents amounts withheld from billings by our clients pursuant to provisions in the contracts and may not be paid to us until the completion of specific tasks or the completion of the project and, in some instances, for even longer periods. Retainage may also be subject to restrictive conditions such as performance guarantees. Our retainage receivable excludes amounts withheld by the U.S. government on certain contracts. See Note 15 to our consolidated financial statements for our discussion on U.S. government receivables.
60
Costs and Estimated Earnings in Excess of Billings on Uncompleted Contracts, Including Claims, and Advanced Billings and Billings in Excess of Costs and Estimated Earnings on Uncompleted Contracts
Billing practices are governed by the contract terms of each project based upon costs incurred, achievement of milestones or pre-agreed schedules. Billings do not necessarily correlate with revenue recognized using the percentage-of-completion method of accounting. Costs and estimated earnings in excess of billings on uncompleted contracts ("CIE") represent the excess of contract costs and profits recognized to date using the percentage-of-completion method over billings to date on certain contracts. Billings in excess of costs and estimated earnings on uncompleted contracts ("BIE") represents the excess of billings to date over the amount of contract costs and profits recognized to date using the percentage-of-completion method on certain contracts. For service-type contracts, revenues recognized in excess of amounts billed to the customer are recorded in CIE and amounts billed to the customer in excess of revenues recognized to date are recorded in BIE. With the exception of claims and change orders that we are in the process of negotiating with customers, unbilled receivables are usually billed during normal billing processes following achievement of the contractual requirements. We anticipate that substantially all incurred costs associated with unbilled receivables as of December 31, 2016 will be billed and collected in 2017. See Note 6 to our consolidated financial statements for our discussion on CIE and BIE.
Property, Plant and Equipment
Property, plant and equipment are reported at cost less accumulated depreciation except for those assets that have been written down to their fair values due to impairment. Expenditures for major additions and improvements are capitalized and minor replacements, maintenance and repairs are charged to expense as incurred. The cost of property, plant and equipment sold or otherwise disposed of and the related accumulated depreciation are removed from the accounts and any resulting gain or loss is included in operating income for the respective period. Depreciation is generally provided on the straight-line method over the estimated useful lives of the related assets. Leasehold improvements are amortized using the straight-line method over the shorter of the useful life of the improvement or the lease term. See Note 8 to our consolidated financial statements for our discussion on property, plant and equipment.
Goodwill and Intangible Assets
Goodwill is an asset representing the excess cost over the fair market value of net assets acquired in business combinations. In accordance with ASC 350 - Intangibles - Goodwill and Other, goodwill is not amortized but is tested annually for impairment or on an interim basis when indicators of potential impairment exist. Goodwill is tested for impairment at the reporting unit level. Our reporting units are our operating segments or components of operating segments where discrete financial information is available and segment management regularly reviews the operating results. For purposes of impairment testing, goodwill is allocated to the applicable reporting units based on the current reporting structure. If the fair value of a reporting unit exceeds its carrying value, the goodwill of the reporting unit is not considered impaired. If the carrying value of a reporting unit exceeds its fair value, a second step of the goodwill impairment test is performed to measure the amount of goodwill impairment. The second step compares the implied fair value of the reporting unit goodwill to the carrying value of the reporting unit goodwill. We determine the implied fair value of the goodwill in the same manner as determining the amount of goodwill to be recognized in a business combination. We completed our annual goodwill impairment test in the fourth quarter of 2016 and determined that none of the goodwill was impaired. See Note 9 to our consolidated financial statements for reported goodwill in each of our segments.
We had intangible assets with a carrying value of $248 million and $35 million as of December 31, 2016 and 2015, respectively. Intangible assets with indefinite lives are not amortized but are subject to annual impairment tests or on an interim basis when indicators of potential impairment exist. An intangible asset with an indefinite life is impaired if its carrying value exceeds its fair value. As of December 31, 2016, none of our intangible assets with indefinite lives were impaired. Intangible assets with finite lives are amortized on a straight-line basis over the useful life of those assets, ranging from 1 to 25 years. See Note 9 to our consolidated financial statements for further discussion of our intangible assets.
Investments
We account for non-marketable investments using the equity method of accounting if the investment gives us the ability to exercise significant influence over, but not control, of an investee. Significant influence generally exists if we have an ownership interest representing between 20% and 50% of the voting stock of the investee. Under the equity method of accounting, investments are stated at initial cost and are adjusted for subsequent additional investments and our proportionate share of earnings or losses and distributions.
61
Equity in earnings of unconsolidated affiliates, in the consolidated statements of operations, reflects our proportionate share of the investee's net income, including any associated affiliate taxes. Our proportionate share of the investee’s other comprehensive income (loss), net of income taxes, is recorded in the consolidated statements of shareholders’ equity and consolidated statements of comprehensive income (loss). In general, the equity investment in our unconsolidated affiliates is equal to our current equity investment plus those entities' undistributed earnings.
We evaluate our equity method investments for impairment at least annually or whenever events or changes in circumstances indicate, in management’s judgment, that the carrying value of an investment may have experienced an other-than-temporary decline in value. When evidence of loss in value has occurred, management compares the estimated fair value of the investment to the carrying value of the investment to determine whether an impairment has occurred. If the estimated fair value is less than the carrying value and management considers the decline in value to be other than temporary, the excess of the carrying value over the estimated fair value is recognized in the financial statements as an impairment. See Note 11 to our consolidated financial statements for our discussion on equity method investments.
Where we are unable to exercise significant influence over the investee, or when our investment balance is reduced to zero from our proportionate share of losses, the investments are accounted for under the cost method. Under the cost method, investments are carried at cost and adjusted only for other-than-temporary declines in fair value, distributions of earnings, or additional investments.
Variable Interest Entities
The majority of our joint ventures are VIEs. We account for VIEs in accordance with ASC 810 - Consolidation, which requires the consolidation of VIEs in which a company has both the power to direct the activities of the VIE that most significantly impact the VIE’s economic performance and the obligation to absorb losses or the right to receive the benefits from the VIE that could potentially be significant to the VIE. If a reporting enterprise meets these conditions then it has a controlling financial interest and is the primary beneficiary of the VIE. Our unconsolidated VIEs are accounted for under the equity method of accounting.
We assess all newly created entities and those with which we become involved to determine whether such entities are VIEs and, if so, whether or not we are their primary beneficiary. Most of the entities we assess are incorporated or unincorporated joint ventures formed by us and our partner(s) for the purpose of executing a project or program for a customer and are generally dissolved upon completion of the project or program. Many of our long-term energy-related construction projects are executed through such joint ventures. Typically, these joint ventures are funded by advances from the project owner, and accordingly, require little or no equity investment by the joint venture partners but may require subordinated financial support from the joint venture partners such as letters of credit, performance and financial guarantees or obligations to fund losses incurred by the joint venture. Other joint ventures, such as privately financed initiatives ("PFIs"), generally require the partners to invest equity and take an ownership position in an entity that manages and operates an asset after construction is complete.
As required by ASC 810 - Consolidation, we perform a qualitative assessment to determine whether we are the primary beneficiary once an entity is identified as a VIE. Thereafter, we continue to re-evaluate whether we are the primary beneficiary of the VIE in accordance with ASC 810 - Consolidation. A qualitative assessment begins with an understanding of the nature of the risks in the entity as well as the nature of the entity’s activities. These include the terms of the contracts entered into by the entity, ownership interests issued by the entity and how they were marketed and the parties involved in the design of the entity. We then identify all of the variable interests held by parties involved with the VIE including, among other things, equity investments, subordinated debt financing, letters of credit, financial and performance guarantees and contracted service providers. Once we identify the variable interests, we determine those activities which are most significant to the economic performance of the entity and which variable interest holder has the power to direct those activities. Though infrequent, some of our assessments reveal no primary beneficiary because the power to direct the most significant activities that impact the economic performance is held equally by two or more variable interest holders who are required to provide their consent prior to the execution of their decisions. Most of the VIEs with which we are involved have relatively few variable interests and are primarily related to our equity investment, significant service contracts and other subordinated financial support. See Note 11 to our consolidated financial statements for our discussion on variable interest entities.
62
In February 2015, the FASB issued Accounting Standards Update ("ASU") No. 2015-02, Consolidation (Topic 810) - Amendments to the Consolidation Analysis. This ASU amended the consolidation guidance for VIEs as well as general partners’ investments in limited partnerships and modified the evaluation of whether limited partnerships and similar legal entities are VIEs or voting interest entities. The amendments were effective for annual periods beginning after December 15, 2015 and interim periods within those annual periods. On January 1, 2016, we adopted ASU 2015-02. The adoption of this update did not have a material impact on our consolidated financial statements.
Acquisitions
We account for business combinations using the acquisition method of accounting in accordance with ASC 805 - Business Combinations, which allocates the fair value of the purchase consideration to the tangible and intangible assets acquired and liabilities assumed based on their estimated fair values. The excess of the purchase consideration over the fair values of these identifiable assets and liabilities is recorded as goodwill. We conduct external and internal valuations of certain acquired assets and liabilities for inclusion in our balance sheet as of the date of acquisition. Initial purchase price allocations are subject to revisions within the measurement period, not to exceed one year from the date of acquisition. Acquisition-related expenses and transaction costs associated with business combinations are expensed as incurred.
Deconsolidation of a Subsidiary
We account for a gain or loss on deconsolidation of a subsidiary or derecognition of a group of assets in accordance with ASC 810-10-40-5. We measure the gain or loss as the difference between (a) the aggregate of all the following: (1) the fair value of any consideration received (2) the fair value of any retained noncontrolling investment in the former subsidiary or group of assets at the date the subsidiary is deconsolidated or the group of assets is derecognized and (3) the carrying amount of any noncontrolling interest in the former subsidiary (including any accumulated other comprehensive income attributable to the noncontrolling interest) at the date the subsidiary is deconsolidated and (b) the carrying amount of the former subsidiary’s assets and liabilities or the carrying amount of the group of assets.
Pensions
We account for our defined benefit pension plans in accordance with ASC 715 - Compensation - Retirement Benefits, which requires an employer to:
• | recognize on its balance sheet the funded status (measured as the difference between the fair value of plan assets and the benefit obligation) of the pension plan; |
• | recognize, through comprehensive income, certain changes in the funded status of a defined benefit plan in the year in which the changes occur; |
• | measure plan assets and benefit obligations as of the end of the employer’s fiscal year; and |
• | disclose additional information. |
Our pension benefit obligations and expenses are calculated using actuarial models and methods. Two of the more critical assumptions and estimates used in the actuarial calculations are the discount rate for determining the current value of benefit obligations and the expected rate of return on plan assets. Other assumptions and estimates used in determining benefit obligations and plan expenses include inflation rates and demographic factors such as retirement age, mortality and turnover. These assumptions and estimates are evaluated periodically and are updated accordingly to reflect our actual experience and expectations.
The discount rate used to determine the benefit obligations was computed using a yield curve approach that matches plan specific cash flows to a spot rate yield curve based on high quality corporate bonds. The expected long-term rate of return on assets was determined by a stochastic projection that takes into account asset allocation strategies, historical long-term performance of individual asset classes, an analysis of additional return (net of fees) generated by active management, risks using standard deviations and correlations of returns among the asset classes that comprise the plans' asset mix. Plan assets are comprised primarily of equity securities, fixed income funds and securities, hedge funds, real estate and other funds. As we have both domestic and international plans, these assumptions differ based on varying factors specific to each particular country or economic environment.
63
Unrecognized actuarial gains and losses are generally recognized using the corridor method over a period of approximately 25 years, which represents a reasonable systematic method for amortizing gains and losses for the employee group. Our unrecognized actuarial gains and losses arise from several factors, including experience and assumption changes in the obligations and the difference between expected returns and actual returns on plan assets. The difference between actual and expected returns is deferred as an unrecognized actuarial gain or loss on our consolidated statement of comprehensive income (loss) and is recognized as a decrease or an increase in future pension expense.
Income Taxes
We recognize the amount of taxes payable or refundable for the year and deferred tax assets and liabilities for the expected future tax consequences of events that have been recognized in the financial statements or tax returns. We provide a valuation allowance for deferred tax assets if it is more likely than not that these items will not be realized. The effect on deferred tax assets and liabilities of a change in tax rates is recognized in income in the period that includes the enactment date. See Note 14 to our consolidated financial statements for our discussion on income taxes.
Income taxes are accounted for under the asset and liability method. Deferred tax assets and liabilities are recognized for the future tax consequences attributable to differences between the financial statement carrying amounts of existing assets and liabilities and their respective tax bases and operating loss and tax credit carryforwards. A current tax asset or liability is recognized for the estimated taxes refundable or payable on tax returns. Deferred tax assets and liabilities are measured using enacted tax rates expected to apply to taxable income in the years in which those temporary differences are expected to be recovered or settled. The effect on deferred tax assets and liabilities of a change in tax rates is recognized in income in the period that includes the enactment date.
In assessing the realizability of deferred tax assets, we consider whether it is more likely than not that some portion or all of the deferred tax assets will not be realized. The ultimate realization of deferred tax assets is dependent upon the generation of future taxable income during the periods in which those temporary differences become deductible. A valuation allowance is provided for deferred tax assets if it is more-likely-than-not that these items will not be realized. We consider the scheduled reversal of deferred tax liabilities, projected future taxable income and available tax planning strategies in making this assessment. Additionally, we use forecasts of certain tax elements such as taxable income and foreign tax credit utilization in making this assessment of realization. Given the inherent uncertainty involved with the use of such estimates and assumptions, there can be significant variation between estimated and actual results.
We have operations in numerous countries other than the United States. Consequently, we are subject to the jurisdiction of a significant number of taxing authorities. The income earned in these various jurisdictions is taxed on differing bases, including income actually earned, income deemed earned and revenue-based tax withholding. The final determination of our tax liabilities involves the interpretation of local tax laws, tax treaties and related authorities in each jurisdiction. Changes in the operating environment, including changes in tax law and currency/repatriation controls, could impact the determination of our tax liabilities for a tax year.
We recognize the effect of income tax positions only if it is more-likely-than-not that those positions will be sustained. Recognized income tax positions are measured at the largest amount that is greater than 50% likely of being realized. Changes in recognition or measurement are reflected in the period in which the change in judgment occurs. The company records potential interest and penalties related to unrecognized tax benefits in income tax expense.
Tax filings of our subsidiaries, unconsolidated affiliates and related entities are routinely examined by tax authorities in the normal course of business. These examinations may result in assessments of additional taxes, which we work to resolve with the tax authorities and through the judicial process. Predicting the outcome of disputed assessments involves some uncertainty. Factors such as the availability of settlement procedures, willingness of tax authorities to negotiate and the operation and impartiality of judicial systems vary across the different tax jurisdictions and may significantly influence the ultimate outcome. We review the facts for each assessment, and then utilize assumptions and estimates to determine the most likely outcome and provide taxes, interest and penalties as needed based on this outcome.
64
Derivative Instruments
We enter into derivative financial transactions to hedge existing or forecasted exposures to changing foreign currency exchange rates. We do not enter into derivative transactions for speculative or trading purposes. We recognize all derivatives at fair value on the balance sheet. Derivatives that are not accounted for as hedges under ASC 815 - Derivatives and Hedging, are adjusted to fair value and such changes are reflected in the results of operations. If the derivative is designated as a cash flow hedge under ASC 815, changes in the fair value of derivatives are recognized in other comprehensive income (loss) until the hedged item is recognized in earnings. The ineffective portion of a designated hedge's change in fair value is recognized in earnings. See Note 21 to our consolidated financial statements for our discussion on derivative instruments.
Recognized gains or losses on derivatives entered into to manage project related foreign exchange risk are included in gross profit. Foreign currency gains and losses for hedges of non-project related foreign exchange risk are reported within "other non-operating income" on our consolidated statements of operations.
Concentration of Credit Risk
Financial instruments which potentially subject our company to concentrations of credit risk consist principally of cash and cash equivalents, and trade receivables. Our cash is primarily held with major banks and financial institutions throughout the world. We believe the risk of any potential loss on deposits held in these institutions is minimal.
Contracts with clients usually contain standard provisions allowing the client to curtail or terminate contracts for convenience. Upon such a termination, we are generally entitled to recover costs incurred, settlement expenses and profit on work completed prior to termination and demobilization cost.
We have revenues and receivables from transactions with an external customer that amounts to 10% or more of our revenues (which are generally not collateralized). We generated significant revenues from transactions with the U.S. government within our GS business segment and with the Chevron Corporation ("Chevron"),within our E&C business segment, primarily from a major liquefied natural gas ("LNG") project in Australia which is nearing completion. No other customers represented 10% or more of consolidated revenues in any of the periods presented.
The following tables present summarized data related to our transactions with the U.S. government and Chevron.
Revenues from major customers: | |||||||||||
Years ended December 31, | |||||||||||
Dollars in millions | 2016 | 2015 | 2014 | ||||||||
U.S. government | $ | 1,090 | $ | 378 | $ | 321 | |||||
Chevron | $ | 105 | $ | 523 | $ | 1,069 | |||||
Percentages of revenues and accounts receivable from major customers: | ||||||||
Years ended December 31, | ||||||||
2016 | 2015 | 2014 | ||||||
U.S. government revenues percentage | 26 | % | 7 | % | 5 | % | ||
U.S. government receivables percentage | 27 | % | 4 | % | 6 | % | ||
Chevron revenues percentage | 2 | % | 10 | % | 17 | % | ||
Chevron receivables percentage | 1 | % | 5 | % | 9 | % | ||
Noncontrolling interest
Noncontrolling interests represent the equity investments of the minority owners in our joint ventures and other subsidiary entities that we consolidate in our financial statements.
65
Foreign currency
Our reporting currency is the U.S. dollar. The functional currency of our non-U.S. subsidiaries is typically the currency of the primary environment in which they operate. Where the functional currency for a non-U.S. subsidiary is not the U.S. dollar, translation of all of the assets and liabilities (including long-term assets, such as goodwill) to U.S. dollars is based on exchange rates in effect at the balance sheet date. Translation of revenues and expenses to U.S. dollars is based on the average rate during the period and shareholders’ equity accounts are translated at historical rates. Translation gains or losses, net of income tax effects, are reported in "accumulated other comprehensive loss" on our consolidated balance sheets.
Transaction gains and losses that arise from foreign currency exchange rate fluctuations on transactions denominated in a currency other than the functional currency are recognized in income each reporting period when these transactions are either settled or remeasured. Transaction gains and losses on intra-entity foreign currency transactions and balances including advances and demand notes payable, on which settlement is not planned or anticipated in the foreseeable future, are recorded in "accumulated other comprehensive loss" on our consolidated balance sheets.
Share-based compensation
We account for share-based payments, including grants of employee stock options, restricted stock-based awards and performance cash units, in accordance with ASC 718 - Compensation-Stock Compensation, which requires that all share-based payments (to the extent that they are compensatory) be recognized as an expense in our consolidated statements of operations based on their fair values on the award date and the estimated number of shares we ultimately expect to vest. We recognize share-based compensation expense on a straight-line basis over the service period of the award, which is no greater than 5 years. See Note 19 to our consolidated financial statements for our discussion on share-based compensation and incentive plans.
Commitments and Contingencies
We record liabilities for loss contingencies arising from claims, assessments, litigation, fines and penalties, and other sources when it is probable that a liability has been incurred and the amount of the assessment can be reasonably estimated. Legal costs incurred in connection with loss contingencies are expensed as incurred.
Additional Balance Sheet Information
The components of "other current assets" on our consolidated balance sheets as of December 31, 2016 and 2015 are presented below:
December 31, | |||||||
Dollars in millions | 2016 | 2015 | |||||
Inventory | $ | 5 | $ | 5 | |||
Restricted cash | 2 | 2 | |||||
Prepaid expenses | 56 | 58 | |||||
Value-added tax receivable | 17 | 9 | |||||
Advances to subcontractors | 1 | 9 | |||||
Other miscellaneous assets | 22 | 26 | |||||
Total other current assets | $ | 103 | $ | 109 | |||
66
The components of "other current liabilities" on our consolidated balance sheets as of December 31, 2016 and 2015 are presented below:
December 31, | |||||||
Dollars in millions | 2016 | 2015 | |||||
Reserve for estimated losses on uncompleted contracts (a) | $ | 63 | $ | 60 | |||
Retainage payable | 47 | 49 | |||||
Income taxes payable | 55 | 56 | |||||
Restructuring reserves | 30 | 29 | |||||
Taxes payable not based on income | 14 | 7 | |||||
Value-added tax payable | 16 | 12 | |||||
Insurance payable | 14 | 12 | |||||
Dividend payable | 12 | 12 | |||||
Other miscellaneous liabilities (b) | 41 | 26 | |||||
Total other current liabilities | $ | 292 | $ | 263 | |||
(a) | See Note 2 to our consolidated financial statements for further discussion on significant reserves for estimated losses on uncompleted contracts. |
(b) | Included in "other miscellaneous liabilities" is deferred rent of $4 million and $7 million as of December 31, 2016 and 2015, respectively. |
Other Liabilities
Included in "other liabilities" on our consolidated balance sheets as of December 31, 2016 and 2015 is noncurrent deferred rent of $103 million and $114 million, respectively. Also included in "other liabilities" is a payable to our former parent of $19 million in each of the periods presented. This amount will be paid to our former parent upon receipt of a tax refund from the U.S. Internal Revenue Service in an amount greater than or equal to $19 million.
Note 2. Business Segment Information
We provide a wide range of professional services and the management of our business is heavily focused on major projects or programs within each of our reportable segments. At any given time, a relatively few number of projects, government programs and joint ventures represent a substantial part of our operations. Our reportable segments follow the same accounting policies as those described in Note 1 to our consolidated financial statements.
We are organized into three core business segments and two non-core business segments. Our three core business segments focus on our core strengths in technical services relating to government services, technology and consulting and engineering and construction. Our two non-core business segments are our Non-strategic Business segment, which includes businesses we intend to exit upon completion of existing contracts because they are no longer a part of our future strategic focus, and "Other", which includes our corporate expenses and general and administrative expenses not allocated to the other business segments. Each business segment reflects a reportable segment led by a separate business segment president who reports directly to our chief operating decision maker ("CODM"). Our business segments are described below.
Government Services ("GS"). Our GS business segment provides full life-cycle support solutions to defense, space, aviation and other programs and missions for government agencies in the U.S., United Kingdom ("U.K.") and Australia. As program management integrator, KBR covers the full spectrum of defense, space, aviation and other government programs and missions from research and development; through systems engineering, test and evaluation, systems integration and program management; to operations support, maintenance and field logistics. Our recent acquisitions, as described in Note 3 to our consolidated financial statements, have been combined with our existing U.S. operations within this business segment and operate under the single "KBRwyle" brand.
67
Technology & Consulting ("T&C"). Our T&C business segment combines proprietary KBR technologies, knowledge-based services and our three specialist consulting brands, Granherne, Energo and GVA under a single customer-facing global business. This segment provides licensed technologies, know-how and consulting services to the hydrocarbons value chain, from wellhead to crude refining and through refining and petrochemicals to specialty chemicals production. In addition to sharing many of the same customers, these brands share the approach of early and continuous customer involvement to deliver an optimal solution to meet the customers' objectives through early planning and scope definition, advanced technologies, and project life-cycle support.
Engineering & Construction ("E&C"). Our E&C business segment provides comprehensive project and program delivery capability globally. Our key capabilities leverage our operational and technical excellence as a global provider of engineering, procurement and construction ("EPC") for onshore oil and gas; LNG/gas to liquids ("GTL"); oil refining; petrochemicals; chemicals; fertilizers; offshore oil and gas (shallow-water, deep-water and subsea); floating solutions ( floating production units ("FPUs"), floating production, storage and offshore ("FPSO"), floating liquefied natural gas ("FLNG") & floating storage and regasification unit ("FSRU")); and maintenance services (via the “Brown & Root Industrial Services” brand).
Non-strategic Business. Our Non-strategic Business segment represents the operations or activities which we intend to exit upon completion of existing contracts. This segment also included businesses we exited upon sale to third parties during 2015.
Other. Our Other business segment includes our corporate expenses and general and administrative expenses not allocated to the business segments above and any future activities that do not individually meet the criteria for segment presentation.
Reportable segment performance is evaluated by our CODM using gross profit (loss) and equity in earnings of unconsolidated affiliates, which is defined as business segment revenues less the cost of revenues, and includes overhead directly attributable to the business segment.
The following table presents revenues, gross profit (loss), equity in earnings of unconsolidated affiliates, impairment of goodwill, asset impairment and restructuring charges, capital expenditures and depreciation and amortization by reporting segment.
68
Operations by Reportable Segment
Years ended December 31, | |||||||||||
Dollars in millions | 2016 | 2015 | 2014 | ||||||||
Revenues: | |||||||||||
Government Services | $ | 1,359 | $ | 663 | $ | 638 | |||||
Technology & Consulting | 347 | 324 | 353 | ||||||||
Engineering & Construction | 2,352 | 3,454 | 4,584 | ||||||||
Other | — | — | — | ||||||||
Subtotal | 4,058 | 4,441 | 5,575 | ||||||||
Non-strategic Business | 210 | 655 | 791 | ||||||||
Total | $ | 4,268 | $ | 5,096 | $ | 6,366 | |||||
Gross profit (loss): | |||||||||||
Government Services | $ | 137 | $ | (3 | ) | $ | (32 | ) | |||
Technology & Consulting | 73 | 77 | 53 | ||||||||
Engineering & Construction | 7 | 224 | 141 | ||||||||
Other | — | — | — | ||||||||
Subtotal | 217 | 298 | 162 | ||||||||
Non-strategic Business | (105 | ) | 27 | (227 | ) | ||||||
Total | $ | 112 | $ | 325 | $ | (65 | ) | ||||
Equity in earnings of unconsolidated affiliates: | |||||||||||
Government Services | $ | 39 | $ | 45 | $ | 73 | |||||
Technology & Consulting | — | — | — | ||||||||
Engineering & Construction | 52 | 104 | 90 | ||||||||
Other | — | — | — | ||||||||
Subtotal | 91 | 149 | 163 | ||||||||
Non-strategic Business | — | — | — | ||||||||
Total | $ | 91 | $ | 149 | $ | 163 | |||||
Impairment of goodwill (Note 9): | |||||||||||
Government Services | $ | — | $ | — | $ | — | |||||
Technology & Consulting | — | — | — | ||||||||
Engineering & Construction | — | — | (293 | ) | |||||||
Other | — | — | — | ||||||||
Subtotal | — | — | (293 | ) | |||||||
Non-strategic Business | — | — | (153 | ) | |||||||
Total | $ | — | $ | — | $ | (446 | ) | ||||
Asset impairment and restructuring charges (Note 10): | |||||||||||
Government Services | $ | (1 | ) | $ | — | $ | (5 | ) | |||
Technology & Consulting | (1 | ) | (10 | ) | (2 | ) | |||||
Engineering & Construction | (30 | ) | (34 | ) | (24 | ) | |||||
Other | (7 | ) | (22 | ) | (149 | ) | |||||
Subtotal | (39 | ) | (66 | ) | (180 | ) | |||||
Non-strategic Business | — | (4 | ) | (34 | ) | ||||||
Total | $ | (39 | ) | $ | (70 | ) | $ | (214 | ) | ||
Segment operating income (loss): | |||||||||||
Government Services | $ | 152 | $ | 37 | $ | 25 | |||||
Technology & Consulting | 66 | 62 | 49 | ||||||||
Engineering & Construction | 4 | 295 | (114 | ) | |||||||
Other | (93 | ) | (140 | ) | (312 | ) | |||||
Subtotal | 129 | 254 | (352 | ) | |||||||
Non-strategic Business | (101 | ) | 56 | (442 | ) | ||||||
Total | $ | 28 | $ | 310 | $ | (794 | ) | ||||
69
Years ended December 31, | |||||||||||
Dollars in millions | 2016 | 2015 | 2014 | ||||||||
Capital expenditures: | |||||||||||
Government Services | $ | 2 | $ | — | $ | — | |||||
Technology & Consulting | — | — | — | ||||||||
Engineering & Construction | 5 | 6 | 19 | ||||||||
Other | 4 | 4 | 34 | ||||||||
Subtotal | 11 | 10 | 53 | ||||||||
Non-strategic Business | — | — | — | ||||||||
Total | $ | 11 | $ | 10 | $ | 53 | |||||
Depreciation and amortization: | |||||||||||
Government Services | $ | 16 | $ | 6 | $ | 8 | |||||
Technology & Consulting | 3 | 2 | 2 | ||||||||
Engineering & Construction | 16 | 17 | 23 | ||||||||
Other | 10 | 14 | 33 | ||||||||
Subtotal | 45 | 39 | 66 | ||||||||
Non-strategic Business | — | — | 6 | ||||||||
Total | $ | 45 | $ | 39 | $ | 72 | |||||
Prior Period Adjustments
During the fourth quarter of 2016, we corrected a cumulative error related to contract cost estimates on an LNG project in Australia within our E&C business segment. The cumulative error occurred throughout the period beginning in 2009 and through the third quarter of 2016 and resulted in a $13 million reduction to revenues and gross profit on our consolidated statements of operations and a decrease to "CIE" on our consolidated balance sheets during the fourth quarter of 2016. We evaluated the cumulative errors discussed above on both a quantitative and qualitative basis and determined that the cumulative impact of the errors did not affect the trend of net income, cash flows or liquidity and therefore did not have a material impact to previously issued financial statements. Additionally, we determined that the cumulative impact of the error did not have a material impact to our consolidated financial statements for the fiscal year ended December 31, 2016.
During the second quarter of 2015, we corrected a cumulative error related to transactions between unconsolidated affiliates associated with our Mexican offshore maintenance joint venture within our E&C business segment. The cumulative error occurred throughout the period beginning in 2007 and through the first quarter of 2015 and resulted in a $15 million increase to "equity in earnings of unconsolidated affiliates" on our consolidated statements of operations and an increase to "equity in and advances to unconsolidated affiliates" on our consolidated balance sheets during the second quarter of 2015. We evaluated the cumulative errors discussed above on both a quantitative and qualitative basis and determined that the cumulative impact of the errors did not affect the trend of net income, cash flows or liquidity and therefore did not have a material impact to previously issued financial statements. Additionally, we determined that the cumulative impact of the error did not have a material impact to our consolidated financial statements for the fiscal year ended December 31, 2015.
Changes in Project-related Estimates
There are many factors that may affect the accuracy of our cost estimates and ultimately our future profitability. These include, but are not limited to, the availability and costs of resources (such as labor, materials and equipment), productivity and weather, and for unit rate and construction service contracts, the availability and detail of customer supplied engineering drawings. With a portfolio of more than one thousand contracts, we generally realize both lower and higher than expected margins on projects in any given period. We recognize revisions of revenues and costs in the period in which the revisions are known. This may result in the recognition of costs before the recognition of related revenue recovery, if any.
Changes in project-related estimates by business segment, which significantly impacted operating income during the periods presented, are as follows:
70
Government Services
During the year ended December 31, 2016, revenues, gross profit, and segment operating income included a favorable change in estimate of $33 million as a result of reaching a settlement with the U.S. government for reimbursement of previously expensed legal fees associated with the sodium dichromate litigation. See Note 15 to our consolidated financial statements for information related to the settlement with the U.S. government. Additionally, we recognized a $15 million favorable change to gross profit related to the approval of a change order on a road construction project in the Middle East. The change order resulted in an extension of the contract terms and increased the total contract value.
During the year ended December 31, 2014, we recognized an unfavorable adjustment of $30 million related the write-off of legal fees associated with the sodium dichromate litigation offset by additional gross profit of $29 million related to the favorable settlement of outstanding items on LogCAP III.
Engineering & Construction
We recognized unfavorable changes in estimates of losses of $114 million and $27 million in 2016 and 2015 respectively, on an EPC ammonia project in the U.S. primarily due to unforeseen costs related to the mechanical failure of a vendor supplied compressor and pumps that occurred during commissioning as well as various mechanical issues encountered during start-up. These issues delayed completion of the project to October 2016, which resulted in increased costs and the recognition of contractual liquidated damages due to the client. Included in the reserve for estimated losses on uncompleted contracts, which is a component of "other current liabilities" on our consolidated financial statements, is $3 million and $4 million as of December 31, 2016 and 2015, respectively, related to this project. The project completed performance testing and in October 2016, care, custody and control of the plant were transferred to the customer. Our estimates of revenues and costs at completion have been, and may continue to be, impacted by remaining punch list items and warranty obligations. Our estimated loss at completion as of December 31, 2016 represents our best estimate based on current information. Actual results could differ from the estimates we have used to account for this project as of December 31, 2016.
During the year ended December 31, 2016, we recognized unfavorable changes in estimated losses of $112 million on a downstream EPC project in the U.S. resulting from significant weather delays and forecast construction productivity rates less than previously expected. These issues have delayed completion until 2018, which resulted in additional estimated costs to complete. The EPC project is 58% complete as of December 31, 2016. This project is now a loss project and included in the reserve for estimated losses on uncompleted contracts is $35 million as of December 31, 2016. Our estimated loss at completion represents our best estimate based on current information. Actual results could differ from the estimates we have used to account for this project as of December 31, 2016.
During the year ended December 31, 2016, 2015 and 2014, revenues, gross profit, and segment operating income include $64 million, $17 million and $33 million, respectively, resulting from favorable changes in estimates to complete due to settlements on close out of a LNG project in Africa.
We recognized favorable (unfavorable) changes in our estimates of losses of $21 million, and $(72) million in 2015 and 2014, respectively, on seven Canadian pipe fabrication and module assembly projects. The favorable changes to our estimate of losses on these projects in 2015 were primarily due to negotiated settlements with clients. In 2014 we experienced significant cost increases to complete these projects which resulted in the unfavorable changes. All of these projects were completed in 2015.
We recognized unfavorable changes in estimates of losses of $62 million in 2014 on an EPC project in North America, primarily due to higher construction costs as well as increased costs due to delays in the completion of the project. This project was completed in 2015.
Non-strategic Business
We recognized unfavorable changes in estimates of losses on a power project of $117 million, $33 million and $90 million in 2016, 2015 and 2014, respectively, primarily due to increases in forecasted costs to complete the project driven by subcontractor cost increases from poor subcontractor productivity, resulting schedule delays and changes in the project execution strategy. Included in the reserve for estimated losses on uncompleted contracts is $14 million and $47 million as of December 31, 2016 and 2015, respectively, related to this project. The project has a contract value of $572 million and was approximately 94% complete as of December 31, 2016. We expect to complete this power project in the first half of 2017. Our estimates of revenues and costs at completion have been, and may continue to be, impacted by our performance, the performance of our subcontractors, and the U.S. labor market. Our estimated loss at completion as of December 31, 2016 represents our best estimate based on current information. Actual results could differ from the estimates we have used to account for this project as of December 31, 2016.
71
During the year ended December 31, 2015, we recognized additional gross profit of $57 million related to favorable settlements and cost savings associated with the completion of a power project in the U.S. During 2014, we recognized $60 million of unfavorable changes in our estimate of costs to complete on a separate power project resulting in a loss on the project. This power project was completed in 2015.
Balance Sheet Information by Reportable Segment
Within KBR, not all assets are associated with specific business segments. Those assets specific to business segments include receivables, inventories, certain identified property, plant and equipment, equity in and advances to related companies and goodwill. The remaining assets, such as cash and the remaining property, plant and equipment, are considered to be shared among the business segments and are therefore reported in "Other."
December 31, | |||||||
Dollars in millions | 2016 | 2015 | |||||
Total assets: | |||||||
Government Services | $ | 1,646 | $ | 464 | |||
Technology & Consulting | 219 | 198 | |||||
Engineering & Construction | 1,600 | 1,656 | |||||
Other | 666 | 1,060 | |||||
Subtotal | 4,131 | 3,378 | |||||
Non-strategic Business | 13 | 34 | |||||
Total | $ | 4,144 | $ | 3,412 | |||
Goodwill (Note 9): | |||||||
Government Services | $ | 674 | $ | 60 | |||
Technology & Consulting | 52 | 31 | |||||
Engineering & Construction | 233 | 233 | |||||
Other | — | — | |||||
Subtotal | 959 | 324 | |||||
Non-strategic Business | — | — | |||||
Total | $ | 959 | $ | 324 | |||
Equity in and advances to related companies (Note 11): | |||||||
Government Services | $ | 37 | $ | 26 | |||
Technology & Consulting | — | — | |||||
Engineering & Construction | 332 | 255 | |||||
Other | — | — | |||||
Subtotal | 369 | 281 | |||||
Non-strategic Business | — | — | |||||
Total | $ | 369 | $ | 281 | |||
72
Selected Geographic Information
Revenues by country are determined based on the location of services provided. Long-lived assets by country are determined based on the location of tangible assets.
Years ended December 31, | |||||||||||
Dollars in millions | 2016 | 2015 | 2014 | ||||||||
Revenues: | |||||||||||
United States | $ | 2,111 | $ | 2,212 | $ | 2,324 | |||||
Middle East | 849 | 786 | 707 | ||||||||
Europe | 498 | 495 | 624 | ||||||||
Australia | 376 | 836 | 1,380 | ||||||||
Canada | 145 | 185 | 752 | ||||||||
Africa | 111 | 164 | 251 | ||||||||
Other Countries | 178 | 418 | 328 | ||||||||
Total | $ | 4,268 | $ | 5,096 | $ | 6,366 | |||||
December 31, | |||||||
Dollars in millions | 2016 | 2015 | |||||
Property, plant & equipment, net: | |||||||
United States | $ | 70 | $ | 73 | |||
United Kingdom | 35 | 48 | |||||
Other | 40 | 48 | |||||
Total | $ | 145 | $ | 169 | |||
Note 3. Acquisitions and Dispositions
Honeywell Technology Solutions Inc. Acquisition
On September 16, 2016, we acquired 100% of the outstanding common stock of Honeywell Technology Solutions Inc. ("HTSI") from Honeywell International Inc., which we converted into KBRwyle Technology Solutions, LLC ("KTS"). KTS provides an array of mission-critical services and customized solutions throughout the world, primarily to U.S. government agencies. This acquisition provides KBR with complete life-cycle service capabilities, including high-end technical engineering and mission support, cyber security and logistics and equipment maintenance within our GS business segment.
The aggregate consideration paid for the acquisition was $300 million, less $20 million of initial working capital adjustments for net cash consideration of $280 million, all of which was funded by an advance on our Credit Agreement (as defined in Note 13 to our consolidated financial statements). The final settlement of the working capital adjustments is expected in the first half of 2017. Accordingly, adjustments to the initial purchase accounting for the acquired net assets will likely be completed during the first half of 2017, as we obtain additional information regarding the facts and circumstances that existed as of the acquisition date.
We recognized goodwill of $131 million arising from the acquisition, which relates primarily to growth opportunities based on a broader service offering of the combined operations, including KTS's specialized technical services and KBR's logistical expertise as well as expected cost synergies. Approximately $117 million of the goodwill is deductible for income tax purposes. This acquisition is reported within our GS business segment. We recognized acquisition-related costs of $7 million, which are included in "General and administrative expenses" in our consolidated statement of operations for the year ended December 31, 2016.
73
The following table summarizes the consideration paid for this acquisition and the fair value of the assets acquired and liabilities assumed as of the acquisition date.
Dollars in millions | |||
Fair value of total consideration transferred | $ | 280 | |
Recognized amounts of identifiable assets acquired and liabilities assumed: | |||
Trade receivables, net | 29 | ||
CIE | 93 | ||
Prepaids and other current assets | 5 | ||
Total current assets | 127 | ||
Property, plant and equipment, net | 7 | ||
Intangible assets (a): | |||
Customer relationships | 62 | ||
Backlog | 7 | ||
Internally developed software | 1 | ||
Deferred income taxes | 8 | ||
Total assets | 212 | ||
Accounts payable | 23 | ||
BIE | 5 | ||
Other current liabilities | 35 | ||
Total current liabilities | 63 | ||
Goodwill | $ | 131 | |
(a) | These intangible assets are amortized over their estimated useful lives up to 20 years. |
KTS’s results of operations have been included in our consolidated statements of operations for periods subsequent to the acquisition on September 16, 2016. The acquired KTS business contributed $146 million of revenues and $12 million of gross profit for the period from September 16, 2016 through December 31, 2016. In connection with the transaction, we entered into a transition services agreement ("TSA") with the seller for a period of up to six months which primarily relates to payroll processing, human resources, information technology, real estate and other support services provided by the seller.
Wyle Inc. ("Wyle") Acquisition
On July 1, 2016, we acquired 100% of the equity interests of Wyle from its shareholders, including Court Square Capital Partners and certain officers of Wyle, pursuant to an agreement and plan of merger. Wyle delivers an array of custom solutions for customers in the U.S. Department of Defense, NASA and other federal agencies. Wyle's expertise includes systems and sustainment engineering, program and acquisition management, life science research, space medical operations, information technology and the testing and evaluation of aircraft, advanced systems and networks. The acquisition combines KBR's strengths in international, large-scale government logistics and support operations with Wyle's specialized technical services, largely focused in the contiguous U.S.
The aggregate consideration paid for the acquisition was $600 million, including repayment of outstanding balances under Wyle's credit facility and other transaction expenses, plus $23 million of purchase price adjustments, which resulted in net cash consideration of $623 million. We funded the total cash paid with a $400 million advance on our Credit Agreement and available cash on-hand. See Note 13 to our consolidated financial statements for information related to our Credit Agreement.
74
We recognized goodwill of $483 million arising from the acquisition, which relates primarily to growth opportunities based on a broader service offering of the combined operations, including Wyle's differentiated technical capabilities and KBR's international program management and logistics expertise. Additionally, goodwill relates to the existence of Wyle's skilled employee base and other expected synergies of the combined operations. Approximately $107 million of the goodwill is deductible for income tax purposes. Certain data necessary to complete the purchase price allocation is not yet available and primarily relates to final tax returns that provide the underlying tax basis of assets and liabilities. This acquisition is reported within our GS business segment. We recognized acquisition-related costs of $3 million, which are included in "General and administrative expenses" in our consolidated statement of operations for the year ended December 31, 2016.
The following table summarizes the consideration paid for this acquisition and the fair value of the assets acquired and liabilities assumed as of the acquisition date.
Dollars in millions | |||
Fair value of total consideration transferred | $ | 623 | |
Recognized amounts of identifiable assets acquired and liabilities assumed: | |||
Cash | 10 | ||
Trade receivables, net | 47 | ||
CIE | 98 | ||
Prepaids and other current assets | 4 | ||
Total current assets | 159 | ||
Property, plant and equipment, net | 10 | ||
Intangible assets (a): | |||
Customer relationships | 82 | ||
Trademarks/trade names | 48 | ||
Backlog | 11 | ||
Total assets | 310 | ||
Accounts payable | 59 | ||
Other current liabilities | 47 | ||
Total current liabilities | 106 | ||
Deferred income taxes | 52 | ||
Other liabilities | 12 | ||
Total liabilities | 170 | ||
Goodwill | $ | 483 | |
(a) | These intangible assets are amortized over their estimated useful lives up to 20 years with the exception of Trademarks/trade names which have an indefinite life. |
Wyle’s results of operations have been included in our consolidated statements of operations for periods subsequent to the acquisition on July 1, 2016. The acquired Wyle businesses contributed $341 million of revenues and $26 million of gross profit for the period from July 1, 2016 through December 31, 2016.
The following supplemental pro forma consolidated results of operations assume that HTSI and Wyle had been acquired as of January 1, 2015. The supplemental pro forma financial information was prepared based on the historical financial information of HTSI and Wyle and has been adjusted to give effect to pro forma adjustments that are directly attributable to the transaction. The pro forma amounts reflect certain adjustments to amortization expense and interest expense associated with the portion of the purchase price funded by a $700 million advance on our Credit Agreement, and also reflect adjustments to the 2016 results to exclude acquisition related costs as they are nonrecurring and are directly attributable to the transaction.
75
The supplemental pro forma financial information presented below does not include any anticipated cost savings or expected realization of other synergies associated with the transaction. Accordingly, this supplemental pro forma financial information is presented for informational purposes only and is not necessarily indicative of what the actual results of operations of the combined company would have been had the acquisition occurred on January 1, 2015, nor is it indicative of future results of operations.
Years ended December 31, | |||||||
Dollars in millions, except per share data | 2016 | 2015 | |||||
(Unaudited) | |||||||
Revenue | $ | 5,129 | $ | 6,599 | |||
Net income (loss) attributable to KBR | (23 | ) | 248 | ||||
Diluted earnings per share | $ | (0.16 | ) | $ | 1.72 | ||
Chematur Subsidiaries Acquisition
On January 11, 2016, we acquired 100% of the outstanding common stock of three subsidiaries of Connell Chemical Industry LLC (through its subsidiary, Chematur Technologies AB): Plinke GmbH ("Plinke"), Weatherly Inc., ("Weatherly") and Chematur Ecoplanning Oy ("Ecoplanning"). Plinke specializes in proprietary technology and specialist equipment for the purification and concentration of inorganic acids used or produced in hydrocarbon processing facilities. Weatherly provides nitric acid and ammonium nitrate proprietary technologies and services to the fertilizer market. Ecoplanning offers proprietary evaporation and crystallization technologies and specialist equipment for weak acid and base solutions. As a result of this acquisition, we can expand our technology and consulting solutions into new markets while leveraging KBR's global sales and EPC capabilities.
The aggregate consideration paid for the acquisition was $25 million, less $2 million of acquired cash and other adjustments resulting in net cash consideration of $23 million. The consideration paid included an escrow of $5 million that secures the indemnification obligations of the seller and other contingent obligations related to the operation of the business.
We recognized goodwill of $24 million arising from the acquisition, which relates primarily to future growth opportunities to extend the acquired technologies outside North America to new customers and in revamping units of the existing customer base globally. None of the goodwill is deductible for income tax purposes. The purchase price allocation is complete. This acquisition is reported within our T&C business segment. We recognized acquisition related costs of $1 million, which are included in "General and administrative expenses" on our consolidated statement of operations for the year ended December 31, 2016.
76
The following table summarizes the consideration paid for this acquisition and the fair value of the assets acquired and liabilities assumed as of the acquisition date and subsequent working capital adjustments.
Dollars in millions | |||
Fair value of total consideration transferred | $ | 25 | |
Recognized amounts of identifiable assets acquired and liabilities assumed: | |||
Cash | 2 | ||
Trade receivables, net | 5 | ||
CIE | 8 | ||
Prepaids and other current assets | 5 | ||
Total current assets | 20 | ||
Intangible assets (a): | |||
Developed technology | 10 | ||
Customer relationships | 7 | ||
Trademarks/trade names | 2 | ||
Other assets | 1 | ||
Total assets | 40 | ||
Accounts payable | 2 | ||
BIE | 15 | ||
Other current liabilities | 7 | ||
Total current liabilities | 24 | ||
Deferred income taxes | 10 | ||
Other liabilities | 5 | ||
Total liabilities | 39 | ||
Goodwill | $ | 24 | |
(a) | These intangible assets are amortized over their estimated useful lives up to 20 years with the exception of Trademarks/trade names which have an indefinite life. |
As a result of this acquisition, $28 million of revenue and a gross profit of $1 million were included in our consolidated statements of operations as of December 31, 2016.
Dispositions
In December 2015, we finalized the sale of our Infrastructure Americas business to Stantec Consulting Services Inc. for net cash proceeds, including working capital adjustments, of $18 million. The sale of this business within our Non-strategic Business segment is consistent with our restructuring plans announced in December 2014. The disposition resulted in a pretax gain of $7 million and is subject to finalization of certain indemnification claims. The gain on this transactions is included under "gain on disposition of assets" on our consolidated statements of operations.
In June 2015, we sold our Building Group subsidiary to a subsidiary of Pernix Group, Inc., for net cash proceeds, including working capital adjustments, of $23 million. The sale of the Building Group within our Non-strategic Business segment is consistent with our restructuring plans announced in December 2014. The disposition resulted in a pre-tax gain of $28 million and is included under "gain on disposition of assets" on our consolidated statements of operations.
77
Note 4. Cash and Equivalents
We consider all highly liquid investments with an original maturity of three months or less to be cash equivalents. Cash and equivalents include cash balances held by our wholly owned subsidiaries as well as cash held by joint ventures that we consolidate. Joint venture cash balances are limited to joint venture activities and are not available for other projects, general cash needs or distribution to us without approval of the board of directors of the respective joint ventures. We expect to use joint venture cash for project costs and distributions of earnings related to joint venture operations. However, some of the earnings distributions may be paid to other KBR entities where the cash can be used for general corporate needs.
The components of our cash and equivalents balance are as follows:
December 31, 2016 | |||||||||||
Dollars in millions | International (a) | Domestic (b) | Total | ||||||||
Operating cash and equivalents | $ | 163 | $ | 242 | $ | 405 | |||||
Short-term investments (c) | 68 | 7 | 75 | ||||||||
Cash and equivalents held in joint ventures | 50 | 6 | 56 | ||||||||
Total | $ | 281 | $ | 255 | $ | 536 | |||||
December 31, 2015 | |||||||||||
Dollars in millions | International (a) | Domestic (b) | Total | ||||||||
Operating cash and equivalents | $ | 177 | $ | 253 | $ | 430 | |||||
Short-term investments (c) | 293 | 107 | 400 | ||||||||
Cash and equivalents held in joint ventures | 49 | 4 | 53 | ||||||||
Total | $ | 519 | $ | 364 | $ | 883 | |||||
(a) | Includes deposits held in non-U.S. operating accounts |
(b) | Includes U.S. dollar and foreign currency deposits held in operating accounts that constitute onshore cash for tax purposes but may reside either in the U.S. or in a foreign country |
(c) | Includes time deposits, money market funds, and other highly liquid short-term investments. |
Note 5. Accounts Receivable
The components of our accounts receivable, net of allowance for doubtful accounts are as follows:
December 31, 2016 | |||||||||||
Dollars in millions | Retainage | Trade & Other | Total | ||||||||
Government Services | $ | 6 | $ | 190 | $ | 196 | |||||
Technology & Consulting | — | 52 | 52 | ||||||||
Engineering & Construction | 53 | 276 | 329 | ||||||||
Other | — | 3 | 3 | ||||||||
Subtotal | 59 | 521 | 580 | ||||||||
Non-strategic Business | 5 | 7 | 12 | ||||||||
Total | $ | 64 | $ | 528 | $ | 592 | |||||
78
December 31, 2015 | |||||||||||
Dollars in millions | Retainage | Trade & Other | Total | ||||||||
Government Services | $ | 2 | $ | 75 | $ | 77 | |||||
Technology & Consulting | — | 70 | 70 | ||||||||
Engineering & Construction | 51 | 402 | 453 | ||||||||
Other | — | 2 | 2 | ||||||||
Subtotal | 53 | 549 | 602 | ||||||||
Non-strategic Business | 9 | 17 | 26 | ||||||||
Total | $ | 62 | $ | 566 | $ | 628 | |||||
Note 6. Costs and Estimated Earnings in Excess of Billings on Uncompleted Contracts and Billings in Excess of Costs and Estimated Earnings on Uncompleted Contracts
Our CIE balances by business segment are as follows:
December 31, | |||||||
Dollars in millions | 2016 | 2015 | |||||
Government Services | $ | 271 | $ | 68 | |||
Technology & Consulting | 30 | 42 | |||||
Engineering & Construction (a) | 115 | 114 | |||||
Subtotal | 416 | 224 | |||||
Non-strategic Business | — | — | |||||
Total | $ | 416 | $ | 224 | |||
Our BIE balances by business segment are as follows:
December 31, | |||||||
Dollars in millions | 2016 | 2015 | |||||
Government Services | $ | 76 | $ | 69 | |||
Technology & Consulting | 61 | 72 | |||||
Engineering & Construction | 388 | 307 | |||||
Subtotal | 525 | 448 | |||||
Non-strategic Business | 27 | 61 | |||||
Total | $ | 552 | $ | 509 | |||
Unapproved change orders and claims
The amounts of unapproved change orders and claims revenue included in determining the profit or loss on contracts are as follows:
Dollars in millions | 2016 | 2015 | |||||
Amounts included in project estimates-at-completion at January 1, | $ | 46 | $ | 31 | |||
Additions | 19 | 71 | |||||
Approved change orders | (37 | ) | (42 | ) | |||
Adjustment due to disposition of business | — | (14 | ) | ||||
Amounts included in project estimates-at-completion at December 31, | $ | 28 | $ | 46 | |||
Amounts recorded in revenues on a percentage-of-completion basis at December 31, | $ | 28 | $ | 41 | |||
The table above excludes unapproved change orders and claims revenue related to our unconsolidated affiliates. Our proportionate share of unapproved change orders and claims as described below was $257 million as of December 31, 2016 and $58 million as of December 31, 2015 on the Ichthys LNG project in our E&C business segment.
79
Ichthys LNG project. We have a 30% ownership in an Australian joint venture (the “Ichthys JV”) which has contracted to perform the engineering, procurement, supply, construction and commissioning of onshore LNG facilities for a client in Darwin, Australia. The contract between the Ichthys JV and its client is a hybrid contract containing both cost-reimbursable and fixed-price (including unit-rate) scopes. See Note 11 to our consolidated financial statements for more discussion on this joint venture.
The Ichthys JV has entered into commercial contracts with multiple subcontractors to execute various scopes of work on the project. Certain of these subcontractors have made contract claims against the Ichthys JV for recovery of costs and an extension of time in order to progress the works under the scope of their respective contracts due to a variety of issues related to changes to the scope of work, delays and lower than planned subcontractor productivity. Some of these claims relate to cost-reimbursable work between the Ichthys JV and its client while other claims relate to fixed-price scopes of work, including unit-rate components.
We believe any amounts paid or payable to the subcontractors in settlement of their contract claims related to cost-reimbursable scopes of work is an adjustment to the contract price in the contract between the Ichthys JV and its client, however, the client has disputed this contract price adjustment. In order to facilitate the continuation of work under the contract while we work to resolve this dispute, the client has agreed to a contractual mechanism (“Deed of Settlement”) providing funding in the form of an interim contract price adjustment to the Ichthys JV for settlement of subcontractor claims related to cost-reimbursable scopes of work. The Ichthys JV has settled the subcontractor claims relating to cost-reimbursable work covered by the Deed of Settlement and will pursue resolution of unapproved change orders and claims which were not covered by the Deed of Settlement through direct negotiation with the client.
As of December 31, 2016, the total amount of contract price adjustments included in the estimates of revenues and costs at completion for the project is $857 million, of which $557 million is covered by the Deed of Settlement and $300 million related to unapproved change orders and claims which the Ichthys JV continues to pursue with its client. Our proportionate share of the total amount of the contract price adjustments, included in the unapproved change orders and claims related to our unconsolidated affiliates discussed above, is $257 million, of which $167 million relates to the Deed of Settlement and $90 million relates to the remaining change orders and claims. To date, we have submitted change orders and claims to the client that exceed the amounts included in our estimates of contract revenue at completion. There may be additional interim contract price adjustments in future periods, including additions to the Deed of Settlement. There were no such contract price adjustments in 2015 or 2014.
If the Ichthys JV does not resolve the differences with its client by December 31, 2020, it will be required to refund sums in excess of the final adjusted contract price with the client under the terms of the Deed of Settlement. We, along with our joint venture partners, are jointly and severally liable to the client for any amounts required to be refunded. The Ichthys JV may file for arbitration against the client to resolve any open reimbursable subcontractor claims prior to December 31, 2020.
It is anticipated that these commercial matters may not be resolved in the near term. If these matters are not resolved for the amounts recorded, or to the extent the Ichthys JV is not successful in recovering amounts contractually due under the Deed of Settlement, it could have an adverse effect on our results of operations, financial position and cash flows.
On January 25, 2017, the Ichthys JV received Notice of Termination from the UGL-CH2M Hill JV Consortium subcontractor (the "Consortium"). The subcontract is a fixed-price contract for the design, construction and commissioning of a combined cycle power plant on the Ichthys LNG project site. The power plant is approximately 89% complete. The Ichthys JV believes the Consortium breached its contract and will seek to enforce remedies contained within such subcontract. We are currently evaluating the estimated cost to complete the Consortium’s work, which is likely to exceed the subcontract value. As a result, the Ichthys JV will pursue recourse against the Consortium to recover the amounts needed to complete the subcontractor’s obligation, inclusive of calling bank guarantees (bonds) provided by the Consortium. We expect the Consortium to challenge the Ichthys JV's recourse actions. If the Ichthys JV is unsuccessful in recovering such costs, we would be responsible for our pro rata portion of unrecovered costs which could have a material adverse impact on our consolidated statements of operations, financial position and cash flow.
Liquidated damages
Some of our engineering and construction contracts have schedule dates and performance obligations that if not met could subject us to penalties for liquidated damages. These generally relate to specified activities that must be completed by a set contractual date or by achievement of a specified level of output or throughput. Each contract defines the conditions under which a customer may make a claim for liquidated damages. However, in some instances, liquidated damages are not asserted by the customer, but the potential to do so is used in negotiating or settling claims and closing out the contract. Any accrued liquidated damages are recognized as a reduction in revenues in our consolidated statements of operations.
80
It is possible that liquidated damages related to several projects totaling $8 million at December 31, 2016 and $6 million at December 31, 2015 could be incurred if the projects are completed as currently forecasted. However, based upon our evaluation of our performance, we have concluded these liquidated damages are not probable and therefore, they have not been recognized.
Note 7. Claims and Accounts Receivable
The components of our claims and accounts receivable not expected to be collected within the next 12 months are as follows:
December 31, | |||||||
Dollars in millions | 2016 | 2015 | |||||
Government Services | $ | 131 | $ | 126 | |||
Engineering & Construction | — | 400 | |||||
Total | $ | 131 | $ | 526 | |||
Our GS business segment's claims and accounts receivable reflect claims filed with the U.S. government related to payments not yet received for cost incurred under various U.S. government contracts. These claims relate to disputed costs or contracts where our costs have exceeded the U.S. government's funded value on the task order. Included in the amount above is $83 million as of December 31, 2016 and 2015, related to Form 1s issued by the U.S. government questioning or objecting to costs billed to them. See Note 15 of our consolidated financial statements for further discussion. The amount above also includes $48 million and $43 million as of December 31, 2016 and 2015, respectively, related to contracts where our costs have exceeded the U.S. government's funded values on the underlying task orders or task orders where the U.S. government has not authorized us to bill. We believe such disputed costs will be resolved in our favor at which time the U.S. government will be required to obligate funds from appropriations for the year in which resolution occurs.
Our E&C business segment's claims and accounts receivable related to our EPC 1 arbitration is expected to be settled in 2017 and has been reclassed to "Claims receivable" on our consolidated balance sheets as of December 31, 2016. See Note 16 to our consolidated financial statements under PEMEX and PEP Arbitration for further discussion.
Note 8. Property, Plant and Equipment
The components of our property, plant and equipment balance are as follows:
Estimated Useful Lives in Years | December 31, | ||||||||
Dollars in millions | 2016 | 2015 | |||||||
Land | N/A | $ | 7 | $ | 7 | ||||
Buildings and property improvements | 5 - 44 | 124 | 140 | ||||||
Equipment and other | 3 - 25 | 338 | 374 | ||||||
Total | 469 | 521 | |||||||
Less accumulated depreciation | (324 | ) | (352 | ) | |||||
Net property, plant and equipment | $ | 145 | $ | 169 | |||||
See Note 10 to our consolidated financial statements for discussion on asset impairment.
In the fourth quarter of 2015, we closed on the sale of our office facility located in Greenford, U.K. for approximately $33 million in net cash proceeds. The sale resulted in a pre-tax gain of $23 million on disposition of assets on our consolidated statements of operations. We also closed on the sale of our office facility located in Birmingham, Alabama for approximately $6 million in net cash proceeds. The gain on these transactions is included under "gain on disposition of assets" on our consolidated statements of operations.
Depreciation expense was $31 million, $35 million and $61 million for the years ended December 31, 2016, 2015 and 2014, respectively.
81
Note 9. Goodwill and Intangible Assets
Goodwill
The table below summarizes changes in the carrying amount of goodwill by business segment.
Dollars in millions | Government Services | Technology & Consulting | Engineering & Construction | Other | Subtotal | Non-strategic Business | Total | ||||||||||||||||||||
Balance as of January 1, 2015: | |||||||||||||||||||||||||||
Gross goodwill | $ | 60 | $ | 31 | $ | 526 | $ | — | $ | 617 | $ | 331 | $ | 948 | |||||||||||||
Accumulated impairment losses | — | — | (293 | ) | — | (293 | ) | (331 | ) | (624 | ) | ||||||||||||||||
Net goodwill as of January 1, 2015 | $ | 60 | $ | 31 | $ | 233 | $ | — | $ | 324 | $ | — | $ | 324 | |||||||||||||
Impairment loss | $ | — | $ | — | $ | — | $ | — | $ | — | $ | — | $ | — | |||||||||||||
Net foreign exchange difference | — | — | — | — | — | — | — | ||||||||||||||||||||
Balances as of December 31, 2015: | |||||||||||||||||||||||||||
Gross goodwill | $ | 60 | $ | 31 | $ | 526 | $ | — | $ | 617 | $ | 331 | $ | 948 | |||||||||||||
Accumulated impairment losses | — | — | (293 | ) | — | (293 | ) | (331 | ) | (624 | ) | ||||||||||||||||
Net goodwill as of December 31, 2015 | $ | 60 | $ | 31 | $ | 233 | $ | — | $ | 324 | $ | — | $ | 324 | |||||||||||||
Goodwill acquired during the period | $ | 614 | $ | 24 | $ | — | $ | — | $ | 638 | $ | — | $ | 638 | |||||||||||||
Impairment loss | — | — | — | — | — | — | — | ||||||||||||||||||||
Net foreign exchange difference | — | (3 | ) | — | — | (3 | ) | — | (3 | ) | |||||||||||||||||
Balance as of December 31, 2016: | |||||||||||||||||||||||||||
Gross goodwill | $ | 674 | $ | 52 | $ | 526 | $ | — | $ | 1,252 | $ | 331 | $ | 1,583 | |||||||||||||
Accumulated impairment losses | — | — | (293 | ) | — | (293 | ) | (331 | ) | (624 | ) | ||||||||||||||||
Net goodwill as of December 31, 2016 | $ | 674 | $ | 52 | $ | 233 | $ | — | $ | 959 | $ | — | $ | 959 | |||||||||||||
82
Intangible Assets
Intangible assets are comprised of customer relationships, trade names, licensing agreements and other. The cost and accumulated amortization of our intangible assets were as follows:
Dollars in millions | December 31, 2016 | ||||||||||||
Weighted Average Remaining Useful Lives | Intangible Assets, Gross | Accumulated Amortization | Intangible Assets, Net | ||||||||||
Trademarks/trade names | Indefinite | $ | 60 | $ | — | $ | 60 | ||||||
Customer relationships | 14 | 199 | (47 | ) | 152 | ||||||||
Developed technologies | 10 | 46 | (33 | ) | 13 | ||||||||
Other | 1 | 43 | (20 | ) | 23 | ||||||||
Total intangible assets | $ | 348 | $ | (100 | ) | $ | 248 | ||||||
December 31, 2015 | |||||||||||||
Weighted Average Remaining Useful Lives | Intangible Assets, Gross | Accumulated Amortization | Intangible Assets, Net | ||||||||||
Trademarks/trade names | Indefinite | $ | 11 | $ | — | $ | 11 | ||||||
Customer relationships | 3 | 48 | (40 | ) | 8 | ||||||||
Developed technologies | 11 | 35 | (33 | ) | 2 | ||||||||
Other | 9 | 32 | (18 | ) | 14 | ||||||||
Total intangible assets | $ | 126 | $ | (91 | ) | $ | 35 | ||||||
Intangibles that are not subject to amortization are reviewed annually for impairment or more often if events or circumstances change that would create a triggering event. Intangibles subject to amortization are impaired if the carrying value of the intangible is not recoverable and exceeds its fair value. See Note 3 to our consolidated financial statements for discussion on additions of intangible assets.
Our intangibles amortization expense is presented below:
Years ended December 31, | |||||||||||
Dollars in millions | 2016 | 2015 | 2014 | ||||||||
Intangibles amortization expense | $ | 14 | $ | 4 | $ | 11 | |||||
Our expected intangibles amortization expense for the next five years is presented below:
Dollars in millions | Expected future intangibles amortization expense | ||
2017 | $ | 22 | |
2018 | $ | 14 | |
2019 | $ | 13 | |
2020 | $ | 11 | |
2021 | $ | 9 | |
Beyond 2021 | $ | 119 | |
83
Note 10. Asset Impairment and Restructuring
Information related to "asset impairment and restructuring charges" on our consolidated statements of operations is presented below:
Years ended December 31, | |||||||||||
Dollars in millions | 2016 | 2015 | 2014 | ||||||||
Asset impairment: | |||||||||||
Government Services | $ | — | $ | — | $ | — | |||||
Technology & Consulting | — | — | — | ||||||||
Engineering & Construction | 10 | 8 | 1 | ||||||||
Other | 7 | 21 | 139 | ||||||||
Subtotal | 17 | 29 | 140 | ||||||||
Non-strategic Business | — | 2 | 31 | ||||||||
Total | $ | 17 | $ | 31 | $ | 171 | |||||
Restructuring charges: | |||||||||||
Government Services | $ | 1 | $ | — | $ | 5 | |||||
Technology & Consulting | 1 | 10 | 2 | ||||||||
Engineering & Construction | 20 | 26 | 23 | ||||||||
Other | — | 1 | 10 | ||||||||
Subtotal | 22 | 37 | 40 | ||||||||
Non-strategic Business | — | 2 | 3 | ||||||||
Total | $ | 22 | $ | 39 | $ | 43 | |||||
Asset impairment and restructuring charges: | |||||||||||
Total | $ | 39 | $ | 70 | $ | 214 | |||||
Asset impairment charges include the following:
Enterprise resource planning project - In December 2014, we recorded an asset impairment charge of $135 million within our Other business segment related to our decision to abandon further implementation of our enterprise resource planning ("ERP") project which began in 2013. During 2015, we recorded an additional $5 million within our E&C business segment and $17 million within our Other business segment resulting from our decision to abandon the remaining portion of this ERP project.
Intangible assets - No intangibles were considered impaired during 2015 and 2016. During 2014, we recorded noncash impairment charges of $31 million related to certain intangible assets within our Non-strategic Business segment. See Note 9 to our consolidated financial statements for additional information on intangibles.
Leasehold improvements - During 2016 and 2015, we recorded $17 million and $9 million, respectively, primarily within our E&C and Other business segments related to asset impairments on abandoned office space. During 2014, we recorded a charge of $5 million within our Other and E&C business segments related to the impairment of leasehold improvements and other property associated with the terminated leases discussed below.
Restructuring charges include the following:
Early Termination of leases - During 2016 and 2015, we recorded additional charges of $4 million and $12 million, respectively, on early lease terminations within our E&C and Other business segments. During 2014, we recognized a charge of $14 million on early termination of operating leases within our E&C, GS and Non-strategic Business segments.
Severance - As presented below, we recognized severance charges of $18 million, $27 million and $29 million during each of the twelve months ended December 31, 2016, 2015 and 2014, respectively, associated with workforce reductions.
84
Severance Accrual
In connection with our long-term strategic reorganization, we announced that beginning in the fourth quarter of 2014 we would undertake a restructuring, which would include actions such as reducing the amount of real estate we utilized and significantly reducing our workforce. There were additional actions undertaken in 2015 and 2016, including staff reductions to support current business levels. The table below provides a rollforward of one-time charges associated with employee terminations based on the fair value of the termination benefits. These amounts are included in "other current liabilities" on our consolidated balance sheets.
Dollars in millions | Severance Accrual | ||
Balance at December 31, 2014 | $ | 21 | |
Charges | 27 | ||
Payments | (29 | ) | |
Balance at December 31, 2015 | $ | 19 | |
Charges | 18 | ||
Payments | (29 | ) | |
Balance at December 31, 2016 | $ | 8 | |
Note 11. Equity Method Investments and Variable Interest Entities
We conduct some of our operations through joint ventures which operate as partnerships, corporations, undivided interests and other business forms and are principally accounted for using the equity method of accounting. Additionally, the majority of our joint ventures are also VIEs.
The following table presents a rollforward of our equity in and advances to unconsolidated affiliates:
Dollars in millions | 2016 | 2015 | |||||
Balance at January 1, | $ | 281 | $ | 151 | |||
Equity in earnings of unconsolidated affiliates | 91 | 149 | |||||
Distributions of earnings of unconsolidated affiliates (a) | (56 | ) | (92 | ) | |||
Advances (receipts) | 1 | (10 | ) | ||||
Investments (b) | 61 | 80 | |||||
Foreign currency translation adjustments | (8 | ) | (9 | ) | |||
Other | (8 | ) | 1 | ||||
Balance before reclassification | 362 | 270 | |||||
Reclassification of excess distributions (a) | 12 | 16 | |||||
Recognition of excess distributions (a) | (5 | ) | (5 | ) | |||
Balance at December 31, | $ | 369 | $ | 281 | |||
(a) | We received cash dividends in excess of the carrying value of one of our investments. We have no obligation to return any portion of the cash dividends received. We recorded the excess dividend amount as "deferred income from unconsolidated affiliates" on our consolidated balance sheets and recognize these dividends as earnings are generated by the investment. |
(b) | In 2016, investments included a $56 million investment in the Brown & Root Industrial Services joint venture and a $5 million investment in EPIC Piping LLC ("EPIC") joint venture. In 2015, investments included a $58 million investment in the Brown & Root Industrial Services joint venture, a $24 million investment in EPIC, and the disposition of a joint venture included in the sale of the Building Group. |
85
Equity Method Investments
New Investments
In February 2016, Affinity Flying Training Services Ltd. ("Affinity"), a joint venture between KBR and Elbit Systems, was awarded a service contract by a third party to procure, operate and maintain aircraft and aircraft-related assets over an 18-year contract period, in support of the U.K. Military Flying Training System ("UKMFTS") project. KBR owns a 50% interest in Affinity. In addition, KBR owns a 50% interest in the two joint ventures, Affinity Capital Works and Affinity Flying Services, which provide procurement, operations and management support services under subcontracts with Affinity. The remaining 50% interest in these entities is held by Elbit Systems. KBR has provided its proportionate share of certain limited financial and performance guarantees in support of the partners' contractual obligations. The three project-related entities are VIEs; however, KBR is not the primary beneficiary of any of these entities. We account for KBR's interests in each entity using the equity method of accounting within our GS business segment. The project is funded through KBR and Elbit Systems provided equity, subordinated debt and non-recourse third party commercial bank debt. During the first quarter of 2016, under the terms of the subordinated debt agreement between the partners and Affinity, we advanced our proportionate share, or $14 million, to meet initial working capital needs of the venture. We expect repayment on the advance and the associated interest over the term of the project. The amount is included in the "equity in and advances to unconsolidated affiliates" balance on our consolidated balance sheets as of December 31, 2016 and in "(advances to) payments from unconsolidated affiliates, net" in our consolidated statement of cash flows for the twelve months ended December 31, 2016.
Other
On September 30, 2015, we executed an agreement with Bernhard Capital Partners ("BCP"), a private equity firm, to establish the Brown & Root Industrial Services joint venture in North America. In connection with the formation of the joint venture, we contributed our Industrial Services Americas business and received cash consideration of $48 million and a 50% interest in the joint venture. As a result of the transaction, we no longer have a controlling interest in this Industrial Services business and have deconsolidated it effective September 30, 2015. The transaction resulted in a pre-tax gain of $7 million, which is included in "gain on disposition of assets" on our consolidated statements of operations. The fair value of our retained interest in the former business was determined using both a market approach and an income approach. Cash consideration was the primary input used for the market approach.
The Brown & Root Industrial Services joint venture will continue to offer services similar or related to those offered when the business was part of KBR. Our interest in this venture is accounted for using the equity method and we have determined that the Brown & Root Industrial Services joint venture is not a VIE. Our continuing involvement in the joint venture will be through our 50% voting interest and representation on the board of managers. Consistent with our other equity investments, transactions between us and the joint venture, if any, are deemed related party transactions. In connection with this transaction, we entered into an agreement effective October 1, 2015 to provide specified transition services to the new joint venture over a limited duration. See the Related Party discussion below for details on amounts related to this agreement.
On September 30, 2015, we acquired a minority interest in a partnership that owns a pipe fabrication business operating under the name EPIC and a minority interest in its general partner. BCP holds a controlling interest in these entities. Consideration for these interests was $19 million in cash and contribution of the majority of our Canada pipe fabrication and module assembly business excluding the seven completed loss projects. We have determined that this arrangement is not a VIE and we will account for our ownership interest using the equity method. In addition, we entered into an alliance agreement with EPIC to provide certain pipe fabrication services to KBR.
Mantenimiento Marino de Mexico, S. de R.L. de C.V. ("MMM"). MMM is a joint venture formed under a partnership agreement related to services performed for PEMEX. We determined that MMM is not a VIE. The MMM joint venture was set up under Mexican maritime law in order to hold navigation permits to operate in Mexican waters. The scope of the business is to render services for maintenance, repair and restoration of offshore oil and gas platforms and provisions of quartering in the territorial waters of Mexico. KBR holds a 50% interest in the MMM joint venture. Results from MMM are included in our E&C business segment.
86
Summarized financial information
Summarized financial information for all jointly owned operations including VIEs that are accounted for using the equity method of accounting is as follows:
Balance Sheets
December 31, | |||||||
Dollars in millions | 2016 | 2015 | |||||
Current assets | $ | 2,655 | $ | 2,331 | |||
Noncurrent assets | 3,003 | 3,435 | |||||
Total assets | $ | 5,658 | $ | 5,766 | |||
Current liabilities | $ | 1,657 | $ | 1,501 | |||
Noncurrent liabilities | 3,148 | 3,742 | |||||
Total liabilities | $ | 4,805 | $ | 5,243 | |||
Statements of Operations
Years ended December 31, | |||||||||||
Dollars in millions | 2016 | 2015 | 2014 | ||||||||
Revenues | $ | 5,877 | $ | 5,245 | $ | 6,439 | |||||
Operating income | $ | 365 | $ | 635 | $ | 659 | |||||
Net income | $ | 192 | $ | 476 | $ | 419 | |||||
Unconsolidated Variable Interest Entities
The following summarizes the total assets and total liabilities as reflected in our consolidated balance sheets as well as our maximum exposure to losses related to our unconsolidated VIEs in which we have a significant variable interest but are not the primary beneficiary. Generally, our maximum exposure to loss is limited to our equity investment in the joint venture and any amounts payable to us for services we provided to the joint venture, reduced for any unearned revenues on the projects.
December 31, 2016 | |||||||||||
Dollars in millions | Total Assets | Total Liabilities | Maximum Exposure to Loss | ||||||||
Affinity project | $ | 12 | $ | 3 | $ | 12 | |||||
Aspire Defence project | $ | 14 | $ | 107 | $ | 14 | |||||
Ichthys LNG project | $ | 124 | $ | 33 | $ | 124 | |||||
U.K. Road projects | $ | 30 | $ | 9 | $ | 30 | |||||
EBIC Ammonia plant (65% interest) | $ | 34 | $ | 2 | $ | 22 | |||||
Dollars in millions | December 31, 2015 | ||||||||||
Total Assets | Total Liabilities | Maximum Exposure to Loss | |||||||||
Aspire Defence project | $ | 17 | $ | 121 | $ | 17 | |||||
Ichthys LNG project | $ | 87 | $ | 63 | $ | 87 | |||||
U.K. Road projects | $ | 34 | $ | 11 | $ | 34 | |||||
EBIC Ammonia plant (65% interest) | $ | 36 | $ | 2 | $ | 22 | |||||
87
Aspire Defence project. In April 2006, Aspire Defence, a joint venture between KBR and two financial investors, was awarded a privately financed project contract by the U.K. Ministry of Defence ("MoD") to upgrade and provide a range of services to the British Army’s garrisons at Aldershot and around Salisbury Plain in the U.K. In addition to a package of ongoing services to be delivered over 35 years, the project includes a nine-year construction program to improve soldiers’ single living, technical and administrative accommodations, along with leisure and recreational facilities. Aspire Defence manages the existing properties and is responsible for design, refurbishment, construction and integration of new and modernized facilities. We indirectly own a 45% interest in Aspire Defence, the project company that is the holder of the 35-year concession contract. In addition, we own a 50% interest in each of two joint ventures that provide the construction and the related support services to Aspire Defence. Our financial and performance guarantees are joint and several, subject to certain limitations, with our joint venture partners. The project is funded through equity and subordinated debt provided by the project sponsors and the issuance of publicly held senior bonds which are nonrecourse to us. The entities we hold an interest in are VIEs; however, we are not the primary beneficiary of these entities. We account for our interests in each of the entities using the equity method of accounting. As of December 31, 2016, included in our GS segment, our assets and liabilities associated with our investment in this project, within our consolidated balance sheets, were $14 million and $107 million, respectively. Our maximum exposure to loss of $14 million indicated in the table above is limited to our equity interest and amounts payable to us for services provided to the entity as of December 31, 2016. Our maximum exposure to construction and operating joint venture losses is limited to our proportionate share of any amounts required to fund future losses incurred by those entities under their respective contracts with the project company.
Ichthys LNG project. In January 2012, we formed a joint venture to provide EPC services to construct the Ichthys Onshore LNG Export Facility in Darwin, Australia ("Ichthys LNG project"). The project is being executed through two joint ventures, which are VIEs, in which we own a 30% equity interest. We account for our investments using the equity method of accounting. At December 31, 2016, our assets and liabilities associated with our investment in this project recorded in our consolidated balance sheets under our E&C business segment were $124 million and $33 million, respectively. Our maximum exposure to loss of $124 million indicated in the table above is limited to our equity interest and amounts payable to us for services provided to the entity as of December 31, 2016. We also have exposure to loss as a result of commercial agreements entered into by the Ichthys JV with its client and with its subcontractors. See Note 6 to our consolidated financial statements for further discussion on unapproved change orders and claims related to this project.
U.K. Road projects. We are involved in four privately financed projects, executed through joint ventures, to design, build, operate and maintain roadways for certain government agencies in the U.K. We have a 25% ownership interest in each of these joint ventures and account for them using the equity method of accounting. The joint ventures have obtained financing through third parties that is nonrecourse to the joint venture partners. These joint ventures are VIEs; however, we are not the primary beneficiary. At December 31, 2016, included in our GS business segment, our assets and liabilities associated with our investment in this project recorded in our consolidated balance sheets were $30 million and $9 million, respectively. Our maximum exposure to loss represents our equity investments in these ventures.
EBIC Ammonia project. We have an investment in a development corporation that has an indirect interest in the Egypt Basic Industries Corporation ("EBIC") ammonia plant project located in Egypt. We performed the EPC work for the project and completed our operations and maintenance services for the facility in the first half of 2012. We own 65% of this development corporation and consolidate it for financial reporting purposes. The development corporation owns a 25% ownership interest in a company that consolidates the ammonia plant which is considered a VIE. The development corporation accounts for its investment in the company using the equity method of accounting. The VIE is funded through debt and equity. Indebtedness of EBIC under its debt agreement is nonrecourse to us. We are not the primary beneficiary of the VIE. As of December 31, 2016, included in our E&C business segment, our assets and liabilities associated with our investment in this project, within our consolidated balance sheets, were $34 million and $2 million, respectively. Our maximum exposure to loss of $22 million indicated in the table above is limited to our proportionate share of the equity investment and amounts payable to us for services provided to the entity as of December 31, 2016.
88
Related Party Transactions
We often provide engineering, construction management and other subcontractor services to our joint ventures and our revenues include amounts related to these services. For the years ended December 31, 2016, 2015 and 2014, our revenues included $235 million, $291 million and $351 million, respectively, related to services we provided to our joint ventures, primarily those in our E&C business segment. Under the terms of our TSA with Brown & Root Industrial Services joint venture, we collect cash from customers and make payments to vendors and employees on behalf of the joint venture. For the years ended December 31, 2016 and 2015, we incurred approximately $16 million and $3 million, respectively, of reimbursable costs under the TSA. Also in 2015, we entered into an alliance agreement with our EPIC joint venture to provide certain pipe fabrication services to KBR. For the years ended December 31, 2016 and 2015, EPIC performed $25 million and $8 million, respectively, of services to KBR under the agreement. Amounts included in our consolidated balance sheets related to services we provided to our unconsolidated joint ventures for the years ended December 31, 2016 and 2015 are as follows:
December 31, | |||||||
Dollars in millions | 2016 | 2015 | |||||
Accounts receivable (a) | $ | 22 | $ | 7 | |||
Costs and estimated earnings in excess of billings on uncompleted contracts (b) | $ | 1 | $ | 5 | |||
Billings in excess of costs and estimated earnings on uncompleted contracts (b) | $ | 41 | $ | 55 | |||
Accounts payable (c) | $ | — | $ | 9 | |||
(a) | Includes a $11 million net receivable from the Brown & Root Industrial Services joint venture at December 31, 2016. |
(b) | Reflects CIE and BIE primarily related to joint ventures within our E&C business segment as discussed above. |
(c) | Reflects a $9 million net payable to the Brown & Root Industrial Services joint venture at December 31, 2015. |
Consolidated Variable Interest Entities
We consolidate VIEs if we determine we are the primary beneficiary of the project entity because we control the activities that most significantly impact the economic performance of the entity. The following is a summary of the significant VIEs where we are the primary beneficiary:
Dollars in millions | December 31, 2016 | ||||||
Total Assets | Total Liabilities | ||||||
Gorgon LNG project | $ | 28 | $ | 60 | |||
Escravos Gas-to-Liquids project | $ | 11 | $ | 22 | |||
Fasttrax Limited project | $ | 56 | $ | 50 | |||
Dollars in millions | December 31, 2015 | ||||||
Total Assets | Total Liabilities | ||||||
Gorgon LNG project | $ | 117 | $ | 145 | |||
Escravos Gas-to-Liquids project | $ | 16 | $ | 33 | |||
Fasttrax Limited project | $ | 74 | $ | 70 | |||
Gorgon LNG project. We have a 30% ownership in an Australian joint venture which was awarded a contract in 2005 for front end engineering design and in 2009 for EPC management services to construct an LNG plant. The joint venture is considered a VIE, and, because we are the primary beneficiary, we consolidate this joint venture for financial reporting purposes. We determined that we are the primary beneficiary of this project entity because we control the activities that most significantly impact economic performance of the entity.
Escravos Gas-to-Liquids ("GTL") project. During 2005, we formed a joint venture to engineer and construct a gas monetization facility in Escravos, Nigeria, which was completed in 2014. We own a 50% equity interest in the joint venture and determined that we are the primary beneficiary; accordingly, we have consolidated the joint venture for financial reporting purposes. There are no consolidated assets that collateralize the joint venture’s obligations. However, at December 31, 2016 and 2015, the joint venture had approximately $8 million and $7 million of cash, respectively, which mainly relates to advanced billings in connection with the joint venture’s obligations under the EPC contract that is expected to be fully closed out in 2017.
89
Fasttrax Limited project. In December 2001, the Fasttrax joint venture ("Fasttrax") was created to provide to the U.K. MoD a fleet of 91 new heavy equipment transporters ("HETs") capable of carrying a 72-ton Challenger II tank. Fasttrax owns, operates and maintains the HET fleet and provides heavy equipment transportation services to the British Army. The purchase of the assets was completed in 2004, and the operating and service contracts related to the assets extend through 2023. Fasttrax's entity structure includes a parent entity and its 100% owned subsidiary, Fasttrax Limited. KBR and its partner each own a 50% interest in the parent entity, which is considered a VIE. We determined that we are the primary beneficiary of this project entity because we control the activities that most significantly impact economic performance of the entity. Therefore, we consolidate this VIE.
The purchase of the HETs by the joint venture was financed through two series of bonds secured by the assets of Fasttrax Limited and a bridge loan totaling approximately £84.9 million (approximately $120 million at the exchange rate on the date of the transaction). The secured bonds are an obligation of Fasttrax Limited and are not a debt obligation of KBR as they are nonrecourse to the joint venture partners. Accordingly, in the event of a default on the notes, the lenders may only look to the assets of Fasttrax Limited for repayment. The bridge loan of approximately £12.2 million (approximately $17 million at the exchange rate on the date of the transaction) was replaced when the joint venture partners funded their equity and subordinated debt contributions in 2005. Assets collateralizing Fasttrax’s senior bonds include cash and equivalents of $15 million and net property, plant and equipment of approximately $36 million as of December 31, 2016. See Note 13 to our consolidated financial statements for further details regarding our nonrecourse project-finance debt of this VIE consolidated by KBR, including the total amount of debt outstanding at December 31, 2016.
Acquisition of Noncontrolling Interest
During the three months ended March 31, 2015, we entered into an agreement to acquire the noncontrolling interest in one of our consolidated joint ventures for $40 million. We also paid the partner previously accrued expenses of $8 million. The acquisition of these shares was recorded as an equity transaction, with a $40 million reduction in our paid-in capital in excess of par. In the fourth quarter of 2015, 25% of total shares of this joint venture were issued to a new partner.
Note 12. Pension Plans
We have elective defined contribution plans for our employees in the U.S. and retirement savings plans for our employees in the U.K., Canada and other locations. Our defined contribution plans provide retirement benefits in return for services rendered. These plans provide an individual account for each participant and have terms that specify how contributions to the participant’s account are to be determined rather than the amount of retirement benefits the participant is to receive. Contributions to these plans are based on pretax income discretionary amounts determined on an annual basis. Our expense for the defined contribution plans totaled $51 million in 2016, $67 million in 2015 and $72 million in 2014.
We have two frozen defined benefit plans in the U.S., one frozen plan in the U.K., and one frozen plan in Germany. We also participate in multi-employer plans in Canada. Substantially all of our defined benefit plans are funded pension plans, which define an amount of pension benefit to be provided, usually as a function of age, years of service or compensation.
90
Benefit obligations and plan assets
We used a December 31 measurement date for all plans in 2016 and 2015. Plan assets, expenses and obligations for retirement plans are presented in the following tables.
United States | Int’l | United States | Int’l | ||||||||||||
Dollars in millions | 2016 | 2015 | |||||||||||||
Change in projected benefit obligations: | |||||||||||||||
Projected benefit obligations at beginning of period | $ | 75 | $ | 1,849 | $ | 87 | $ | 2,138 | |||||||
Acquisitions | 12 | 3 | — | — | |||||||||||
Service cost | — | 1 | — | 2 | |||||||||||
Interest cost | 3 | 63 | 2 | 76 | |||||||||||
Foreign currency exchange rate changes | — | (304 | ) | (3 | ) | (174 | ) | ||||||||
Actuarial (gain) loss | — | 448 | — | (112 | ) | ||||||||||
Other | — | (1 | ) | — | — | ||||||||||
Benefits paid | (15 | ) | (89 | ) | (11 | ) | (81 | ) | |||||||
Projected benefit obligations at end of period | $ | 75 | $ | 1,970 | $ | 75 | $ | 1,849 | |||||||
Change in plan assets: | |||||||||||||||
Fair value of plan assets at beginning of period | $ | 59 | $ | 1,532 | $ | 66 | $ | 1,652 | |||||||
Acquisitions | 8 | — | — | — | |||||||||||
Actual return on plan assets | 3 | 235 | (1 | ) | 8 | ||||||||||
Employer contributions | 1 | 40 | 5 | 43 | |||||||||||
Foreign currency exchange rate changes | — | (255 | ) | — | (90 | ) | |||||||||
Benefits paid | (15 | ) | (89 | ) | (11 | ) | (81 | ) | |||||||
Other | — | — | — | — | |||||||||||
Fair value of plan assets at end of period | $ | 56 | $ | 1,463 | $ | 59 | $ | 1,532 | |||||||
Funded status | $ | (19 | ) | $ | (507 | ) | $ | (16 | ) | $ | (317 | ) | |||
United States | Int’l | United States | Int’l | ||||||||||||
Dollars in millions | 2016 | 2015 | |||||||||||||
Amounts recognized on the consolidated balance sheets | |||||||||||||||
Pension obligations | $ | 19 | $ | 507 | $ | 16 | $ | 317 | |||||||
Net periodic cost
United States | Int’l | United States | Int’l | United States | Int’l | ||||||||||||||||||
Dollars in millions | 2016 | 2015 | 2014 | ||||||||||||||||||||
Components of net periodic benefit cost | |||||||||||||||||||||||
Service cost | $ | — | $ | 1 | $ | — | $ | 2 | $ | — | $ | 2 | |||||||||||
Interest cost | 3 | 63 | 2 | 76 | 3 | 90 | |||||||||||||||||
Expected return on plan assets | (3 | ) | (87 | ) | (3 | ) | (97 | ) | (4 | ) | (102 | ) | |||||||||||
Settlements/curtailments | 1 | — | — | — | 1 | — | |||||||||||||||||
Recognized actuarial loss | 1 | 28 | 5 | 43 | 3 | 39 | |||||||||||||||||
Net periodic benefit cost | $ | 2 | $ | 5 | $ | 4 | $ | 24 | $ | 3 | $ | 29 | |||||||||||
The amounts in accumulated other comprehensive loss that have not yet been recognized as components of net periodic benefit cost at December 31, 2016 and 2015, net of tax were as follows:
91
United States | Int’l | United States | Int’l | ||||||||||||
Dollars in millions | 2016 | 2015 | |||||||||||||
Unrecognized actuarial loss, net of tax of $10 and $244, and $11 and $198, respectively | $ | 24 | $ | 761 | $ | 25 | $ | 535 | |||||||
Total in accumulated other comprehensive loss | $ | 24 | $ | 761 | $ | 25 | $ | 535 | |||||||
Estimated amounts that will be amortized from accumulated other comprehensive income, net of tax, into net periodic benefit cost in 2017 are as follows:
Dollars in millions | United States | Int’l | |||||
Actuarial loss | $ | 1 | $ | 24 | |||
Total | $ | 1 | $ | 24 | |||
Weighted-average assumptions used to determine net periodic benefit cost | |||||||||||||||||
United States | Int'l | United States | Int'l | United States | Int'l | ||||||||||||
2016 | 2015 | 2014 | |||||||||||||||
Discount rate | 3.42 | % | 3.75 | % | 2.89 | % | 3.65 | % | 3.38 | % | 4.45 | % | |||||
Expected return on plan assets | 5.00 | % | 6.10 | % | 4.81 | % | 6.25 | % | 5.28 | % | 6.45 | % | |||||
Weighted-average assumptions used to determine benefit obligations at measurement date | |||||||||||
United States | Int'l | United States | Int'l | ||||||||
2016 | 2015 | ||||||||||
Discount rate | 3.73 | % | 2.60 | % | 3.42 | % | 3.75 | % | |||
Assumed long-term rates of return on plan assets and discount rates for estimating benefit obligations vary for the different plans according to the local economic conditions. The expected long-term rate of return on assets was determined by a stochastic projection that takes into account asset allocation strategies, historical long-term performance of individual asset classes, an analysis of additional return (net of fees) generated by active management, risks using standard deviations and correlations of returns among the asset classes that comprise the plans’ asset mix. The discount rate used to determine the benefit obligations was computed using a yield curve approach that matches plan specific cash flows to a spot rate yield curve based on high quality corporate bonds. Because all plans have been frozen, there is no rate of compensation increase.
Plan fiduciaries of our retirement plans set investment policies and strategies and oversee the investment direction, which includes selecting investment managers, commissioning asset-liability studies and setting long-term strategic targets. Long-term strategic investment objectives include preserving the funded status of the plan and balancing risk and return and have diversified asset types, fund strategies and fund managers. Targeted asset allocation ranges are guidelines, not limitations and occasionally plan fiduciaries will approve allocations above or below a target range.
The target asset allocation for our U.S. and International plans for 2017 is as follows:
Asset Allocation | 2017 Targeted | ||||
United States | Int'l | ||||
Equity funds and securities | 53 | % | 20 | % | |
Fixed income funds and securities | 46 | % | 38 | % | |
Hedge funds | — | % | 21 | % | |
Real estate funds | 1 | % | 5 | % | |
Other | — | % | 16 | % | |
Total | 100 | % | 100 | % | |
92
The range of targeted asset allocations for our International plans for 2017 and 2016, by asset class, are as follows:
International Plans | 2017 Targeted | 2016 Targeted | |||||||||
Percentage Range | Percentage Range | ||||||||||
Minimum | Maximum | Minimum | Maximum | ||||||||
Equity funds and securities | — | % | 60 | % | — | % | 60 | % | |||
Fixed income funds and securities | — | % | 100 | % | — | % | 100 | % | |||
Hedge funds | — | % | 35 | % | — | % | 35 | % | |||
Real estate funds | — | % | 10 | % | — | % | 10 | % | |||
Other | — | % | 20 | % | — | % | 20 | % | |||
The range of targeted asset allocations for our U.S. plans for 2017 and 2016, by asset class, are as follows:
Domestic Plans | 2017 Targeted | 2016 Targeted | |||||||||
Percentage Range | Percentage Range | ||||||||||
Minimum | Maximum | Minimum | Maximum | ||||||||
Cash and cash equivalents | — | % | — | % | 19 | % | 19 | % | |||
Equity funds and securities | 52 | % | 55 | % | 49 | % | 49 | % | |||
Fixed income funds and securities | 44 | % | 47 | % | 32 | % | 32 | % | |||
Real estate funds | 1 | % | 1 | % | — | % | — | % | |||
ASC 820 - Fair Value Measurement addresses fair value measurements and disclosures, defines fair value, establishes a framework for using fair value to measure assets and liabilities and expands disclosures about fair value measurements. This standard applies whenever other standards require or permit assets or liabilities to be measured at fair value. ASC 820 establishes a three-tier value hierarchy, categorizing the inputs used to measure fair value. The inputs and methodology used for valuing securities are not an indication of the risk associated with investing in those securities. The following is a description of the primary valuation methodologies and classification used for assets measured at fair value.
Fair values of our Level 1 assets are based on observable inputs such as unadjusted quoted prices for identical assets in active markets. These consist of securities valued at the closing price reported on the active market on which the individual securities are traded.
Fair values of our Level 2 assets are based on inputs other than the quoted prices in active markets that are observable either directly or indirectly, such as quoted prices for similar assets; quoted prices that are in inactive markets; inputs other than quoted prices that are observable for the asset; and inputs that are derived principally from or corroborated by observable market data by correlation or other means.
Fair values of our Level 3 assets are based on unobservable inputs in which there is little or no market data and require us to develop our own assumptions.
93
A summary of total investments for KBR’s pension plan assets measured at fair value is presented below.
Fair Value Measurements at Reporting Date | |||||||||||||||
Dollars in millions | Total | Level 1 | Level 2 | Level 3 | |||||||||||
Asset Category at December 31, 2016 | |||||||||||||||
United States plan assets | |||||||||||||||
Investments measured at net asset value | $ | 56 | $ | — | $ | — | $ | — | |||||||
Total United States plan assets | $ | 56 | $ | — | $ | — | $ | — | |||||||
International plan assets | |||||||||||||||
Equities | $ | 76 | $ | 60 | $ | — | $ | 16 | |||||||
Fixed income | 12 | — | — | 12 | |||||||||||
Real estate | 4 | — | — | 4 | |||||||||||
Cash and cash equivalents | 8 | 8 | — | — | |||||||||||
Other | 50 | — | — | 50 | |||||||||||
Investments measured at net asset value | 1,313 | — | — | — | |||||||||||
Total international plan assets | $ | 1,463 | $ | 68 | $ | — | $ | 82 | |||||||
Total plan assets at December 31, 2016 | $ | 1,519 | $ | 68 | $ | — | $ | 82 | |||||||
Fair Value Measurements at Reporting Date | |||||||||||||||
Dollars in millions | Total | Level 1 | Level 2 | Level 3 | |||||||||||
Asset Category at December 31, 2015 | |||||||||||||||
United States plan assets | |||||||||||||||
Investments measured at net asset value | $ | 59 | $ | — | $ | — | $ | — | |||||||
Total United States plan assets | $ | 59 | $ | — | $ | — | $ | — | |||||||
International plan assets | |||||||||||||||
Equities | $ | 66 | $ | 54 | $ | — | $ | 12 | |||||||
Fixed income | 14 | — | — | 14 | |||||||||||
Real estate | 6 | — | — | 6 | |||||||||||
Cash and cash equivalents | 10 | 10 | — | — | |||||||||||
Other | 13 | — | — | 13 | |||||||||||
Investments measured at net asset value | 1,423 | — | — | — | |||||||||||
Total international plan assets | $ | 1,532 | $ | 64 | $ | — | $ | 45 | |||||||
Total plan assets at December 31, 2015 | $ | 1,591 | $ | 64 | $ | — | $ | 45 | |||||||
94
The fair value measurement of plan assets using significant unobservable inputs (Level 3) changed each year due to the following:
Level 3 fair value measurement rollforward
Dollars in millions | Total | Equities | Fixed Income | Real Estate | Other | ||||||||||||||
International plan assets | |||||||||||||||||||
Balance as of December 31, 2014 | $ | 42 | $ | 6 | $ | 11 | $ | 12 | $ | 13 | |||||||||
Return on assets held at end of year | 2 | 1 | — | (2 | ) | 3 | |||||||||||||
Return on assets sold during the year | 5 | — | — | 5 | — | ||||||||||||||
Purchases, sales and settlements | (1 | ) | 5 | 4 | (8 | ) | (2 | ) | |||||||||||
Foreign exchange impact | (3 | ) | — | (1 | ) | (1 | ) | (1 | ) | ||||||||||
Balance as of December 31, 2015 | $ | 45 | $ | 12 | $ | 14 | $ | 6 | $ | 13 | |||||||||
Return on assets held at end of year | 14 | 1 | 1 | 1 | 11 | ||||||||||||||
Return on assets sold during the year | — | — | — | — | — | ||||||||||||||
Purchases, sales and settlements, net | 32 | 5 | (1 | ) | (3 | ) | 31 | ||||||||||||
Foreign exchange impact | (9 | ) | (2 | ) | (2 | ) | — | (5 | ) | ||||||||||
Balance as of December 31, 2016 | $ | 82 | $ | 16 | $ | 12 | $ | 4 | $ | 50 | |||||||||
Expected cash flows
Contributions. Funding requirements for each plan are determined based on the local laws of the country where such plans reside. In certain countries the funding requirements are mandatory while in other countries they are discretionary. We expect to contribute $36 million to our pension plans in 2017.
Benefit payments. The following table presents the expected benefit payments over the next 10 years.
Pension Benefits | |||||||
Dollars in millions | United States | Int’l | |||||
2017 | $ | 5 | $ | 48 | |||
2018 | $ | 5 | $ | 50 | |||
2019 | $ | 5 | $ | 51 | |||
2020 | $ | 5 | $ | 52 | |||
2021 | $ | 5 | $ | 53 | |||
Years 2022 – 2026 | $ | 25 | $ | 287 | |||
Multiemployer Pension Plans
We participate in multiemployer plans in Canada. Generally, the plans provide defined benefits to substantially all employees covered by collective bargain agreements. Under the terms of these agreements, our obligations are discharged upon plan contributions and are not subject to any assessments for unfunded liabilities upon our termination or withdrawal.
Our aggregate contributions to these plans were $1 million in 2016, $8 million in 2015 and $29 million in 2014. At December 31, 2016, none of the plans in which we participate is individually significant to our consolidated financial statements.
Deferred Compensation Plans
Our Elective Deferral Plan is a nonqualified deferred compensation program that provides benefits payable to officers, certain key employees or their designated beneficiaries and non-employee directors at specified future dates, upon retirement, or death. Except for $7 million and $8 million of mutual funds included in "other assets" on our consolidated balance sheets at December 31, 2016 and 2015, respectively, designated for a portion of our employee deferral plan, the plan is unfunded. The mutual funds are carried at fair value which includes readily determinable or published net asset values and may be liquidated in the near term without restrictions.
95
The following table presents our obligations under our employee deferred compensation plan included in "employee compensation and benefits" in our consolidated balance sheets.
December 31, | |||||||
Dollars in millions | 2016 | 2015 | |||||
Deferred compensation plans obligations | $ | 70 | $ | 70 | |||
Note 13. Debt and Other Credit Facilities
Credit Agreement
On September 25, 2015, we entered into a new $1 billion, unsecured revolving credit agreement (the "Credit Agreement") with a syndicate of banks. The Credit Agreement is guaranteed by certain of the Company's domestic subsidiaries, matures in September 2020 and is available for cash borrowings and the issuance of letters of credit related to general corporate needs. Subject to certain conditions, we may request (i) that the aggregate commitments under the Credit Agreement be increased by up to an additional $500 million, and (ii) that the maturity date of the Credit Agreement be extended by two additional one-year terms.
Amounts drawn under the Credit Agreement will bear interest at variable rates, per annum, based either on (i) the London interbank offered rate ("LIBOR") plus an applicable margin of 1.375% to 1.75%, or (ii) a base rate plus an applicable margin of 0.375% to 0.75%, with the base rate equal to the highest of (a) reference bank’s publicly announced base rate, (b) the Federal Funds Rate plus 0.5%, or (c) LIBOR plus 1%. The amount of the applicable margin to be applied will be determined by the Company’s ratio of consolidated debt to consolidated EBITDA for the prior four fiscal quarters, as defined in the Credit Agreement. The Credit Agreement provides for fees on letters of credit issued under the Credit Agreement at a rate equal to the applicable margin for LIBOR-based loans, except for performance letters of credit, which are priced at 50% of such applicable margin. KBR pays an annual issuance fee of 0.125% of the face amount of a letter of credit and pays a commitment fee of 0.225% to 0.25%, per annum, on any unused portion of the commitment under the Credit Agreement based on the Company's consolidated leverage ratio. As of December 31, 2016, there were $85 million in letters of credit outstanding. As a result of the Wyle and HTSI acquisitions discussed in Note 3 to our consolidated financial statements, we funded $700 million of acquisition consideration with borrowings under our Credit Agreement, of which $650 million remains outstanding as of December 31, 2016. We intend to seek long-term financing to replace a portion of this debt in 2017.
The Credit Agreement contains customary covenants as defined by the agreement which include financial covenants requiring maintenance of a ratio of consolidated debt to a rolling four-quarter consolidated EBITDA not greater than 3.5 to 1 and a minimum consolidated net worth of $1.2 billion plus 50% of consolidated net income for each quarter beginning September 30, 2015 and 100% of any increase in shareholders’ equity attributable to the sale of equity interests, but excluding any adjustments in shareholders' equity attributable to changes in foreign currency translation adjustments. In December 2016, we obtained an amendment to the EBITDA financial covenant to eliminate the impact, for certain periods and subject to certain dollar limits, of previously recorded project losses attributed to an EPC ammonia project and a power project in the U.S. The amendment also amends the maximum ratio of consolidated debt to consolidated EBITDA to 3.25 to 1 effective for periods after December 31, 2017. As of December 31, 2016, we were in compliance with our financial covenants.
The Credit Agreement contains a number of other covenants restricting, among other things, our ability to incur additional liens and indebtedness, enter into asset sales, repurchase our equity shares and make certain types of investments. Our subsidiaries are restricted from incurring indebtedness, except if such indebtedness relates to purchase money obligations, capitalized leases, refinancing or renewals secured by liens upon or in property acquired, constructed or improved in an aggregate principal amount not to exceed $200 million at any time outstanding. Additionally, our subsidiaries may incur unsecured indebtedness not to exceed $200 million in aggregate outstanding principal amount at any time. We are also permitted to repurchase our equity shares, provided that no such repurchases shall be made from proceeds borrowed under the Credit Agreement, and that the aggregate purchase price and dividends paid after September 25, 2015, does not exceed the Distribution Cap (equal to the sum of $750 million plus the lesser of (1) $400 million and (2) the amount received by us in connection with the arbitration and subsequent litigation of the PEP contracts as discussed in Note 16 to our consolidated financial statements). As of December 31, 2016, the remaining availability under the Distribution Cap was approximately $652 million.
96
Letters of credit, surety bonds and guarantees
In connection with certain projects, we are required to provide letters of credit, surety bonds or guarantees to our customers. Letters of credit are provided to certain customers and counterparties in the ordinary course of business as credit support for contractual performance guarantees, advanced payments received from customers and future funding commitments. We have approximately $2 billion in committed and uncommitted lines of credit to support the issuance of letters of credit and as of December 31, 2016, we have utilized $450 million of our present capacity under lines of credit. Surety bonds are also posted under the terms of certain contracts to guarantee our performance. As of December 31, 2016, we have approximately $900 million of remaining capacity in these committed and uncommitted lines of credit after taking into account the $650 million of outstanding revolver borrowings. The letters of credit outstanding included $85 million issued under our Credit Agreement and $365 million issued under uncommitted bank lines as of December 31, 2016. Of the letters of credit outstanding under our Credit Agreement, no letters of credit have expiry dates beyond the maturity date of the Credit Agreement. Of the total letters of credit outstanding, $168 million relate to our joint venture operations where the letters of credit are posted using our capacity to support our pro-rata share of obligations under various contracts executed by joint ventures of which we are a member. As the need arises, future projects will be supported by letters of credit issued under our Credit Agreement or other lines of credit arranged on a bilateral, syndicated or other basis. We believe we have adequate letter of credit capacity under our Credit Agreement and bilateral lines of credit to support our operations for the next twelve months.
Nonrecourse Project Debt
Fasttrax Limited, a joint venture in which we indirectly own a 50% equity interest with an unrelated partner, was awarded a concession contract in 2001 with the U.K. MoD to provide a Heavy Equipment Transporter Service to the British Army. See Note 11 to our consolidated financial statements for further discussion on the joint venture. Under the terms of the arrangement, Fasttrax Limited operates and maintains 91 heavy equipment transporters HETs for a term of 22 years. The purchase of the HETs by the joint venture was financed through two series of bonds secured by the assets of Fasttrax Limited and a bridge loan totaling approximately £84.9 million (approximately $120 million at the exchange rate on the date of the transaction). The secured bonds are an obligation of Fasttrax Limited and are not a debt obligation of KBR as they are nonrecourse to the joint venture partners. Accordingly, in the event of a default on the notes, the lenders may only look to the assets of Fasttrax Limited for repayment. The bridge loan of approximately £12.2 million (approximately $17 million at the exchange rate on the date of the transaction) was replaced when the joint venture partners funded their equity and subordinated debt contributions in 2005.
The secured bonds were issued in two classes consisting of Class A 3.5% Index Linked Bonds in the amount of £56 million (approximately $79 million at the exchange rate on the date of the transaction) and Class B 5.9% Fixed Rate Bonds in the amount of £16.7 million (approximately $24 million at the exchange rate on the date of the transaction). Semi-annual payments on both classes of bonds commenced in March 2005 and will continue through maturity in 2021. The subordinated notes payable to each of the partners initially bear interest at 11.25% increasing to 16% over the term of the notes until maturity in 2025. For financial reporting purposes, only our partner's portion of the subordinated notes appears in the consolidated financial statements.
The following table summarizes the combined principal installments for both classes of bonds and subordinated notes, including inflation adjusted bond indexation over the next five years and beyond as of December 31, 2016:
Dollars in millions | Payments Due | ||
2017 | $ | 8 | |
2018 | $ | 9 | |
2019 | $ | 10 | |
2020 | $ | 10 | |
2021 | $ | 5 | |
Beyond 2021 | $ | 1 | |
97
Note 14. Income Taxes
The United States and foreign components of income (loss) before income taxes and noncontrolling interests were as follows:
Years ended December 31, | |||||||||||
Dollars in millions | 2016 | 2015 | 2014 | ||||||||
United States | $ | (250 | ) | $ | (35 | ) | $ | (1,051 | ) | ||
Foreign: | |||||||||||
United Kingdom | 55 | 105 | 130 | ||||||||
Australia | 38 | 32 | 180 | ||||||||
Canada | (8 | ) | 87 | (101 | ) | ||||||
Middle East | 66 | 35 | (12 | ) | |||||||
Africa | 76 | 34 | 28 | ||||||||
Other | 56 | 54 | 49 | ||||||||
Subtotal | 283 | 347 | 274 | ||||||||
Total | $ | 33 | $ | 312 | $ | (777 | ) | ||||
The total income taxes included in the statements of operations and in shareholders' equity were as follows:
Years ended December 31, | |||||||||||
Dollars in millions | 2016 | 2015 | 2014 | ||||||||
Provision for income taxes | $ | (84 | ) | $ | (86 | ) | $ | (421 | ) | ||
Shareholders' equity, foreign currency translation adjustment | (3 | ) | (3 | ) | 4 | ||||||
Shareholders' equity, pension and post-retirement benefits | 45 | (22 | ) | 10 | |||||||
Total income taxes | $ | (42 | ) | $ | (111 | ) | $ | (407 | ) | ||
The components of the provision for income taxes were as follows:
Dollars in millions | Current | Deferred | Total | ||||||||
Balance as of December 31, 2016 | |||||||||||
Federal | $ | (5 | ) | $ | 9 | $ | 4 | ||||
Foreign | (61 | ) | (26 | ) | (87 | ) | |||||
State and other | — | (1 | ) | (1 | ) | ||||||
Provision for income taxes | $ | (66 | ) | $ | (18 | ) | $ | (84 | ) | ||
Balance as of December 31, 2015 | |||||||||||
Federal | $ | (17 | ) | $ | 8 | $ | (9 | ) | |||
Foreign | (55 | ) | (22 | ) | (77 | ) | |||||
State and other | — | — | — | ||||||||
Provision for income taxes | $ | (72 | ) | $ | (14 | ) | $ | (86 | ) | ||
Balance as of December 31, 2014 | |||||||||||
Federal | $ | 41 | $ | (333 | ) | $ | (292 | ) | |||
Foreign | (110 | ) | (11 | ) | (121 | ) | |||||
State and other | 1 | (9 | ) | (8 | ) | ||||||
Provision for income taxes | $ | (68 | ) | $ | (353 | ) | $ | (421 | ) | ||
98
The components of our total foreign income tax provision were as follows:
Years ended December 31, | |||||||||||
Dollars in millions | 2016 | 2015 | 2014 | ||||||||
United Kingdom | $ | (6 | ) | $ | (15 | ) | $ | (22 | ) | ||
Australia | — | 16 | (24 | ) | |||||||
Canada | 1 | 3 | 6 | ||||||||
Middle East | (24 | ) | (8 | ) | (5 | ) | |||||
Africa | (22 | ) | (10 | ) | (24 | ) | |||||
Other | (36 | ) | (63 | ) | (52 | ) | |||||
Foreign provision for income taxes | $ | (87 | ) | $ | (77 | ) | $ | (121 | ) | ||
The components of our deferred income tax provision were as follows:
Years ended December 31, | |||||||||||
Dollars in millions | 2016 | 2015 | 2014 | ||||||||
Expected deferred benefit | $ | 35 | $ | 14 | $ | 254 | |||||
Tax reserves and allowances on current year activity | (1 | ) | (20 | ) | (210 | ) | |||||
Tax reserves and allowances on beginning of year deferred balances | — | — | (320 | ) | |||||||
Unremitted foreign earnings | (51 | ) | — | (77 | ) | ||||||
U.K. statutory rate change | (1 | ) | (8 | ) | — | ||||||
Total deferred provision for income taxes | $ | (18 | ) | $ | (14 | ) | $ | (353 | ) | ||
Our effective tax rates on income from operations differed from the statutory U.S. federal income tax rate of 35% as a result of the following:
Years ended December 31, | ||||||||
2016 | 2015 | 2014 | ||||||
U.S. statutory federal rate, expected (benefit) provision | 35 | % | 35 | % | (35 | )% | ||
Increase (reduction) in tax rate from: | ||||||||
Rate differentials on foreign earnings | (28 | ) | (10 | ) | (5 | ) | ||
Noncontrolling interests and equity earnings | (28 | ) | (8 | ) | (4 | ) | ||
State and local income taxes, net of federal benefit | — | 2 | (2 | ) | ||||
Other permanent differences, net | 54 | — | 2 | |||||
Contingent liability accrual | 41 | (1 | ) | 9 | ||||
U.S. taxes on foreign unremitted earnings | 174 | 1 | 11 | |||||
Non-deductible goodwill impairment | — | — | 20 | |||||
Change in valuation allowance | 3 | 6 | 58 | |||||
U.K. statutory rate change | 4 | 3 | — | |||||
Effective tax rate on income from operations | 255 | % | 28 | % | 54 | % | ||
99
The primary components of our deferred tax assets and liabilities were as follows:
Years ended December 31, | |||||||
Dollars in millions | 2016 | 2015 | |||||
Deferred tax assets: | |||||||
Employee compensation and benefits | $ | 166 | $ | 140 | |||
Foreign tax credit carryforwards | 356 | 282 | |||||
Accrued foreign tax credit carryforwards | 93 | 97 | |||||
Loss carryforwards | 69 | 65 | |||||
Insurance accruals | 15 | 15 | |||||
Allowance for bad debt | 9 | 10 | |||||
Accrued liabilities | 49 | 45 | |||||
Total gross deferred tax assets | 757 | 654 | |||||
Valuation allowances | (542 | ) | (542 | ) | |||
Net deferred tax assets | 215 | 112 | |||||
Deferred tax liabilities: | |||||||
Construction contract accounting | (34 | ) | (12 | ) | |||
Intangibles | (29 | ) | (25 | ) | |||
Indefinite-lived intangibles | (39 | ) | — | ||||
Depreciation and amortization | 2 | (2 | ) | ||||
Unremitted foreign earnings | (63 | ) | (39 | ) | |||
Other | (82 | ) | (29 | ) | |||
Total gross deferred tax liabilities | (245 | ) | (107 | ) | |||
Deferred income tax (liabilities) assets, net | $ | (30 | ) | $ | 5 | ||
The valuation allowance for deferred tax assets was $542 million at December 31, 2016 and 2015, respectively. The net change in the total valuation allowance remained unchanged in 2016 and was $4 million in 2015. The valuation allowance at December 31, 2016 was primarily related to U.S. federal, foreign and state net operating loss carryforwards, foreign tax credit carryforwards and other deferred tax assets that, in the judgment of management, are not more-likely-than-not to be realized. In assessing the realizability of deferred tax assets, management considers whether it is more likely than not that some portion or all of the deferred tax assets will not be realized. The ultimate realization of deferred tax assets is dependent on the generation of future taxable income during the periods in which those temporary differences become deductible. Management considers the scheduled reversal of deferred tax liabilities (including the impact of available carryback and carryforward periods), projected future taxable income and tax-planning strategies in making this assessment. Based upon the significant level of historical taxable U.S. losses, management believes that it was not more-likely-than-not that we would be able to realize the benefits of the deductible differences and accordingly recognized a valuation allowance for the year ended December 31, 2016 and 2015 for any deferred tax assets not more-likely-than-not to be realized.
The net deferred tax balance by major jurisdiction after valuation allowance as of December 31, 2016 was as follows:
Dollars in millions | Net Gross Deferred Asset (Liability) | Valuation Allowance | Deferred Asset (Liability), net | ||||||||
United States | $ | 459 | $ | (506 | ) | $ | (47 | ) | |||
United Kingdom | 104 | — | 104 | ||||||||
Australia | 1 | (1 | ) | — | |||||||
Canada | 22 | (16 | ) | 6 | |||||||
Mexico | (92 | ) | — | (92 | ) | ||||||
Other | 18 | (19 | ) | (1 | ) | ||||||
Total | $ | 512 | $ | (542 | ) | $ | (30 | ) | |||
100
At December 31, 2016, the amount of gross tax attributes available prior to the offset with related uncertain tax positions were as follows:
Dollars in millions | December 31, 2016 | Expiration | |||
Foreign tax credit carryforwards | $ | 485 | 2019-2026 | ||
Foreign net operating loss carryforwards | $ | 128 | 2017-2037 | ||
Foreign net operating loss carryforwards | $ | 32 | Indefinite | ||
State net operating loss carryforwards | $ | 598 | Various | ||
In determining our foreign cash repatriation strategy and in determining whether earnings would continue to be considered permanently invested, we considered our future U.S. and non-U.S. cash needs such as 1) our anticipated foreign working capital requirements, including funding of our U.K. pension plan, 2) the expected growth opportunities across all geographical markets and 3) our plans to invest in strategic growth opportunities that may include acquisitions around the world. The remaining international cash balances associated with past foreign earnings which we currently intend to permanently reinvest in our foreign entities are not available for domestic use. The company has not recognized an estimated deferred tax liability of approximately $319 million for undistributed earnings of $1.5 billion that it continues to consider to be permanently reinvested in the foreseeable future. These undistributed earnings could be subject to additional tax if remitted, or deemed remitted, as a dividend.
A reconciliation of the beginning and ending amount of total unrecognized tax benefits is as follows:
Dollars in millions | 2016 | 2015 | 2014 | ||||||||
Balance at January 1, | $ | 257 | $ | 228 | $ | 68 | |||||
Increases related to current year tax positions | 2 | 18 | 13 | ||||||||
Increases related to tax positions from acquisitions | 14 | — | — | ||||||||
Increases related to prior year tax positions | 10 | 35 | 168 | ||||||||
Decreases related to prior year tax positions | (4 | ) | (3 | ) | (13 | ) | |||||
Settlements | (10 | ) | (2 | ) | (1 | ) | |||||
Lapse of statute of limitations | (6 | ) | (16 | ) | (5 | ) | |||||
Other, primarily due to exchange rate fluctuations affecting non-U.S. tax positions | (2 | ) | (3 | ) | (2 | ) | |||||
Balance at December 31, | $ | 261 | $ | 257 | $ | 228 | |||||
The total amount of unrecognized tax benefits that, if recognized, would affect our effective tax rate was approximately $248 million as of December 31, 2016. The difference between this amount and the amounts reflected in the tabular reconciliation above relates primarily to deferred income tax benefits on uncertain tax positions related to income taxes. In the next twelve months, it is reasonably possible that our uncertain tax positions could change by approximately $4 million due to the expirations of statutes of limitations.
We recognize accrued interest and penalties related to uncertain tax positions in income tax expense in our consolidated statements of operations. Our accrual for interest and penalties was $14 million and $13 million for each of the years ended December 31, 2016 and 2015, respectively. During the years ended December 31, 2016, 2015, we recognized net interest and penalties charges (benefits) of less than $1 million related to uncertain tax positions. During the year ended December 31, 2014, we recognized net interest and penalties charges (benefits) of $1 million related to uncertain tax positions.
KBR is the parent of a group of domestic companies that are members of a U.S. consolidated federal income tax return. We also file income tax returns in various states and foreign jurisdictions. With few exceptions, we are no longer subject to examination by tax authorities for U.S. federal or state and local income tax for years before 2007.
KBR is subject to a tax sharing agreement primarily covering periods prior to the April 2007 separation from Halliburton. The tax sharing agreement provides, in part, that KBR will be responsible for any audit settlements directly attributable to its business activity for periods prior to its separation from our former parent. As of December 31, 2016 and 2015, we have recorded $19 million in "other liabilities" on our consolidated balance sheets, respectively, for tax related items under the tax sharing agreement. The balance is not due until receipt by KBR of a future foreign tax credit refund claim filed with the IRS.
101
Note 15. U.S. Government Matters
We provide services to various U.S. governmental agencies, which include the U.S. Department of Defense ("DoD") and the Department of State. We may have disagreements or experience performance issues on our U.S. government contracts. When performance issues arise under any of these contracts, the U.S. government retains the right to pursue various remedies, including challenges to expenditures, suspension of payments, fines and suspensions or debarment from future business with the U.S. government.
Between 2002 and 2011, we provided significant support to the U.S. Army and other U.S. government agencies in support of the war in Iraq under the LogCAP III contract. We continue to support the U.S. government around the world under the LogCAP IV and other contracts. We have been in the process of closeout of the LogCAP III contract since 2011, and we expect the closeout process to continue through at least 2018. As a result of our work under LogCAP III, there are claims and disputes pending between us and the U.S. government, which need to be resolved in order to close the contracts. The closeout process includes resolving objections raised by the U.S. government through a billing dispute process referred to as Form 1s and Memorandums for Record ("MFRs"). We continue to work with the U.S. government to resolve these issues and are engaged in efforts to reach mutually acceptable resolution of these outstanding matters. However, for certain of these matters, we have filed claims with the Armed Services Board of Contract Appeals ("ASBCA") or the U.S. Court of Federal Claims ("COFC"). We also have matters related to ongoing litigation or investigations involving U.S. government contracts. We anticipate billing additional labor, vendor resolution and litigation costs as we resolve the open matters. At this time, we cannot determine the timing or net amounts to be collected or paid to close out these contracts.
Form 1s
The U.S. government has issued Form 1s questioning or objecting to costs we billed to them primarily related to (1) our
use of private security and our provision of containerized housing under the LogCAP III contract discussed above and (2) our
provision of emergency construction services primarily to U.S. government facilities damaged by Hurricanes Katrina and Wilma, under our CONCAP III contract with the U.S. Navy. As a consequence of the issuance of the Form 1s, the U.S. government has withheld payment to us on outstanding invoices, pending resolution of these matters. In certain cases, we have also withheld payment to our subcontractors related to pay-when-paid contractual terms.
The U.S. government had issued Form 1s, questioning $173 million of billed costs as of December 31, 2016 and 2015, respectively. They had previously paid us $90 million as of each period related to our services on these contracts and the remaining balance of $83 million for each period is included in “claims and accounts receivable" on our consolidated balance sheets. In addition, we have withheld $26 million and $32 million from our subcontractors at December 31, 2016 and 2015, respectively, related to these questioned costs.
While we continue to believe that the amounts we have invoiced the U.S. government are in compliance with our contract terms and that recovery is probable, we also continue to evaluate our ability to recover these amounts as new information becomes known. As is common in the industry, negotiating and resolving these matters is often an involved and lengthy process, which sometimes necessitates the filing of claims or other legal action as discussed above. Concurrent with our continued negotiations with the U.S. government, we await the rulings on the filed claims. We are unable to predict when the rulings will be issued or when the matters will be settled or resolved with the U.S. government.
Audits
In addition to reviews performed by the U.S. government through the Form 1 process, the negotiation, administration and settlement of our contracts, which primarily consist of DoD contracts, are subject to audit by the Defense Contract Audit Agency ("DCAA"). The U.S. government DCAA serves in an advisory role to the Defense Contract Management Agency ("DCMA") and the DCMA is responsible for the administration of the majority of our contracts. The scope of these audits include, among other things, the validity of direct and indirect incurred costs, provisional approval of annual billing rates, approval of annual overhead rates, compliance with the Federal Acquisition Regulation ("FAR") and Cost Accounting Standards ("CAS"), compliance with certain unique contract clauses and audits of certain aspects of our internal control systems.
As of December 31, 2016, the DCAA has completed audits and we have concluded negotiations of both direct and indirect incurred costs for the historical GS activities, including the LOGCAP III contract, through 2011. We have received DCAA audits reports for 2012 and 2013 with minimal amounts of questioned costs. The DCAA is scheduling reviews for the years subsequent to 2013. Based on the information received to date, we do not believe the completed or ongoing government audits on the historical GS activities will have a material adverse impact on our results of operations, financial position or cash flows.
102
As of December 31, 2016, the DCAA has completed audits of incurred direct and indirect costs through 2009 and 2011 and final rates are negotiated through 2009 and 2010 for Wyle and HTSI, respectively. The DCAA has questioned minimal cost for the on-going audits. Based on the information received to date, we do not believe that the completed or on-going audits on the Wyle and HTSI activities will have a material adverse impact on our results of operations, financial position or cash flows.
As a result of the Form 1s, open audits and claims discussed above, we have accrued a reserve for unallowable costs at December 31, 2016 and 2015 of $64 million and $50 million, respectively as a reduction to “claims and accounts receivable” and in “other liabilities” on our consolidated balance sheet.
Investigations, Qui Tams and Litigation
The following matters relate to ongoing litigation or federal investigations involving U.S. government contracts. Many of these matters involve allegations of violations of the False Claims Act ("FCA"), which prohibits in general terms fraudulent billings to the government. Suits brought by private individuals are called "qui tams." We believe the costs of litigation and any damages that may be awarded in the FKTC, Electrocution, and Burn Pit matters described below are billable under the LogCAP III contract or, as was the case for the Electrocution litigation, covered by insurance, and that any such costs or damages awarded in the Sodium Dichromate matter will continue to be billable under the Restore Iraqi Oil (“RIO”) contract and the related indemnity described below. All costs billed under LogCAP III or RIO are subject to audit by the DCAA for reasonableness.
First Kuwaiti Trading Company arbitration. In April 2008, First Kuwaiti Trading Company ("FKTC"), one of our LogCAP III subcontractors providing housing containers, filed for arbitration with the American Arbitration Association of all its claims under various LogCAP III subcontracts. After complete hearings on all of FKTC's claims, an arbitration panel awarded $17 million plus interest for claims involving damages on lost or unreturned vehicles. In addition, we determined that we owe FKTC $32 million in connection with other subcontracts. We paid FKTC $19 million and will pay $4 million on pay-when-paid terms in the contract. We have accrued amounts we believe are payable to FKTC in "accounts payable" and "other current liabilities" on our consolidated balance sheets. The remaining $26 million owed to FKTC under contract has not been billed to the government and we will not do so until the related claims and disputes between KBR and the government over the FKTC living container contract are resolved (see Department of Justice ("DOJ") False Claims Act complaint - FKTC Containers below). At this time, we believe the likelihood we would incur a loss related to this matter is remote.
Electrocution litigation. During 2008, a lawsuit was filed against KBR in the Allegheny County Common Pleas Court alleging that the Company was responsible for an electrical incident which resulted in the death of a soldier at the Radwaniyah Palace Complex near Baghdad, Iraq. Plaintiffs claimed unspecified damages for personal injury, death and loss of consortium by the parents. On January 5, 2017 we entered into a confidential settlement agreement with the plaintiffs. This settlement, including the recovery of legal fees, was covered by insurance and did not have a material impact to our financial statements. This matter is now resolved.
Burn Pit litigation. From November 2008 through current, KBR has been served with in excess of 60 lawsuits in various states alleging exposure to toxic materials resulting from the operation of burn pits in Iraq or Afghanistan in connection with services provided by KBR under the LogCAP III contract. These suits have been consolidated and are pending in U.S. Federal District Court in Baltimore, Maryland, where a hearing on KBR’s jurisdictional motions is scheduled for March 2017. The plaintiffs are claiming unspecified damages. KBR will continue to pursue all available jurisdictional and other dismissal options. At this time, we believe the likelihood that we would incur a loss related to this matter is remote. As of December 31, 2016, no amounts have been accrued.
Sodium Dichromate litigation. From December 2008 through September 2009, five cases were filed in various Federal District Courts against KBR by national guardsmen and other military personnel alleging exposure to sodium dichromate at the Qarmat Ali Water Treatment Plant in Iraq in 2003, which were consolidated into one case before in the U.S. District Court for the Southern District of Texas. The Texas case was then dismissed by the Court on the merits on multiple grounds including the conclusion that no one was injured and is now on appeal to the Fifth Circuit. The plaintiffs are claiming unspecified damages. At this time, we believe the likelihood that we would incur a loss related to this matter is remote. As of December 31, 2016, no amounts have been accrued.
103
COFC/ASBCA Claims. During the period of time since the first sodium dichromate litigation was filed, we incurred legal defense costs that we believed were reimbursable under the related U.S. government contract. These costs were billed and claims were filed to recover the associated costs incurred to date. After KBR filed claims for payment, the ASBCA issued an order in August 2015 that KBR is entitled to reimbursement of the sodium dichromate legal fees and any resulting judgments pursuant to the 85-804 indemnity agreement it had with the government. On June 23, 2016, KBR and U.S. Army Corps of Engineers entered into a settlement agreement regarding reimbursement of the $33 million in legal fees and interest incurred through the time of the claim. As part of the settlement, all reasonable future defense costs and payment of awards will be reimbursed consistent with the Government's indemnity obligation. The majority of these historical costs have been reimbursed to us. This matter is now resolved.
Qui tams. We have several qui tam cases pending, one of which has been joined by the U.S. government (see DOJ FCA complaint - Iraq Subcontractor below). We believe the likelihood that we would incur a loss in the qui tams the U.S. government has not joined is remote and as of December 31, 2016, no amounts have been accrued. Costs incurred in defending the qui tams cannot be billed to the U.S. government until those matters are successfully resolved in our favor. If successfully resolved, we can bill 80% of the costs to the U.S. government under federal regulations. As of December 31, 2016, we have incurred and expensed $10 million in legal costs to date in defending ourselves in qui tams. There are two active cases as discussed below.
Barko qui tam. Relator Harry Barko, a KBR subcontracts administrator in Iraq for a year in 2004/2005, filed a qui tam lawsuit in June 2005 in the U.S. District Court for the District of Columbia, alleging violations of the FCA by KBR and KBR subcontractors Daoud & Partners and Eamar Combined for General Trading and Contracting. The DOJ investigated Barko's allegations and elected not to intervene. The claim was unsealed in March of 2009. The court is currently considering KBR's motion for summary judgment. At this time, we believe the likelihood that we would incur a loss related to this matter is remote. As of December 31, 2016, no amounts have been accrued.
Howard qui tam. In March 2011, Geoffrey Howard filed a complaint in the U.S. District Court for the Central District of Illinois alleging that KBR mischarged the government $628 million for unnecessary materials and equipment. In October 2014 the Department of Justice declined to intervene and the case was partially unsealed. Discovery is ongoing in this case. At this time, we believe the likelihood that we would incur a loss related to this matter is remote. As of December 31, 2016, no amounts have been accrued.
DOJ False Claims Act complaint - FKTC Containers. In November 2012, the U.S. Department of Justice filed a complaint in the U.S. District Court for the Central District of Illinois against KBR, FKTC and others, related to our settlement of delay claims by our subcontractor, FKTC, in connection with FKTC's provision of living trailers for the bed down mission in Iraq in 2003-2004. The DOJ alleges that KBR submitted false claims to the U.S. government for reimbursement of costs for FKTC's services, which the U.S. government alleges were inflated, unverified, not subject to an adequate price analysis and had been contractually assumed by FKTC. Our contractual dispute with the Army over this settlement has been ongoing since 2005. In March 2014, KBR's motion to dismiss was denied and in September 2014, the District Court granted FKTC's motion to dismiss for lack of personal jurisdiction. The case is currently in discovery which we expect to be substantially completed in 2017. At this time, we believe the likelihood that we would incur a loss related to this matter is remote. As of December 31, 2016, no amounts have been accrued.
KBR Contract Claim on FKTC containers. KBR previously filed a claim before the ASBCA to recover the costs paid to FKTC to settle its delay and disruption claims. The DCMA had disallowed the majority of those costs. Those contract claims were stayed in 2013 at the request of the DOJ so that they could pursue the FCA case referenced above. On February 19, 2016, the ASBCA, at KBR’s request, lifted the stay and has allowed KBR to proceed with its contract claim for the costs withheld. KBR has requested a trial date as early in 2017 as the ASBCA’s schedule will permit.
104
DOJ False Claims Act complaint - Iraq Subcontractor. In January 2014, the U.S. Department of Justice filed a complaint in the U.S. District Court for the Central District of Illinois against KBR and two former KBR subcontractors, including FKTC, alleging that three former KBR employees were offered and accepted kickbacks from these subcontractors in exchange for favorable treatment in the award and performance of subcontracts to be awarded during the course of KBR's performance of the LogCAP III contract in Iraq. The complaint alleges that as a result of the kickbacks, we submitted invoices with inflated or unjustified subcontract prices, resulting in alleged violations of the FCA and the Anti-Kickback Act. The DOJ's investigation dates back to 2004. We self-reported most of the violations and tendered credits to the U.S. government as appropriate. On May 22, 2014, FTKC filed a motion to dismiss which the U.S. government opposed. Following the submission of our answer in April 2014, the U.S. government was granted a Motion to Strike certain affirmative defenses in March 2015. We do not believe this limits KBR's ability to fully defend all allegations in this matter. As of December 31, 2016, we have accrued our best estimate of probable loss related to an unfavorable settlement of this matter in "other liabilities" on our consolidated balance sheets. At this time, we believe the likelihood that we would incur a loss related to this matter in excess of the amounts we have accrued is remote. We expect discovery to extend into late 2017 and do not expect a trial before mid-2018.
Note 16. Other Commitments and Contingencies
Litigation and regulatory matters related to the Company’s restatement of its 2013 annual financial statements
In re KBR, Inc. Securities Litigation. Lead plaintiffs, Arkansas Public Employees Retirement System and IBEW Local 58/NECA Funds, seek class action status on behalf of our shareholders, alleging violations of Sections 10(b) and 20(a) of the Securities Exchange Act of 1934 against the Company, our former chief executive officer, our current and former chief financial officers, and our former chief accounting officer, arising out of the restatement of our 2013 annual financial statements, and seek undisclosed damages. The case is currently pending in the U.S. District Court for the Southern District of Texas. KBR's Motion to Dismiss was denied in September 2015. We have reached a preliminary agreement to settle this case as of January 11, 2017, subject to final documentation and Court approval. We have accrued the proposed settlement amount in "other current liabilities" on our consolidated balance sheets, net of insurance proceeds which did not have a material impact to our financial statements.
Butorin v. Blount et al, is a May 2014 shareholder derivative complaint pending in the U.S. District Court of Delaware and filed on behalf of the Company naming certain current and former members of the Company's board of directors as defendants and the Company as a nominal defendant. The complaint alleges that the named directors breached their fiduciary duties by permitting the Company's internal controls to be inadequate. KBR has filed a Motion to Dismiss, to which the derivative plaintiff has responded. At this time, we are not yet able to determine the likelihood of loss, if any, arising from this matter.
Stella Dupree and Donald Taylor v. KBR, Inc., was filed by shareholders of the Company on May 12, 2015 in Delaware Chancery Court seeking the right to inspect and make copies of certain books and records of the Company under §220 of Delaware General Corporation Law relating primarily to the restatement of our 2013 annual financial statements. The remaining plaintiff voluntarily dismissed this case on February 26, 2016 following receipt of a limited set of documents from the Company. This matter is now resolved.
We have also received requests for information and a subpoena for documents from the Securities Exchange Commission ("SEC") regarding the restatement of our 2013 annual financial statements. We have been and intend to continue cooperating with the SEC. We have accrued our estimate of a potential settlement in "other current liabilities" on our consolidated balance sheets which did not have a material impact to our financial statements.
PEMEX and PEP Arbitration
In 2004, we filed for arbitration with the International Chamber of Commerce ("ICC") claiming recovery of damages against PEP, a subsidiary of PEMEX, the Mexican national oil company, related to a 1997 contract between PEP and our subsidiary, Commisa, and PEP subsequently counterclaimed. The project, known as EPC 1, required Commisa to build offshore platforms and treatment and reinjection facilities in Mexico and encountered significant schedule delays and increased costs due to problems with design work, late delivery and defects in equipment, increases in scope and other changes. In 2009, the ICC arbitration panel awarded us a total of approximately $351 million including legal and administrative recovery fees as well as interest and PEP was awarded approximately $6 million on counterclaims, plus interest on a portion of that sum. In August 2016, the U.S. Court of Appeal for the Second Circuit affirmed a 2013 District Court ruling confirming the ICC award and PEP filed a Motion for Rehearing in September 2016 which was denied. On January 31, 2017, PEP filed an application for certiorari to the United States Supreme Court. Commisa will file a response. PEP has posted $465 million as security for the judgment, pending exhaustion of all appeals.
105
Commisa and PEP are in active discussions to settle this dispute for the payment to Commisa. The potential agreement will be subject to final approval by the parties' respective board of directors.
Other Matters
The U.S. DOJ and the SEC are conducting investigations of activities Unaoil, a Monaco based company, may have engaged in related to international projects involving several global companies, as well as KBR's interactions with Unaoil. KBR is cooperating with the DOJ and the SEC in their investigations, which includes the voluntary submission of information and compliance with document requests, including a formal request from the SEC by subpoena.
Tisnado vs DuPont, et al, In May 2016, KBR was served with a Fourth Amended Petition in Intervention and was brought into a lawsuit which was originally filed on November 14, 2014, in the 11th Judicial District Court of Harris County, Texas. This suit was brought by the family members of persons who died in an incident at the DuPont plant in LaPorte, Texas. KBR has filed an Answer to the Petition, denying the plaintiffs' claims and asserting affirmative defenses. This case is in its early stages of discovery. At this time, we are not yet able to determine the likelihood of loss, if any, arising from this matter.
Environmental
We are subject to numerous environmental, legal and regulatory requirements related to our operations worldwide. In the U.S, these laws and regulations include, among others: the Comprehensive Environmental Response, Compensation and Liability Act; the Resources Conservation and Recovery Act; the Clean Air Act; the Clean Water Act; and the Toxic Substances Control Act. In addition to federal and state laws and regulations, other countries where we do business often have numerous environmental regulatory requirements by which we must abide in the normal course of our operations. These requirements apply to our business segments where we perform construction and industrial maintenance services or operate and maintain facilities.
We continue to monitor conditions at sites owned or previously owned. These locations were primarily utilized for manufacturing or fabrication work and are no longer in operation. The use of these facilities created various environmental issues including deposits of metals, volatile and semi-volatile compounds and hydrocarbons impacting surface and subsurface soils and groundwater. The range of remediation costs could change depending on our ongoing site analysis and the timing and techniques used to implement remediation activities. We do not expect that costs related to environmental matters will have a material adverse effect on our consolidated financial position or results of operations. Based on the information presently available to us the assessment and remediation costs associated with all environmental matters is immaterial and we do not anticipate incurring additional costs.
We had been named as a potentially responsible party in various clean-up actions taken by federal and state agencies in the U.S. All of these matters have been settled or resolved and as of December 31, 2016 we have not been named in any additional matters.
Existing or pending climate change legislation, regulations, international treaties or accords are not expected to have a short-term material direct effect on our business, the markets that we serve or on our results of operations or financial position. However, climate change legislation could have a direct effect on our customers or suppliers, which could impact our business. For example, our commodity-based markets depend on the level of activity of mineral and oil and gas companies and existing or future laws, regulations, treaties or international agreements related to climate change, including incentives to conserve energy or use alternative energy sources, which could impact our business if such laws, regulations, treaties or international agreements reduce the worldwide demand for minerals, oil and natural gas. We will continue to monitor developments in this area.
Leases
We are obligated under operating leases, principally for the use of land, offices, equipment, field facilities and warehouses. We recognize minimum rental expenses over the term of the lease. When a lease contains a fixed escalation of the minimum rent or rent holidays, we recognize the related rent expense on a straight-line basis over the lease term and record the difference between the recognized rental expense and the amounts payable under the lease as deferred lease credits. We have certain leases for office space where we receive allowances for leasehold improvements. We capitalize these leasehold improvements as property, plant and equipment and deferred lease credits. Leasehold improvements are amortized over the shorter of their economic useful lives or the lease term. Total rent expense was $154 million, $155 million and $158 million in 2016, 2015 and 2014, respectively. The current portion of deferred rent of $4 million and $7 million at December 31, 2016 and 2015, respectively, is recorded in "other current liabilities" on our consolidated balance sheets and the noncurrent deferred rent of $103 million and $114 million at December 31, 2016 and 2015, respectively, is recorded in "other liabilities" on our consolidated balance sheets.
106
Future total rental payments on noncancelable operating leases are as follows:
Dollars in millions | Future rental payments (a) | ||
2017 | $ | 97 | |
2018 | $ | 85 | |
2019 | $ | 75 | |
2020 | $ | 66 | |
2021 | $ | 61 | |
Beyond 2021 | $ | 324 | |
(a) | Amounts presented are net of subleases. |
Insurance Programs
Our employee-related health care benefits program is self-funded. Our workers’ compensation, automobile and general liability insurance programs include a deductible applicable to each claim. Claims in excess of our deductible are paid by the insurer. The liabilities are based on claims filed and estimates of claims incurred but not reported. As of December 31, 2016, liabilities for anticipated claim payments and incurred but not reported claims for all insurance programs totaled approximately $49 million, comprised of $9 million included in "accrued salaries, wages and benefits," $15 million included in "other current liabilities" and $25 million included in "other liabilities" all on our consolidated balance sheets. As of December 31, 2015, liabilities for unpaid and incurred but not reported claims for all insurance programs totaled approximately $52 million, comprised of $14 million included in "accrued salaries, wages and benefits," $12 million included in "other current liabilities" and $26 million included in "other liabilities" all on our consolidated balance sheets.
107
Note 17. Shareholders’ Equity
The following tables summarize our activity in shareholders’ equity:
Dollars in millions | Total | PIC | Retained Earnings | Treasury Stock | AOCL | NCI | |||||||||||||||||
Balance at December 31, 2013 | $ | 2,439 | $ | 2,065 | $ | 1,748 | $ | (610 | ) | $ | (740 | ) | $ | (24 | ) | ||||||||
Share-based compensation | 22 | 22 | — | — | — | — | |||||||||||||||||
Common stock issued upon exercise of stock options | 4 | 4 | — | — | — | — | |||||||||||||||||
Dividends declared to shareholders | (47 | ) | — | (47 | ) | — | — | — | |||||||||||||||
Repurchases of common stock | (106 | ) | — | — | (106 | ) | — | — | |||||||||||||||
Issuance of ESPP shares | 4 | — | — | 4 | — | — | |||||||||||||||||
Investments by noncontrolling interests | 10 | — | — | — | — | 10 | |||||||||||||||||
Distributions to noncontrolling interests | (61 | ) | — | — | — | — | (61 | ) | |||||||||||||||
Other noncontrolling interests activity | 2 | — | — | — | — | 2 | |||||||||||||||||
Net income (loss) | (1,198 | ) | — | (1,262 | ) | — | — | 64 | |||||||||||||||
Other comprehensive income (loss), net of tax | (134 | ) | — | — | — | (136 | ) | 2 | |||||||||||||||
Balance at December 31, 2014 | $ | 935 | $ | 2,091 | $ | 439 | $ | (712 | ) | $ | (876 | ) | $ | (7 | ) | ||||||||
Acquisition of noncontrolling interest | (40 | ) | (40 | ) | — | — | — | — | |||||||||||||||
Share-based compensation | 18 | 18 | — | — | — | — | |||||||||||||||||
Common stock issued upon exercise of stock options | 1 | 1 | — | — | — | — | |||||||||||||||||
Dividends declared to shareholders | (47 | ) | — | (47 | ) | — | — | — | |||||||||||||||
Repurchases of common stock | (62 | ) | — | — | (62 | ) | — | — | |||||||||||||||
Issuance of ESPP shares | 5 | — | — | 5 | — | — | |||||||||||||||||
Distributions to noncontrolling interests | (28 | ) | — | — | — | — | (28 | ) | |||||||||||||||
Other noncontrolling interests activity | (3 | ) | — | — | — | — | (3 | ) | |||||||||||||||
Net income | 226 | — | 203 | — | — | 23 | |||||||||||||||||
Other comprehensive income, net of tax | 47 | — | — | — | 45 | 2 | |||||||||||||||||
Balance at December 31, 2015 | $ | 1,052 | $ | 2,070 | $ | 595 | $ | (769 | ) | $ | (831 | ) | $ | (13 | ) | ||||||||
Share-based compensation | 18 | 18 | — | — | — | — | |||||||||||||||||
Tax benefit decrease related to share-based plans | 1 | 1 | — | — | — | — | |||||||||||||||||
Dividends declared to shareholders | (46 | ) | — | (46 | ) | — | — | — | |||||||||||||||
Repurchases of common stock | (4 | ) | — | — | (4 | ) | — | — | |||||||||||||||
Issuance of ESPP shares | 3 | (1 | ) | — | 4 | — | — | ||||||||||||||||
Distributions to noncontrolling interests | (9 | ) | — | — | — | — | (9 | ) | |||||||||||||||
Net income (loss) | (51 | ) | — | (61 | ) | — | — | 10 | |||||||||||||||
Other comprehensive income (loss), net of tax | (219 | ) | — | — | — | (219 | ) | — | |||||||||||||||
Balance at December 31, 2016 | $ | 745 | $ | 2,088 | $ | 488 | $ | (769 | ) | $ | (1,050 | ) | $ | (12 | ) | ||||||||
Accumulated other comprehensive loss, net of tax
December 31, | |||||||||||
Dollars in millions | 2016 | 2015 | 2014 | ||||||||
Accumulated foreign currency translation adjustments, net of tax of $(2), $1 and $4 | $ | (262 | ) | $ | (269 | ) | $ | (203 | ) | ||
Pension and post-retirement benefits, net of tax of $254, $209 and $231 | (785 | ) | (560 | ) | (670 | ) | |||||
Changes in fair value of derivatives, net of tax of $0, $0 and $0 | (3 | ) | (2 | ) | (3 | ) | |||||
Total accumulated other comprehensive loss | $ | (1,050 | ) | $ | (831 | ) | $ | (876 | ) | ||
108
Changes in accumulated other comprehensive loss, net of tax, by component
Dollars in millions | Accumulated foreign currency translation adjustments | Pension and post-retirement benefits | Changes in fair value of derivatives | Total | |||||||||||
Balance as of December 31, 2014 | $ | (203 | ) | $ | (670 | ) | $ | (3 | ) | $ | (876 | ) | |||
Other comprehensive income adjustments before reclassifications | (70 | ) | 71 | — | 1 | ||||||||||
Amounts reclassified from accumulated other comprehensive income | 4 | 39 | 1 | 44 | |||||||||||
Balance at December 31, 2015 | $ | (269 | ) | $ | (560 | ) | $ | (2 | ) | $ | (831 | ) | |||
Other comprehensive income adjustments before reclassifications | 7 | (249 | ) | — | (242 | ) | |||||||||
Amounts reclassified from accumulated other comprehensive income | — | 24 | (1 | ) | 23 | ||||||||||
Balance at December 31, 2016 | $ | (262 | ) | $ | (785 | ) | $ | (3 | ) | $ | (1,050 | ) | |||
Reclassifications out of accumulated other comprehensive loss, net of tax, by component
Dollars in millions | December 31, 2016 | December 31, 2015 | Affected line item on the Consolidated Statements of Operations | ||||||
Pension and post-retirement benefits | |||||||||
Amortization of actuarial loss (a) | $ | (29 | ) | $ | (48 | ) | See (a) below | ||
Tax benefit (expense) | 5 | 9 | Provision for income taxes | ||||||
Net pension and post-retirement benefits | $ | (24 | ) | $ | (39 | ) | Net of tax | ||
(a) | This item is included in the computation of net periodic pension cost. See Note 12 to our consolidated financial statements for further discussion. |
Shares of common stock
Shares in millions | Shares | |
Balance at December 31, 2014 | 174.4 | |
Common stock issued | 0.7 | |
Balance at December 31, 2015 | 175.1 | |
Common stock issued | 0.8 | |
Balance at December 31, 2016 | 175.9 | |
Shares of treasury stock
Shares and dollars in millions | Shares | Amount | ||||
Balance at December 31, 2014 | 29.6 | $ | 712 | |||
Treasury stock acquired, net of ESPP shares issued | 3.4 | 57 | ||||
Balance at December 31, 2015 | 33.0 | 769 | ||||
Treasury stock acquired, net of ESPP shares issued | 0.1 | — | ||||
Balance at December 31, 2016 | 33.1 | $ | 769 | |||
Dividends
We declared dividends totaling $46 million and $47 million in 2016 and 2015, respectively. As of December 31, 2016 and 2015, we had accrued dividends payable of $12 million included in "other current liabilities" on our consolidated balance sheets.
109
Note 18. Share Repurchases
Authorized Share Repurchase Program
On February 25, 2014, our Board of Directors authorized a plan to repurchase up to $350 million of our outstanding common shares, which replaced and terminated the August 26, 2011 share repurchase program. As of December 31, 2016, $208 million remain available for repurchase under this authorization. The authorization does not obligate the Company to acquire any particular number of common shares and may be commenced, suspended or discontinued without prior notice. The share repurchases are intended to be funded through the Company’s current and future cash and the authorization does not have an expiration date.
Share Maintenance Programs
Stock options and restricted stock awards granted under the KBR Stock and Incentive Plan may be satisfied using shares of our authorized but unissued common stock or our treasury share account.
The Employee Stock Purchase Plan ("ESPP") allows eligible employees to withhold up to 10% of their earnings, subject to some limitations, to purchase shares of KBR common stock. These shares are issued from our treasury share account.
Withheld to Cover Program
In addition to the plans above, we also have in place a "withheld to cover" program, which allows us to withhold ordinary shares from employees in connection with the settlement of income tax and related benefit withholding obligations arising from the issuance of share-based equity awards under the KBR Stock and Incentive Plan.
The table below presents information on our annual share repurchases activity under these programs:
Year ending December 31, 2016 | ||||||||||
Number of Shares | Average Price per Share | Dollars in Millions | ||||||||
Repurchases under the $350 million authorized share repurchase program | — | n/a | $ | — | ||||||
Repurchases under the existing share maintenance program | — | n/a | — | |||||||
Withheld to cover shares | 249,891 | 14.93 | 4 | |||||||
Total | 249,891 | $ | 14.93 | $ | 4 | |||||
Year ending December 31, 2015 | ||||||||||
Number of Shares | Average Price per Share | Dollars in Millions | ||||||||
Repurchases under the $350 million authorized share repurchase program | 2,992,687 | $ | 17.43 | $ | 52 | |||||
Repurchases under the existing share maintenance program | 466,974 | 15.43 | 7 | |||||||
Withheld to cover shares | 182,964 | 16.98 | 3 | |||||||
Total | 3,642,625 | $ | 17.15 | $ | 62 | |||||
110
Note 19. Share-based Compensation and Incentive Plans
Stock Plans
In 2016, 2015 and 2014 share-based compensation awards were granted to employees under KBR share-based compensation plans.
KBR Stock and Incentive Plan (Amended May 2016)
In November 2006, KBR established the KBR Stock and Incentive Plan ("KBR Stock Plan"), which provides for the grant of any or all of the following types of share-based compensation listed below:
• | stock options, including incentive stock options and nonqualified stock options; |
• | stock appreciation rights, in tandem with stock options or freestanding; |
• | restricted stock; |
• | restricted stock units; |
• | cash performance awards; and |
• | stock value equivalent awards. |
In May 2012, the KBR Stock Plan was amended to add 2 million shares of our common stock available for issuance under the KBR Stock Plan and increase certain sublimits.
In May 2016, the KBR Stock Plan was further amended to add 4.4 million shares of our common stock available for issuance under the KBR Stock Plan. Additionally, this amendment increased the sublimit under the Stock Plan in the form of restricted stock awards, restricted stock unit awards, stock value equivalent awards, or pursuant to performance awards denominated in common stock by 4.4 million. Under the terms of the KBR Stock Plan, 16.4 million shares of common stock have been reserved for issuance to employees and non-employee directors. The plan specifies that no more than 9.9 million shares can be awarded as restricted stock, restricted stock units, stock value equivalents, or pursuant to performance awards denominated in common stock.
At December 31, 2016, approximately 6.8 million shares were available for future grants under the KBR Stock Plan, of which approximately 4.5 million shares remained available for restricted stock awards or restricted stock unit awards.
KBR Stock Options
Under the KBR Stock Plan, stock options are granted with an exercise price not less than the fair market value of the common stock on the date of the grant and a term no greater than 10 years. The term and vesting periods are established at the discretion of the Compensation Committee at the time of each grant. We amortize the fair value of the stock options over the vesting period on a straight-line basis. Options are granted from shares authorized by our Board of Directors.
Total number of stock options granted and the assumptions used to determine the fair value of granted options were as follows:
Year ending | |||
December 31, | |||
KBR stock options assumptions summary (a) | 2015 | ||
Granted stock options (shares in millions) | 1.1 | ||
Weighted average expected term (in years) | 5.5 | ||
Weighted average grant-date fair value per share | $ | 4.91 | |
(a) No stock options granted in 2016
111
Year ending December 31, | |||||
KBR stock options range assumptions summary (a) | 2015 | ||||
Range | |||||
Start | End | ||||
Expected volatility range | 33.92 | % | 39.65 | % | |
Expected dividend yield range | 1.15 | % | 2.13 | % | |
Risk-free interest rate range | 1.46 | % | 2.12 | % | |
(a) No stock options granted in 2016
For KBR stock options granted in 2015 and 2014, the fair value of options at the date of grant was estimated using the Black-Scholes-Merton option pricing model. The expected volatility of KBR options granted in each year is based upon a blended rate that uses the historical and implied volatility of common stock for KBR. The expected term of KBR options granted was based on KBR's historical experience. The estimated dividend yield is based upon KBR’s annualized dividend rate divided by the market price of KBR’s stock on the option grant date. The risk-free interest rate is based upon the yield of U.S. government issued treasury bills or notes on the option grant date.
The following table presents stock options granted, exercised, forfeited and expired under KBR share-based compensation plans for the year ended December 31, 2016.
KBR stock options activity summary | Number of Shares | Weighted Average Exercise Price per Share | Weighted Average Remaining Contractual Term (years) | Aggregate Intrinsic Value (in millions) | ||||||||
Outstanding at December 31, 2015 | 3,482,657 | $ | 23.83 | 6.55 | $ | 2.92 | ||||||
Granted | — | — | ||||||||||
Exercised | (28,579 | ) | 12.25 | |||||||||
Forfeited | (177,452 | ) | 16.68 | |||||||||
Expired | (541,020 | ) | 23.96 | |||||||||
Outstanding at December 31, 2016 | 2,735,606 | $ | 23.81 | 5.89 | $ | 2.40 | ||||||
Exercisable at December 31, 2016 | 2,091,530 | $ | 25.44 | 5.23 | $ | 1.90 | ||||||
The total intrinsic values of options exercised for the years ended December 31, 2016, 2015 and 2014 were $0.1 million, $0.3 million and $3 million, respectively. As of December 31, 2016, there was $2 million of unrecognized compensation cost, net of estimated forfeitures, related to non-vested KBR stock options, expected to be recognized over a weighted average period of approximately 1.07 years. Stock option compensation expense was $3 million in 2016, $5 million in 2015 and $6 million in 2014. Total income tax benefit recognized in net income for share-based compensation arrangements was $1 million in 2016 and and $2 million in 2015 and 2014.
112
KBR Restricted stock
Restricted shares issued under the KBR Stock Plan are restricted as to sale or disposition. These restrictions lapse periodically over a period of time not exceeding 10 years. Restrictions may also lapse for early retirement and other conditions in accordance with our established policies. Upon termination of employment, shares on which restrictions have not lapsed must be returned to us, resulting in restricted stock forfeitures. The fair market value of the stock on the date of grant is amortized and ratably charged to income over the period during which the restrictions lapse on a straight-line basis. For awards with performance conditions, an evaluation is made each quarter as to the likelihood of meeting the performance criteria. Share-based compensation is then adjusted to reflect the number of shares expected to vest and the cumulative vesting period met to date.
The following table presents the restricted stock awards and restricted stock units granted, vested and forfeited during 2016 under the KBR Stock Plan.
Restricted stock activity summary | Number of Shares | Weighted Average Grant-Date Fair Value per Share | ||||
Nonvested shares at December 31, 2015 | 1,373,966 | $ | 23.05 | |||
Granted | 860,580 | 13.94 | ||||
Vested | (772,964 | ) | 24.30 | |||
Forfeited | (227,064 | ) | 18.50 | |||
Nonvested shares at December 31, 2016 | 1,234,518 | $ | 16.75 | |||
The weighted average grant-date fair value per share of restricted KBR shares granted to employees during 2016, 2015 and 2014 was $13.94, $16.66 and $28.46, respectively. Restricted stock compensation expense was $15 million for 2016, $13 million for 2015 and $16 million for 2014. Total income tax benefit recognized in net income for share-based compensation arrangements during 2016, 2015 and 2014 was $5 million, $5 million, and $6 million, respectively. As of December 31, 2016, there was $11 million of unrecognized compensation cost, net of estimated forfeitures, related to KBR’s non-vested restricted stock and restricted stock units, which is expected to be recognized over a weighted average period of 1.70 years. The total fair value of shares vested was $11 million in 2016, $9 million in 2015 and $6 million in 2014 based on the weighted-average fair value on the vesting date. The total fair value of shares vested was $19 million in 2016, $14 million in 2015 and $11 million in 2014 based on the weighted-average fair value on the date of grant.
Share-based compensation expense
The grant-date fair value of employee share options is estimated using option-pricing models. If an award is modified after the grant date, incremental compensation cost is recognized immediately as of the modification. Share-based compensation expense consists of $7 million recorded to cost of revenues, $10 million to general and administrative expenses, and $1 million to restructuring charges on our consolidated statements of operations. The benefits of tax deductions in excess of the compensation cost recognized for the options (excess tax benefits) are classified as additional paid-in-capital, and cash retained as a result of these excess tax benefits is presented in the statements of cash flows as financing cash inflows.
Share-based compensation summary table | Years ended December 31, | ||||||||||
Dollars in millions | 2016 | 2015 | 2014 | ||||||||
Share-based compensation | $ | 18 | $ | 18 | $ | 22 | |||||
Income tax benefit recognized in net income for share-based compensation | $ | 6 | $ | 7 | $ | 8 | |||||
Incremental compensation cost | $ | 8 | $ | 2 | $ | 2 | |||||
Incremental compensation cost resulted from modifications of previously granted share-based awards which allowed certain employees to retain their awards after leaving the company. Excess tax benefits realized from the exercise of share-based compensation awards are recognized as paid-in capital in excess of par.
113
KBR Cash Performance Based Award Units ("Cash Performance Awards")
Under the KBR Stock Plan, for Cash Performance Awards granted in 2016 and 2015, performance is based 50% on average Total Shareholder Return ("TSR"), as compared to the average TSR of KBR’s peers, and 50% on KBR’s Job Income Sold ("JIS"). For Cash Performance Awards granted in 2014, performance is based 100% on average TSR as compared to the average TSR of KBR’s peers. In accordance with the provisions of ASC 718 - Compensation-Stock Compensation, the TSR portion for the performance award units are classified as liability awards and remeasured at the end of each reporting period at fair value until settlement. The fair value approach uses the Monte Carlo valuation method which analyzes the companies comprising KBR’s peer group, considering volatility, interest rate, stock beta and TSR through the grant date. The JIS calculation is based on the Company's JIS earned at a target level averaged over a three year period. The JIS portion of the Cash Performance Award is also classified as a liability award and remeasured at the end of each reporting period based on our estimate of the amount to be paid at the end of the vesting period. The cash performance award units may only be paid in cash.
Under the KBR Stock Plan, in 2016, we granted 22 million performance based award units ("Cash Performance Awards") with a three-year performance period from January 1, 2016 to December 31, 2018. In 2015, we granted 22 million Cash Performance Awards with a three-year performance period from January 1, 2015 to December 31, 2017. In 2014, we granted 27 million Cash Performance Awards with a three-year performance period from January 1, 2014 to December 31, 2016. Cash Performance Awards forfeited, net of previous plan payout, totaled 9 million, 15 million, and 17 million at December 31, 2016, 2015 and 2014, respectively. At December 31, 2016, the outstanding balance for Cash Performance Awards is 56 million units. Cash Performance Awards are not considered earned until required performance conditions are met. Additionally, approval by the Compensation Committee of the Board of Directors is required before earned Cash Performance Awards are paid.
Cost for the Cash Performance Awards is accrued over the requisite service period. For the years ended December 31, 2016, 2015 and 2014, we recognized $5 million, $3 million and none, respectively, in expense for Cash Performance Awards. The expense associated with these Cash Performance Awards is included in cost of services and general and administrative expense in our consolidated statements of operations. The liability for awards included in "employee compensation and benefits" on our consolidated balance sheets was $9 million at December 31, 2016, of which none will become due within one year, and $5 million at December 31, 2015.
KBR Employee Stock Purchase Plan (“ESPP”)
Under the ESPP, eligible employees may withhold up to 10% of their earnings, subject to some limitations, to purchase shares of KBR’s common stock. Unless KBR’s Board of Directors determines otherwise, each six-month offering period commences at the beginning of February and August of each year. Employees who participate in the ESPP will receive a 5% discount on the stock price at the end of each period. During 2016 and 2015, our employees purchased approximately 190,000 and 204,000 shares, respectively, through the ESPP. These shares were issued from our treasury share account.
Note 20. Income (Loss) per Share
Basic income (loss) per share is based upon the weighted average number of common shares outstanding during the period. Dilutive income (loss) per share includes additional common shares that would have been outstanding if potential common shares with a dilutive effect had been issued using the treasury stock method.
A reconciliation of the number of shares used for the basic and diluted income (loss) per share calculations is as follows:
Years ended December 31, | ||||||||
Shares in millions | 2016 | 2015 | 2014 | |||||
Basic weighted average common shares outstanding | 142 | 144 | 146 | |||||
Stock options and restricted shares | — | — | — | |||||
Diluted weighted average common shares outstanding | 142 | 144 | 146 | |||||
For purposes of applying the two-class method in computing earnings (loss) per share, net earnings allocated to participating securities was none for the fiscal year 2016, $1.7 million, or $0.01 per share, for fiscal year 2015 and none for fiscal year 2014. The diluted earnings (loss) per share calculation did not include 3.0 million, 3.4 million and 3.0 million antidilutive weighted average shares for the years ended December 31, 2016, 2015 and 2014, respectively.
114
Note 21. Financial Instruments and Risk Management
Foreign currency risk. We conduct business in numerous currencies and are therefore exposed to foreign currency fluctuations. We may use derivative instruments to reduce the volatility of earnings and cash flows associated with changes in foreign currency exchange rates. We do not use derivative instruments for speculative trading purposes. We generally utilize foreign exchange forwards and currency option contracts to hedge exposures associated with forecasted future cash flows and to hedge exposures present on our balance sheet.
As of December 31, 2016, the gross notional value of our foreign currency exchange forwards and option contracts used to hedge balance sheet exposures was $81 million, all of which had durations of 12 days or less. We also had approximately $14 million (gross notional value) of cash flow hedges which had durations of 31 months or less.
The fair value of our balance sheet and cash flow hedges included in "other current assets" and "other current liabilities" on our consolidated balance sheets was immaterial at December 31, 2016 and 2015, respectively. These fair values are considered Level 2 under ASC 820 - Fair Value Measurement as they are based on quoted prices directly observable in active markets.
The following table summarizes the recognized changes in fair value of our balance sheet hedges offset by remeasurement of balance sheet positions. These amounts are recognized in our consolidated statements of operations for the periods presented. The net of our changes in fair value of hedges and the remeasurement of our assets and liabilities is included in "other non-operating income" on our consolidated statements of operations.
Years ended December 31, | |||||||
Gains (losses) dollars in millions | 2016 | 2015 | |||||
Balance Sheet Hedges - Fair Value | $ | (7 | ) | $ | (40 | ) | |
Balance Sheet Position - Remeasurement | 27 | 50 | |||||
Net | $ | 20 | $ | 10 | |||
Interest rate risk. Certain of our unconsolidated subsidiaries and joint ventures are exposed to interest rate risk through their variable rate borrowings. This variable rate exposure is managed with interest rate swaps. The unrealized net losses on the interest rate swaps held by our unconsolidated subsidiaries and joint ventures was immaterial as of December 31, 2016, 2015 and 2014, respectively.
Note 22. Recent Accounting Pronouncements
In August 2016, the FASB issued ASU No. 2016-15, Statement of Cash Flows (Topic 230) - Classification of Certain Cash Receipts and Cash Payments. This ASU addresses eight specific cash flow topics with the objective of reducing diversity in practice in how certain cash receipts and cash payments are presented and classified in the statement of cash flows. This ASU is effective for annual periods beginning after December 15, 2017 and interim periods within those annual periods. Early adoption is permitted, including adoption in an interim period. We do not expect adoption of this ASU to be material to our ongoing financial reporting or on known trends, demands, uncertainties and events in our business.
In June 2016, the FASB issued ASU No. 2016-13, Financial Instruments - Credit Losses (Topic 326) - Measurement of Credit Losses on Financial Instruments. This ASU requires the measurement of all expected credit losses for financial assets held at the reporting date based on historical experience, current conditions, and reasonable supportable forecast and is effective for annual periods beginning after December 15, 2019 and interim periods within those annual periods. Early adoption is permitted for annual periods after December 15, 2018, including interim periods within those annual periods. We are currently in the process of assessing the impact of this ASU on our financial statements. We have not yet determined the effect of the standard on our ongoing financial reporting or the future impact of adoption on known trends, demands, uncertainties and events in our business.
In March 2016, the FASB issued ASU No. 2016-09, Compensation - Stock Compensation (Topic 718) - Improvements to Employee Share-Based Payment Accounting. The new standard is intended to simplify several aspects of the accounting for share-based payment transactions including (a) the income tax consequences, (b) classification of awards as either equity or liabilities, and (c) classification on the statement of cash flows. This ASU is effective for annual periods beginning after December 15, 2016 and interim periods within those annual periods and early adoption is permitted. The application of the amendments requires various transition methods depending on the specific item. We do not expect adoption of this ASU to be material to our ongoing financial reporting or on known trends, demands, uncertainties and events in our business.
115
In February 2016, the FASB issued ASU No. 2016-02, Leases (Topic 842), which requires lessees to recognize in the balance sheet a liability to make lease payments (the lease liability) and a right-of-use asset representing its right to use the underlying asset for the lease term for all leases with terms longer than 12 months. Leases with a term of 12 months or less will be accounted for similar to existing guidance for operating leases. Recognition, measurement and presentation of expenses will depend on classification as a finance or operating lease. This ASU is effective for annual periods beginning after December 15, 2018 and interim periods within those annual periods. Early adoption is permitted. We are currently in the process of assessing the impact of this ASU on our financial statements. We have not yet determined the effect of the standard on our ongoing financial reporting or the future impact of adoption on known trends, demands, uncertainties and events in our business.
In May 2014, the FASB issued ASU No. 2014-09, Revenue from Contracts with Customers, as amended (Topic 606), which will change the way we recognize revenue and significantly expand the disclosure requirements for revenue arrangements. In July 2015, the FASB approved a one-year deferral of the effective date of the standard to 2018 for public companies, with an option that would permit companies to adopt the standard in 2017. Further amendments and technical corrections were made to the standard during 2016.
The core principle of the new standard is that a company should recognize revenue to depict the transfer of promised goods or services to customers in an amount that reflects the consideration to which the company expects to be entitled in exchange for those goods or services. The two permitted transition methods under the new standard are the full retrospective method, in which case the standard would be applied to each prior reporting period presented and the cumulative effect of applying the standard would be recognized at the earliest period shown, or the modified retrospective method, in which case the cumulative effect of applying the standard would be recognized at the date of initial application.
We are continuing to evaluate the impact the new standard on our contract portfolio. Our approach includes a detailed review of contracts representative at each of our business segments and comparing historical accounting policies and practices to the new standard. Because the standard will impact our business processes, systems and controls, we are also developing a comprehensive change management plan to guide the implementation. We will adopt the requirements of the new standard effective January 1, 2018 and intend to apply the modified retrospective method of adoption with the cumulative effect of adoption recognized at the date of initial application.
116
Note 23. Quarterly Data (Unaudited)
Summarized quarterly financial data for the years ended December 31, 2016 and 2015 is presented in the following table. In the following table, the sum of basic and diluted “Net income (loss) attributable to KBR per share” for the four quarters may differ from the annual amounts due to the required method of computing weighted average number of shares in the respective periods. Additionally, due to the effect of rounding, the sum of the individual quarterly earnings per share amounts may not equal the calculated year earnings per share amount.
(Dollars in millions, except per share amounts) | First | Second | Third | Fourth | Year | ||||||||||||||
2016 | |||||||||||||||||||
Total revenues | $ | 996 | $ | 1,009 | $ | 1,073 | $ | 1,190 | $ | 4,268 | |||||||||
Gross profit (loss) (a) | 68 | 74 | (36 | ) | 6 | 112 | |||||||||||||
Equity in earnings of unconsolidated affiliates | 29 | 33 | 19 | 10 | 91 | ||||||||||||||
Operating income (loss) (a) | 65 | 63 | (67 | ) | (33 | ) | 28 | ||||||||||||
Net income (loss) | 45 | 47 | (57 | ) | (86 | ) | (51 | ) | |||||||||||
Net income attributable to noncontrolling interests | (3 | ) | — | (6 | ) | (1 | ) | (10 | ) | ||||||||||
Net income (loss) attributable to KBR | 42 | 47 | (63 | ) | (87 | ) | (61 | ) | |||||||||||
Net income (loss) attributable to KBR per share: | |||||||||||||||||||
Net income (loss) attributable to KBR per share—Basic | $ | 0.30 | $ | 0.32 | $ | (0.44 | ) | $ | (0.61 | ) | $ | (0.43 | ) | ||||||
Net income (loss) attributable to KBR per share—Diluted | $ | 0.30 | $ | 0.32 | $ | (0.44 | ) | $ | (0.61 | ) | $ | (0.43 | ) | ||||||
(Dollars in millions, except per share amounts) | First | Second | Third | Fourth | Year | ||||||||||||||
2015 | |||||||||||||||||||
Total revenues | $ | 1,436 | $ | 1,381 | $ | 1,199 | $ | 1,080 | $ | 5,096 | |||||||||
Gross profit | 70 | 74 | 87 | 94 | 325 | ||||||||||||||
Equity in earnings of unconsolidated affiliates | 35 | 53 | 35 | 26 | 149 | ||||||||||||||
Operating income | 64 | 96 | 75 | 75 | 310 | ||||||||||||||
Net income | 51 | 68 | 59 | 48 | 226 | ||||||||||||||
Net income attributable to noncontrolling interests | (7 | ) | (6 | ) | (4 | ) | (6 | ) | (23 | ) | |||||||||
Net income attributable to KBR | 44 | 62 | 55 | 42 | 203 | ||||||||||||||
Net income attributable to KBR per share: | |||||||||||||||||||
Net income attributable to KBR per share—Basic | $ | 0.30 | $ | 0.43 | $ | 0.38 | $ | 0.29 | $ | 1.40 | |||||||||
Net income attributable to KBR per share—Diluted | $ | 0.30 | $ | 0.43 | $ | 0.38 | $ | 0.29 | $ | 1.40 | |||||||||
(a) | Gross profit and operating income in the fourth quarter of 2016 was unfavorably impacted by changes in estimated costs to complete a downstream EPC project in the U.S. of $94 million and the correction of an immaterial error of $13 million within our E&C business segment. See Note 2 to our consolidated financial statements. The acquisitions of Wyle and HTSI contributed $24 million to gross profit in the fourth quarter of 2016. |
117
Item 9.Changes In and Disagreements with Accountants on Accounting and Financial Disclosures
Not applicable.
Item 9A. Controls and Procedures
Management’s Evaluation of Disclosure Controls and Procedures
In accordance with Rules 13a-15(b) under the Securities and Exchange Act of 1934, as amended (the “Exchange Act”), we carried out an evaluation, under the supervision and with the participation of management, including our Chief Executive Officer and Chief Financial Officer, of the effectiveness of our disclosure controls and procedures (as defined in Rules 13a-15(e) and 15d-15(e)) as of the end of the period covered by this report. Our disclosure controls and procedures are designed to ensure that information required to be disclosed in reports filed or submitted under the Exchange Act is accumulated and communicated to our management, including our Chief Executive Officer and Chief Financial Officer, as appropriate, to allow timely decisions regarding required disclosure and is recorded, processed, summarized and reported within the time periods specified in the rules and forms of the SEC. Based on that evaluation, our Chief Executive Officer and Chief Financial Officer concluded that our disclosure controls and procedures were effective as of December 31, 2016 at the reasonable assurance level.
Management does not expect that our disclosure controls and procedures will prevent all errors and all fraud. A control system, no matter how well designed and operated, can provide only reasonable, not absolute, assurance that the control system's objectives will be met. There are inherent limitations in all control systems, including the realities that judgments in decision-making can be faulty, and that breakdowns can occur because of simple error or mistake. Additionally, controls can be circumvented by the intentional acts of one or more persons. Further, the design of a control system must reflect the fact that there are resource constraints, and the benefits of controls must be considered relative to their costs. The design of any system of controls is based in part upon certain assumptions about the likelihood of future events, and while our disclosure controls and procedures are designed to be effective under circumstances where they should reasonably be expected to operate effectively, there can be no assurance that any design will succeed in achieving its stated goals under all potential future conditions. Because of the inherent limitations in all control systems, no evaluation of controls can provide absolute assurance that all control issues and instances of fraud, if any, have been detected.
Management’s Annual Report on Internal Control Over Financial Reporting
Management is responsible for establishing and maintaining adequate internal control over financial reporting (as defined in Rule 13a-15(f) and Rule 15d-15(f) under the Exchange Act). Our internal control over financial reporting is a process designed by management, under the supervision of our Chief Executive Officer and Chief Financial Officer, to provide reasonable assurance regarding the reliability of financial reporting and the preparation of financial statements for external purposes in accordance with generally accepted accounting principles.
Because of its inherent limitations, internal control over financial reporting may not prevent or detect misstatements. Also, projections of any evaluation of effectiveness to future periods are subject to the risk that controls may become inadequate because of changes in conditions, or that the degree of compliance with the policies or procedures may deteriorate.
Management, including our Chief Executive Officer and Chief Financial Officer, carried out an evaluation of the effectiveness of our internal control over financial reporting as of December 31, 2016. In conducting this evaluation, our management used the criteria for effective internal control over financial reporting described in Internal Control-Integrated Framework (2013) issued by the Committee of Sponsoring Organizations of the Treadway Commission. Based on that evaluation, management has determined our internal control over financial reporting was effective as of December 31, 2016.
118
As discussed in Note 3 to our consolidated financial statements, we acquired Wyle Inc. and KBRWyle Technology Solutions, LLC (formerly Honeywell Technology Solutions Inc.) during 2016. As permitted by guidelines established by the Securities and Exchange Commission for newly acquired business, we excluded the acquisitions from the scope of our annual report on internal controls over financial reporting for the year ended December 31, 2016. These acquisitions contributed approximately $1.2 billion to our consolidated total assets as of December 31, 2016, and $487 million and $38 million to our consolidated revenues and gross profit, respectively, for the year ended December 31, 2016. We are in the process of integrating these businesses into our overall internal controls over financial reporting process and plan to include them in our scope for the year ended December 31, 2017.
The effectiveness of our internal control over financial reporting as of December 31, 2016 has been audited by KPMG LLP, an independent registered public accounting firm, as stated in their report, which is included in this Annual Report on Form 10-K.
Changes in Internal Control Over Financial Reporting
There were no changes in our internal controls over financial reporting during the three months ended December 31, 2016 that have materially affected, or are reasonably likely to affect, our internal control over financial reporting.
119
Report of Independent Registered Public Accounting Firm
The Board of Directors and Shareholders
KBR, Inc.:
We have audited KBR, Inc.’s internal control over financial reporting as of December 31, 2016, based on criteria established in Internal Control - Integrated Framework (2013) issued by the Committee of Sponsoring Organizations of the Treadway Commission (COSO). KBR, Inc.’s management is responsible for maintaining effective internal control over financial reporting and for its assessment of the effectiveness of internal control over financial reporting, included in the accompanying Management’s Annual Report on Internal Control over Financial Reporting. Our responsibility is to express an opinion on KBR, Inc.’s internal control over financial reporting based on our audit.
We conducted our audit in accordance with the standards of the Public Company Accounting Oversight Board (United States). Those standards require that we plan and perform the audit to obtain reasonable assurance about whether effective internal control over financial reporting was maintained in all material respects. Our audit included obtaining an understanding of internal control over financial reporting, assessing the risk that a material weakness exists, and testing and evaluating the design and operating effectiveness of internal control based on the assessed risk. Our audit also included performing such other procedures as we considered necessary in the circumstances. We believe that our audit provides a reasonable basis for our opinion.
A company’s internal control over financial reporting is a process designed to provide reasonable assurance regarding the reliability of financial reporting and the preparation of financial statements for external purposes in accordance with generally accepted accounting principles. A company’s internal control over financial reporting includes those policies and procedures that (1) pertain to the maintenance of records that, in reasonable detail, accurately and fairly reflect the transactions and dispositions of the assets of the company; (2) provide reasonable assurance that transactions are recorded as necessary to permit preparation of financial statements in accordance with generally accepted accounting principles, and that receipts and expenditures of the company are being made only in accordance with authorizations of management and directors of the company; and (3) provide reasonable assurance regarding prevention or timely detection of unauthorized acquisition, use, or disposition of the company’s assets that could have a material effect on the financial statements.
Because of its inherent limitations, internal control over financial reporting may not prevent or detect misstatements. Also, projections of any evaluation of effectiveness to future periods are subject to the risk that controls may become inadequate because of changes in conditions, or that the degree of compliance with the policies or procedures may deteriorate.
In our opinion, KBR, Inc. maintained, in all material respects, effective internal control over financial reporting as of December 31, 2016, based on criteria established in Internal Control - Integrated Framework (2013) issued by the Committee of Sponsoring Organizations of the Treadway Commission (COSO).
KBR, Inc. acquired Wyle Inc. and KBRwyle Technology Solutions, LLC (formerly Honeywell Technology Solutions Inc.) during 2016, and management excluded from its assessment of the effectiveness of KBR, Inc.’s internal control over financial reporting as of December 31, 2016, Wyle, Inc. and KBRwyle Technology Solutions LLC’s internal control over financial reporting associated with total assets of $1.2 billion and total revenues of $487 million included in the consolidated financial statements of KBR, Inc. and subsidiaries, as of and for the year ended December 31, 2016. Our audit of internal control over financial reporting of KBR, Inc. also excluded an evaluation of the internal control over financial reporting of Wyle Inc. and KBRwyle Technology Solutions, LLC.
We also have audited, in accordance with the standards of the Public Company Accounting Oversight Board (United States), the consolidated balance sheets of KBR, Inc. and subsidiaries as of December 31, 2016 and 2015, and the related consolidated statements of operations, comprehensive income (loss), shareholders’ equity, and cash flows for each of the years in the three-year period ended December 31, 2016 and our report dated February 24, 2017, expressed an unqualified opinion on those consolidated financial statements.
/s/ KPMG LLP
Houston, Texas
February 24, 2017
120
Item 9B. Other Information
Not applicable.
PART III
Item 10. Directors, Executive Officers and Corporate Governance
The information required by this Item is incorporated herein by reference to the KBR, Inc. Company Proxy Statement for our 2017 Annual Meeting of Stockholders.
Item 11. Executive Compensation
The information required by this Item is incorporated herein by reference to the KBR, Inc. Company Proxy Statement for our 2017 Annual Meeting of Stockholders.
Item 12. Security Ownership of Certain Beneficial Owners and Management and Related Stockholder Matters
The information required by this Item is incorporated herein by reference to the KBR, Inc. Company Proxy Statement for our 2017 Annual Meeting of Stockholders.
Item 13. Certain Relationships and Related Transactions, and Director Independence
The information required by this Item is incorporated herein by reference to the KBR, Inc. Company Proxy Statement for our 2017 Annual Meeting of Stockholders.
Item 14. Principal Accounting Fees and Services
The information required by this Item is incorporated herein by reference to the KBR, Inc. Company Proxy Statement for our 2017 Annual Meeting of Stockholders.
PART IV
Item 15. Exhibits and Financial Statement Schedules.
(a) | The following documents are filed as part of this report or incorporated by reference: |
1. | The consolidated financial statements of the Company listed on page 51 of this annual report. |
2. | The exhibits of the Company listed below under Item 15(b); all exhibits are incorporated herein by reference to a prior filing as indicated, unless designated by a * or **. |
(b) | Exhibits: |
121
Exhibit Number | Description | |
2.1 | Agreement and Plan of Merger by and among Wyle Inc., KBR Holdings, LLC, Road Runner Merger Sub, Inc., and CSC Shareholder Services LLC dated as of May 18, 2016 (incorporated by reference to Exhibit 2.1 to KBR's current report on Form 8-K filed May 23, 2016; File No. 1-33146) | |
2.2 | Purchase and Sale Agreement by and among Honeywell International Inc., Honeywell Technology Solutions Inc., and KBR Holdings, LLC dated as of August 12, 2016 (incorporated by reference to Exhibit 2.1 to KBR's current report on Form 8-K filed August 12, 2016; File No. 1-33146) | |
3.1 | KBR Amended and Restated Certificate of Incorporation (incorporated by reference to Exhibit 3.1 to KBR’s current report on Form 8-K filed June 7, 2012; File No. 1-33146) | |
3.2 | Amended and Restated Bylaws of KBR, Inc. (incorporated by reference to Exhibit 3.2 to KBR’s annual report on Form 10-K for the year ended December 31, 2013 filed on February 27, 2014; File No. 1-33146) | |
4.1 | Form of specimen KBR common stock certificate (incorporated by reference to Exhibit 4.1 to KBR’s registration statement on Form S-1; Registration No. 333-133302) | |
10.1 | Master Separation Agreement between Halliburton Company and KBR, Inc. dated as of November 20, 2006 (incorporated by reference to Exhibit 10.1 to KBR’s current report on Form 8-K dated November 20, 2006; File No. 1-33146) | |
10.2 | Tax Sharing Agreement, dated as of January 1, 2006, by and between Halliburton Company, KBR Holdings, LLC and KBR, Inc., as amended effective February 26, 2007 (incorporated by reference to Exhibit 10.2 to KBR’s Annual Report on Form 10-K for the year ended December 31, 2006; File No. 1-33146) | |
10.3 | Employee Matters Agreement dated as of November 20, 2006, by and between Halliburton Company and KBR, Inc. (incorporated by reference to Exhibit 10.6 to KBR’s current report on Form 8-K dated November 20, 2006; File No. 1-33146) | |
10.4 | Intellectual Property Matters Agreement dated as of November 20, 2006, by and between Halliburton Company and KBR, Inc. (incorporated by reference to Exhibit 10.7 to KBR’s current report on Form 8-K dated November 20, 2006; File No. 1-33146) | |
10.5 | Form of Indemnification Agreement between KBR, Inc. and its directors and executive officers (incorporated by reference to Exhibit 10.7 to KBR’s annual report on Form 10-K for the year ended December 31, 2013 filed on February 27, 2014; File No. 1-33146) | |
10.6 | Amended and Restated Revolving Credit Agreement dated as of September 25, 2015 among KBR, Inc., the Banks party thereto, Citibank, N.A., as Administrative Agent, Bank of America, N.A., ING Bank, N.V., Dublin Branch, BNP Paribas, and The Bank of Nova Scotia as Syndication Agents, Citibank, N.A., BNP Paribas, ING Bank, N.V., Dublin Branch, The Bank of Nova Scotia, Bank of America, N.A., and Compass Bank as initial Issuing Banks, and Citigroup Global Markets Inc., BNP Paribas Securities Corp., Merrill Lynch, Pierce, Fenner & Smith Inc., ING Bank, N.V., Dublin Branch, and The Bank of Nova Scotia as Joint Lead Arrangers and Bookrunners (incorporated by reference to Exhibit 10.1 to KBR’s current report on Form 8-K dated September 25, 2015; File No. 1-33146) | |
10.7 | First Amendment to Amended and Restated Credit Agreement dated as of December 21, 2016 to the Amended and Restated Revolving Credit Agreement dated as of September 25, 2015 (the “Credit Agreement”) among KBR, Inc., the several banks and other institutions parties to the Credit Agreement, Citibank, NA., as administrative agent, and Bank of America, N.A., ING Bank, N.V., Dublin Branch, BNP Paribas, and The Bank of Nova Scotia as Syndication Agents (incorporated by reference to Exhibit 10.1 to KBR’s current report on Form 8-K dated December 21, 2016; File No. 1-33146) | |
10.8 | Guaranty Agreement dated as of May 18, 2016 by and between KBR, Inc. in favor of Wyle Inc. (incorporated by reference to Exhibit 10.1 to KBR's current report on Form 8-K filed May 23, 2016; File No. 1-33146) | |
10.9 | Guaranty Agreement dated as of August 12, 2016 by and between KBR, Inc. in favor of Honeywell International Inc. (incorporated by reference to Exhibit 10.1 to KBR's current report on Form 8-K filed August 12, 2016; File No. 1-33146) | |
10.10+ | KBR, Inc. 2006 Stock and Incentive Plan (As Amended and Restated March 7, 2012) (incorporated by reference to KBR's definitive Proxy Statement dated April 5, 2012; File No. 1-33146) | |
10.11+ | KBR, Inc. 2006 Stock and Incentive Plan, as amended and restated effective May 16, 2016 (incorporated by reference to Exhibit 10.1 to KBR’s current report on Form 8-K filed May 18, 2016; File No. 1-33146) | |
122
Exhibit Number | Description | |
10.12+ | KBR, Inc. Senior Executive Performance Pay Plan (incorporated by reference to Exhibit 10.10 to KBR’s annual report on Form 10-K for the year ended December 31, 2013 filed on February 27, 2014; File No. 1-33146) | |
10.13+ | KBR, Inc. Management Performance Pay Plan (incorporated by reference to Exhibit 10.11 to KBR’s annual report on Form 10-K for the year ended December 31, 2013 filed on February 27, 2014; File No. 1-33146) | |
10.14+ | KBR, Inc. Transitional Stock Adjustment Plan (incorporated by reference to Exhibit 10.23 to KBR’s Form 10-K for the fiscal year ended December 31, 2006; File No. 1-33146) | |
10.15+ | KBR Dresser Deferred Compensation Plan (incorporated by reference to Exhibit 4.5 to KBR’s Registration Statement on Form S-8 filed on April 13, 2007) | |
10.16+ | KBR Supplemental Executive Retirement Plan (incorporated by reference to Exhibit 10.3 to KBR’s current report on Form 8-K dated April 9, 2007; File No. 1-33146) | |
10.17+ | KBR Benefit Restoration Plan (incorporated by reference to Exhibit 10.4 to KBR’s current report on Form 8-K dated April 9, 2007; File No. 1-33146) | |
10.18+ | KBR Elective Deferral Plan (incorporated by reference to Exhibit 10.5 to KBR’s current report on Form 8-K dated April 9, 2007; File No. 1-33146) | |
10.19+ | KBR Non-Employee Directors Elective Deferral Plan (incorporated by reference to Exhibit 10.1 to KBR's current report on Form 8-K dated December 11, 2013; File No. 1-33146) | |
10.20+ | Form of Stock Option Agreement pursuant to KBR, Inc. 2006 Stock and Incentive Plan (incorporated by reference to Exhibit 10.3 to KBR’s quarterly report on Form 10-Q for the period ended June 30, 2007; File No. 1-33146) | |
10.21+ | Form of KBR Restricted Stock Agreement pursuant to KBR, Inc. 2006 Stock and Incentive Plan (incorporated by reference to Exhibit 10.4 to KBR’s quarterly report on Form 10-Q for the period ended June 30, 2007; File No. 1-33146) | |
10.22+ | Form of KBR, Inc. Transitional Stock Adjustment Plan Stock Option Award (incorporated by reference to Exhibit 10.5 to KBR’s quarterly report on Form 10-Q for the period ended June 30, 2007; File No. 1-33146) | |
10.23+ | Form of revised KBR Performance Award Agreement pursuant to KBR, Inc. 2006 Stock and Incentive Plan (incorporated by reference to Exhibit 10.25 to KBR’s annual report on Form 10-K for the year ended December 31, 2010; File No. 1-33146) | |
10.24+ | Form of revised KBR Performance Award Agreement pursuant to KBR, Inc. 2006 Stock and Incentive Plan (incorporated by reference to Exhibit 10.25 to KBR’s annual report on Form 10-K for the year ended December 31, 2012; File No. 1-33146) | |
10.25+ | Form of revised Nonstatutory Stock Option Agreement for US and Non-US Employees pursuant to KBR, Inc. 2006 Stock and Incentive Plan (incorporated by reference to Exhibit 10.1 to KBR’s quarterly report on Form 10-Q for the period ended March 31, 2013; File No. 1-33146) | |
10.26+ | Form of revised Restricted Stock Unit Agreement (U.S. Employee) pursuant to KBR, Inc. 2006 Stock and Incentive Plan (incorporated by reference to Exhibit 10.2 to KBR’s quarterly report on Form 10-Q for the period ended March 31, 2013; File No. 1-33146) | |
10.27+ | Form of revised Restricted Stock Unit Agreement (International Employee) pursuant to KBR, Inc. 2006 Stock and Incentive Plan (incorporated by reference to Exhibit 10.5 to KBR’s quarterly report on Form 10-Q for the period ended March 31, 2013; File No. 1-33146) | |
10.28+ | Form of revised Restricted Stock Unit Agreement (Director) pursuant to KBR, Inc. 2006 Stock and Incentive Plan (incorporated by reference to Exhibit 10.3 to KBR’s quarterly report on Form 10-Q for the period ended March 31, 2013; File No. 1-33146) | |
10.29+ | Form of revised Performance Award Agreement pursuant to KBR, Inc. 2006 Stock and Incentive Plan (incorporated by reference to Exhibit 10.4 to KBR’s quarterly report on Form 10-Q for the period ended March 31, 2013; File No. 1-33146) | |
10.30+ | Form of Restricted Stock Unit Agreement (Three-Year Cliff Vesting) pursuant to KBR, Inc. 2006 Stock and Incentive Plan (incorporated by reference to Exhibit 10.29 to KBR’s annual report on Form 10-K for the year ended December 31, 2013 filed on February 27, 2014; File No. 1-33146) | |
123
Exhibit Number | Description | |
10.31+ | Form of revised KBR Performance Award Agreement pursuant to KBR, Inc. 2006 Stock and Incentive Plan (incorporated by reference to Exhibit 10.1 to KBR’s quarterly report on Form 10-Q for the period ended March 31, 2014; File No. 1-33146) | |
10.32+ | Form of revised Nonstatutory Stock Option Agreement pursuant to KBR, Inc. 2006 Stock and Incentive Plan (incorporated by reference to Exhibit 10.2 to KBR’s quarterly report on Form 10-Q for the period ended March 31, 2014; File No. 1-33146) | |
10.33+ | Form of revised Restricted Stock Unit Agreement (U.S. Employee) pursuant to KBR, Inc. 2006 Stock and Incentive Plan (incorporated by reference to Exhibit 10.3 to KBR’s quarterly report on Form 10-Q for the period ended March 31, 2014; File No. 1-33146) | |
10.34+ | Form of revised Restricted Stock Unit Agreement (U.S. Employee - 3 Year Vesting) pursuant to KBR, Inc. 2006 Stock and Incentive Plan (incorporated by reference to Exhibit 10.1 to KBR’s quarterly report on Form 10-Q for the period ended September 31, 2014; File No. 1-33146) | |
10.35+ | Form of revised Restricted Stock Unit Agreement (International Employee - 3 Year Vesting) pursuant to KBR, Inc. 2006 Stock and Incentive Plan (incorporated by reference to Exhibit 10.2 to KBR’s quarterly report on Form 10-Q for the period ended September 31, 2014; File No. 1-33146) | |
10.36+ | Form of Restricted Stock Unit Agreement (U.S. Employee - 3 Year Vesting; Involuntary Termination Trigger) pursuant to KBR, Inc. 2006 Stock and Incentive Plan (incorporated by reference to Exhibit 10.3 to KBR’s quarterly report on Form 10-Q for the period ended September 31, 2014; File No. 1-33146) | |
10.37+ | Form of Restricted Stock Unit Agreement (U.S. Employee - 5 Year Vesting; TSR Requirement) pursuant to KBR, Inc. 2006 Stock and Incentive Plan (incorporated by reference to Exhibit 10.4 to KBR’s quarterly report on Form 10-Q for the period ended September 31, 2014; File No. 1-33146) | |
10.38+ | Form of Restricted Stock Unit Agreement (U.S. Employee - 3 Year Vesting; TSR Requirement) pursuant to KBR, Inc. 2006 Stock and Incentive Plan (incorporated by reference to Exhibit 10.39 to KBR’s annual report on Form 10-K/A for the fiscal year ended December 31, 2015; File No. 1-33146) | |
10.39+ | Form of KBR Performance Award Agreement pursuant to KBR, Inc. 2006 Stock and Incentive Plan (incorporated by reference to Exhibit 10.40 to KBR’s Form annual report on 10-K for the year ended December 31, 2015; File No. 1-33146) | |
10.40+ | Form of revised Performance Award Agreement pursuant to KBR, Inc. 2006 Stock and Incentive Plan (incorporated by reference to Exhibit 10.2 to KBR’s quarterly report on Form 10-Q for the period ended March 31, 2015; File No. 1-33146) | |
10.41+ | Form of revised Restricted Stock Unit Agreement (US Employee) pursuant to KBR, Inc. 2006 Stock and Incentive Plan (incorporated by reference to Exhibit 10.1 to KBR’s quarterly report on Form 10-Q for the period ended March 31, 2016; File No. 1-33146) | |
10.42+ | Form of revised Restricted Stock Unit Agreement (International Employee) pursuant to KBR, Inc. 2006 Stock and Incentive Plan (incorporated by reference to Exhibit 10.2 to KBR’s quarterly report on Form 10-Q for the period ended March 31, 2016; File No. 1-33146) | |
10.43+ | Form of revised Performance Stock Unit Agreement (US Employee) pursuant to KBR, Inc. 2006 Stock and Incentive Plan (incorporated by reference to Exhibit 10.3 to KBR’s quarterly report on Form 10-Q for the period ended March 31, 2016; File No. 1-33146) | |
10.44+ | Form of revised Performance Stock Unit Agreement (International Employee) pursuant to KBR, Inc. 2006 Stock and Incentive Plan (incorporated by reference to Exhibit 10.4 to KBR’s quarterly report on Form 10-Q for the period ended March 31, 2016; File No. 1-33146) | |
10.45+ | Form of revised Performance Award Agreement (US/International Employee) pursuant to KBR, Inc. 2006 Stock and Incentive Plan (incorporated by reference to Exhibit 10.5 to KBR’s quarterly report on Form 10-Q for the period ended March 31, 2016; File No. 1-33146) | |
10.46+ | Form of Severance and Change in Control Agreement (incorporated by reference to Exhibit 10.1 to KBR’s quarterly report on Form 10-Q for the period ended September 30, 2008; File No. 1-33146) | |
10.47+ | Amendment to the 2008 Severance and Change in Control Agreements effective as of December 31, 2008 (incorporated by reference to Exhibit 10.36 to KBR’s annual report on Form 10-K for the year ended December 31, 2011; File No. 1-33146) | |
124
Exhibit Number | Description | |
10.48+ | Severance and Change of Control Agreement effective as of July 9, 2012, by and between KBR Technical Services, Inc., a Delaware corporation, KBR, Inc., and Ivor Harrington (incorporated by reference to Exhibit 10.1 to KBR's current report on Form 8-K dated July 9, 2012; File No. 1-33146) | |
10.49+ | Severance and Change in Control Agreement effective as of June 2, 2014, between KBR Technical Services, Inc., a Delaware corporation, KBR, Inc. and Stuart J. Bradie (incorporated by reference to Exhibit 10.1 to KBR’s current report on Form 8-K dated April 9, 2014; File No. 1-33146) | |
10.50+ | Severance and Change of Control Agreement effective as of December 11, 2011, by and between KBR Technical Services, Inc., a Delaware corporation, KBR, Inc., and Roy Oelking (incorporated by reference to Exhibit 10.38 to KBR’s annual report on Form 10-K for the year ended December 31, 2012; File No. 1-33146) | |
10.51+ | Severance and Change of Control Agreement effective as of December 14, 2011, by and between KBR Technical Services, Inc., a Delaware corporation, KBR, Inc., and Mitch Dauzat (incorporated by reference to Exhibit 10.1 to KBR’s quarterly report on Form 10-Q for the period ended September 30, 2013; File No. 1-33146) | |
10.52+ | Severance and Change of Control Agreement effective as of October 28, 2013, by and between KBR Technical Services, Inc., a Delaware corporation, KBR, Inc., and Brian Ferraioli (incorporated by reference to Exhibit 10.1 to KBR’s current report on Form 8-K dated October 28, 2013; File No. 1-33146) | |
10.53+ | Form of Amendment to Severance and Change in Control Agreement (incorporated by reference to Exhibit 10.2 to KBR’s quarterly report on Form 10-Q for the period ended September 30, 2015; File No. 1-33146) | |
10.54+ | Severance and Change of Control Agreement effective as of February 23, 2017, by and between KBR Technical Services, Inc., a Delaware corporation, KBR, Inc., and Mark Sopp (incorporated by reference to Exhibit 10.1 to KBR’s current report on Form 8-K dated December 12, 2016; File No. 1-33146) | |
*21.1 | List of subsidiaries | |
*23.1 | Consent of KPMG LLP—Houston, Texas | |
*31.1 | Certification of the Chief Executive Officer Pursuant to Section 302 of the Sarbanes-Oxley Act of 2002. | |
*31.2 | Certification of the Chief Financial Officer Pursuant to Section 302 of the Sarbanes-Oxley Act of 2002. | |
**32.1 | Certification Furnished Pursuant to 18 U.S.C. Section 1350 as Adopted Pursuant to Section 906 of the Sarbanes-Oxley Act of 2002. | |
**32.2 | Certification Furnished Pursuant to 18 U.S.C. Section 1350 as Adopted Pursuant to Section 906 of the Sarbanes-Oxley Act of 2002. | |
***101 | The following materials from the Company’s Annual Report on Form 10-K for the period ended December 31, 2016, formatted in XBRL (Extensible Business Reporting Language): (i) Consolidated Statements of Operations, (ii) Consolidated Statements of Comprehensive Income (Loss), (iii) Consolidated Balance Sheets, (iv) Consolidated Statements of Shareholders' Equity, (v) Consolidated Statements of Cash Flows, and (vi) Notes to Consolidated Financial Statements | |
+ | Management contracts or compensatory plans or arrangements | |
* | Filed with this Form 10-K | |
** | Furnished with this Form 10-K | |
*** | Interactive data files | |
125
KBR, Inc.
Schedule II—Valuation and Qualifying Accounts
The table below presents valuation and qualifying accounts for continuing operations.
(Dollars in Millions) | Additions | ||||||||||||||||||
Descriptions | Balance at Beginning Period | Charged to Costs and Expenses | Charged to Other Accounts | Deductions | Balance at End of Period | ||||||||||||||
Year ended December 31, 2016: | |||||||||||||||||||
Deducted from accounts and notes receivable: | |||||||||||||||||||
Allowance for doubtful accounts | $ | 17 | $ | (2 | ) | $ | — | $ | (1 | )(a) | $ | 14 | |||||||
Reserve for losses on uncompleted contracts | $ | 60 | $ | 331 | $ | — | $ | (328 | ) | $ | 63 | ||||||||
Reserve for potentially disallowable costs incurred under government contracts | $ | 50 | $ | 10 | $ | 6 | (b) | $ | (2 | ) | $ | 64 | |||||||
Year ended December 31, 2015: | |||||||||||||||||||
Deducted from accounts and notes receivable: | |||||||||||||||||||
Allowance for doubtful accounts | $ | 19 | $ | 2 | $ | — | $ | (4 | )(a) | $ | 17 | ||||||||
Reserve for losses on uncompleted contracts | $ | 159 | $ | 69 | $ | — | $ | (168 | ) | $ | 60 | ||||||||
Reserve for potentially disallowable costs incurred under government contracts | $ | 74 | $ | — | $ | 3 | (b) | $ | (27 | ) | $ | 50 | |||||||
Year ended December 31, 2014: | |||||||||||||||||||
Deducted from accounts and notes receivable: | |||||||||||||||||||
Allowance for doubtful accounts | $ | 18 | $ | 11 | $ | — | $ | (10 | )(a) | $ | 19 | ||||||||
Reserve for losses on uncompleted contracts | $ | 109 | $ | 278 | $ | — | $ | (228 | ) | $ | 159 | ||||||||
Reserve for potentially disallowable costs incurred under government contracts | $ | 91 | $ | — | $ | — | $ | (17 | ) | $ | 74 | ||||||||
(a) | Receivable write-offs, net of recoveries, and reclassifications. |
(b) | Reserves have been recorded as reductions of revenues, net of reserves no longer required. |
See accompanying report of independent registered public accounting firm.
126
SIGNATURES
Pursuant to the requirements of Section 13 or 15(d) of the Securities Exchange Act of 1934, the registrant has duly caused this report to be signed on its behalf by the undersigned, thereunto duly authorized.
Dated: February 24, 2017
KBR, INC. | |
(Registrant) | |
By: | /s/ Stuart Bradie |
Stuart Bradie | |
President and Chief Executive Officer | |
Dated: February 24, 2017
Pursuant to the requirements of the Securities Exchange Act of 1934, this report has been signed below by the following persons on behalf of the registrant and in the capacities and on the dates indicated:
Signature | Title | |
/s/ Stuart Bradie | Principal Executive Officer, | |
Stuart Bradie | President, Chief Executive Officer and Director | |
/s/ Brian K. Ferraioli | Principal Financial Officer, | |
Brian K. Ferraioli | Executive Vice President and Chief Financial Officer | |
/s/ Nelson E. Rowe | Principal Accounting Officer, | |
Nelson E. Rowe | Vice President and Chief Accounting Officer | |
/s/ Mark E. Baldwin | Director | |
Mark E. Baldwin | ||
/s/ James R. Blackwell | Director | |
James R. Blackwell | ||
/s/ Loren K. Carroll | Director | |
Loren K. Carroll | ||
/s/ Jeffrey E. Curtiss | Director | |
Jeffrey E. Curtiss | ||
/s/ Lester L. Lyles | Director | |
Lester L. Lyles | ||
/s/ Jack B. Moore | Director | |
Jack B. Moore | ||
/s/ Ann D. Pickard | Director | |
Ann D. Pickard | ||
/s/ Umberto della Sala | Director | |
Umberto della Sala | ||
/s/ Richard J. Slater | Director | |
Richard J. Slater | ||
127
EXHIBIT INDEX
Exhibit Number | Description | |
2.1 | Agreement and Plan of Merger by and among Wyle Inc., KBR Holdings, LLC, Road Runner Merger Sub, Inc., and CSC Shareholder Services LLC dated as of May 18, 2016 (incorporated by reference to Exhibit 2.1 to KBR's current report on Form 8-K filed May 23, 2016; File No. 1-33146) | |
2.2 | Purchase and Sale Agreement by and among Honeywell International Inc., Honeywell Technology Solutions Inc., and KBR Holdings, LLC dated as of August 12, 2016 (incorporated by reference to Exhibit 2.1 to KBR's current report on Form 8-K filed August 12, 2016; File No. 1-33146) | |
3.1 | KBR Amended and Restated Certificate of Incorporation (incorporated by reference to Exhibit 3.1 to KBR’s current report on Form 8-K filed June 7, 2012; File No. 1-33146) | |
3.2 | Amended and Restated Bylaws of KBR, Inc. (incorporated by reference to Exhibit 3.2 to KBR’s annual report on Form 10-K for the year ended December 31, 2013 filed on February 27, 2014; File No. 1-33146) | |
4.1 | Form of specimen KBR common stock certificate (incorporated by reference to Exhibit 4.1 to KBR’s registration statement on Form S-1; Registration No. 333-133302) | |
10.1 | Master Separation Agreement between Halliburton Company and KBR, Inc. dated as of November 20, 2006 (incorporated by reference to Exhibit 10.1 to KBR’s current report on Form 8-K dated November 20, 2006; File No. 1-33146) | |
10.2 | Tax Sharing Agreement, dated as of January 1, 2006, by and between Halliburton Company, KBR Holdings, LLC and KBR, Inc., as amended effective February 26, 2007 (incorporated by reference to Exhibit 10.2 to KBR’s Annual Report on Form 10-K for the year ended December 31, 2006; File No. 1-33146) | |
10.3 | Employee Matters Agreement dated as of November 20, 2006, by and between Halliburton Company and KBR, Inc. (incorporated by reference to Exhibit 10.6 to KBR’s current report on Form 8-K dated November 20, 2006; File No. 1-33146) | |
10.4 | Intellectual Property Matters Agreement dated as of November 20, 2006, by and between Halliburton Company and KBR, Inc. (incorporated by reference to Exhibit 10.7 to KBR’s current report on Form 8-K dated November 20, 2006; File No. 1-33146) | |
10.5 | Form of Indemnification Agreement between KBR, Inc. and its directors and executive officers (incorporated by reference to Exhibit 10.7 to KBR’s annual report on Form 10-K for the year ended December 31, 2013 filed on February 27, 2014; File No. 1-33146) | |
10.6 | Amended and Restated Revolving Credit Agreement dated as of September 25, 2015 among KBR, Inc., the Banks party thereto, Citibank, N.A., as Administrative Agent, Bank of America, N.A., ING Bank, N.V., Dublin Branch, BNP Paribas, and The Bank of Nova Scotia as Syndication Agents, Citibank, N.A., BNP Paribas, ING Bank, N.V., Dublin Branch, The Bank of Nova Scotia, Bank of America, N.A., and Compass Bank as initial Issuing Banks, and Citigroup Global Markets Inc., BNP Paribas Securities Corp., Merrill Lynch, Pierce, Fenner & Smith Inc., ING Bank, N.V., Dublin Branch, and The Bank of Nova Scotia as Joint Lead Arrangers and Bookrunners (incorporated by reference to Exhibit 10.1 to KBR’s current report on Form 8-K dated September 25, 2015; File No. 1-33146) | |
10.7 | First Amendment to Amended and Restated Credit Agreement dated as of December 21, 2016 to the Amended and Restated Revolving Credit Agreement dated as of September 25, 2015 (the “Credit Agreement”) among KBR, Inc., the several banks and other institutions parties to the Credit Agreement, Citibank, NA., as administrative agent, and Bank of America, N.A., ING Bank, N.V., Dublin Branch, BNP Paribas, and The Bank of Nova Scotia as Syndication Agents (incorporated by reference to Exhibit 10.1 to KBR’s current report on Form 8-K dated December 21, 2016; File No. 1-33146) | |
10.8 | Guaranty Agreement dated as of May 18, 2016 by and between KBR, Inc. in favor of Wyle Inc. (incorporated by reference to Exhibit 10.1 to KBR's current report on Form 8-K filed May 23, 2016; File No. 1-33146) | |
10.9 | Guaranty Agreement dated as of August 12, 2016 by and between KBR, Inc. in favor of Honeywell International Inc. (incorporated by reference to Exhibit 10.1 to KBR's current report on Form 8-K filed August 12, 2016; File No. 1-33146) | |
10.10+ | KBR, Inc. 2006 Stock and Incentive Plan (As Amended and Restated March 7, 2012) (incorporated by reference to KBR's definitive Proxy Statement dated April 5, 2012; File No. 1-33146) | |
10.11+ | KBR, Inc. 2006 Stock and Incentive Plan, as amended and restated effective May 16, 2016 (incorporated by reference to Exhibit 10.1 to KBR’s current report on Form 8-K filed May 18, 2016; File No. 1-33146) | |
128
Exhibit Number | Description | |
10.12+ | KBR, Inc. Senior Executive Performance Pay Plan (incorporated by reference to Exhibit 10.10 to KBR’s annual report on Form 10-K for the year ended December 31, 2013 filed on February 27, 2014; File No. 1-33146) | |
10.13+ | KBR, Inc. Management Performance Pay Plan (incorporated by reference to Exhibit 10.11 to KBR’s annual report on Form 10-K for the year ended December 31, 2013 filed on February 27, 2014; File No. 1-33146) | |
10.14+ | KBR, Inc. Transitional Stock Adjustment Plan (incorporated by reference to Exhibit 10.23 to KBR’s Form 10-K for the fiscal year ended December 31, 2006; File No. 1-33146) | |
10.15+ | KBR Dresser Deferred Compensation Plan (incorporated by reference to Exhibit 4.5 to KBR’s Registration Statement on Form S-8 filed on April 13, 2007) | |
10.16+ | KBR Supplemental Executive Retirement Plan (incorporated by reference to Exhibit 10.3 to KBR’s current report on Form 8-K dated April 9, 2007; File No. 1-33146) | |
10.17+ | KBR Benefit Restoration Plan (incorporated by reference to Exhibit 10.4 to KBR’s current report on Form 8-K dated April 9, 2007; File No. 1-33146) | |
10.18+ | KBR Elective Deferral Plan (incorporated by reference to Exhibit 10.5 to KBR’s current report on Form 8-K dated April 9, 2007; File No. 1-33146) | |
10.19+ | KBR Non-Employee Directors Elective Deferral Plan (incorporated by reference to Exhibit 10.1 to KBR's current report on Form 8-K dated December 11, 2013; File No. 1-33146) | |
10.20+ | Form of Stock Option Agreement pursuant to KBR, Inc. 2006 Stock and Incentive Plan (incorporated by reference to Exhibit 10.3 to KBR’s quarterly report on Form 10-Q for the period ended June 30, 2007; File No. 1-33146) | |
10.21+ | Form of KBR Restricted Stock Agreement pursuant to KBR, Inc. 2006 Stock and Incentive Plan (incorporated by reference to Exhibit 10.4 to KBR’s quarterly report on Form 10-Q for the period ended June 30, 2007; File No. 1-33146) | |
10.22+ | Form of KBR, Inc. Transitional Stock Adjustment Plan Stock Option Award (incorporated by reference to Exhibit 10.5 to KBR’s quarterly report on Form 10-Q for the period ended June 30, 2007; File No. 1-33146) | |
10.23+ | Form of revised KBR Performance Award Agreement pursuant to KBR, Inc. 2006 Stock and Incentive Plan (incorporated by reference to Exhibit 10.25 to KBR’s annual report on Form 10-K for the year ended December 31, 2010; File No. 1-33146) | |
10.24+ | Form of revised KBR Performance Award Agreement pursuant to KBR, Inc. 2006 Stock and Incentive Plan (incorporated by reference to Exhibit 10.25 to KBR’s annual report on Form 10-K for the year ended December 31, 2012; File No. 1-33146) | |
10.25+ | Form of revised Nonstatutory Stock Option Agreement for US and Non-US Employees pursuant to KBR, Inc. 2006 Stock and Incentive Plan (incorporated by reference to Exhibit 10.1 to KBR’s quarterly report on Form 10-Q for the period ended March 31, 2013; File No. 1-33146) | |
10.26+ | Form of revised Restricted Stock Unit Agreement (U.S. Employee) pursuant to KBR, Inc. 2006 Stock and Incentive Plan (incorporated by reference to Exhibit 10.2 to KBR’s quarterly report on Form 10-Q for the period ended March 31, 2013; File No. 1-33146) | |
10.27+ | Form of revised Restricted Stock Unit Agreement (International Employee) pursuant to KBR, Inc. 2006 Stock and Incentive Plan (incorporated by reference to Exhibit 10.5 to KBR’s quarterly report on Form 10-Q for the period ended March 31, 2013; File No. 1-33146) | |
10.28+ | Form of revised Restricted Stock Unit Agreement (Director) pursuant to KBR, Inc. 2006 Stock and Incentive Plan (incorporated by reference to Exhibit 10.3 to KBR’s quarterly report on Form 10-Q for the period ended March 31, 2013; File No. 1-33146) | |
10.29+ | Form of revised Performance Award Agreement pursuant to KBR, Inc. 2006 Stock and Incentive Plan (incorporated by reference to Exhibit 10.4 to KBR’s quarterly report on Form 10-Q for the period ended March 31, 2013; File No. 1-33146) | |
10.30+ | Form of Restricted Stock Unit Agreement (Three-Year Cliff Vesting) pursuant to KBR, Inc. 2006 Stock and Incentive Plan (incorporated by reference to Exhibit 10.29 to KBR’s annual report on Form 10-K for the year ended December 31, 2013 filed on February 27, 2014; File No. 1-33146) | |
10.31+ | Form of revised KBR Performance Award Agreement pursuant to KBR, Inc. 2006 Stock and Incentive Plan (incorporated by reference to Exhibit 10.1 to KBR’s quarterly report on Form 10-Q for the period ended March 31, 2014; File No. 1-33146) | |
129
Exhibit Number | Description | |
10.32+ | Form of revised Nonstatutory Stock Option Agreement pursuant to KBR, Inc. 2006 Stock and Incentive Plan (incorporated by reference to Exhibit 10.2 to KBR’s quarterly report on Form 10-Q for the period ended March 31, 2014; File No. 1-33146) | |
10.33+ | Form of revised Restricted Stock Unit Agreement (U.S. Employee) pursuant to KBR, Inc. 2006 Stock and Incentive Plan (incorporated by reference to Exhibit 10.3 to KBR’s quarterly report on Form 10-Q for the period ended March 31, 2014; File No. 1-33146) | |
10.34+ | Form of revised Restricted Stock Unit Agreement (U.S. Employee - 3 Year Vesting) pursuant to KBR, Inc. 2006 Stock and Incentive Plan (incorporated by reference to Exhibit 10.1 to KBR’s quarterly report on Form 10-Q for the period ended September 31, 2014; File No. 1-33146) | |
10.35+ | Form of revised Restricted Stock Unit Agreement (International Employee - 3 Year Vesting) pursuant to KBR, Inc. 2006 Stock and Incentive Plan (incorporated by reference to Exhibit 10.2 to KBR’s quarterly report on Form 10-Q for the period ended September 31, 2014; File No. 1-33146) | |
10.36+ | Form of Restricted Stock Unit Agreement (U.S. Employee - 3 Year Vesting; Involuntary Termination Trigger) pursuant to KBR, Inc. 2006 Stock and Incentive Plan (incorporated by reference to Exhibit 10.3 to KBR’s quarterly report on Form 10-Q for the period ended September 31, 2014; File No. 1-33146) | |
10.37+ | Form of Restricted Stock Unit Agreement (U.S. Employee - 5 Year Vesting; TSR Requirement) pursuant to KBR, Inc. 2006 Stock and Incentive Plan (incorporated by reference to Exhibit 10.4 to KBR’s quarterly report on Form 10-Q for the period ended September 31, 2014; File No. 1-33146) | |
10.38+ | Form of Restricted Stock Unit Agreement (U.S. Employee - 3 Year Vesting; TSR Requirement) pursuant to KBR, Inc. 2006 Stock and Incentive Plan (incorporated by reference to Exhibit 10.39 to KBR’s annual report on Form 10-K/A for the fiscal year ended December 31, 2015; File No. 1-33146) | |
10.39+ | Form of KBR Performance Award Agreement pursuant to KBR, Inc. 2006 Stock and Incentive Plan (incorporated by reference to Exhibit 10.40 to KBR’s Form annual report on 10-K for the year ended December 31, 2015; File No. 1-33146) | |
10.40+ | Form of revised Performance Award Agreement pursuant to KBR, Inc. 2006 Stock and Incentive Plan (incorporated by reference to Exhibit 10.2 to KBR’s quarterly report on Form 10-Q for the period ended March 31, 2015; File No. 1-33146) | |
10.41+ | Form of revised Restricted Stock Unit Agreement (US Employee) pursuant to KBR, Inc. 2006 Stock and Incentive Plan (incorporated by reference to Exhibit 10.1 to KBR’s quarterly report on Form 10-Q for the period ended March 31, 2016; File No. 1-33146) | |
10.42+ | Form of revised Restricted Stock Unit Agreement (International Employee) pursuant to KBR, Inc. 2006 Stock and Incentive Plan (incorporated by reference to Exhibit 10.2 to KBR’s quarterly report on Form 10-Q for the period ended March 31, 2016; File No. 1-33146) | |
10.43+ | Form of revised Performance Stock Unit Agreement (US Employee) pursuant to KBR, Inc. 2006 Stock and Incentive Plan (incorporated by reference to Exhibit 10.3 to KBR’s quarterly report on Form 10-Q for the period ended March 31, 2016; File No. 1-33146) | |
10.44+ | Form of revised Performance Stock Unit Agreement (International Employee) pursuant to KBR, Inc. 2006 Stock and Incentive Plan (incorporated by reference to Exhibit 10.4 to KBR’s quarterly report on Form 10-Q for the period ended March 31, 2016; File No. 1-33146) | |
10.45+ | Form of revised Performance Award Agreement (US/International Employee) pursuant to KBR, Inc. 2006 Stock and Incentive Plan (incorporated by reference to Exhibit 10.5 to KBR’s quarterly report on Form 10-Q for the period ended March 31, 2016; File No. 1-33146) | |
10.46+ | Form of Severance and Change in Control Agreement (incorporated by reference to Exhibit 10.1 to KBR’s quarterly report on Form 10-Q for the period ended September 30, 2008; File No. 1-33146) | |
10.47+ | Amendment to the 2008 Severance and Change in Control Agreements effective as of December 31, 2008 (incorporated by reference to Exhibit 10.36 to KBR’s annual report on Form 10-K for the year ended December 31, 2011; File No. 1-33146) | |
10.48+ | Severance and Change of Control Agreement effective as of July 9, 2012, by and between KBR Technical Services, Inc., a Delaware corporation, KBR, Inc., and Ivor Harrington (incorporated by reference to Exhibit 10.1 to KBR's current report on Form 8-K dated July 9, 2012; File No. 1-33146) | |
130
Exhibit Number | Description | |
10.49+ | Severance and Change in Control Agreement effective as of June 2, 2014, between KBR Technical Services, Inc., a Delaware corporation, KBR, Inc. and Stuart J. Bradie (incorporated by reference to Exhibit 10.1 to KBR’s current report on Form 8-K dated April 9, 2014; File No. 1-33146) | |
10.50+ | Severance and Change of Control Agreement effective as of December 11, 2011, by and between KBR Technical Services, Inc., a Delaware corporation, KBR, Inc., and Roy Oelking (incorporated by reference to Exhibit 10.38 to KBR’s annual report on Form 10-K for the year ended December 31, 2012; File No. 1-33146) | |
10.51+ | Severance and Change of Control Agreement effective as of December 14, 2011, by and between KBR Technical Services, Inc., a Delaware corporation, KBR, Inc., and Mitch Dauzat (incorporated by reference to Exhibit 10.1 to KBR’s quarterly report on Form 10-Q for the period ended September 30, 2013; File No. 1-33146) | |
10.52+ | Severance and Change of Control Agreement effective as of October 28, 2013, by and between KBR Technical Services, Inc., a Delaware corporation, KBR, Inc., and Brian Ferraioli (incorporated by reference to Exhibit 10.1 to KBR’s current report on Form 8-K dated October 28, 2013; File No. 1-33146) | |
10.53+ | Form of Amendment to Severance and Change in Control Agreement (incorporated by reference to Exhibit 10.2 to KBR’s quarterly report on Form 10-Q for the period ended September 30, 2015; File No. 1-33146) | |
10.54+ | Severance and Change of Control Agreement effective as of February 23, 2017, by and between KBR Technical Services, Inc., a Delaware corporation, KBR, Inc., and Mark Sopp (incorporated by reference to Exhibit 10.1 to KBR’s current report on Form 8-K dated December 12, 2016; File No. 1-33146) | |
*21.1 | List of subsidiaries | |
*23.1 | Consent of KPMG LLP—Houston, Texas | |
*31.1 | Certification of the Chief Executive Officer Pursuant to Section 302 of the Sarbanes-Oxley Act of 2002. | |
*31.2 | Certification of the Chief Financial Officer Pursuant to Section 302 of the Sarbanes-Oxley Act of 2002. | |
**32.1 | Certification Furnished Pursuant to 18 U.S.C. Section 1350 as Adopted Pursuant to Section 906 of the Sarbanes-Oxley Act of 2002. | |
**32.2 | Certification Furnished Pursuant to 18 U.S.C. Section 1350 as Adopted Pursuant to Section 906 of the Sarbanes-Oxley Act of 2002. | |
***101 | The following materials from the Company’s Annual Report on Form 10-K for the period ended December 31, 2016, formatted in XBRL (Extensible Business Reporting Language): (i) Consolidated Statements of Operations, (ii) Consolidated Statements of Comprehensive Income (Loss), (iii) Consolidated Balance Sheets, (iv) Consolidated Statements of Shareholders' Equity, (v) Consolidated Statements of Cash Flows, and (vi) Notes to Consolidated Financial Statements | |
+ | Management contracts or compensatory plans or arrangements | |
* | Filed with this Form 10-K | |
** | Furnished with this Form 10-K | |
*** | Interactive data files | |
131