Attached files
| file | filename |
|---|---|
| EX-99.1 - EXHIBIT 99.1 - USG CORP | a50616731ex991.htm |
| 8-K - USG CORPORATION 8-K - USG CORP | a50616731.htm |
Exhibit 99.2
1 USG Corporation First Quarter 2013 Earnings Conference Call and Webcast April 24, 2013
2 Forward-Looking Statements This presentation contains forward-looking statements within the meaning of the Private Securities Litigation Reform Act of 1995 related to management’s expectations about future conditions. Actual business, market or other conditions may differ materially from management’s expectations and, accordingly, may affect our sales and profitability or other results and liquidity. Actual results may differ materially due to various other factors, including: economic conditions, such as the levels of new home and other construction activity, employment levels, the availability of mortgage, construction and other financing, mortgage and other interest rates, housing affordability and supply, the levels of foreclosures and home resales, currency exchange rates and consumer confidence; capital markets conditions and the availability of borrowings under our credit agreement or other financings; competitive conditions, such as price, service and product competition; shortages in raw materials; changes in raw material and energy costs; volatility in the assumptions used to determine the funded status of our pension plans; the loss of one or more major customers and our customers’ ability to meet their financial obligations to us; capacity utilization rates for us and the industry; our ability to expand into new geographic markets and the stability of such markets; changes in laws or regulations, including environmental and safety regulations; the satisfactory performance of certain business functions by third party service providers; our ability to achieve anticipated savings from cost reduction programs; the outcome in contested litigation matters; the effects of acts of terrorism or war upon domestic and international economies and financial markets; and acts of God. We assume no obligation to update any forward-looking information contained in this presentation. First Quarter 2013 Earnings Call and Webcast
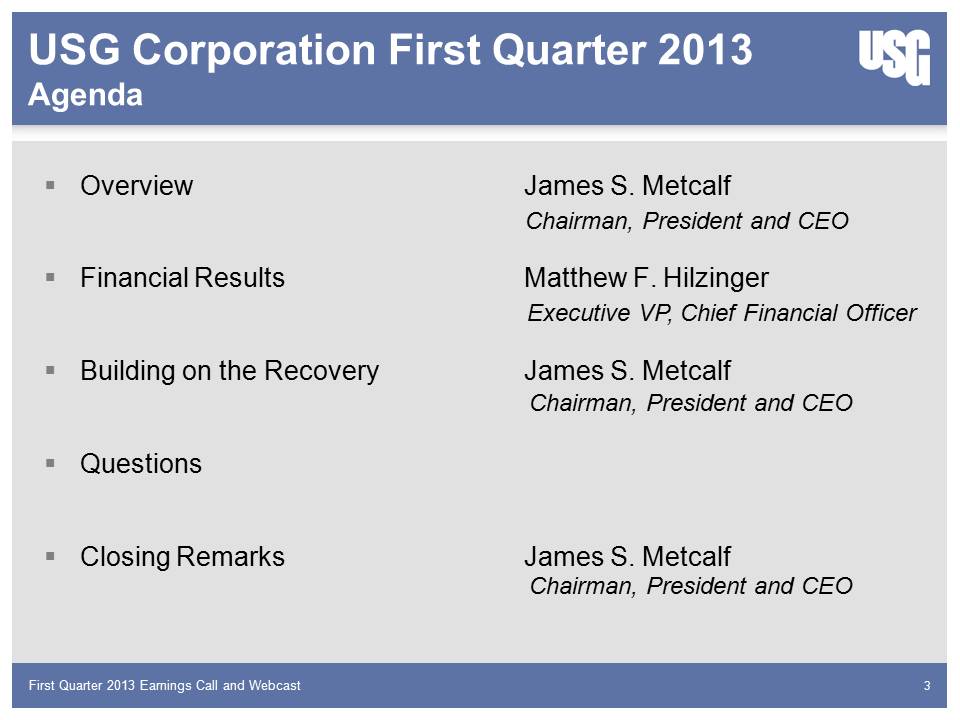
3 3 USG Corporation First Quarter 2013 Agenda Body: Overview James S. Metcalf Financial Results Matthew F. Hilzinger Building on the Recovery James S. Metcalf Questions Closing Remarks James S. Metcalf Chairman, President and CEO Executive VP, Chief Financial Officer Chairman, President and CEO Chairman, President and CEO First Quarter 2013 Earnings Call and Webcast

4 James S. Metcalf Chairman, President and CEO
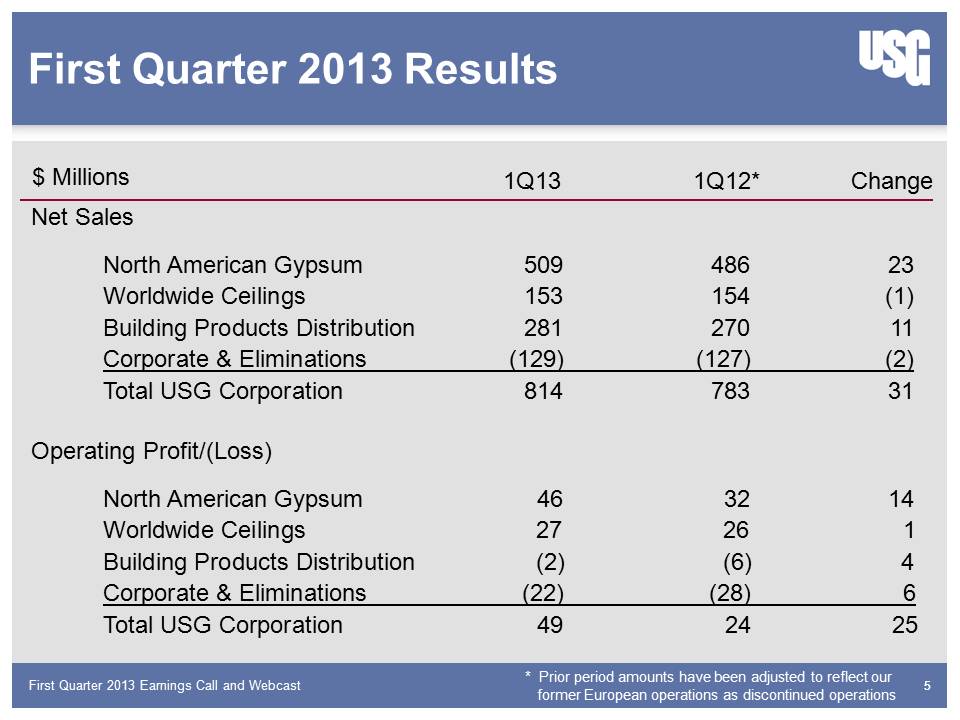
5 5 First Quarter 2013 Results Net SalesNorth American Gypsum 509 486 23Worldwide Ceilings 153 154 (1) Building Products Distribution 281 270 11 Corporate & Eliminations (129) (127) (2) Total USG Corporation 814 783 31 Operating Profit/(Loss) North American Gypsum 46 32 14 Worldwide Ceilings 27 26 1 Building Products Distribution (2) (6) 4 Corporate & Eliminations (22) (28) 6 Total USG Corporation 49 24 25 $ Millions 1Q12* 1Q13 5 Change * Prior period amounts have been adjusted to reflect our former European operations as discontinued operations First Quarter 2013 Earnings Call and Webcast
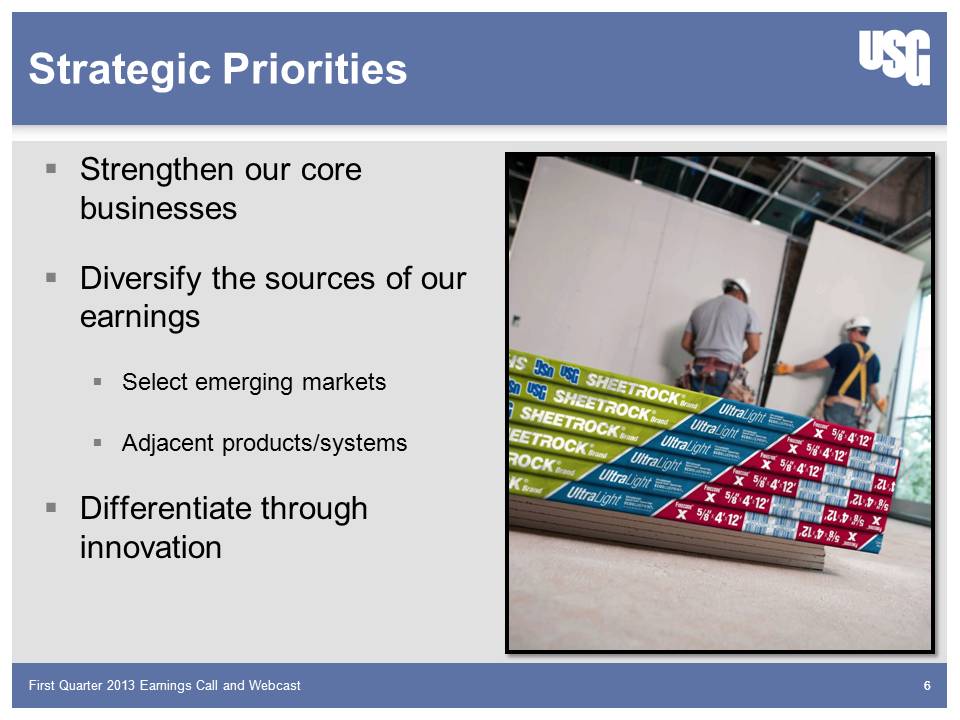
6 6 Strategic Priorities Strengthen our core businesses Diversify the sources of our earnings Select emerging markets Adjacent products/systems Differentiate through innovation First Quarter 2013 Earnings Call and Webcast
7 Matthew F. Hilzinger Executive VP, Chief Financial Officer
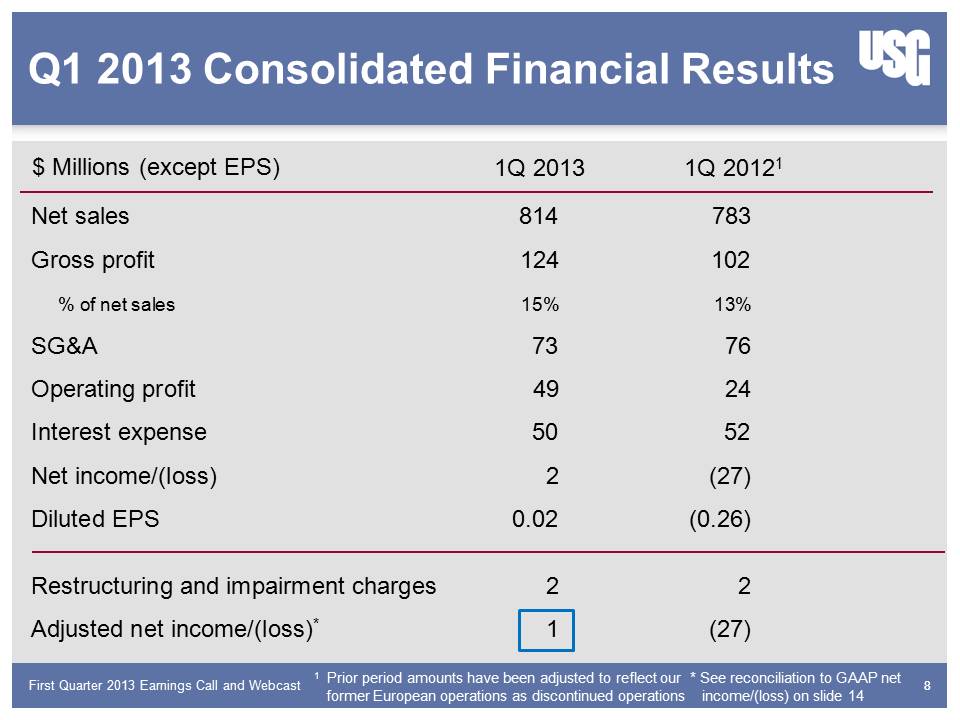
8 8 Q1 2013 Consolidated Financial Results Net sales 814 783 Gross profit 124 102 % of net sales 15% 13% SG&A 73 76 Operating profit 49 24 Interest expense 50 52 Net income/(loss) 2 (27) Diluted EPS 0.02 (0.26) Restructuring and impairment charges 2 2 Adjusted net income/(loss)* 1 (27) $ Millions (except EPS) 1Q 20121 1Q 2013 1 Prior period amounts have been adjusted to reflect our former European operations as discontinued operations * See reconciliation to GAAP net income/(loss) on slide 14 First Quarter 2013 Earnings Call and Webcast
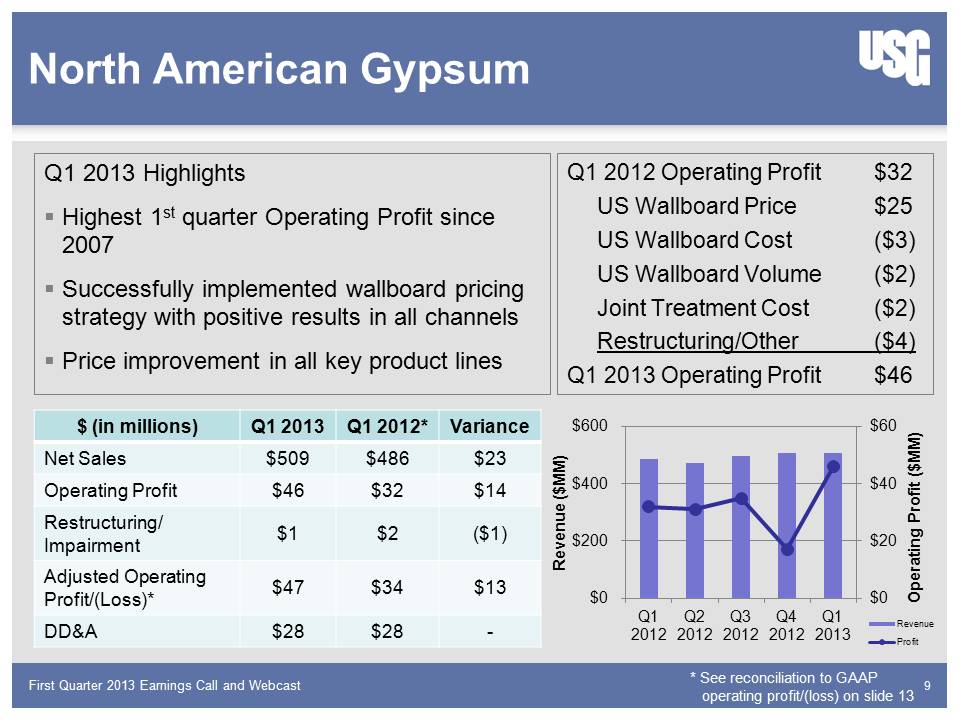
9 North American Gypsum Q1 2013 Highlights Highest 1st quarter Operating Profit since 2007 Successfully implemented wallboard pricing strategy with positive results in all channels Price improvement in all key product lines 9 Q1 2012 Operating Profit $32 US Wallboard Price $25 US Wallboard Cost ($3) US Wallboard Volume ($2) Joint Treatment Cost ($2) Restructuring/Other ($4) Q1 2013 Operating Profit $46 * See reconciliation to GAAP operating profit/(loss) on slide 13 First Quarter 2013 Earnings Call and Webcast $ (in millions) Q1 2013 Q1 2012* Variance Net Sales $509 $486 $23 Operating Profit $46 $32 $14 Restructuring/ Impairment $1 $2 ($1) $47 $34 $13 DD&A $28 $28 - Adjusted Operating Profit/(Loss)* Operating Profit ($MM) Revenue ($MM) Q1 Q2 Q3 Q4 2012 2013 $600 $400 $200 $0 $60 $40 $20 $0
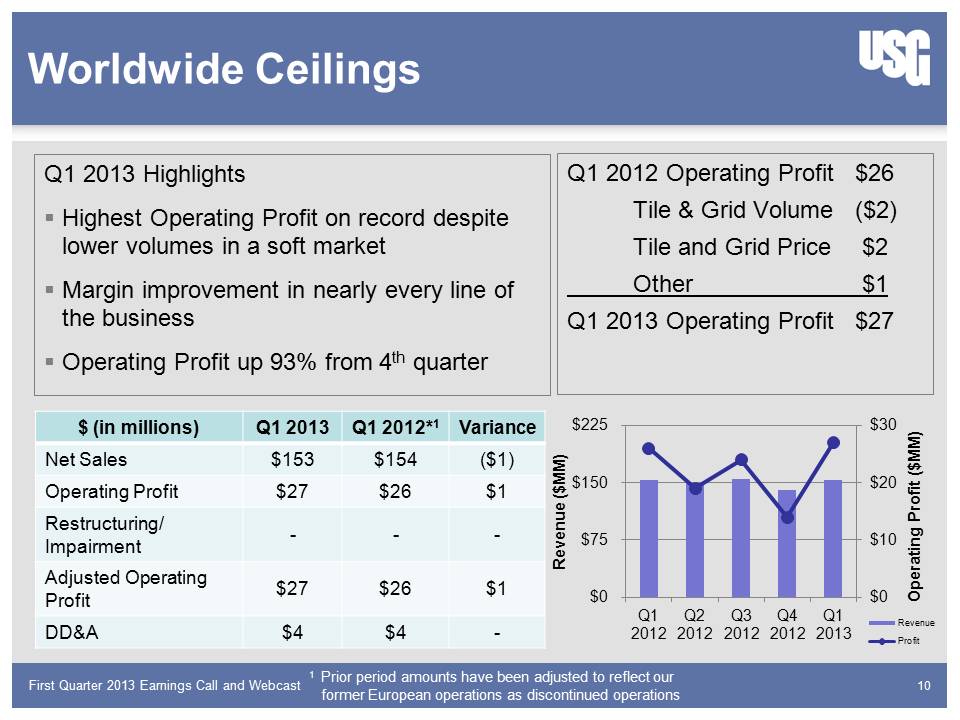
10 Worldwide Ceilings 10 Q1 2013 HighlightsHighest Operating Profit on record despite lower volumes in a soft marketMargin improvement in nearly every line of the business Operating Profit up 93% from 4th quarter Q1 2012 Operating Profit $26 Tile & Grid Volume ($2) Tile and Grid Price $2 Other $1 Q1 2013 Operating Profit $27 1 Prior period amounts have been adjusted to reflect our former European operations as discontinued operations First Quarter 2013 Earnings Call and Webcast $ (in millions) Q1 2013 Q1 2012*1 Variance Net Sales $153 $154 ($1) Operating Profit $27 $26 $1 Restructuring/ Impairment - - - Adjusted Operating Profit $27 $26 $1 DD&A $4 $4 - Revenue ($MM) Operating Profit ($MM) $225 $150 $75 $0 $30 $20 $10 $0 Q1 Q2 Q3 Q4 Q1 2012 2013 First Quarter 2013 Earnings Call and Webcast
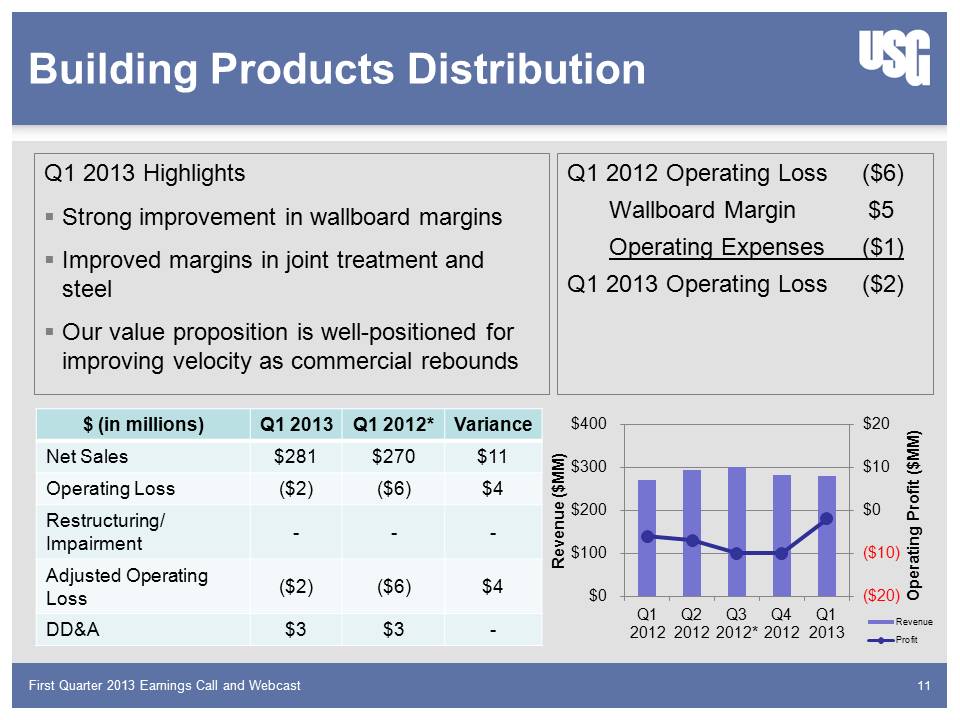
11 Building Products Distribution 11 Q1 2013 Highlights Strong improvement in wallboard margins Improved margins in joint treatment and steel Our value proposition is well-positioned for improving velocity as commercial rebounds Q1 2012 Operating Loss ($6) Wallboard Margin $5 Operating Expenses ($1) Q1 2013 Operating Loss ($2) $ (in millions) Q1 2013 Q1 2012* Variance Net Sales Operating Loss Restructuring/ Impairment Adjusted Operating Loss DD&A $281 $270 $11 ($2) ($6) $4 - - - ($2) ($6) $4 $3 $3 - Operating Profit ($MM) Revenue ($MM) Q1 Q2 Q3 Q4 2012 2013 $400 $300 $200 $100 $0 $20 $10 $0 ($10) ($20) First Quarter 2013 Earnings Call and Webcast
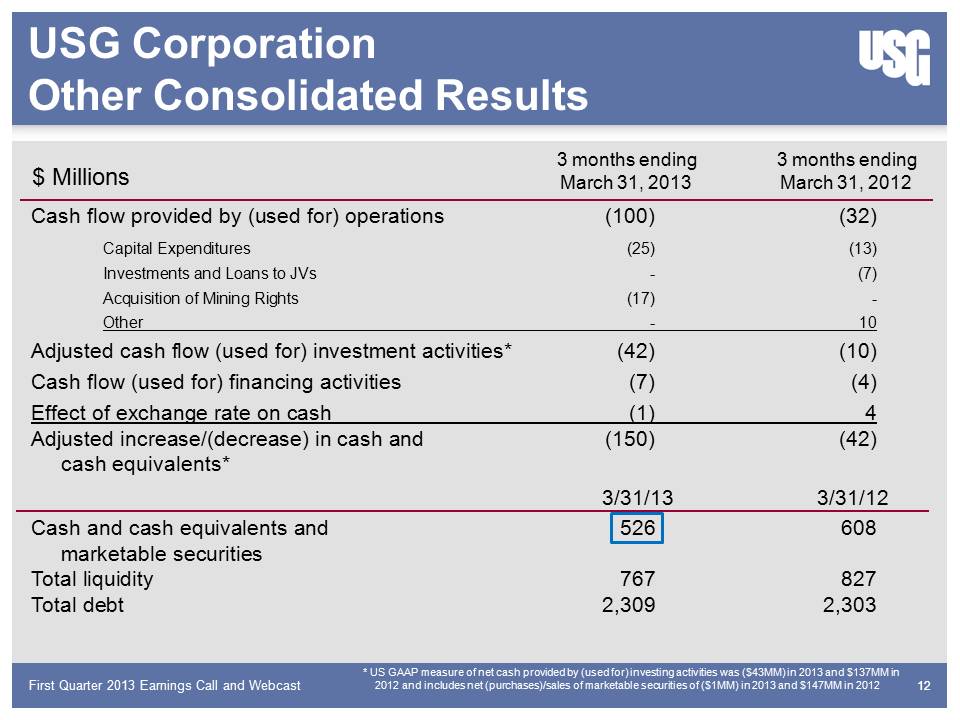
12 12 Cash flow provided by (used for) operations (100) (32) Capital Expenditures (25) (13) Investments and Loans to JVs - (7) Acquisition of Mining Rights (17) - Other - 10Adjusted cash flow (used for) investment activities* (42) (10)Cash flow (used for) financing activities (7) (4)Effect of exchange rate on cash (1) 4Adjusted increase/(decrease) in cash and (150) (42) cash equivalents* 3/31/13 3/31/12 Cash and cash equivalents and 526 608 marketable securities Total liquidity 767 827 Total debt 2,309 2,303 Title: USG Corporation Other Consolidated Results $ Millions 3 months endingMarch 31, 2012 3 months endingMarch 31, 2013 * US GAAP measure of net cash provided by (used for) investing activities was ($43MM) in 2013 and $137MM in 2012 and includes net (purchases)/sales of marketable securities of ($1MM) in 2013 and $147MM in 2012 First Quarter 2013 Earnings Call and Webcast
13 USG Net Operating Loss Carryforward USG has a $2.1B Federal net operating loss carryforwardManagement intends to use savings from this asset to de-lever the balance sheet and invest in strategic initiativesLimitations to how this asset may be used would apply if more than 50% of shares owned by 5% holders turn over within a rolling 3 year periodTo protect this asset, shareholders will have the opportunity to vote on two management proposals at the May Annual Meeting First Quarter 2013 Earnings Call and Webcast
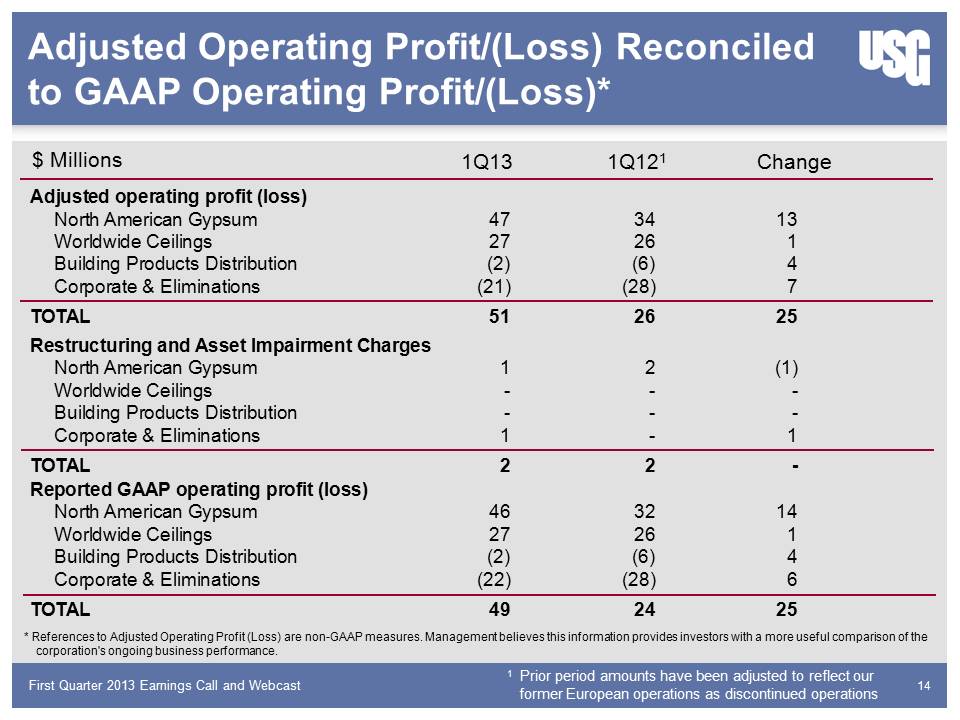
14 Adjusted Operating Profit/(Loss) Reconciled to GAAP Operating Profit/(Loss)* 14 1Q121 1Q13 Adjusted operating profit (loss) North American Gypsum 47 34 13 Worldwide Ceilings 27 26 1 Building Products Distribution (2) (6) 4 Corporate & Eliminations (21) (28) 7TOTAL 51 26 25 Restructuring and Asset Impairment Charges North American Gypsum 1 2 (1) Worldwide Ceilings - - - Building Products Distribution - - - Corporate & Eliminations 1 - 1 TOTAL 2 2 -Reported GAAP operating profit (loss) North American Gypsum 46 32 14 Worldwide Ceilings 27 26 1 Building Products Distribution (2) (6) 4 Corporate & Eliminations (22) (28) 6 TOTAL 49 24 25 Change $ Millions 1 Prior period amounts have been adjusted to reflect our former European operations as discontinued operations * References to Adjusted Operating Profit (Loss) are non-GAAP measures. Management believes this information provides investors with a more useful comparison of the corporation's ongoing business performance. First Quarter 2013 Earnings Call and Webcast
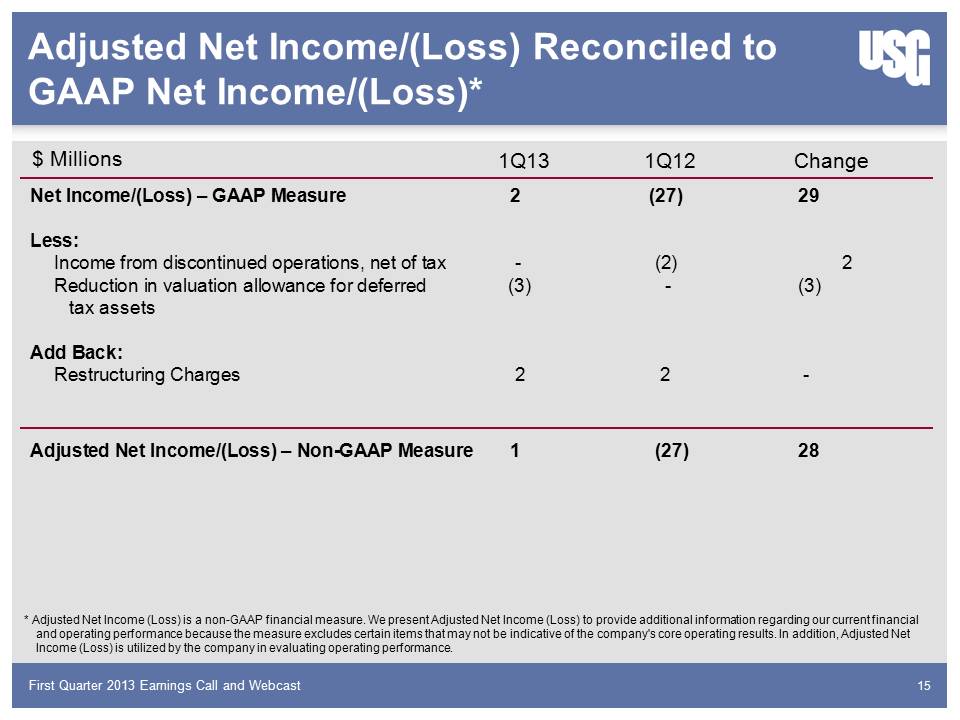
15 Adjusted Net Income/(Loss) Reconciled to GAAP Net Income/(Loss)* 15 1Q12 1Q13 Net Income/(Loss) – GAAP Measure 2 (27) 29 Less: Income from discontinued operations, net of tax - (2 ) 2 Reduction in valuation allowance for deferred (3) - (3) tax assets Add Back: Restructuring Charges 2 2 -Adjusted Net Income/(Loss) – Non-GAAP Measure 1 (27) 28 Change $ Millions * Adjusted Net Income (Loss) is a non-GAAP financial measure. We present Adjusted Net Income (Loss) to provide additional information regarding our current financial and operating performance because the measure excludes certain items that may not be indicative of the company's core operating results. In addition, Adjusted Net Income (Loss) is utilized by the company in evaluating operating performance. First Quarter 2013 Earnings Call and Webcast
16 James S. Metcalf Chairman, President and CEO
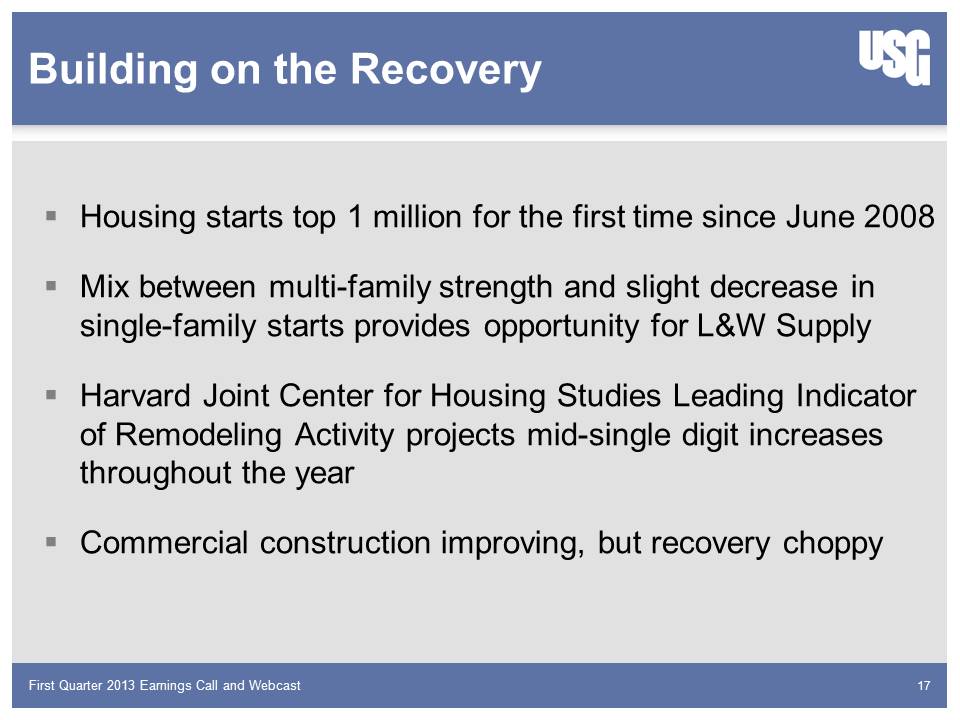
17 Building on the Recovery Housing starts top 1 million for the first time since June 2008Mix between multi-family strength and slight decrease in single-family starts provides opportunity for L&W SupplyHarvard Joint Center for Housing Studies Leading Indicator of Remodeling Activity projects mid-single digit increases throughout the yearCommercial construction improving, but recovery choppy 17 First Quarter 2013 Earnings Call and Webcast
18 Questions?

19 James S. Metcalf Chairman, President and CEO