Attached files
| file | filename |
|---|---|
| 8-K - 8-K - BOISE CASCADE Co | a2214383z8-k.htm |
| EX-23.1 - EX-23.1 - BOISE CASCADE Co | a2214383zex-23_1.htm |
QuickLinks -- Click here to rapidly navigate through this document
ITEM 8. FINANCIAL STATEMENTS AND SUPPLEMENTARY DATA
Boise Cascade Company
Consolidated Statements of Operations
| |
Year Ended December 31 | |||||||||
|---|---|---|---|---|---|---|---|---|---|---|
| |
2010 | 2011 | 2012 | |||||||
| |
(thousands, except per-share data) |
|||||||||
Sales |
||||||||||
Trade |
$ | 2,215,332 | $ | 2,229,325 | $ | 2,759,290 | ||||
Related parties |
25,259 | 18,763 | 19,772 | |||||||
|
2,240,591 | 2,248,088 | 2,779,062 | |||||||
Costs and expenses |
||||||||||
Materials, labor, and other operating expenses (excluding depreciation) |
1,947,362 | 1,952,619 | 2,343,174 | |||||||
Materials, labor, and other operating expenses from related parties (excluding depreciation) |
33,613 | 40,058 | 60,271 | |||||||
Depreciation and amortization |
34,899 | 37,022 | 33,407 | |||||||
Selling and distribution expenses |
202,464 | 204,998 | 235,055 | |||||||
General and administrative expenses |
38,463 | 37,242 | 43,122 | |||||||
General and administrative expenses from related party |
1,576 | — | — | |||||||
Other (income) expense, net |
(4,624 | ) | 3,195 | 902 | ||||||
|
2,253,753 | 2,275,134 | 2,715,931 | |||||||
Income (loss) from operations |
(13,162 | ) | (27,046 | ) | 63,131 | |||||
Foreign exchange gain (loss) |
352 | (497 | ) | 37 | ||||||
Gain on repurchase of long-term debt |
28 | — | — | |||||||
Interest expense |
(21,005 | ) | (18,987 | ) | (21,757 | ) | ||||
Interest income |
790 | 407 | 392 | |||||||
|
(19,835 | ) | (19,077 | ) | (21,328 | ) | ||||
Income (loss) before income taxes |
(32,997 | ) | (46,123 | ) | 41,803 | |||||
Income tax provision |
(300 | ) | (240 | ) | (307 | ) | ||||
Net income (loss) |
$ | (33,297 | ) | $ | (46,363 | ) | $ | 41,496 | ||
Net income (loss) per common share: |
||||||||||
Basic and diluted |
$ | (1.12 | ) | $ | (1.56 | ) | $ | 1.40 | ||
Weighted average shares outstanding: |
||||||||||
Basic and diluted |
29,700 | 29,700 | 29,700 | |||||||
See accompanying notes to consolidated financial statements.
1
Boise Cascade Company
Consolidated Statements of Comprehensive Income (Loss)
| |
Year Ended December 31 | |||||||||
|---|---|---|---|---|---|---|---|---|---|---|
| |
2010 | 2011 | 2012 | |||||||
| |
(thousands) |
|||||||||
Net income (loss) |
$ | (33,297 | ) | $ | (46,363 | ) | $ | 41,496 | ||
Other comprehensive income (loss) |
||||||||||
Defined benefit pension plans |
||||||||||
Net actuarial loss |
(4,027 | ) | (83,528 | ) | (8,432 | ) | ||||
Amortization of actuarial loss |
556 | 2,703 | 7,632 | |||||||
Amortization of prior service costs and other |
178 | 175 | 416 | |||||||
Other comprehensive loss |
(3,293 | ) | (80,650 | ) | (384 | ) | ||||
Comprehensive income (loss) |
$ | (36,590 | ) | $ | (127,013 | ) | $ | 41,112 | ||
See accompanying notes to consolidated financial statements.
2
Boise Cascade Company
Consolidated Balance Sheets
| |
December 31 | ||||||
|---|---|---|---|---|---|---|---|
| |
2011 | 2012 | |||||
| |
(thousands) |
||||||
ASSETS |
|||||||
Current |
|||||||
Cash and cash equivalents |
$ | 182,455 | $ | 54,507 | |||
Receivables |
|||||||
Trade, less allowances of $2,142 and $2,696 |
118,901 | 134,743 | |||||
Related parties |
1,236 | 674 | |||||
Other |
3,796 | 6,204 | |||||
Inventories |
283,978 | 325,806 | |||||
Prepaid expenses and other |
4,684 | 5,523 | |||||
|
595,230 | 527,457 | |||||
Property and equipment, net |
266,456 | 265,924 | |||||
Timber deposits |
8,327 | 6,221 | |||||
Deferred financing costs |
4,962 | 7,562 | |||||
Goodwill |
12,170 | 12,170 | |||||
Intangible assets |
8,900 | 8,900 | |||||
Other assets |
6,786 | 8,164 | |||||
Total assets |
$ | 902,831 | $ | 836,398 | |||
See accompanying notes to consolidated financial statements.
3
Boise Cascade Company
Consolidated Balance Sheets (Continued)
| |
December 31 | ||||||
|---|---|---|---|---|---|---|---|
| |
2011 | 2012 | |||||
| |
(thousands, except per share data) |
||||||
LIABILITIES AND STOCKHOLDER'S EQUITY |
|||||||
Current |
|||||||
Accounts payable |
|||||||
Trade |
$ | 116,758 | $ | 140,192 | |||
Related parties |
1,142 | 1,950 | |||||
Accrued liabilities |
|||||||
Compensation and benefits |
32,267 | 61,814 | |||||
Interest payable |
3,326 | 3,188 | |||||
Other |
24,486 | 29,043 | |||||
|
177,979 | 236,187 | |||||
Debt |
|||||||
Long-term debt |
219,560 | 275,000 | |||||
Other |
|||||||
Compensation and benefits |
200,248 | 206,668 | |||||
Other long-term liabilities |
13,676 | 14,336 | |||||
|
213,924 | 221,004 | |||||
Redeemable equity |
8,749 | 6,433 | |||||
Commitments and contingent liabilities |
|||||||
Stockholder's equity |
|||||||
Preferred stock, $0.01 par value per share; 50,000 shares authorized, no shares issued and outstanding |
— | — | |||||
Common stock, $0.01 par value per share; 300,000 shares authorized, 29,700 shares issued and outstanding |
297 | 297 | |||||
Additional paid-in capital |
482,894 | 256,927 | |||||
Accumulated other comprehensive loss |
(120,845 | ) | (121,229 | ) | |||
Accumulated deficit |
(79,727 | ) | (38,231 | ) | |||
Total stockholder's equity |
282,619 | 97,764 | |||||
Total liabilities and stockholder's equity |
$ | 902,831 | $ | 836,398 | |||
See accompanying notes to consolidated financial statements.
4
Boise Cascade Company
Consolidated Statements of Cash Flows
| |
Year Ended December 31 | |||||||||
|---|---|---|---|---|---|---|---|---|---|---|
| |
2010 | 2011 | 2012 | |||||||
| |
(thousands) |
|||||||||
Cash provided by (used for) operations |
||||||||||
Net income (loss) |
$ | (33,297 | ) | $ | (46,363 | ) | $ | 41,496 | ||
Items in net income (loss) not using (providing) cash |
||||||||||
Depreciation and amortization, including deferred financing costs and other |
37,674 | 39,232 | 37,211 | |||||||
Pension expense |
7,449 | 11,368 | 12,653 | |||||||
Management equity units expense |
1,625 | — | — | |||||||
Other |
(371 | ) | 2,220 | (471 | ) | |||||
Decrease (increase) in working capital, net of acquisitions |
||||||||||
Receivables |
(6,338 | ) | (15,675 | ) | (17,238 | ) | ||||
Inventories |
(28,428 | ) | (20,899 | ) | (41,828 | ) | ||||
Prepaid expenses and other |
(300 | ) | (72 | ) | (652 | ) | ||||
Accounts payable and accrued liabilities |
32,419 | 1,878 | 53,041 | |||||||
Pension contributions |
(3,873 | ) | (13,621 | ) | (8,486 | ) | ||||
Other |
3,727 | (1,049 | ) | 4,410 | ||||||
Net cash provided by (used for) operations |
10,287 | (42,981 | ) | 80,136 | ||||||
Cash provided by (used for) investment |
||||||||||
Expenditures for property and equipment |
(35,751 | ) | (33,537 | ) | (27,386 | ) | ||||
Acquisitions of businesses and facilities |
— | (5,782 | ) | (2,355 | ) | |||||
Proceeds from sales of assets |
1,254 | 3,126 | 246 | |||||||
Other |
(956 | ) | (424 | ) | 61 | |||||
Net cash used for investment |
(35,453 | ) | (36,617 | ) | (29,434 | ) | ||||
Cash provided by (used for) financing |
||||||||||
Issuances of long-term debt |
45,000 | — | 300,000 | |||||||
Payments of long-term debt |
(128,451 | ) | — | (244,560 | ) | |||||
Distributions to Boise Cascade Holdings, L.L.C. |
— | — | (228,268 | ) | ||||||
Proceeds from Boise Cascade Holdings, L.L.C., for sale of shares of Boise Inc. |
86,117 | — | — | |||||||
Financing costs |
— | (2,548 | ) | (5,822 | ) | |||||
Net cash provided by (used for) financing |
2,666 | (2,548 | ) | (178,650 | ) | |||||
Net decrease in cash and cash equivalents |
(22,500 | ) | (82,146 | ) | (127,948 | ) | ||||
Balance at beginning of the period |
287,101 |
264,601 |
182,455 |
|||||||
Balance at end of the period |
$ | 264,601 | $ | 182,455 | $ | 54,507 | ||||
See accompanying notes to consolidated financial statements.
5
Boise Cascade Company
Consolidated Statements of Stockholder's Equity
| |
Common Stock | |
Accumulated Other Comprehensive Loss |
|
|
||||||||||||||
|---|---|---|---|---|---|---|---|---|---|---|---|---|---|---|---|---|---|---|---|
| |
Additional Paid-In Capital |
Accumulated Deficit Income |
|
||||||||||||||||
| |
Shares | Amount | Total | ||||||||||||||||
| |
(thousands) |
||||||||||||||||||
Balance at December 31, 2009 |
29,700 | $ | 297 | $ | 395,957 | $ | (36,902 | ) | $ | (67 | ) | $ | 359,285 | ||||||
Net loss |
(33,297 | ) | (33,297 | ) | |||||||||||||||
Other comprehensive loss |
(3,293 | ) | (3,293 | ) | |||||||||||||||
Transfer of proceeds from Boise Cascade Holdings, L.L.C., for sale of Boise Inc. shares |
86,123 | 86,123 | |||||||||||||||||
Other |
275 | 275 | |||||||||||||||||
Balance at December 31, 2010 |
29,700 | $ | 297 | $ | 482,355 | $ | (40,195 | ) | $ | (33,364 | ) | $ | 409,093 | ||||||
Net loss |
(46,363 | ) | (46,363 | ) | |||||||||||||||
Other comprehensive loss |
(80,650 | ) | (80,650 | ) | |||||||||||||||
Allocation of redeemable equity to stockholder's equity |
550 | 550 | |||||||||||||||||
Other |
(11 | ) | (11 | ) | |||||||||||||||
Balance at December 31, 2011 |
29,700 | $ | 297 | $ | 482,894 | $ | (120,845 | ) | $ | (79,727 | ) | $ | 282,619 | ||||||
Net income |
41,496 | 41,496 | |||||||||||||||||
Other comprehensive loss |
(384 | ) | (384 | ) | |||||||||||||||
Distributions to Boise Cascade Holdings, L.L.C. |
(228,268 | ) | (228,268 | ) | |||||||||||||||
Allocation of redeemable equity to stockholder's equity |
2,306 | 2,306 | |||||||||||||||||
Other |
(5 | ) | (5 | ) | |||||||||||||||
Balance at December 31, 2012 |
29,700 | $ | 297 | $ | 256,927 | $ | (121,229 | ) | $ | (38,231 | ) | $ | 97,764 | ||||||
See accompanying notes to consolidated financial statements.
6
Notes to Consolidated Financial Statements
1. Nature of Operations and Basis of Presentation
Nature of Operations
We are a building products company headquartered in Boise, Idaho. Our operations began on October 29, 2004 (inception), when we acquired the forest products and paper assets of OfficeMax (the Forest Products Acquisition). As used in these consolidated financial statements, the terms "Boise Cascade," "we," and "our" refer to Boise Cascade, L.L.C., and its consolidated subsidiaries prior to our conversion to a Delaware corporation and to Boise Cascade Company and its consolidated subsidiaries on or after such conversion, as discussed in Note 16, Subsequent Events. Prior to the initial public offering of shares of common stock of Boise Cascade Company, discussed in Note 13, Equity, Boise Cascade was 100% owned by Boise Cascade Holdings, L.L.C. (BC Holdings). We are a leading U.S. wholesale distributor of building products and one of the largest producers of engineered wood products (EWP) and plywood in North America.
We operate our business using three reportable segments: (1) Wood Products, which manufactures and sells EWP, plywood, studs, particleboard, and ponderosa pine lumber, (2) Building Materials Distribution, which is a wholesale distributor of building materials, and (3) Corporate and Other, which includes corporate support staff services, related assets and liabilities, and foreign exchange gains and losses. For more information, see Note 14, Segment Information.
The following sets forth our corporate structure and equity ownership at December 31, 2012 (prior to our initial public offering):
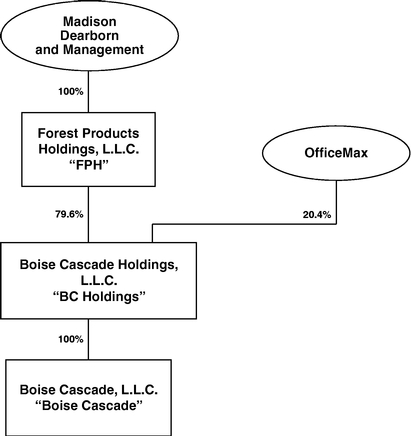
7
Notes to Consolidated Financial Statements (Continued)
1. Nature of Operations and Basis of Presentation (Continued)
Basis of Presentation and Comparability of Data
In connection with the sale of our Paper and Packaging & Newsprint assets in 2008, we received $1,277.2 million of cash consideration, a $41 million paid-in-kind promissory note receivable, and $285.2 million of net stock consideration.
Immediately following the sale, we distributed the securities received in the transaction to BC Holdings, as the securities were not subject to the collateral liens of the bank credit facility of the company then in effect. However, the cash and securities received in the transaction were subject to the covenants of the company's subordinated note indenture in effect at the time of the distribution and the guaranty provided by BC Holdings. As a result of receiving stock in Boise Inc., BC Holdings had a significant indirect financial interest in the results of the sold businesses. The equity interest BC Holdings owned in Boise Inc. and the related-party transactions we had with Boise Inc. after the sale represented a significant continuing involvement. In 2008, BC Holdings sold the paid-in-kind promissory note receivable for $52.7 million after selling expenses and transferred the net proceeds to us. In 2009 and 2010, BC Holdings sold 18.8 million and 18.3 million shares of Boise Inc. and transferred the net proceeds of $83.2 million and $86.1 million to us. The cash received as a reinvestment in us by BC Holdings was reflected in our Consolidated Statements of Cash Flows. We used the cash received from BC Holdings in 2008, 2009, and 2010 to repay senior debt and for capital spending in accordance with the asset sale covenant of our subordinated note indenture. The 18.3 million shares sold in 2010 represented BC Holdings' remaining investment in Boise Inc. Because of the disposition, Boise Inc. is no longer a related party. The related-party activity with Boise Inc. included in the Consolidated Financial Statements includes only those sales and costs and expenses transacted prior to March 2010, when Boise Inc. was a related party. As a result, beginning in March 2010, transactions with Louisiana Timber Procurement Company, L.L.C. (LTP) (discussed in Note 4, Transactions With Related Parties) represent the only remaining significant related-party activity recorded in our consolidated financial statements.
2. Summary of Significant Accounting Policies
Principles of Consolidation
The consolidated financial statements include the accounts of Boise Cascade and its subsidiaries. Intercompany balances and transactions have been eliminated.
Use of Estimates
The preparation of financial statements in conformity with accounting principles generally accepted in the United States of America requires management to make estimates and assumptions about future events. These estimates and the underlying assumptions affect the amounts of assets and liabilities reported, disclosures about contingent assets and liabilities, and reported amounts of revenues and expenses. Such estimates include the valuation of accounts receivable, inventories, goodwill, intangible assets, and other long-lived assets; legal contingencies; guarantee obligations; indemnifications; assumptions used in retirement benefits; and vendor and customer rebates, among others. These estimates and assumptions are based on management's best estimates and judgment. Management evaluates its estimates and assumptions on an ongoing basis using historical experience and other factors, including the current economic environment, which management believes to be reasonable under the circumstances. We adjust such estimates and assumptions when facts and circumstances dictate. As future events and their effects cannot be determined with precision, actual results could
8
Notes to Consolidated Financial Statements (Continued)
2. Summary of Significant Accounting Policies (Continued)
differ significantly from these estimates. Changes in these estimates resulting from continuing changes in the economic environment will be reflected in the consolidated financial statements in future periods.
Revenue Recognition
We recognize revenue when the following criteria are met: persuasive evidence of an agreement exists, delivery has occurred or services have been rendered, our price to the buyer is fixed or determinable, and collectibility is reasonably assured. Delivery is not considered to have occurred until the customer takes title and assumes the risks and rewards of ownership. The timing of revenue recognition is dependent on shipping terms. Revenue is recorded at the time of shipment for terms designated free on board (fob) shipping point. For sales transactions designated fob destination, revenue is recorded when the product is delivered to the customer's delivery site. Fees for shipping and handling charged to customers for sales transactions are included in "Sales." For our Wood Products segment, costs related to shipping and handling are included in "Materials, labor, and other operating expenses (excluding depreciation)." In our Wood Products segment, we view our shipping and handling costs as a cost of the manufacturing process and the movement of product to our end customers. For our Building Materials Distribution segment, costs related to shipping and handling of $77.9 million, $79.9 million, and $89.3 million are included primarily in "Selling and distribution expenses" for the years ended December 31, 2010, 2011, and 2012, respectively. In our Building Materials Distribution segment, our activities relate to the purchase and resale of finished product, and excluding shipping and handling costs from "Materials, labor, and other operating expenses (excluding depreciation)" provides us a clearer view of our operating performance and the effectiveness of our sales and purchasing functions. We present sales taxes collected from customers and remitted to governmental authorities on a net basis in our Consolidated Statements of Operations.
Cash and Cash Equivalents
Cash equivalents consist of short-term investments that have a maturity of three months or less at the date of purchase. At December 31, 2011 and 2012, the majority of our cash and cash equivalents were invested in money market funds that are broadly diversified and invest in high-quality, short-duration securities, including commercial paper, certificates of deposit, U.S. government agency securities, and similar instruments. We have significant amounts of cash and cash equivalents that are in excess of federally insured limits. Though we have not experienced any losses on our cash and cash equivalents to date and we do not anticipate incurring any losses, we cannot be assured that we will not experience losses on our cash and cash equivalents.
Trade Accounts Receivables and Allowance for Doubtful Accounts
Trade accounts receivable are stated at the amount we expect to collect. Trade accounts receivable do not bear interest. We make ongoing estimates relating to the collectibility of our accounts receivable and maintain a reserve for estimated losses resulting from the inability of our customers to meet their financial obligations to us. At December 31, 2011 and 2012, we had $2.1 million and $2.7 million, respectively, recorded as allowances for doubtful accounts. In determining the amount of the reserve, we consider our historical level of credit losses, customer concentrations, current economic trends, and changes in customer creditworthiness. Our sales are principally to customers in the building products industry located in the United States and Canada. A significant portion of our sales are concentrated with a relatively small number of customers. In 2012, our top ten customers represented approximately
9
Notes to Consolidated Financial Statements (Continued)
2. Summary of Significant Accounting Policies (Continued)
29% of sales. In order to manage credit risk, we consider customer concentrations and current economic trends and monitor the creditworthiness of significant customers based on ongoing credit evaluations. At both December 31, 2011 and 2012, receivables from a single customer accounted for approximately 14% of total receivables. No other customer accounted for 10% or more of total receivables. Adjustments to the valuation allowance are charged to income. Trade accounts receivable balances that remain outstanding after we have used reasonable collection efforts are written off through a charge to the valuation allowance and a credit to accounts receivable.
The low level of new residential construction in the U.S. and more restrictive lending standards have affected the ability of our customers and our customers' customers to fund their operations, which makes it difficult for us to estimate future credit losses. Although we have not experienced material credit losses in recent years, our actual future losses from uncollectible accounts may differ materially from our current estimates. As additional information becomes known, we may change our estimates. In the event we determine that a change in the reserve is appropriate, we will record a charge to "Selling and distribution expenses" in our Consolidated Statements of Operations in the period we make such a determination.
Fair Value
Fair value is defined as the price that would be received to sell an asset or paid to transfer a liability in an orderly transaction between market participants at the measurement date. The fair value hierarchy under U.S. generally accepted accounting principles (GAAP) gives the highest priority to quoted market prices (Level 1) and the lowest priority to unobservable inputs (Level 3). In general, and where applicable, we use quoted prices in active markets for identical assets or liabilities to determine fair value (Level 1). If quoted prices in active markets for identical assets or liabilities are not available to determine fair value, we use quoted prices for similar assets and liabilities or inputs that are observable either directly or indirectly (Level 2). If quoted prices for identical or similar assets are not available or are unobservable, we may use internally developed valuation models, whose inputs include bid prices, and third-party valuations utilizing underlying asset assumptions (Level 3). See Note 11, Retirement and Benefit Plans, for the fair value measurements of our defined benefit plans' assets.
Financial Instruments
Our financial instruments are cash and cash equivalents, accounts receivable, accounts payable, and long-term debt. Our cash is recorded at cost, which approximates fair value, and our cash equivalents are money market funds measured at fair value. As of December 31, 2011 and 2012, we held $164.6 million and $10.6 million, respectively, in money market funds that are measured at fair value on a recurring basis using Level 1 inputs. The recorded values of accounts receivable and accounts payable approximate fair values based on their short-term nature. At December 31, 2012, the book value of our fixed-rate debt was $250.0 million, and the fair value was estimated to be $251.6 million. The difference between the book value and the fair value is derived from the difference between the period-end market interest rate and the stated rate of our fixed-rate, long-term debt. We estimated the fair value based on quoted market prices for similar traded debt (Level 2 measurement). The interest rate on our revolving credit facility is based on market conditions such as the London Interbank Offered Rate (LIBOR) or a base rate. Because the interest rate on the revolving credit facility is based on current market conditions, we believe that the estimated fair value of the outstanding balance on our revolving credit facility approximates book value.
10
Notes to Consolidated Financial Statements (Continued)
2. Summary of Significant Accounting Policies (Continued)
We are exposed to financial risks such as changes in interest rates, foreign currency exchange rates, and commodity price risk. We employ a variety of practices to manage these risks, including operating and financing activities and, where deemed appropriate, the use of derivative instruments. During the years ended December 31, 2011 and 2012, we had no derivative instruments.
Vendor and Customer Rebates and Allowances
We receive rebates and allowances from our vendors under a number of different programs, including vendor marketing programs. At December 31, 2011 and 2012, we had $2.8 million and $4.1 million, respectively, of vendor rebates and allowances recorded in "Receivables, Other" on the Consolidated Balance Sheets. Rebates and allowances received from our vendors are recognized as a reduction of "Materials, labor, and other operating expenses (excluding depreciation)" when the product is sold, unless the rebates and allowances are linked to a specific incremental cost to sell a vendor's product. Amounts received from vendors that are linked to specific selling and distribution expenses are recognized as a reduction of "Selling and distribution expenses" in the period the expense is incurred.
We also provide rebates to our customers and our customers' customers based on the volume of their purchases. We provide the rebates to increase the sell-through of our products. The rebates are recorded as a decrease in "Sales, Trade." At December 31, 2011 and 2012, we had $15.6 million and $19.7 million, respectively, of rebates payable to our customers recorded in "Accrued liabilities, Other" on our Consolidated Balance Sheets.
Foreign Currency
The functional currency for our operations outside the United States is the U.S. dollar. Nonmonetary assets and liabilities and related depreciation and amortization for these foreign operations are remeasured into U.S. dollars using historical exchange rates. Monetary assets and liabilities are remeasured into U.S. dollars using the exchange rates as of the Consolidated Balance Sheet date. Revenue and expense items are remeasured into U.S. dollars using an average exchange rate prevailing during the year.
Leases
We assess lease classification as either capital or operating at lease inception or upon modification. We lease a portion of our distribution centers as well as other property and equipment under operating leases. Substantially all lease agreements have fixed payment terms based on the passage of time. Some lease agreements provide us with the option to purchase the leased property. Additionally, some agreements contain renewal options generally ranging from two to five years, with fixed payment terms similar to those in the original lease agreements. For purposes of determining straight-line rent expense, the lease term is calculated from the date we first take possession of the facility, including any periods of free rent and any renewal option periods we are reasonably assured of exercising.
Inventory Valuation
Inventories are valued at the lower of cost or market. Cost is based on the first-in, first-out (FIFO) method of inventory valuation or average cost, which approximates the FIFO method. Manufactured inventories include costs for materials, labor, and factory overhead. Log inventories include costs to harvest and deliver the timber.
11
Notes to Consolidated Financial Statements (Continued)
2. Summary of Significant Accounting Policies (Continued)
Inventories include the following (work in process is not material):
| |
December 31, 2011 |
December 31, 2012 |
|||||
|---|---|---|---|---|---|---|---|
| |
(thousands) |
||||||
Finished goods and work in process |
$ | 223,605 | $ | 267,115 | |||
Logs |
41,243 | 37,273 | |||||
Other raw materials and supplies |
19,130 | 21,418 | |||||
|
$ | 283,978 | $ | 325,806 | |||
Property and Equipment
Property and equipment are recorded at cost. Cost includes expenditures for major improvements and replacements and the amount of interest cost associated with significant capital additions. For the years ended December 31, 2010, 2011, and 2012, we did not capitalize any interest. We expense all repair and maintenance costs as incurred. When property and equipment are retired, sold, or otherwise disposed of, the asset's carrying amount and related accumulated depreciation are removed from the accounts and any gain or loss is included in income (loss). We use the straight-line method of depreciation.
Property and equipment consisted of the following asset classes with the following general range of estimated useful lives:
| |
December 31, 2011 |
December 31, 2012 |
General Range of Estimated Useful Lives in Years |
|||||
|---|---|---|---|---|---|---|---|---|
| |
(thousands) |
|
||||||
Land |
$ | 35,469 | $ | 35,662 | ||||
Buildings |
84,510 | 88,129 | 20 - 40 | |||||
Improvements |
32,645 | 34,526 | 10 - 15 | |||||
Office equipment and vehicles |
74,349 | 80,857 | 3 - 7 | |||||
Machinery and equipment |
253,933 | 264,084 | 7 - 12 | |||||
Construction in progress |
5,812 | 11,176 | ||||||
|
486,718 | 514,434 | ||||||
Less accumulated depreciation |
(220,262 | ) | (248,510 | ) | ||||
|
$ | 266,456 | $ | 265,924 | ||||
Long-Lived Asset Impairment
We review long-lived assets for impairment when events or changes in circumstances indicate that the carrying amount of assets may not be recoverable. An impairment of long-lived assets exists when the carrying value is not recoverable through future undiscounted cash flows from operations and when the carrying value of an asset or asset group exceeds its fair value.
During fiscal 2011, long-lived assets with a net carrying amount of $2.5 million were written down to their fair value of $0.5 million, resulting in an impairment charge of $2.0 million. These impairment charges were measured at fair value using Level 3 inputs, including discounted cash flows and appraisals.
12
Notes to Consolidated Financial Statements (Continued)
2. Summary of Significant Accounting Policies (Continued)
Goodwill and Intangible Assets
We maintain two reporting units for purposes of our goodwill impairment testing, Building Materials Distribution and Wood Products, which are the same as our operating segments discussed in Note 14, Segment Information. We test goodwill in each of our reporting units and intangible assets with indefinite lives for impairment annually in the fourth quarter or sooner if events or changes in circumstances indicate that the carrying value of the asset may exceed fair value.
We completed our annual assessment of goodwill in fourth quarter 2012 using a qualitative approach. The qualitative goodwill impairment assessment requires evaluating factors, based on the weight of evidence, to determine whether a reporting unit's carrying value would more likely than not exceed its fair value. As part of our goodwill qualitative testing process for each reporting unit, we evaluate various factors that are specific to the reporting unit as well as industry and macroeconomic factors in order to determine whether it is reasonably likely to have a material impact on the fair value of our reporting units. Examples of the factors that were considered include the results of the most recent quantitative impairment test, current and long-term forecasted financial results, changes in the discount rate between current and prior years, and operating strategy for each reporting unit. Based on the qualitative analysis performed in 2012, we concluded that there were no changes that were reasonably likely to cause the fair value of the reporting units to be less than the reporting units' carrying value and determined that there was no impairment of our goodwill. In the event we were to determine that a reporting unit's carrying value would more likely than not exceed its fair value, quantitative testing would be performed comparing carrying values to estimated fair values.
For our intangible asset impairment testing, we use a discounted cash flow approach, based on a relief from royalty method (Level 3 measurement). This method assumes that, through ownership of trademarks and trade names, we avoid royalty expenses associated with licensing, resulting in cost savings. An estimated royalty rate, determined as a percentage of the related net sales, is used to estimate the value of the intangible assets. Based on the impairment tests of our intangible assets with indefinite lives, we determined that the fair value of our intangible assets exceeds their carrying value.
See Note 8, Goodwill and Intangible Assets, for additional information.
Asset Retirement Obligations
We recognize our asset retirement obligations in the period in which they are incurred if sufficient information is available to reasonably estimate the fair value of the obligation. Fair value estimates are determined using Level 3 inputs in the fair value hierarchy. The fair values of our asset retirement obligations are measured using expected future cash outflows discounted using the company's credit-adjusted risk-free interest rate. When we record the liability, we capitalize the cost by increasing the carrying amount of the related long-lived asset. Over time, the liability is accreted to its settlement value, and the capitalized cost is depreciated over the useful life of the related asset. Upon settlement of the liability, we will recognize a gain or loss for any difference between the settlement amount and the liability recorded.
At December 31, 2011 and 2012, we had $0.2 million and $0.3 million, respectively, of asset retirement obligations recorded in "Other, Other long-term liabilities" on our Consolidated Balance Sheets. At December 31, 2012, these liabilities related primarily to landfill closure costs. The liabilities are based on the best estimate of current costs and are updated periodically to reflect current
13
Notes to Consolidated Financial Statements (Continued)
2. Summary of Significant Accounting Policies (Continued)
technology, laws and regulations, inflation, and other economic factors. We do not have any assets legally restricted for purposes of settling asset retirement obligations.
We have additional asset retirement obligations with indeterminate settlement dates. The fair value of these asset retirement obligations cannot be estimated due to the lack of sufficient information to estimate the settlement dates of the obligations. These asset retirement obligations include, for example, (i) removal and disposal of potentially hazardous materials on equipment and/or an operating facility if the equipment and/or facility were to undergo major maintenance, renovation, or demolition; (ii) retention ponds that may be required to be drained and/or cleaned if the related operating facility is closed; and (iii) storage sites or owned facilities for which removal and/or disposal of chemicals and other related materials are required if the operating facility is closed. We will recognize a liability in the period in which sufficient information becomes available to reasonably estimate the fair value of these obligations.
Pension and Other Postretirement Benefits
Several estimates and assumptions are required to record pension costs and liabilities, including discount rates, expected return on plan assets, expected rate of compensation increases, retirement and mortality rates, expected contributions, and other factors. We review and update these assumptions annually unless a plan curtailment or other event occurs requiring that we update the estimates on an interim basis. See Note 11, Retirement and Benefit Plans, for additional information related to our pension and other postretirement benefit plans. While we believe that the assumptions used to measure our pension and other postretirement obligations are reasonable, differences in actual experience or changes in assumptions may materially affect our pension and other postretirement obligations and future expense.
Deferred Software Costs
We defer internal-use software costs that benefit future years. These costs are amortized using the straight-line method over the expected life of the software, typically three to five years. "Other assets" in the Consolidated Balance Sheets includes $4.6 million and $3.7 million of deferred software costs at December 31, 2011 and 2012, respectively. For the years ended December 31, 2010, 2011, and 2012, amortization of deferred software costs was $0.8 million, $1.0 million, and $1.2 million, respectively.
Labor Concentration and Unions
As of December 31, 2012, we had approximately 4,560 employees. Approximately 30% of these employees work pursuant to collective bargaining agreements. As of December 31, 2012, we had ten collective bargaining agreements. Two agreements, covering 356 employees at our facility in Florien, Louisiana, and 273 employees at our facility in Oakdale, Louisiana, are set to expire on July 15, 2013. We expect these two agreements to be bargained together.
Self-Insurance
We are self-insured for certain losses related to workers' compensation and medical claims as well as general and auto liability. The expected ultimate costs for claims incurred are recognized as liabilities in the Consolidated Balance Sheets and are estimated based principally on an analysis of historical claims data and estimates of claims incurred but not reported. Losses are accrued and charged to operations when it is probable that a loss has been incurred and the amount can be
14
Notes to Consolidated Financial Statements (Continued)
2. Summary of Significant Accounting Policies (Continued)
reasonably estimated. We maintain third-party stop-loss insurance policies to cover these liability costs in excess of predetermined retained amounts. Costs related to the administration of the plans and related claims are expensed as incurred. At December 31, 2011 and 2012, self-insurance related liabilities of $7.6 million and $7.2 million were classified within "Accrued liabilities," and $9.7 million and $10.0 million were classified within "Other long-term liabilities" on our Consolidated Balance Sheets, respectively.
New and Recently Adopted Accounting Standards
In February 2013, the Financial Accounting Standards Board (FASB) issued Accounting Standards Update (ASU) 2013-02, Comprehensive Income (Topic 220): Reporting of Amounts Reclassified Out of Accumulated Other Comprehensive Income. This ASU requires entities to disclose additional information about changes in and significant items reclassified out of accumulated other comprehensive income. The guidance is effective for annual and interim reporting periods beginning after December 15, 2012. We do not believe the adoption of this update will have a material effect on our consolidated financial statements.
In July 2012, the FASB issued ASU 2012-02, Intangibles—Goodwill and Other (Topic 350): Testing Indefinite—Lived Intangible Assets for Impairment, which gives entities the option first to assess qualitative factors to determine whether the existence of events and circumstances indicates that it is more likely than not that the indefinite-lived intangible asset is impaired. If, after assessing the totality of events and circumstances, an entity concludes that it is not more likely than not that the indefinite-lived intangible asset is impaired, the entity is not required to take further action. However, if an entity concludes otherwise, then it is required to determine the fair value of the indefinite-lived intangible asset and perform the quantitative impairment test by comparing the fair value with the carrying amount. The amended guidance is effective for annual and interim impairment tests performed for fiscal years beginning after September 15, 2012, with early adoption permitted. We do not believe the adoption of this guidance will have a material impact on our consolidated financial statements.
In September 2011, the FASB issued ASU 2011-08, Intangibles—Goodwill and Other (Topic 350): Testing Goodwill for Impairment, which gives entities testing goodwill for impairment the option of performing a qualitative assessment before calculating the fair value of a reporting unit in step 1 of the goodwill impairment test. If entities determine, on the basis of qualitative factors, that the fair value of a reporting unit is more likely than not less than the carrying amount, the two-step impairment test would be required. Otherwise, further testing would not be needed. We adopted the provisions of this guidance January 1, 2012, and it had no effect on our financial position and results of operations. For additional information, see the Goodwill and Intangible Assets section of Note 2 above.
In June 2011, the FASB issued ASU 2011-05, Comprehensive Income (Topic 220): Presentation of Comprehensive Income, which amends current comprehensive income guidance. This accounting update eliminates the option to present the components of other comprehensive income as part of the statement of equity, among other amendments. Instead, the company must report comprehensive income in either a single continuous statement of comprehensive income which contains two sections, net income and other comprehensive income, or in two separate but consecutive statements. We adopted this guidance retrospectively as of January 1, 2012, by adding the Consolidated Statements of Comprehensive Income (Loss) to our consolidated financial statements.
15
Notes to Consolidated Financial Statements (Continued)
2. Summary of Significant Accounting Policies (Continued)
In May 2011, the FASB issued ASU 2011-04, Fair Value Measurement (Topic 820): Amendments to Achieve Common Fair Value Measurement and Disclosure Requirements in U.S. GAAP and International Financial Reporting Standards (IFRS). This ASU was issued to provide largely identical guidance about fair value measurement and disclosure requirements for entities that disclose the fair value of an asset, a liability, or an instrument classified in shareholders' equity in their consolidated financial statements as that provided in the International Accounting Standards Board's new IFRS 13, Fair Value Measurement. This ASU does not extend the use of fair value but, rather, provides guidance about how fair value should be applied where it already is required or permitted under GAAP. We adopted the provisions of ASU 2011-04 on January 1, 2012. The adoption of this guidance did not have a material effect on our financial statement disclosures.
There were no other accounting standards recently issued that had or are expected to have a material impact on our consolidated financial statements and associated disclosures.
Reclassifications
Certain amounts in prior years' consolidated financial statements have been reclassified to conform with the current year's presentation, none of which were considered material.
3. Outsourcing Services Agreement
Under an Outsourcing Services Agreement, Boise Inc. provides a number of corporate staff services to us at cost. These services include information technology, accounting, and human resource transactional services. The agreement, as extended, expires on February 22, 2015. The agreement automatically renews for successive one-year terms unless either party provides notice of termination to the other party at least 12 months in advance of the expiration date. The Outsourcing Services Agreement gives us (but not Boise Inc.) the right to terminate all or any portion of the services provided to us on 30 days' notice. Total expenses incurred under the Outsourcing Services Agreement, including both related party and nonrelated party, were $14.4 million, $14.7 million, and $15.0 million for the years ended December 31, 2010, 2011, and 2012, respectively. The majority of these expenses are recorded in "General and administrative expenses" in our Consolidated Statements of Operations or "General and administrative expenses from related party" for the period Boise Inc. was a related party. See Note 4, Transactions With Related Parties, for more information.
4. Transactions With Related Parties
In early March 2010, BC Holdings sold its remaining investment in Boise Inc., and because of the disposition, Boise Inc. is no longer a related party. The 2010 related-party activity with Boise Inc. in the consolidated financial statements includes only those sales and costs and expenses transacted prior to March 2010, when Boise Inc. was a related party. As a result, beginning in March 2010, transactions with Louisiana Timber Procurement Company, L.L.C. (LTP) represent the only remaining significant related-party activity recorded in our consolidated financial statements. LTP is an unconsolidated variable-interest entity that is 50% owned by us and 50% owned by Boise Inc. LTP procures sawtimber, pulpwood, residual chips, and other residual wood fiber to meet the wood and fiber requirements of Boise Inc. and Boise Cascade in Louisiana. We are not the primary beneficiary of LTP, as we do not have power to direct the activities that most significantly affect the economic performance of LTP. Accordingly, we do not consolidate LTP's results in our financial statements.
16
Notes to Consolidated Financial Statements (Continued)
4. Transactions With Related Parties (Continued)
Sales
Related-party sales to LTP from our Wood Products segment in our Consolidated Statements of Operations were $20.4 million, $18.8 million, and $19.8 million during the years ended December 31, 2010, 2011, and 2012 respectively. We also recorded $4.9 million of related-party sales to Boise Inc. (for the period they were a related party) during the year ended December 31, 2010. These pulpwood and chip sales were made at prices designed to approximate market.
Costs and Expenses
Related-party fiber purchases from LTP were $33.0 million, $40.1 million, and $60.3 million during the years ended December 31, 2010, 2011, and 2012, respectively. During the year ended December 31, 2010, we also recorded $0.3 million of related-party expenses for transportation services from Boise Inc. (for the period they were a related party). We purchased the fiber and transportation services at prices designed to approximate market. These costs are recorded in "Materials, labor, and other operating expenses from related parties (excluding depreciation)" in our Consolidated Statements of Operations.
During the year ended December 31, 2010, we recorded the following expenses from the Outsourcing Services Agreement as related-party expenses in our Consolidated Statements of Operations. As mentioned above, after we sold our remaining investment in Boise Inc. in March 2010, expenses incurred under the Outsourcing Services Agreement were no longer related-party and are not included in the table below.
| |
Year Ended December 31, 2010 |
|||
|---|---|---|---|---|
| |
(thousands) |
|||
Materials, labor, and other operating expenses from related parties (excluding depreciation) |
$ | 332 | ||
Selling and distribution expenses |
456 | |||
General and administrative expenses from related party |
1,576 | |||
|
$ | 2,364 | ||
5. Other (Income) Expense
Other (income) expense includes miscellaneous income and expense items. The components of "Other (income) expense, net" in the Consolidated Statements of Operations are as follows:
| |
Year Ended December 31 | |||||||||
|---|---|---|---|---|---|---|---|---|---|---|
| |
2010 | 2011 | 2012 | |||||||
| |
(thousands) |
|||||||||
Facility closure and curtailments(a) |
$ | — | $ | 1,292 | $ | — | ||||
Litigation settlement(b) |
(4,613 | ) | — | — | ||||||
Other, net(c) |
(11 | ) | 1,903 | 902 | ||||||
|
$ | (4,624 | ) | $ | 3,195 | $ | 902 | |||
- (a)
- In 2011, we permanently closed a laminated beam manufacturing plant in Emmett, Idaho.
17
Notes to Consolidated Financial Statements (Continued)
5. Other (Income) Expense (Continued)
- (b)
- In
2010, we recorded $4.6 million of income for cash received from a litigation settlement related to vendor product pricing.
- (c)
- In 2011, we recorded noncash asset write-downs of $2.0 million.
6. Leases
Rental expense for operating leases was $14.2 million, $14.5 million, and $14.3 million for the years ended December 31, 2010, 2011, and 2012, respectively. Sublease rental income was not material in any of the periods presented.
As of December 31, 2012, our minimum lease payment requirements for noncancelable operating leases with remaining terms of more than one year are as follows (in thousands):
2013 |
$ | 12,346 | ||
2014 |
11,613 | |||
2015 |
10,919 | |||
2016 |
9,061 | |||
2017 |
8,520 | |||
Thereafter |
36,723 | |||
Total |
$ | 89,182 | ||
These future minimum lease payment requirements have not been reduced by sublease rentals due in the future under noncancelable subleases. Minimum sublease income expected to be received in the future is not material.
7. Income Taxes
Income Tax Provision
On February 4, 2013, we converted from a limited liability company to a corporation. In addition, we filed an entity classification election with the Internal Revenue Service to elect to be treated as a corporation for federal and state income tax purposes effective as of January 1, 2013. As a result of our conversion to a corporation, we expect to record deferred tax assets, net of deferred tax liabilities, on our consolidated balance sheet, the effect of which will be recorded as an income tax benefit in the Consolidated Statement of Operations. As a limited liability company, we were not subject to entity-level federal or state income taxation. Our income tax provision generally consisted of income taxes payable to state jurisdictions that do not allow for the income tax liability to be passed through to our equityholder as well as income taxes payable by our separate subsidiaries that are taxed as corporations. As a limited liability company, we had an effective tax rate of less than 1%. For the years ended December 31, 2010, 2011, and 2012, income tax expense was $0.3 million, $0.2 million, and $0.3 million, respectively. As a corporation, we are subject to typical corporate U.S. federal and state income tax rates, which we expect to result in a statutory tax rate of approximately 38% under current tax law.
At December 31, 2011 and 2012, our tax basis was $167.5 million and $182.3 million, respectively, higher than the reported amount of net assets recorded on our Consolidated Balance Sheets. In 2011 and 2012, the difference related primarily to changes in pension obligations.
Boise Cascade Wood Products Holdings Corp., a wholly owned, fully consolidated operating entity, has an investment in foreign subsidiaries. At December 31, 2011 and 2012, the foreign subsidiaries had
18
Notes to Consolidated Financial Statements (Continued)
7. Income Taxes (Continued)
$13.6 million and $15.4 million, respectively, of deferred tax assets. The deferred tax assets resulted primarily from net operating losses and were fully offset by a valuation allowance. In addition, at both December 31, 2011 and 2012, Boise Cascade Wood Products Holdings Corp. had $16.0 million of capital loss carryforward from the sale of our subsidiaries in Brazil and the United Kingdom. The capital loss carryforward was fully offset by a valuation allowance, because it is more likely than not that we will not be able to utilize the capital loss carryforward before it expires in 2013.
In 2010, 2011, and 2012, we paid $0.2 million, $0.3 million, and $0.2 million, respectively, of income taxes, net of other refunds received.
Income Tax Uncertainties
Boise Cascade, or one of its subsidiaries, files federal income tax returns in the U.S. and Canada and various state and foreign income tax returns in the major state jurisdictions of Alabama, California, Idaho, Oregon, Texas, and Washington.
We recognize tax liabilities and adjust these liabilities when our judgment changes as a result of the evaluation of new information not previously available or as new uncertainties occur. As of December 31, 2011 and 2012, we have no unrecognized tax benefits recorded on our Consolidated Balance Sheets, and we do not expect a significant change to the amount of unrecognized tax benefits over the next 12 months.
For the years ended December 31, 2010, 2011, and 2012, we recognized an insignificant amount of interest and penalties related to taxes.
8. Goodwill and Intangible Assets
Goodwill represents the excess of the purchase price and related costs over the value assigned to the net tangible and intangible assets of businesses acquired. The carrying amount of our goodwill by segment is as follows:
| |
Building Materials Distribution |
Wood Products |
Corporate and Other |
Total | |||||||||
|---|---|---|---|---|---|---|---|---|---|---|---|---|---|
| |
(thousands) |
||||||||||||
Balance at December 31, 2011 and 2012 |
$ | 5,593 | $ | 6,577 | $ | — | $ | 12,170 | |||||
At December 31, 2011 and 2012, intangible assets represent the values assigned to trade names and trademarks, which have indefinite lives and are not amortized. The carrying amount of our trade names and trademarks was $8.9 million at both December 31, 2011 and 2012.
19
Notes to Consolidated Financial Statements (Continued)
9. Debt
Long-term debt consisted of the following:
| |
December 31, 2011 |
December 31, 2012 |
|||||
|---|---|---|---|---|---|---|---|
| |
(thousands) |
||||||
Asset-based revolving credit facility |
$ | — | $ | 25,000 | |||
6.375% senior notes |
— | 250,000 | |||||
7.125% senior subordinated notes |
219,560 | — | |||||
Long-term debt |
$ | 219,560 | $ | 275,000 | |||
Asset-Based Revolving Credit Facility
On July 13, 2011, Boise Cascade and its principal operating subsidiaries, Boise Cascade Wood Products, L.L.C., and Boise Cascade Building Materials Distribution, L.L.C., as borrowers, and Boise Cascade Wood Products Holdings Corp., as guarantor, entered into a $250 million senior secured asset-based revolving credit facility (Revolving Credit Facility) with Wells Fargo Capital Finance, L.L.C., as agent, and the banks named therein as lenders. Borrowings under the Revolving Credit Facility are constrained by a borrowing base formula dependent upon levels of eligible receivables and inventory reduced by outstanding borrowings and letters of credit (Availability). On September 7, 2012, we entered into a First Amendment to Credit Agreement, which increased the aggregate lending commitments under the Revolving Credit Facility to $300 million. Other key terms of the Credit Agreement were unchanged by the Amendment. On December 20, 2012, we entered into a Limited Consent and Amendment to Loan Documents with the lenders under our revolving credit facility. The consent and amendment provided consent to, among other things, the distributions of $225.0 million in aggregate to BC Holdings made in late December 2012 and our conversion to a corporation effected on February 4, 2013.
The Revolving Credit Facility has a maturity date of July 13, 2016, and is secured by a first-priority security interest in substantially all of our assets, except for property and equipment. The proceeds of borrowings under the agreement are available for working capital and other general corporate purposes.
Interest rates under the Revolving Credit Facility are based, at the company's election, on either the London Interbank Offered Rate (LIBOR) or a base rate, as defined in the agreement, plus a spread over the index elected that ranges from 1.75% to 2.25% for loans based on LIBOR and from 0.75% to 1.25% for loans based on the base rate. The spread is determined on the basis of a pricing grid that results in a higher spread as average quarterly Availability declines. Letters of credit are subject to a fronting fee payable to the issuing bank and a fee payable to the lenders equal to the LIBOR margin rate. In addition, we are required to pay an unused commitment fee at a rate ranging from 0.375% to 0.50% per annum (based on facility utilization) of the average unused portion of the lending commitments.
The Revolving Credit Facility contains customary nonfinancial covenants, including a negative pledge covenant and restrictions on new indebtedness, investments, distributions to equityholders, asset sales, and affiliate transactions, the scope of which are dependent on the Availability existing from time to time. The Revolving Credit Facility also contains a requirement that we meet a 1:1 fixed-charge coverage ratio (FCCR) if Availability falls below the greater of $31.25 million or 12.5% of the aggregate lending commitments. Availability exceeded the minimum threshold amounts required for
20
Notes to Consolidated Financial Statements (Continued)
9. Debt (Continued)
testing of the FCCR at all times since entering into the Revolving Credit Facility, and Availability at December 31, 2012, was $195.6 million.
The Revolving Credit Facility generally permits dividends only if certain conditions are met, including complying with the minimum Availability requirements and having a fixed-charge coverage ratio of 1:1 on a pro forma basis.
At December 31, 2011, we had no borrowings outstanding under the Revolving Credit Facility. On October 12, 2012, we borrowed $50.0 million under the Revolving Credit Facility to partially fund the redemption of $75.0 million of our senior subordinated notes, as discussed further below. On December 20, 2012, we repaid $25.0 million, resulting in $25.0 million outstanding under the Revolving Credit Facility at December 31, 2012. The minimum and maximum borrowings under the Revolving Credit Facility were zero and $50.0 million, respectively, during the year ended December 31, 2012. At December 31, 2011 and 2012, we had approximately $11.3 million and $10.0 million, respectively, of letters of credit outstanding. These letters of credit and borrowings reduced our borrowing capacity under the Revolving Credit Facility by an equivalent amount.
Senior Subordinated Notes
In October 2004, Boise Cascade issued $400 million of 7.125% senior subordinated notes due in 2014. In July 2005, we completed an exchange offer whereby all of our senior subordinated notes were exchanged for registered securities with identical terms (other than terms relating to registration rights) to the notes issued in October 2004. We could redeem all or part of the senior subordinated notes at any time at redemption prices set forth in the indenture governing such notes. Redemption prices reduced to par value in October 2012. Subsequent to the exchange offer, we purchased a portion of the senior subordinated notes, resulting in $219.6 million of notes outstanding at December 31, 2011. On October 15, 2012, we redeemed $75.0 million of the senior subordinated notes at par value with $25.0 million of cash on hand and $50.0 million borrowed under our Revolving Credit Facility. Net proceeds from our senior notes offering (as discussed below in "Debt Refinancing") were used to redeem $144.6 million of the senior subordinated notes, plus $1.0 million of interest through the related redemption date of November 21, 2012.
Debt Refinancing
On October 22, 2012, Boise Cascade, L.L.C. (as the predecessor to Boise Cascade Company) and its wholly owned subsidiary, Boise Cascade Finance Corporation ("Boise Finance" and together with Boise Cascade, L.L.C., the "Co-issuers"), issued $250 million of 6.375% senior notes due November 1, 2020 (Senior Notes) through a private placement that is exempt from the registration requirements of the Securities Act of 1933, as amended (Securities Act). Interest on our Senior Notes is payable semiannually in arrears on May 1 and November 1, commencing on May 1, 2013. As a result of this refinancing, we extended the maturity of our debt and lowered our interest rate. The Senior Notes are guaranteed by each of our existing and future direct or indirect domestic subsidiaries that is a guarantor or co-borrower under our Revolving Credit Facility, other than Boise Finance.
Following the sale of our Senior Notes, as noted above, we used a portion of the net proceeds of the sale to repay the senior subordinated notes at par plus interest through the redemption date. The remaining proceeds are available for general corporate purposes.
21
Notes to Consolidated Financial Statements (Continued)
9. Debt (Continued)
In connection with the issuance of the Senior Notes, the Co-issuers entered into a registration rights agreement, dated as of October 22, 2012 (Senior Notes Registration Rights Agreement). The Senior Notes Registration Rights Agreement requires us to register under the Securities Act the Senior Notes having substantially identical terms to those of the Senior Notes (Exchange Notes) and to complete an exchange of the privately placed Senior Notes for the publicly registered Exchange Notes on or prior to October 21, 2013, or in certain circumstances, to file and keep effective a shelf registration statement for resale of the Senior Notes. If we fail to satisfy these obligations, we will pay additional interest up to 0.25% per annum to holders of the Senior Notes for the first 90-day period immediately following such date and an additional 0.25% per annum with respect to each subsequent 90-day period, up to a maximum rate of 1.0% per annum.
The Senior Notes are senior unsecured obligations and rank equally with all of the Co-issuers' and guarantors' existing and future senior indebtedness, senior to all of their existing and future subordinated indebtedness, effectively subordinated to all of their present and future senior secured indebtedness (including all borrowings with respect to our Revolving Credit Facility to the extent of the value of the assets securing such indebtedness), and structurally subordinated to the indebtedness of any subsidiaries that do not guarantee the Senior Notes.
The terms of the indenture governing the Senior Notes, among other things, limit the ability of the Co-issuers and certain Boise Cascade subsidiaries to: incur additional debt; declare or pay dividends; redeem stock or make other distributions to stockholders; make investments; create liens on assets; consolidate, merge, or transfer substantially all of their assets; enter into transactions with affiliates; and sell or transfer certain assets.
The indenture governing the Senior Notes provides for customary events of default, which include (subject in certain cases to customary grace and cure periods and notification requirements), among others: nonpayment of principal or interest; breach of other agreements in the indenture governing the Senior Notes; defaults in failure to pay certain other indebtedness; the rendering of judgments to pay certain amounts of money against the Co-issuers, the guarantors, or certain Boise Cascade subsidiaries; the failure of certain guarantees to be enforceable; and certain events of bankruptcy or insolvency.
Cash Paid for Interest
For the years ended December 31, 2010, 2011, and 2012, cash payments for interest were $18.6 million, $16.7 million, and $18.1 million, respectively.
10. Financial Instrument Risk
In the normal course of business, we are exposed to financial risks such as changes in interest rates, foreign currency exchange rates, and commodity price risk. In 2010, 2011, and 2012, we did not use derivative instruments.
Interest Rate Risk
When we have loan amounts outstanding on our Revolving Credit Facility, we are exposed to interest rate risk arising from fluctuations in interest rates. In 2010, 2011, and 2012, we did not use any interest rate swap contracts to manage this risk.
22
Notes to Consolidated Financial Statements (Continued)
10. Financial Instrument Risk (Continued)
Foreign Currency Risk
We have sales in countries outside the United States. As a result, we are exposed to movements in foreign currency exchange rates, primarily in Canada, but we do not believe our exposure to currency fluctuations is significant. In 2010, 2011, and 2012, we did not use any foreign currency hedges to manage this risk.
Commodity Price Risk
Many of the products we manufacture or purchase and resell and some of our key production inputs are commodities whose price is determined by the market's supply and demand for such products. Price fluctuations in our selling prices and key costs have a significant effect on our financial performance. The markets for most of these commodities are cyclical and are affected by factors such as global economic conditions, including the strength of the U.S. housing market, changes in or disruptions to industry production capacity, changes in inventory levels, and other factors beyond our control. In 2010, 2011, and 2012, we did not manage commodity price risk with derivative instruments.
11. Retirement and Benefit Plans
Our retirement plans consist of noncontributory defined benefit pension plans, including supplemental nonqualified pension plans for certain salaried employees, contributory defined contribution savings plans, a deferred compensation plan, and postretirement benefit plans.
Defined Benefit Plans
Some of our employees are covered by noncontributory defined benefit pension plans. Our defined benefit plan for salaried employees (Salaried Plan) and our nonqualified salaried pension plans were frozen so that no future benefits have accrued since December 31, 2009.
In September 2012, we amended Plan A (Plan A), one of our defined benefit pension plans. The amendment affected certain union hourly employees of Plan A by closing participation and freezing future benefits to that group after December 31, 2012. The benefit for hourly employees is generally based on a fixed amount per year of service (years of service determined as of December 31, 2012). In connection with this amendment, we recognized a $0.3 million noncash curtailment loss during the year ended December 31, 2012. As a result, only certain hourly employees in Plan A continue to accrue benefits after December 31, 2012.
On November 9, 2011, we amended our defined benefit pension plan for hourly employees of Plan B (Plan B) to freeze Plan B so that no future benefits accrue after December 31, 2011. The benefit for hourly employees is generally based on a fixed amount per year of service (years of service for Plan B participants determined as of December 31, 2011). In connection with this amendment, we recognized a $0.1 million noncash curtailment loss during the year ended December 31, 2011. Also, in connection with the Plan B amendment, Plan B was merged into the Salaried Plan to simplify administration of the plans, effective January 1, 2012.
Defined Contribution Plans
We sponsor contributory defined contribution savings plans for most of our salaried and hourly employees, and we generally provide company contributions to the savings plans. Due to poor business conditions, we suspended the company match for salaried employees for the period of April 1, 2009,
23
Notes to Consolidated Financial Statements (Continued)
11. Retirement and Benefit Plans (Continued)
through February 28, 2010. Since March 1, 2010, we have contributed 4% of each salaried participant's eligible compensation to the plan as a nondiscretionary company contribution. In addition, for the years that a performance target is met, we will contribute an additional amount that will range from 2% to 4% of the employee's eligible compensation, depending on the employee's years of service. Further, the plan allows for an additional discretionary contribution of 1% for achieving a second, higher performance target. Each of these performance targets were met during the year ended December 31, 2012. The company contributions for hourly employees vary by location. Company contributions paid, or to be paid, to our defined contribution savings plans for the years ended December 31, 2010, 2011, and 2012, were $6.7 million, $7.7 million, and $14.3 million, respectively.
Deferred Compensation Plan
We sponsor a deferred compensation plan. In 2008, Congress passed tax legislation that required participants in our deferred compensation plan to recognize income (and therefore be taxed) on their deferrals of income earned in 2009 and beyond and earnings thereon. Deferrals, company match, and interest on contributions made to the plan on or before December 31, 2008, were not affected by the changes. As long as contributions to the plan are taxable under the new legislation, there will be no future contributions to the deferred compensation plan, but participant account balances remaining after the distributions will continue to accrue earnings in accordance with the terms of the plan.
The deferred compensation plan is unfunded; therefore, benefits are paid from our general assets. For the years ended December 31, 2010, 2011, and 2012, we recognized $0.8 million, $0.7 million, and $0.6 million, respectively, of interest expense related to the plan. At December 31, 2011 and 2012, we had $11.4 million and $10.9 million, respectively, of liabilities related to the plan, of which $1.0 million and $1.1 million, respectively, were recorded in "Accrued liabilities, Compensation and benefits" and $10.4 million and $9.8 million, respectively, were recorded in "Other, Compensation and benefits" on our Consolidated Balance Sheets.
Postretirement Benefit Plans
Certain executives participate in our Supplemental Life Plan, which provides them with an insured death benefit during their employment with us. The plan provides the officer with a target death benefit equal to two times his or her base salary while employed and a target postretirement death benefit equal to one times his or her final base salary, in each case less any amount payable under our group term life insurance policy. At both December 31, 2011 and 2012, our benefit obligation related to the Supplemental Life Plan was $0.1 million.
We participate in a multiemployer health and welfare plan that covers medical, dental, and life insurance benefits for certain active employees as well as benefits for retired employees. As of December 31, 2012, approximately 610 of our employees participated in this plan. Per the terms of the representative collective bargaining agreements, we were required to contribute $5.50 per hour per active employee through June 1, 2012. Since June 1, 2012, we are required to contribute $5.00 per hour per active employee. Company contributions to the multiemployer health and welfare plan for the years ended December 31, 2010, 2011, and 2012, were $6.8 million, $6.9 million, and $6.7 million, respectively. After required contributions, we have no further obligation to the plan. The trustees of the plan determine the allocation of benefits between active and retired employees.
24
Notes to Consolidated Financial Statements (Continued)
11. Retirement and Benefit Plans (Continued)
Defined Benefit Obligations and Funded Status
The following table, which includes only company-sponsored defined benefit plans, reconciles the beginning and ending balances of our projected benefit obligation and fair value of plan assets. We recognize the underfunded status of our defined pension plans on our Consolidated Balance Sheets. We recognize changes in funded status in the year changes occur through other comprehensive income (loss).
| |
December 31 | ||||||
|---|---|---|---|---|---|---|---|
| |
2011 | 2012 | |||||
| |
(thousands) |
||||||
Change in benefit obligation |
|||||||
Benefit obligation at beginning of year |
$ | 391,485 | $ | 470,104 | |||
Service cost |
5,112 | 4,762 | |||||
Interest cost |
20,484 | 19,234 | |||||
Actuarial loss(a) |
67,121 | 26,686 | |||||
Special termination benefits |
503 | — | |||||
Closure and curtailments |
224 | — | |||||
Benefits paid |
(14,825 | ) | (16,102 | ) | |||
Benefit obligation at end of year |
470,104 | 504,684 | |||||
Change in plan assets |
|||||||
Fair value of plan assets at beginning of year |
281,972 | 282,195 | |||||
Actual return on plan assets |
1,427 | 37,645 | |||||
Employer contributions |
13,621 | 8,486 | |||||
Benefits paid |
(14,825 | ) | (16,102 | ) | |||
Fair value of plan assets at end of year |
282,195 | 312,224 | |||||
Underfunded status |
$ | (187,909 | ) | $ | (192,460 | ) | |
Amounts recognized on our Consolidated Balance Sheets |
|||||||
Current liabilities |
$ | (759 | ) | $ | (1,271 | ) | |
Noncurrent liabilities |
(187,150 | ) | (191,189 | ) | |||
Net liability |
$ | (187,909 | ) | $ | (192,460 | ) | |
Amounts recognized in accumulated other comprehensive loss |
|||||||
Net actuarial loss |
$ | 120,125 | $ | 120,925 | |||
Prior service cost |
720 | 304 | |||||
Net loss recognized |
$ | 120,845 | $ | 121,229 | |||
- (a)
- The actuarial losses were primarily due to decreases in discount rate assumptions.
The accumulated benefit obligation for all defined benefit pension plans was $470.1 million and $504.7 million at December 31, 2011 and 2012, respectively. All of our defined benefit pension plans have accumulated benefit obligations that exceed the fair value of plan assets.
25
Notes to Consolidated Financial Statements (Continued)
11. Retirement and Benefit Plans (Continued)
Net Periodic Benefit Cost and Other Comprehensive (Income) Loss
The components of net periodic benefit cost and other amounts recognized in other comprehensive (income) loss are as follows:
| |
Year Ended December 31 | |||||||||
|---|---|---|---|---|---|---|---|---|---|---|
| |
2010 | 2011 | 2012 | |||||||
| |
(thousands) |
|||||||||
Service cost |
$ | 4,931 | $ | 5,112 | $ | 4,762 | ||||
Interest cost |
20,258 | 20,484 | 19,234 | |||||||
Expected return on plan assets |
(18,474 | ) | (17,910 | ) | (19,390 | ) | ||||
Amortization of actuarial loss |
556 | 2,703 | 7,632 | |||||||
Amortization of prior service costs and other |
178 | 175 | 165 | |||||||
Plan settlement/curtailment expense |
— | 804 | 250 | |||||||
Net periodic benefit cost |
7,449 | 11,368 | 12,653 | |||||||
Changes in plan assets and benefit obligations recognized in other comprehensive (income) loss |
||||||||||
Net actuarial loss |
4,048 | 83,528 | 8,432 | |||||||
Amortization of actuarial loss |
(556 | ) | (2,703 | ) | (7,632 | ) | ||||
Amortization of prior service costs and other |
(178 | ) | (175 | ) | (416 | ) | ||||
Total recognized in other comprehensive loss |
3,314 | 80,650 | 384 | |||||||
Total recognized in net periodic cost and other comprehensive loss |
$ | 10,763 | $ | 92,018 | $ | 13,037 | ||||
In 2013, we estimate net periodic pension expense will be approximately $11 million, including $9.0 million of net actuarial loss and $0.1 million of prior service cost that will be amortized from accumulated other comprehensive loss.
Assumptions
The assumptions used in accounting for our plans are estimates of factors that will determine, among other things, the amount and timing of future contributions. The following table presents the assumptions used in the measurement of our benefit obligations:
| |
December 31 | ||||||
|---|---|---|---|---|---|---|---|
| |
2011 | 2012 | |||||
Weighted average assumptions |
|||||||
Discount rate |
4.20 | % | 3.75 | % | |||
Rate of compensation increases(a) |
— | % | — | % | |||
26
Notes to Consolidated Financial Statements (Continued)
11. Retirement and Benefit Plans (Continued)
The following table presents the assumptions used in the measurement of net periodic benefit cost:
| |
December 31 | |||||||||
|---|---|---|---|---|---|---|---|---|---|---|
| |
2010 | 2011 | 2012 | |||||||
Weighted average assumptions |
||||||||||
Discount rate |
5.90 | % | 5.35 | % | 4.20 | % | ||||
Expected long-term rate of return on plan assets |
7.25 | % | 7.00 | % | 6.75 | % | ||||
Rate of compensation increases(a) |
— | % | — | % | — | % | ||||
- (a)
- In connection with amending the salaried and nonqualified plans on March 18, 2009, to freeze pension benefits effective December 31, 2009, we changed the assumption for the rate of compensation increase to zero. In addition to the salaried benefits being frozen, there are currently no scheduled increases in pension benefit rates applicable to past service in the active plan covering our hourly employees.
Discount Rate Assumption. The discount rate reflects the current rate at which the pension obligations could be settled based on the measurement date of the plans—December 31. In all years presented, the discount rates were determined by matching the expected plan benefit payments against a spot rate yield curve constructed to replicate the yields of Aa-graded corporate bonds.
Asset Return Assumption. We base our expected long-term rate of return on plan assets on a weighted average of our expected returns for the major asset classes (equities, fixed-income securities, a hedge fund, and real estate) in which we invest. The weights we assign each asset class are based on our investment strategy. Expected returns for the asset classes are based on long-term historical returns, inflation expectations, forecasted gross domestic product, earnings growth, and other economic factors. We developed our return assumption based on a review of the fund manager's estimates of future market expectations by broad asset class, actuarial projections, and expected long-term rates of return from external investment managers. The weighted average expected return on plan assets we will use in our calculation of 2013 net periodic benefit cost is 6.50%.
Investment Policies and Strategies
At December 31, 2012, 61% of our pension plan assets were invested in equity securities, 30% in fixed-income securities, 4% in a hedge fund, and 5% in real estate. The general investment objective for all of our plan assets is to optimize growth of the pension plan trust assets, while minimizing the risk of significant losses in order to enable the plans to satisfy their benefit payment obligations over time. The objectives take into account the long-term nature of the benefit obligations, the liquidity needs of the plans, and the expected risk/return trade-offs of the asset classes in which the plans may choose to invest. The Retirement Funds Investment Committee is responsible for establishing and overseeing the implementation of our investment policy. Russell Investments (Russell) oversees the active management of our pension investments through its manager of managers program in order to achieve broad diversification in a cost-effective manner. At December 31, 2012, our investment policy governing our relationship with Russell allocated 34% to large-capitalization U.S. equity securities, 6% to small- and mid-capitalization U.S. equity securities, 20% to international equity securities, 30% to fixed-income securities, 5% to a hedge fund, and 5% to real estate. Our arrangement with Russell allows monthly rebalancing to the policy targets noted above.
27
Notes to Consolidated Financial Statements (Continued)
11. Retirement and Benefit Plans (Continued)
Investment securities, in general, are exposed to various risks, such as interest rate, credit, and overall market volatility risk, all of which are subject to change. In addition, our overall investment strategy and related allocations between equity and fixed-income securities may change from time to time based on market conditions, external economic factors, and the funded status of our plans. Due to the level of risk associated with certain investment securities, it is reasonably possible that changes in the values of investment securities will occur in the near term, and such changes could materially affect the reported amounts.
Fair Value Measurements of Plan Assets
The defined benefit plans hold an interest in the Boise Cascade, L.L.C., Master Trust (Master Trust). The assets in the Master Trust are invested in common and collective trusts that hold several mutual funds invested in U.S. equities, international equities, fixed-income securities, and real estate as well as a hedge fund.
The following table sets forth by level, within the fair value hierarchy, the pension plan assets, by major asset category, at fair value at December 31, 2011 and 2012:
| |
December 31, 2011 | ||||||||||||
|---|---|---|---|---|---|---|---|---|---|---|---|---|---|
| |
Quoted Prices in Active Markets for Identical Assets (Level 1) |
Significant Other Observable Inputs (Level 2)(a) |
Significant Unobservable Inputs (Level 3) |
Total | |||||||||
| |
(thousands) |
||||||||||||
Equity securities |
|||||||||||||
Large-cap U.S. equity securities(b) |
$ | — | $ | 97,533 | $ | — | $ | 97,533 | |||||
Small- and mid-cap U.S. equity securities(c) |
— | 17,302 | — | 17,302 | |||||||||
International equity securities(d) |
— | 56,578 | — | 56,578 | |||||||||
Fixed-income securities(e) |
— | 83,899 | 83,899 | ||||||||||
Hedge fund(f) |
— | 13,066 | — | 13,066 | |||||||||
Real estate(g) |
— | — | 13,000 | 13,000 | |||||||||
Total investments at fair value |
$ | — | $ | 268,378 | $ | 13,000 | 281,378 | ||||||
Receivables and accrued expenses, net |
817 | ||||||||||||
Fair value of plan assets |
$ | 282,195 | |||||||||||
28
Notes to Consolidated Financial Statements (Continued)
11. Retirement and Benefit Plans (Continued)
| |
December 31, 2012 | ||||||||||||
|---|---|---|---|---|---|---|---|---|---|---|---|---|---|
| |
Quoted Prices in Active Markets for Identical Assets (Level 1) |
Significant Other Observable Inputs (Level 2)(a) |
Significant Unobservable Inputs (Level 3) |
Total | |||||||||
| |
(thousands) |
||||||||||||
Equity securities |
|||||||||||||
Large-cap U.S. equity securities(b) |
$ | — | $ | 107,902 | $ | — | $ | 107,902 | |||||
Small- and mid-cap U.S. equity securities(c) |
— | 17,757 | — | 17,757 | |||||||||
International equity securities(d) |
— | 66,075 | — | 66,075 | |||||||||
Fixed-income securities(e) |
— | 91,836 | 91,836 | ||||||||||
Hedge fund(f) |
— | 13,424 | — | 13,424 | |||||||||
Real estate(g) |
— | — | 14,310 | 14,310 | |||||||||
Total investments at fair value |
$ | — | $ | 296,994 | $ | 14,310 | 311,304 | ||||||
Receivables and accrued expenses, net |
920 | ||||||||||||
Fair value of plan assets |
$ | 312,224 | |||||||||||
- (a)
- Equity
and fixed-income securities represent mutual funds managed by Russell Trust Company. The funds are valued at the net asset value (NAV) provided by
Russell Trust Company, the administrator of the funds. The NAV is a practical expedient for fair value and is based on the value of the assets owned by the fund, less liabilities at
year-end. While the underlying assets are actively traded on an exchange, the funds are not. We have the ability to redeem these equity and fixed-income securities with a
one-day notice.
- (b)
- Invested
in the Russell Equity I Fund. The fund seeks returns that exceed the Russell 1000 Index by investing in large-capitalization stocks of the U.S.
stock market.
- (c)
- Invested
in the Russell Equity II Fund. The fund seeks returns that exceed the Russell 2500 Index by investing in the small- and
mid-capitalization stocks of the U.S. stock market.
- (d)
- Invested
in the Russell International Fund with Active Currency at December 31, 2011 and 2012, which benchmarks against the Russell Developed
ex-U.S. Large Cap Index Net and seeks favorable total returns and additional diversification through investment in non-U.S. equity securities and active currency management.
The fund participates primarily in the stock markets of Europe and the Pacific Rim and seeks to opportunistically add value through active investment in foreign currencies. In addition, at
December 31, 2012, our investments in this category included the Russell Emerging Market Fund, which benchmarks against the Russell Emerging Markets Index and is designed to maintain a broadly
diversified exposure to emerging market countries.
- (e)
- Invested
in the Russell Multi-Manager Bond Fund. The fund seeks to outperform the Barclays Capital U.S. Aggregate Bond Index over a full market cycle. The
fund is designed to provide current income and, as a secondary objective, capital appreciation through a variety of diversified strategies, including sector rotation, modest interest rate timing,
security selection, and tactical use of high-yield and emerging market bonds.
- (f)
- The fund seeks to produce high risk-adjusted returns while targeting a low long-term average correlation to traditional markets. The fund invests internationally in a broad range of instruments, including, but not limited to, equities, currencies, convertible securities, futures, forwards, options,
29
Notes to Consolidated Financial Statements (Continued)
11. Retirement and Benefit Plans (Continued)
swaps, and other derivative products. The fair value of the hedge fund is estimated using the NAV of the investments as a practical expedient for fair value. We have the ability to redeem these investments at NAV within the near term, and they are thus classified within Level 2.
- (g)
- Invested in the Russell Real Estate Equity Fund. Real estate investments include those in limited partnerships that invest in various domestic commercial and residential real estate projects. The fair values of real estate assets are typically determined by using income and/or cost approaches or a comparable sales approach, taking into consideration discount and capitalization rates, financial conditions, local market conditions, and the status of the capital markets, and they are thus classified within Level 3. Notwithstanding the above, the variety of valuation bases adopted and quality of management data of the underlying assets means that there are inherent difficulties in determining the value of the investments. Amounts realized on the sale of these investments may differ from the calculated values. We have the ability to redeem the real estate investments with a 110-calendar-day written notice prior to a quarterly trade date.
The following table sets forth a summary of changes in the fair value of the pension plans' Level 3 assets for the years ended December 31, 2011 and 2012:
| |
December 31 | ||||||
|---|---|---|---|---|---|---|---|
| |
2011 | 2012 | |||||
| |
(thousands) |
||||||
Balance, beginning of year |
$ | — | $ | 13,000 | |||
Purchases |
13,000 | — | |||||
Unrealized gain |
— | 1,310 | |||||
Balance, end of year |
$ | 13,000 | $ | 14,310 | |||
Cash Flows
On July 13, 2012, we contributed company-owned real property with a carrying value of $6.2 million to the pension plans from two locations in our Building Materials Distribution segment. The pension plans obtained independent appraisals of the properties, and based on these appraisals, the plans recorded the contribution at fair value of $9.8 million.
We are leasing back the contributed properties for an initial term of ten years with two five-year extension options and continue to use the properties in our distribution operations. Rent payments are made quarterly, with first-year annual rents of $0.8 million and 2% annual escalation rates thereafter. Each lease provides us a right of first refusal on any subsequent sale by the pension plans, as well as repurchase options at the end of the initial term and extension periods. The plans engaged an independent fiduciary who negotiated the lease terms and also manages the properties on behalf of the plans.
We determined that the contribution of the properties does not meet the accounting definition of a plan asset within the scope of Accounting Standards Codification 715, Compensation—Retirement Benefits. Accordingly, the contributed properties are not considered a contribution for accounting purposes and, as a result, are not included in plan assets and have no impact on the net pension liability recorded on our Consolidated Balance Sheets. We continue to depreciate the carrying value of the properties in our financial statements, and no gain or loss was recognized at the contribution date for accounting purposes. Lease payments are recorded as pension contributions.
30
Notes to Consolidated Financial Statements (Continued)
11. Retirement and Benefit Plans (Continued)
Our practice is to fund the pension plans in amounts sufficient to meet the minimum requirements of U.S. federal laws and regulations. Additional discretionary funding may be provided as deemed appropriate. For the years ended December 31, 2010, 2011, and 2012, we made cash contributions to our pension plans totaling $3.9 million, $13.6 million, and $8.5 million, respectively. Cash contributions in 2012 include $0.4 million of lease payments. The total cash and real property contributions satisfied U.S. Department of Labor minimum pension contribution requirements for 2012. We expect to contribute approximately $11 million to our pension plans in 2013, of which $9.3 million was contributed in February 2013.
The following benefit payments are expected to be paid to plan participants. Qualified pension benefit payments are paid from plan assets, while nonqualified pension benefit payments are paid by the company.
| |
Pension Benefits | |||
|---|---|---|---|---|
| |
(thousands) |
|||
2013 |
$ | 17,918 | ||
2014 |
19,771 | |||
2015 |
21,445 | |||
2016 |
22,809 | |||
2017 |
24,203 | |||
Years 2018 - 2022 |
136,932 | |||
12. Long-Term Incentive Compensation Plans
Long-Term Incentive Cash Plan
In 2010, 2011, and 2012, key managers participated in a long-term incentive plan (LTIP) that pays awards in cash. The LTIP provided an annual award notice to participants granting them the opportunity to earn a cash award that was based on a target percentage of the participant's base salary and the company's achievement against corporate goals, both of which were set annually. Under the LTIP, the award, if any, is paid in three equal installments due no later than March 15 of the three years following the year the award was granted with continued employment as a precondition for receipt of each award installment. We recognize compensation expense based on the probability of the performance goals being met over the vesting period. We recognized $3.0 million, $2.4 million, and $6.7 million of LTIP expense in 2010, 2011, and 2012, respectively.
Management Equity Agreement
Certain key managers and unaffiliated directors (each a management investor) have purchased or been awarded, pursuant to the terms of separate Management Equity Agreements or Director Equity Agreements (collectively the Equity Plan), equity units in Forest Products Holdings, L.L.C. (FPH) at prices (with respect to Series B Units) that approximated fair value on the date of purchase. Those who purchased the FPH Series B equity units received grants of FPH Series C equity units (profit interests) that represent the right to participate in profits. In addition, FPH has issued Series C equity units to key managers and nonaffiliated directors for no consideration.
31
Notes to Consolidated Financial Statements (Continued)
12. Long-Term Incentive Compensation Plans (Continued)
Compensation Expense
We did not recognize compensation expense on the date of grant for the Series B equity units, because the fair value of the units issued by FPH was equal to or less than the amount each employee was required to pay. The Series C equity units are accounted for as restricted stock. We recognized compensation expense for the Series C equity units based on the fair value on the date of the grant and/or the award modification date. Compensation expense was recognized ratably over the vesting period for the Series C equity units that vest over time and ratably over the award period for the units that vest based on internal rates of return. During the year ended December 31, 2010, we recognized $1.6 million of compensation expense, which was primarily recorded in "General and administrative expenses." No related compensation expense was recorded in 2011 or 2012, as all equity units were fully vested or forfeited as of December 31, 2010.
Redemption Provisions
The FPH Series B and Series C equity units held by management investors are redeemable at FPH's option upon termination of the management investor's employment (or membership on the company's board of directors) and at the option of the holder in the event of death or disability or the sale of a division resulting in the termination of his or her employment. The Senior Notes and our Revolving Credit Facility contain a restricted payments covenant with a specific exception for equity redemptions up to $5 million in any year, subject to a two-year carryforward and carryback provision that provides an aggregate limit in any one year of $15 million. Additional exceptions to the covenant may also be utilized to permit equity redemptions.
Except in the event of death or disability, BC Holdings believes that the redemption of these units is within its control due to the interlocking boards of FPH and BC Holdings and because FPH was organized solely for the purpose of establishing BC Holdings to complete the Forest Products Acquisition. Repurchases under the Equity Plan have been funded by mirror-image redemptions of Series B and Series C equity units held by FPH in its subsidiaries. The redemption of the FPH Series B and Series C equity units and the expected parallel redemptions of our Series B and Series C equity units are a contingent event outside the employee's control. However, because FPH units are subject to mandatory redemption in an event that is outside BC Holdings' control (death or disability), these units are required to be classified outside of permanent equity on the Consolidated Balance Sheets at fair value as of the grant date and/or award modification date. Accordingly, at December 31, 2011 and 2012, BC Holdings recorded and allocated to us $8.7 million and $6.4 million, respectively, which we recorded in "Redeemable equity" on our Consolidated Balance Sheets.
In the event that a management investor's employment with us is terminated or his service as a director terminates, as the case may be, FPH holds an option, pursuant to the Equity Plan, to reacquire its equity units held by departing management investors at prices provided for in such agreements. FPH did not redeem or repurchase any equity units in 2010, 2011, and 2012.
32
Notes to Consolidated Financial Statements (Continued)
12. Long-Term Incentive Compensation Plans (Continued)
Activity of Redeemable Equity Units
The following summarizes the activity of the redeemable equity units, based on the fair value of the equity units as of the grant date or the date the awards were modified.
| |
Series B Equity Units |
Series C Equity Units |
|
|||||||||||||||||||
|---|---|---|---|---|---|---|---|---|---|---|---|---|---|---|---|---|---|---|---|---|---|---|
| |
Units | Weighted Average Grant- Date Fair Value |
Amount | Units | Weighted Average Grant- Date Fair Value |
Amount | Total Redeemable Equity |
|||||||||||||||
| |
(thousands, except per-share data) |
|||||||||||||||||||||
Balance at December 31, 2010 |
2,736 | $ | 1.00 | $ | 2,736 | 14,425 | $ | 0.46 | $ | 6,563 | $ | 9,299 | ||||||||||
Allocation of redeemable equity to Stockholder's equity(a) |
(214 | ) | 1.00 | (214 | ) | (710 | ) | 0.47 | (336 | ) | (550 | ) | ||||||||||
Balance at December 31, 2011 |
2,522 | 1.00 | 2,522 | 13,715 | 0.45 | 6,227 | 8,749 | |||||||||||||||
Allocation of redeemable equity to Stockholder's equity(a) |
(114 | ) | 1.00 | (114 | ) | (6,326 | ) | 0.35 | (2,192 | ) | (2,306 | ) | ||||||||||
Balance at December 31, 2012 |
2,408 | $ | 1.00 | $ | 2,408 | 7,389 | $ | 0.55 | $ | 4,035 | $ | 6,443 | ||||||||||
- (a)
- In 2011 and 2012, we reclassified certain redeemable equity units into "Stockholder's Equity" on our Consolidated Balance Sheets. The reclassifications resulted from employee retirements or terminations causing the equity units to no longer be subject to mandatory redemption in an event that is outside of BC Holdings' control.
As of December 31, 2010, all Series B and Series C service-condition equity units were vested, and all compensation expense related to the equity units had been recognized.
13. Equity
Boise Cascade had issued and outstanding 29,700,000 shares of common stock as of December 31, 2011 and 2012. See Note 16, Subsequent Events, for a discussion of our conversion from a limited liability company to a corporation. Each share of common stock entitles the holder to one vote on matters to be voted on by the stockholders of Boise Cascade.
On February 11, 2013, we closed on our initial public offering by issuing 13,529,412 shares of common stock. As a result of this initial public offering, we received proceeds of approximately $263 million, net of underwriting discounts and offering expenses.
Distributions
In 2010 and 2011, we did not make any cash distributions. In 2012, we made $228.3 million of cash distributions to BC Holdings. Both our senior credit facility and the indenture governing our senior subordinated notes permitted these distributions.
33
Notes to Consolidated Financial Statements (Continued)
13. Equity (Continued)
Accumulated Other Comprehensive Loss
Changes in accumulated other comprehensive loss are as follows:
| |
Accumulated Other Comprehensive Loss |
|||
|---|---|---|---|---|
| |
(thousands) |
|||
Balance at December 31, 2010, net of taxes |
$ | (40,195 | ) | |
Defined benefit pension plans, current-period other comprehensive loss |
(80,650 | ) | ||
Balance at December 31, 2011, net of taxes |
(120,845 | ) | ||
Defined benefit pension plans, current-period other comprehensive loss |
(384 | ) | ||
Balance at December 31, 2012, net of taxes |
$ | (121,229 | ) | |
Registration Rights Agreement
In connection with our initial public offering, we entered into a registration rights agreement with BC Holdings on February 8, 2013. BC Holdings is entitled to request that the company register its shares on a long-form or short-form registration statement on one or more occasions in the future, which registrations may be "shelf registrations." BC Holdings is also entitled to participate in certain registered offerings by the company, subject to the restrictions in the registration rights agreement. The company will pay BC Holdings' expenses in connection with BC Holdings' exercise of these rights. The registration rights described in this paragraph apply to (i) shares of our common stock held by BC Holdings as of February 11, 2013, (ii) any of our capital stock (or that of our subsidiaries) issued or issuable with respect to the common stock described in clause (i) with respect to any dividend, distribution, recapitalization, reorganization, or certain other corporate transactions, and (iii) any of our common stock held by Madison Dearborn Capital Partners IV, L.P. (MDCP IV) and its affiliates ("Registrable Securities"). These registration rights are also for the benefit of any subsequent holder of Registrable Securities, provided that any particular securities will cease to be Registrable Securities when they have been sold in a registered public offering, sold in compliance with Rule 144 of the Securities Act, or repurchased by us or our subsidiaries. In addition, with the consent of Boise Cascade and holders of a majority of Registrable Securities, any Registrable Securities held by a person other than MDCP IV and its affiliates will cease to be Registrable Securities if they can be sold without limitation under Rule 144 of the Securities Act.
14. Segment Information
We operate our business using three reportable segments: Wood Products, Building Materials Distribution, and Corporate and Other. These segments represent distinct businesses that are managed separately because of differing products and services. Each of these businesses requires distinct operating and marketing strategies. Management reviews the performance of the company based on these segments.
Our Wood Products segment manufactures and sells EWP, consisting of laminated veneer lumber (LVL), I-joists, and laminated beams, which are structural products used in applications where extra strength and consistent quality is required, such as headers and beams. LVL is also used in the
34
Notes to Consolidated Financial Statements (Continued)
14. Segment Information (Continued)
manufacture of engineered I-joists, which are assembled by combining a vertical web of oriented strand board (OSB) with top and bottom LVL or solid wood flanges. We also produce plywood, studs, particleboard, and ponderosa pine lumber, a premium lumber grade sold primarily to manufacturers of specialty wood windows, moldings, and doors. Our wood products are used primarily in new residential construction, residential repair-and-remodeling markets, and light commercial construction. Most of our wood products are sold to leading wholesalers (including our Building Materials Distribution segment), home improvement centers, retail lumberyards, and industrial converters. During 2012, approximately 38% of Wood Products' overall sales, including approximately 73% of Wood Products' EWP sales, were to our Building Materials Distribution segment.
Our Building Materials Distribution segment is a leading national stocking wholesale distributor of building materials. We distribute a broad line of building materials, including engineered wood products (EWP), oriented strand board (OSB), plywood, lumber, and general line items such as siding, metal products, insulation, roofing, and composite decking. Except for EWP, we purchase most of these building materials from third-party suppliers and market them primarily to retail lumberyards and home improvement centers that then sell the products to the final end customers, who are typically professional builders, independent contractors, and homeowners engaged in residential construction projects.
Our Corporate and Other segment includes corporate support staff services, related assets and liabilities, and foreign exchange gains and losses. These support services include, but are not limited to, finance, accounting, legal, information technology, and human resource functions. We have purchased many of these services from Boise Inc. under an Outsourcing Services Agreement, under which Boise Inc. provides a number of corporate staff services to us at cost. See Note 3, Outsourcing Services Agreement, for more information.
The segments' profits and losses are measured on operating profits before interest expense and interest income. Specified expenses are allocated to the segments. For many of these allocated expenses, the related assets and liabilities remain in the Corporate and Other segment.
The segments follow the accounting principles described in Note 2, Summary of Significant Accounting Policies.
For the years ended December 31, 2011 and 2012, sales to one customer accounted for $210.4 million and $304.9 million, or approximately 10% and 11%, respectively, of total sales. Sales to this customer were recorded in our Wood Products and our Building Materials Distribution segments. No other customer accounted for 10% or more of total sales.
Export sales to foreign unaffiliated customers were $42.3 million, $57.3 million, and $70.0 million for the years ended December 31, 2010, 2011, and 2012, respectively.
At December 31, 2010, 2011, and 2012, and for the years then ended, long-lived assets located in foreign countries and net sales originating in foreign countries were not material.
35
Notes to Consolidated Financial Statements (Continued)
14. Segment Information (Continued)
Segment sales to external customers, including related parties, by product line are as follows:
| |
Year Ended December 31 | |||||||||
|---|---|---|---|---|---|---|---|---|---|---|
| |
2010 | 2011 | 2012 | |||||||
| |
|
(millions) |
|
|||||||
Wood Products |
||||||||||
Plywood and veneer |
224.0 | 214.5 | 324.6 | |||||||
Engineered wood products |
86.5 | 92.1 | 87.9 | |||||||
Lumber |
67.5 | 69.6 | 77.4 | |||||||
Byproducts |
33.9 | 44.5 | 44.6 | |||||||
Particleboard |
28.2 | 26.1 | 33.1 | |||||||
Other |
24.0 | 23.3 | 21.8 | |||||||
|
464.0 | 470.2 | 589.3 | |||||||
Building Materials Distribution |
||||||||||
Commodity |
$ | 879.0 | $ | 835.1 | $ | 1,092.7 | ||||
General line |
697.0 | 722.0 | 794.9 | |||||||
Engineered wood products |
200.6 | 220.8 | 302.2 | |||||||
|
1,776.6 | 1,777.9 | 2,189.8 | |||||||
|
$ | 2,240.6 | $ | 2,248.1 | $ | 2,779.1 | ||||
An analysis of our operations by segment is as follows:
| |
Sales | Income (Loss) Before Income Taxes |
|
|
|
|
||||||||||||||||||||||
|---|---|---|---|---|---|---|---|---|---|---|---|---|---|---|---|---|---|---|---|---|---|---|---|---|---|---|---|---|
| |
Trade | Related Parties |
Inter- segment |
Total | Depreciation and Amortization |
EBITDA(d) | Capital Expenditures |
Assets | ||||||||||||||||||||
| |
(millions) |
|||||||||||||||||||||||||||
Year Ended December 31, 2010 |
||||||||||||||||||||||||||||
Wood Products(a) |
$ | 438.8 | $ | 25.3 | $ | 223.4 | $ | 687.4 | $ | (8.1 | ) | $ | 27.1 | $ | 19.0 | $ | 22.9 | $ | 335.3 | |||||||||
Building Materials Distribution(a) |
1,776.6 | — | 1.4 | 1,778.0 | 11.6 | 7.5 | 19.1 | 12.9 | 356.4 | |||||||||||||||||||
Corporate and Other |
— | — | — | — | (16.3 | ) | 0.3 | (16.0 | ) | — | 260.6 | |||||||||||||||||
Intersegment eliminations |
— | — | (224.8 | ) | (224.8 | ) | — | — | — | — | — | |||||||||||||||||
|
$ | 2,215.3 | $ | 25.3 | $ | — | $ | 2,240.6 | (12.8 | ) | $ | 34.9 | $ | 22.1 | $ | 35.8 | $ | 952.2 | ||||||||||
Interest expense |
(21.0 | ) | ||||||||||||||||||||||||||
Interest income |
0.8 | |||||||||||||||||||||||||||
|
$ | (33.0 | ) | |||||||||||||||||||||||||
36
Notes to Consolidated Financial Statements (Continued)
14. Segment Information (Continued)
| |
Sales | Income (Loss) Before Income Taxes |
|
|
|
|
||||||||||||||||||||||
|---|---|---|---|---|---|---|---|---|---|---|---|---|---|---|---|---|---|---|---|---|---|---|---|---|---|---|---|---|
| |
Trade | Related Parties |
Inter- segment |
Total | Depreciation and Amortization |
EBITDA(d) | Capital Expenditures |
Assets | ||||||||||||||||||||
| |
(millions) |
|||||||||||||||||||||||||||
Year Ended December 31, 2011 |
||||||||||||||||||||||||||||
Wood Products(b) |
$ | 451.4 | $ | 18.8 | $ | 242.3 | $ | 712.5 | $ | (15.1 | ) | $ | 28.4 | $ | 13.3 | $ | 29.3 | $ | 351.6 | |||||||||
Building Materials Distribution(b) |
1,777.9 | — | 1.4 | 1,779.4 | 2.0 | 8.4 | 10.4 | 10.0 | 366.9 | |||||||||||||||||||
Corporate and Other |
— | — | — | — | (14.5 | ) | 0.2 | (14.2 | ) | — | 184.3 | |||||||||||||||||
Intersegment eliminations |
— | — | (243.7 | ) | (243.7 | ) | — | — | — | — | — | |||||||||||||||||
|
$ | 2,229.3 | $ | 18.8 | $ | — | $ | 2,248.1 | (27.5 | ) | $ | 37.0 | $ | 9.5 | $ | 39.3 | $ | 902.8 | ||||||||||
Interest expense |
(19.0 | ) | ||||||||||||||||||||||||||
Interest income |
0.4 | |||||||||||||||||||||||||||
|
$ | (46.1 | ) | |||||||||||||||||||||||||
| |
Sales | Income (Loss) Before Income Taxes |
|
|
|
|
||||||||||||||||||||||
|---|---|---|---|---|---|---|---|---|---|---|---|---|---|---|---|---|---|---|---|---|---|---|---|---|---|---|---|---|
| |
Trade | Related Parties |
Inter- segment |
Total | Depreciation and Amortization |
EBITDA(d) | Capital Expenditures |
Assets | ||||||||||||||||||||
| |
(millions) |
|||||||||||||||||||||||||||
Year Ended December 31, 2012 |
||||||||||||||||||||||||||||
Wood Products |
$ | 569.5 | $ | 19.8 | $ | 353.9 | $ | 943.3 | $ | 55.8 | $ | 24.4 | $ | 80.2 | $ | 22.7 | $ | 366.1 | ||||||||||
Building Materials Distribution |
2,189.8 | — | 0.5 | 2,190.2 | 24.0 | 8.8 | 32.9 | 7.1 | 415.7 | |||||||||||||||||||
Corporate and Other |
— | — | — | — | (16.7 | ) | 0.1 | (16.5 | ) | — | 54.6 | |||||||||||||||||
Intersegment eliminations |
— | — | (354.4 | ) | (354.4 | ) | — | — | — | — | — | |||||||||||||||||
|
$ | 2,759.3 | $ | 19.8 | $ | — | $ | 2,779.1 | 63.2 | $ | 33.4 | $ | 96.6 | $ | 29.7 | $ | 836.4 | |||||||||||
Interest expense |
(21.8 | ) | ||||||||||||||||||||||||||
Interest income |
0.4 | |||||||||||||||||||||||||||
|
$ | 41.8 | ||||||||||||||||||||||||||
- (a)
- Included
$4.6 million of income for cash received from a litigation settlement related to vendor product pricing. We recorded $4.1 million in
our Building Materials Distribution segment and $0.5 million in our Wood Products segment.
- (b)
- In
2011, we permanently closed a laminated beam plant in our Wood Products segment, and we recorded the related expense of $1.3 million in "Other
(income) expense, net" and $0.4 million of accelerated depreciation in "Depreciation and Amortization" in our Consolidated Statement of Operations for the year ended December 31, 2011.
Also, during the year ended December 31, 2011, we recorded $2.0 million of noncash asset write-downs in "Other (income) expense, net," of which $1.2 million was recorded in our
Building Materials Distribution segment and $0.9 million was recorded in our Wood Products segment.
- (c)
- Capital
spending in 2011 for Wood Products includes $5.8 million for the acquisition of a laminated beam and decking manufacturing plant in Homedale,
Idaho.Capital spending in 2012 for Wood Products includes $2.4 million for the acquisition of a sawmill in Arden, Washington.
- (d)
- EBITDA is defined as income (loss) before interest (interest expense and interest income), income taxes, and depreciation and amortization. EBITDA is the primary measure used by our chief operating decision maker to evaluate segment operating performance and to decide how to allocate resources to segments. We believe EBITDA is useful to investors because it provides a means to evaluate the operating performance of our
37
Notes to Consolidated Financial Statements (Continued)
14. Segment Information (Continued)
segments and our company on an ongoing basis using criteria that are used by our internal decision makers and because it is frequently used by investors and other interested parties when comparing companies in our industry that have different financing and capital structures and/or tax rates. We believe EBITDA is a meaningful measure because it presents a transparent view of our recurring operating performance and allows management to readily view operating trends, perform analytical comparisons, and identify strategies to improve operating performance. EBITDA, however, is not a measure of our liquidity or financial performance under generally accepted accounting principles (GAAP) and should not be considered as an alternative to net income (loss), income (loss) from operations, or any other performance measure derived in accordance with GAAP or as an alternative to cash flow from operating activities as a measure of our liquidity. The use of EBITDA instead of net income (loss) or segment income (loss) has limitations as an analytical tool, including the inability to determine profitability; the exclusion of interest expense, interest income, and associated significant cash requirements; and the exclusion of depreciation and amortization, which represent unavoidable operating costs. Management compensates for the limitations of EBITDA by relying on our GAAP results. Our measure of EBITDA is not necessarily comparable to other similarly titled captions of other companies due to potential inconsistencies in the methods of calculation.
The following is a reconciliation of net income (loss) to EBITDA for the consolidated company:
| |
Year Ended December 31 | |||||||||
|---|---|---|---|---|---|---|---|---|---|---|
| |
2010 | 2011 | 2012 | |||||||
| |
(millions) |
|||||||||
Net income (loss) |
$ | (33.3 | ) | $ | (46.4 | ) | $ | 41.5 | ||
Interest expense |
21.0 | 19.0 | 21.8 | |||||||
Interest income |
(0.8 | ) | (0.4 | ) | (0.4 | ) | ||||
Income tax provision |
0.3 | 0.2 | 0.3 | |||||||
Depreciation and amortization |
34.9 | 37.0 | 33.4 | |||||||
EBITDA |
$ | 22.1 | $ | 9.5 | $ | 96.6 | ||||
15. Commitments, Legal Proceedings and Contingencies, and Guarantees
Commitments
We have commitments for leases and long-term debt that are discussed further in Note 6, Leases, and Note 9, Debt. In addition, we have purchase obligations for goods and services, capital expenditures, and raw materials entered into in the normal course of business.
We are a party to a number of long-term log and fiber supply agreements. At December 31, 2012, our total obligation for log and fiber purchases under contracts with third parties was approximately $227 million based on fixed contract pricing or first quarter 2013 pricing for variable contracts. Under most of these log and fiber supply agreements, we have the right to cancel or reduce our commitments in the event of a mill curtailment or shutdown. Future purchase prices under most of these agreements will be set quarterly or semiannually based on regional market prices. Our log and fiber obligations are subject to change based on, among other things, the effect of governmental laws and regulations, our manufacturing operations not operating in the normal course of business, log and fiber availability, and the status of environmental appeals. Except for deposits required pursuant to wood supply contracts, these obligations are not recorded in our consolidated financial statements until the transactions occur. In July 2012, there was a change in the ownership of timberlands that serve as a significant source of fiber to our Wood Products segment pursuant to a number of long-term fiber supply agreements. The affected supply agreements remain in place, with our rights and the new owners' obligations under those agreements unchanged. As such, we do not anticipate the ownership transition will negatively affect our operations.
38
Notes to Consolidated Financial Statements (Continued)
15. Commitments, Legal Proceedings and Contingencies, and Guarantees (Continued)
We enter into utility contracts for the purchase of electricity and natural gas. We also purchase these services under utility tariffs. At December 31, 2012, we had approximately $8.6 million of utility purchase commitments. These payment obligations were estimated either at market prices as of December 31, 2012, or at a fixed price, in each case in accordance with the terms of the related utility contract or tariff. Because we consume the energy in the manufacture of our products, these obligations represent the face value of the contracts, not resale value.
Legal Proceedings and Contingencies
We are a party to routine legal proceedings that arise in the ordinary course of our business. We are not currently a party to any legal proceedings or environmental claims that we believe would, individually or in the aggregate, have a material adverse effect on our financial position, results of operations, or cash flows.
Guarantees
We provide guarantees, indemnifications, and assurances to others.
Boise Cascade and its subsidiaries (Boise Cascade Wood Products, L.L.C. and Boise Cascade Building Materials Distribution, L.L.C.) act as co-borrowers under our Revolving Credit Facility, described in Note 9, Debt. Their obligations are guaranteed by each of our remaining domestic subsidiaries.
Boise Cascade and its wholly owned subsidiary, Boise Finance, issued $250.0 million of 6.375% senior notes due in 2020. At December 31, 2012, $250.0 million of the notes were outstanding. The Senior Notes are guaranteed by each of Boise Cascade's existing and future direct or indirect domestic subsidiaries that is a guarantor or co-borrower under our Revolving Credit Facility, other than Boise Finance. See Note 9, Debt and Note 18, Consolidating Guarantor and Nonguarantor Financial Information, for more information.
Boise Cascade issued guarantees to a limited number of trade creditors of one or more of its principal operating subsidiaries, Boise Cascade Wood Products, L.L.C. and Boise Cascade Building Materials Distribution, L.L.C., for trade credit obligations arising in the ordinary course of the business of such operating subsidiaries. These included guarantees of the obligations of Boise Cascade Wood Products, L.L.C., with respect to present and future timber sale agreements and several facility and rolling stock leases entered into by such subsidiaries and by Boise Cascade Building Materials Distribution, L.L.C. Boise Cascade's exposure under these agreements is limited to future timber purchases and the minimum lease payment requirements under the agreements. Boise Cascade also enters into guarantees of various raw material or energy supply agreements arising in the ordinary course of business.
All surety bonds and most letters of credit supporting obligations of subsidiaries sold or liabilities assumed by Boise Inc. in connection with the sale of our Paper and Packaging & Newsprint assets in 2008 have been replaced by new surety bonds or letters of credit issued without our credit support. The principal exception is letters of credit supporting workers' compensation obligations assumed by Boise Inc., which as a matter of state law must remain in our name even though the underlying liabilities and exposures have been assumed by Boise Inc. We are entitled to an indemnification from the purchaser for liabilities with respect to such letters of credit arising from workers' compensation
39
Notes to Consolidated Financial Statements (Continued)
15. Commitments, Legal Proceedings and Contingencies, and Guarantees (Continued)
claims assumed by Boise Inc. and for our costs of maintaining Boise Inc.'s share of any such letter of credit.
We enter into a wide range of indemnification arrangements in the ordinary course of business. These include tort indemnifications, tax indemnifications, financing transactions, indemnifications against third-party claims arising out of arrangements to provide services to us, and indemnifications in merger and acquisition agreements. At December 31, 2012, we are unable to estimate the maximum potential liability under these indemnifications, and we are not aware of any material liabilities arising from these indemnifications.
16. Subsequent Events
On February 4, 2013, we converted to a Delaware corporation from a Delaware limited liability company by filing a certificate of conversion in Delaware. The common stock authorized and outstanding, par values, net income (loss) per share amounts, and other per-share disclosures for all periods presented have been adjusted to reflect the impact of this conversion. No shares were dilutive or antidilutive in any period presented.
| |
Year Ended December 31 | |||||||||
|---|---|---|---|---|---|---|---|---|---|---|
| |
2010 | 2011 | 2012 | |||||||
| |
(thousands, except for per-share data) |
|||||||||
Net income (loss) |
$ | (33,297 | ) | $ | (46,363 | ) | $ | 41,496 | ||
Weighted average number of common shares for basic net income (loss) per common share |
29,700 | 29,700 | 29,700 | |||||||
Incremental effect of dilutive common stock equivalents |
— | — | — | |||||||
Weighted average number of common shares for diluted net income (loss) per common share |
29,700 | 29,700 | 29,700 | |||||||
Net income (loss) per common share: |
||||||||||
Basic |
$ | (1.12 | ) | $ | (1.56 | ) | $ | 1.40 | ||
Diluted |
$ | (1.12 | ) | $ | (1.56 | ) | $ | 1.40 | ||
See Note 13, Equity, for a discussion of our initial public offering subsequent to December 31, 2012.
17. Quarterly Results of Operations (unaudited)
| |
2011 | ||||||||||||
|---|---|---|---|---|---|---|---|---|---|---|---|---|---|
| |
First Quarter(a) |
Second Quarter |
Third Quarter |
Fourth Quarter(b) |
|||||||||
| |
(millions, except per-share amounts) |
||||||||||||
Net sales |
$ | 483.2 | $ | 589.4 | $ | 628.0 | $ | 547.4 | |||||
Income (loss) from operations |
$ | (14.8 | ) | $ | (5.3 | ) | $ | 2.1 | $ | (9.1 | ) | ||
Net loss |
$ | (19.0 | ) | $ | (9.9 | ) | $ | (3.7 | ) | $ | (13.8 | ) | |
Net loss per common share—Basic and Diluted |
$ | (0.64 | ) | $ | (0.33 | ) | $ | (0.12 | ) | $ | (0.46 | ) | |
40
Notes to Consolidated Financial Statements (Continued)
17. Quarterly Results of Operations (unaudited) (Continued)
| |
2012 | ||||||||||||
|---|---|---|---|---|---|---|---|---|---|---|---|---|---|
| |
First Quarter |
Second Quarter |
Third Quarter |
Fourth Quarter |
|||||||||
| |
(millions, except per-share amounts) |
||||||||||||
Net sales |
$ | 587.0 | $ | 732.9 | $ | 764.6 | $ | 694.6 | |||||
Income from operations |
$ | 6.2 | $ | 20.1 | $ | 28.1 | $ | 8.6 | |||||
Net income |
$ | 1.7 | $ | 15.0 | $ | 23.5 | $ | 1.3 | |||||
Net income per common share—Basic and Diluted |
$ | 0.06 | $ | 0.51 | $ | 0.79 | $ | 0.04 | |||||
- (a)
- Included
$1.5 million of expense related to the closure of a laminated beam plant in Emmett, Idaho.
Included $1.2 million in noncash asset write-downs.
- (b)
- Included $0.9 million in noncash asset write-downs.
18. Consolidating Guarantor and Nonguarantor Financial Information
The following consolidating financial information presents the Statements of Comprehensive Income (Loss), Balance Sheets, and Cash Flows related to Boise Cascade. The Senior Notes are guaranteed fully and unconditionally, and jointly and severally by each of our existing and future subsidiaries (other than our foreign subsidiaries). Each of our existing subsidiaries that is a guarantor of the Senior Notes is 100% owned by Boise Cascade. Other than the consolidated financial statements and footnotes for Boise Cascade and the consolidating financial information, financial statements and other disclosures concerning the guarantors have not been presented because management believes that such information is not material to investors.
Furthermore, the cancellation provisions of the guarantor subsidiaries are customary and they do not include an arrangement that permits a guarantor subsidiary to opt out of the obligation prior to or during the term of the debt. Each guarantor subsidiary is automatically released from its obligations as a guarantor upon the sale of the subsidiary or substantially all of its assets to a third party, the designation of the subsidiary as an unrestricted subsidiary for purposes of the covenants included in the indenture, the release of the indebtedness under the indenture, or if the issuer exercises its legal defeasance option or the discharge of its obligations in accordance with the indenture governing the Senior Notes.
41
Notes to Consolidated Financial Statements (Continued)
18. Consolidating Guarantor and Nonguarantor Financial Information (Continued)
Boise Cascade Company, and Subsidiaries
Consolidating Statements of Comprehensive Income (Loss)
For the Year Ended December 31, 2010
| |
Boise Cascade Company (Parent) |
Guarantor Subsidiaries |
Non- guarantor Subsidiaries |
Eliminations | Consolidated | |||||||||||
|---|---|---|---|---|---|---|---|---|---|---|---|---|---|---|---|---|
| |
(thousands) |
|
||||||||||||||
Sales |
||||||||||||||||
Trade |
$ | — | $ | 2,200,379 | $ | 14,953 | $ | — | $ | 2,215,332 | ||||||
Intercompany |
— | 57 | 14,398 | (14,455 | ) | — | ||||||||||
Related parties |
— | 25,259 | — | — | 25,259 | |||||||||||
|
— | 2,225,695 | 29,351 | (14,455 | ) | 2,240,591 | ||||||||||
Costs and expenses |
||||||||||||||||
Materials, labor, and other operating expenses (excluding depreciation) |
— | 1,930,316 | 31,442 | (14,396 | ) | 1,947,362 | ||||||||||
Materials, labor, and other operating expenses from related parties (excluding depreciation) |
— | 33,613 | — | — | 33,613 | |||||||||||
Depreciation and amortization |
346 | 32,635 | 1,918 | — | 34,899 | |||||||||||
Selling and distribution expenses |
— | 201,079 | 1,385 | — | 202,464 | |||||||||||
General and administrative expenses |
14,400 | 24,122 | — | (59 | ) | 38,463 | ||||||||||
General and administrative expenses from related party |
1,576 | — | — | — | 1,576 | |||||||||||
Other (income) expense, net |
373 | (4,881 | ) | (116 | ) | — | (4,624 | ) | ||||||||
|
16,695 | 2,216,884 | 34,629 | (14,455 | ) | 2,253,753 | ||||||||||
Income (loss) from operations |
(16,695 | ) | 8,811 | (5,278 | ) | — | (13,162 | ) | ||||||||
Foreign exchange gain (loss) |
12 | (57 | ) | 397 | — | 352 | ||||||||||
Gain on repurchase of long-term debt |
28 | — | — | — | 28 | |||||||||||
Interest expense |
(21,005 | ) | — | — | — | (21,005 | ) | |||||||||
Interest income |
386 | 404 | — | — | 790 | |||||||||||
|
(20,579 | ) | 347 | 397 | — | (19,835 | ) | |||||||||
Income (loss) before income taxes and equity in net income of affiliates |
(37,274 | ) | 9,158 | (4,881 | ) | — | (32,997 | ) | ||||||||
Income tax provision |
(215 | ) | (66 | ) | (19 | ) | — | (300 | ) | |||||||
Income (loss) before equity in net income of affiliates |
(37,489 | ) | 9,092 | (4,900 | ) | — | (33,297 | ) | ||||||||
Equity in net income of affiliates |
4,192 | — | — | (4,192 | ) | — | ||||||||||
Net income (loss) |
(33,297 | ) | 9,092 | (4,900 | ) | (4,192 | ) | (33,297 | ) | |||||||
Other comprehensive loss |
||||||||||||||||
Defined benefit pension plans |
||||||||||||||||
Net actuarial loss |
(4,027 | ) | — | — | — | (4,027 | ) | |||||||||
Amortization of actuarial loss |
556 | — | — | — | 556 | |||||||||||
Amortization of prior service costs |
178 | — | — | — | 178 | |||||||||||
Other comprehensive loss |
(3,293 | ) | — | — | — | (3,293 | ) | |||||||||
Comprehensive income (loss) |
$ | (36,590 | ) | $ | 9,092 | $ | (4,900 | ) | $ | (4,192 | ) | $ | (36,590 | ) | ||
42
Notes to Consolidated Financial Statements (Continued)
18. Consolidating Guarantor and Nonguarantor Financial Information (Continued)
Boise Cascade Company, and Subsidiaries
Consolidating Statements of Comprehensive Income (Loss)
For the Year Ended December 31, 2011
| |
Boise Cascade Company (Parent) |
Guarantor Subsidiaries |
Non- guarantor Subsidiaries |
Eliminations | Consolidated | |||||||||||
|---|---|---|---|---|---|---|---|---|---|---|---|---|---|---|---|---|
Sales |
||||||||||||||||
Trade |
$ | — | $ | 2,215,983 | $ | 13,342 | $ | — | $ | 2,229,325 | ||||||
Intercompany |
— | — | 11,157 | (11,157 | ) | — | ||||||||||
Related parties |
— | 18,763 | — | — | 18,763 | |||||||||||
|
— | 2,234,746 | 24,499 | (11,157 | ) | 2,248,088 | ||||||||||
Costs and expenses |
||||||||||||||||
Materials, labor, and other operating expenses (excluding depreciation) |
— | 1,939,993 | 24,436 | (11,810 | ) | 1,952,619 | ||||||||||
Materials, labor, and other operating expenses from related parties (excluding depreciation) |
— | 40,058 | — | — | 40,058 | |||||||||||
Depreciation and amortization |
240 | 35,010 | 1,772 | — | 37,022 | |||||||||||
Selling and distribution expenses |
— | 202,254 | 2,744 | — | 204,998 | |||||||||||
General and administrative expenses |
13,613 | 22,976 | — | 653 | 37,242 | |||||||||||
Other (income) expense, net |
111 | 4,114 | (1,030 | ) | — | 3,195 | ||||||||||
|
13,964 | 2,244,405 | 27,922 | (11,157 | ) | 2,275,134 | ||||||||||
Loss from operations |
(13,964 | ) | (9,659 | ) | (3,423 | ) | — | (27,046 | ) | |||||||
Foreign exchange gain (loss) |
(510 | ) | 20 | (7 | ) | — | (497 | ) | ||||||||
Interest expense |
(18,987 | ) | — | — | — | (18,987 | ) | |||||||||
Interest income |
185 | 222 | — | — | 407 | |||||||||||
|
(19,312 | ) | 242 | (7 | ) | — | (19,077 | ) | ||||||||
Loss before income taxes and equity in net loss of affiliates |
(33,276 | ) | (9,417 | ) | (3,430 | ) | — | (46,123 | ) | |||||||
Income tax provision |
(216 | ) | (24 | ) | — | — | (240 | ) | ||||||||
Loss before equity in net loss of affiliates |
(33,492 | ) | (9,441 | ) | (3,430 | ) | — | (46,363 | ) | |||||||
Equity in net loss of affiliates |
(12,871 | ) | — | — | 12,871 | — | ||||||||||
Net loss |
(46,363 | ) | (9,441 | ) | (3,430 | ) | 12,871 | (46,363 | ) | |||||||
Other comprehensive loss |
||||||||||||||||
Defined benefit pension plans |
||||||||||||||||
Net actuarial loss |
(83,528 | ) | — | — | — | (83,528 | ) | |||||||||
Amortization of actuarial loss |
2,703 | — | — | — | 2,703 | |||||||||||
Amortization of prior service costs and other |
175 | — | — | — | 175 | |||||||||||
Other comprehensive loss |
(80,650 | ) | — | — | — | (80,650 | ) | |||||||||
Comprehensive loss |
$ | (127,013 | ) | $ | (9,441 | ) | $ | (3,430 | ) | $ | 12,871 | $ | (127,013 | ) | ||
43
Notes to Consolidated Financial Statements (Continued)
18. Consolidating Guarantor and Nonguarantor Financial Information (Continued)
Boise Cascade Company, and Subsidiaries
Consolidating Statements of Comprehensive Income (Loss)
For the Year Ended December 31, 2012
| |
Boise Cascade Company (Parent) |
Guarantor Subsidiaries |
Non- guarantor Subsidiaries |
Eliminations | Consolidated | |||||||||||
|---|---|---|---|---|---|---|---|---|---|---|---|---|---|---|---|---|
Sales |
||||||||||||||||
Trade |
$ | — | $ | 2,746,208 | $ | 13,082 | $ | — | $ | 2,759,290 | ||||||
Intercompany |
— | — | 13,396 | (13,396 | ) | — | ||||||||||
Related parties |
— | 19,772 | — | — | 19,772 | |||||||||||
|
— | 2,765,980 | 26,478 | (13,396 | ) | 2,779,062 | ||||||||||
Costs and expenses |
||||||||||||||||
Materials, labor, and other operating expenses (excluding depreciation) |
— | 2,329,853 | 27,885 | (14,564 | ) | 2,343,174 | ||||||||||
Materials, labor, and other operating expenses from related parties (excluding depreciation) |
— | 60,271 | — | — | 60,271 | |||||||||||
Depreciation and amortization |
120 | 31,691 | 1,596 | — | 33,407 | |||||||||||
Selling and distribution expenses |
— | 231,593 | 3,462 | — | 235,055 | |||||||||||
General and administrative expenses |
16,425 | 25,529 | — | 1,168 | 43,122 | |||||||||||
Other (income) expense, net |
126 | 2,818 | (2,042 | ) | — | 902 | ||||||||||
|
16,671 | 2,681,755 | 30,901 | (13,396 | ) | 2,715,931 | ||||||||||
Income (loss) from operations |
(16,671 | ) | 84,225 | (4,423 | ) | — | 63,131 | |||||||||
Foreign exchange gain (loss) |
149 | (124 | ) | 12 | — | 37 | ||||||||||
Interest expense |
(21,757 | ) | — | — | — | (21,757 | ) | |||||||||
Interest income |
196 | 196 | — | — | 392 | |||||||||||
|
(21,412 | ) | 72 | 12 | — | (21,328 | ) | |||||||||
Income (loss) before income taxes and equity in net income of affiliates |
(38,083 | ) | 84,297 | (4,411 | ) | — | 41,803 | |||||||||
Income tax provision |
(300 | ) | (7 | ) | — | — | (307 | ) | ||||||||
Income (loss) before equity in net income of affiliates |
(38,383 | ) | 84,290 | (4,411 | ) | — | 41,496 | |||||||||
Equity in net income of affiliates |
79,879 | — | — | (79,879 | ) | — | ||||||||||
Net income (loss) |
41,496 | 84,290 | (4,411 | ) | (79,879 | ) | 41,496 | |||||||||
Other comprehensive loss |
||||||||||||||||
Defined benefit pension plans |
||||||||||||||||
Net actuarial loss |
(8,432 | ) | — | — | — | (8,432 | ) | |||||||||
Amortization of actuarial loss |
7,632 | — | — | — | 7,632 | |||||||||||
Amortization of prior service costs |
416 | — | — | — | 416 | |||||||||||
Other comprehensive loss |
(384 | ) | — | — | — | (384 | ) | |||||||||
Comprehensive income (loss) |
$ | 41,112 | $ | 84,290 | $ | (4,411 | ) | $ | (79,879 | ) | $ | 41,112 | ||||
44
Notes to Consolidated Financial Statements (Continued)
18. Consolidating Guarantor and Nonguarantor Financial Information (Continued)
Boise Cascade Company, and Subsidiaries
Consolidating Balance Sheets at December 31, 2011
| |
Boise Cascade Company (Parent) |
Guarantor Subsidiaries |
Non- guarantor Subsidiaries |
Eliminations | Consolidated | |||||||||||
|---|---|---|---|---|---|---|---|---|---|---|---|---|---|---|---|---|
| |
(thousands) |
|
||||||||||||||
ASSETS |
||||||||||||||||
Current |
||||||||||||||||
Cash and cash equivalents |
$ | 182,326 | $ | 20 | $ | 109 | $ | — | $ | 182,455 | ||||||
Receivables |
||||||||||||||||
Trade, less allowances |
— | 118,267 | 634 | — | 118,901 | |||||||||||
Related parties |
935 | 301 | — | — | 1,236 | |||||||||||
Intercompany |
— | 56 | — | (56 | ) | — | ||||||||||
Other |
(90 | ) | 3,661 | 225 | — | 3,796 | ||||||||||
Inventories |
— | 278,580 | 5,398 | — | 283,978 | |||||||||||
Prepaid expenses and other |
843 | 3,972 | 49 | — | 4,864 | |||||||||||
|
184,014 | 404,857 | 6,415 | (56 | ) | 595,230 | ||||||||||
Property and equipment, net |
1,259 | 255,117 | 10,080 | — | 266,456 | |||||||||||
Timber deposits |
— | 8,327 | — | — | 8,327 | |||||||||||
Deferred financing costs |
4,962 | — | — | — | 4,962 | |||||||||||
Goodwill |
— | 12,170 | — | — | 12,170 | |||||||||||
Intangible assets |
— | 8,900 | — | — | 8,900 | |||||||||||
Other assets |
20 | 6,765 | 1 | — | 6,786 | |||||||||||
Investments in affiliates |
557,925 | — | — | (557,925 | ) | — | ||||||||||
Total assets |
$ | 748,180 | $ | 696,136 | $ | 16,496 | $ | (557,981 | ) | $ | 902,831 | |||||
45
Notes to Consolidated Financial Statements (Continued)
18. Consolidating Guarantor and Nonguarantor Financial Information (Continued)
Boise Cascade Company, and Subsidiaries
Consolidating Balance Sheets at December 31, 2011 (Continued)
| |
Boise Cascade Company (Parent) |
Guarantor Subsidiaries |
Non- guarantor Subsidiaries |
Eliminations | Consolidated | |||||||||||
|---|---|---|---|---|---|---|---|---|---|---|---|---|---|---|---|---|
| |
(thousands) |
|
||||||||||||||
LIABILITIES AND STOCKHOLDER'S EQUITY |
||||||||||||||||
Current |
||||||||||||||||
Accounts payable |
||||||||||||||||
Trade |
$ | 8,633 | $ | 107,336 | $ | 789 | $ | — | $ | 116,758 | ||||||
Related parties |
395 | 747 | — | — | 1,142 | |||||||||||
Intercompany |
— | — | 56 | (56 | ) | — | ||||||||||
Accrued liabilities |
||||||||||||||||
Compensation and benefits |
12,104 | 19,816 | 347 | — | 32,267 | |||||||||||
Interest payable |
3,326 | — | — | — | 3,326 | |||||||||||
Other |
2,470 | 21,045 | 971 | — | 24,486 | |||||||||||
|
26,928 | 148,944 | 2,163 | (56 | ) | 177,979 | ||||||||||
Debt |
||||||||||||||||
Long-term debt |
219,560 | — | — | — | 219,560 | |||||||||||
Other |
||||||||||||||||
Compensation and benefits |
200,248 | — | — | — | 200,248 | |||||||||||
Other long-term liabilities |
10,076 | 3,600 | — | — | 13,676 | |||||||||||
|
210,324 | 3,600 | — | — | 213,924 | |||||||||||
Redeemable equity |
8,749 | — | — | — | 8,749 | |||||||||||
Commitments and contingent liabilities |
||||||||||||||||
Stockholder's equity |
||||||||||||||||
Preferred stock |
— | — | — | — | — | |||||||||||
Common stock |
297 | — | — | — | 297 | |||||||||||
Additional paid-in capital |
482,894 | — | — | — | 482,894 | |||||||||||
Accumulated other comprehensive loss |
(120,845 | ) | — | — | — | (120,845 | ) | |||||||||
Accumulated deficit |
(79,727 | ) | — | — | — | (79,727 | ) | |||||||||
Subsidiary equity |
— | 543,592 | 14,333 | (557,925 | ) | — | ||||||||||
Total stockholder's equity |
282,619 | 543,592 | 14,333 | (557,925 | ) | 282,619 | ||||||||||
Total liabilities and stockholder's equity |
$ | 748,180 | $ | 696,136 | $ | 16,496 | $ | (557,981 | ) | $ | 902,831 | |||||
46
Notes to Consolidated Financial Statements (Continued)
18. Consolidating Guarantor and Nonguarantor Financial Information (Continued)
Boise Cascade Company, and Subsidiaries
Consolidating Balance Sheets at December 31, 2012
| |
Boise Cascade Company (Parent) |
Guarantor Subsidiaries |
Non- guarantor Subsidiaries |
Eliminations | Consolidated | |||||||||||
|---|---|---|---|---|---|---|---|---|---|---|---|---|---|---|---|---|
ASSETS |
||||||||||||||||
Current |
||||||||||||||||
Cash and cash equivalents |
$ | 54,294 | $ | 35 | $ | 178 | $ | — | $ | 54,507 | ||||||
Receivables |
||||||||||||||||
Trade, less allowances |
65 | 133,554 | 1,124 | — | 134,743 | |||||||||||
Related parties |
16 | 658 | — | — | 674 | |||||||||||
Other |
25 | 5,631 | 548 | — | 6,204 | |||||||||||
Inventories |
— | 320,279 | 5,527 | — | 325,806 | |||||||||||
Prepaid expenses and other |
914 | 4,576 | 33 | — | 5,523 | |||||||||||
|
55,314 | 464,733 | 7,410 | — | 527,457 | |||||||||||
Property and equipment, net |
1,284 | 255,869 | 8,771 | — | 265,924 | |||||||||||
Timber deposits |
— | 6,221 | — | — | 6,221 | |||||||||||
Deferred financing costs |
7,562 | — | — | — | 7,562 | |||||||||||
Goodwill |
— | 12,170 | — | — | 12,170 | |||||||||||
Intangible assets |
— | 8,900 | — | — | 8,900 | |||||||||||
Other assets |
729 | 7,435 | — | — | 8,164 | |||||||||||
Investments in affiliates |
565,355 | — | — | (565,355 | ) | — | ||||||||||
Total assets |
$ | 630,244 | $ | 755,328 | $ | 16,181 | $ | (565,355 | ) | $ | 836,398 | |||||
47
Notes to Consolidated Financial Statements (Continued)
18. Consolidating Guarantor and Nonguarantor Financial Information (Continued)
Boise Cascade Company, and Subsidiaries
Consolidating Balance Sheets at December 31, 2012 (Continued)
| |
Boise Cascade Company (Parent) |
Guarantor Subsidiaries |
Non- guarantor Subsidiaries |
Eliminations | Consolidated | |||||||||||
|---|---|---|---|---|---|---|---|---|---|---|---|---|---|---|---|---|
LIABILITIES AND STOCKHOLDER'S EQUITY |
||||||||||||||||
Current |
||||||||||||||||
Accounts payable |
||||||||||||||||
Trade |
$ | 11,072 | $ | 128,565 | $ | 555 | $ | — | $ | 140,192 | ||||||
Related parties |
402 | 1,548 | — | — | 1,950 | |||||||||||
Accrued liabilities |
||||||||||||||||
Compensation and benefits |
17,272 | 43,938 | 604 | — | 61,814 | |||||||||||
Interest payable |
3,188 | — | — | — | 3,188 | |||||||||||
Other |
2,082 | 25,873 | 1,088 | — | 29,043 | |||||||||||
|
34,016 | 199,924 | 2,247 | — | 236,187 | |||||||||||
Debt |
||||||||||||||||
Long-term debt |
275,000 | — | — | — | 275,000 | |||||||||||
Other |
||||||||||||||||
Compensation and benefits |
206,668 | — | — | — | 206,668 | |||||||||||
Other long-term liabilities |
10,353 | 3,983 | — | — | 14,336 | |||||||||||
|
217,021 | 3,983 | — | — | 221,004 | |||||||||||
Redeemable equity |
6,443 | — | — | — | 6,443 | |||||||||||
Commitments and contingent liabilities |
||||||||||||||||
Stockholder's equity |
||||||||||||||||
Preferred stock |
— | — | — | — | — | |||||||||||
Common stock |
297 | — | — | — | 297 | |||||||||||
Additional paid-in capital |
256,927 | — | — | — | 256,927 | |||||||||||
Accumulated other comprehensive loss |
(121,229 | ) | — | — | — | (121,229 | ) | |||||||||
Accumulated deficit |
(38,231 | ) | (38,231 | ) | ||||||||||||
Subsidiary equity |
— | 551,421 | 13,934 | (565,355 | ) | — | ||||||||||
Total stockholder's equity |
97,764 | 551,421 | 13,934 | (565,355 | ) | 97,764 | ||||||||||
Total liabilities and stockholder's equity |
$ | 630,244 | $ | 755,328 | $ | 16,181 | $ | (565,355 | ) | $ | 836,398 | |||||
48
Notes to Consolidated Financial Statements (Continued)
18. Consolidating Guarantor and Nonguarantor Financial Information (Continued)
Boise Cascade Company, and Subsidiaries
Consolidating Statements of Cash Flows
For the Year Ended December 31, 2010
| |
Boise Cascade Company (Parent) |
Guarantor Subsidiaries |
Non- guarantor Subsidiaries |
Eliminations | Consolidated | |||||||||||
|---|---|---|---|---|---|---|---|---|---|---|---|---|---|---|---|---|
| |
(thousands) |
|
||||||||||||||
Cash provided by (used for) operations |
||||||||||||||||
Net income (loss) |
$ | (33,297 | ) | $ | 9,092 | $ | (4,900 | ) | $ | (4,192 | ) | $ | (33,297 | ) | ||
Items in net income (loss) not using (providing) cash |
||||||||||||||||
Equity in net income of affiliates |
(4,192 | ) | — | — | 4,192 | — | ||||||||||
Depreciation and amortization, including deferred financing costs and other |
3,121 | 32,635 | 1,918 | — | 37,674 | |||||||||||
Pension expense |
7,449 | — | — | — | 7,449 | |||||||||||
Management equity units expense |
1,625 | — | — | — | 1,625 | |||||||||||
Gain on repurchase of long-term debt |
(28 | ) | — | — | — | (28 | ) | |||||||||
Other |
(2 | ) | 116 | (457 | ) | — | (343 | ) | ||||||||
Decrease (increase) in working capital, net of acquisitions |
||||||||||||||||
Receivables |
107 | (6,398 | ) | (47 | ) | — | (6,338 | ) | ||||||||
Inventories |
— | (27,001 | ) | (1,427 | ) | — | (28,428 | ) | ||||||||
Prepaid expenses and other |
(251 | ) | (71 | ) | 22 | — | (300 | ) | ||||||||
Accounts payable and accrued liabilities |
847 | 30,369 | 1,203 | — | 32,419 | |||||||||||
Pension contributions |
(3,873 | ) | — | — | — | (3,873 | ) | |||||||||
Other |
3,057 | 678 | (8 | ) | — | 3,727 | ||||||||||
Net cash provided by (used for) operations |
(25,437 | ) | 39,420 | (3,696 | ) | — | 10,287 | |||||||||
Cash provided by (used for) investment |
||||||||||||||||
Expenditures for property and equipment |
(10 | ) | (34,675 | ) | (1,066 | ) | — | (35,751 | ) | |||||||
Proceeds from sales of assets |
656 | 520 | 78 | — | 1,254 | |||||||||||
Other |
— | (1,358 | ) | 402 | — | (956 | ) | |||||||||
Net cash provided by (used for) investment |
646 | (35,513 | ) | (586 | ) | — | (35,453 | ) | ||||||||
Cash provided by (used for) financing |
||||||||||||||||
Issuances of long-term debt |
45,000 | — | — | — | 45,000 | |||||||||||
Payments of long-term debt |
(128,451 | ) | — | — | — | (128,451 | ) | |||||||||
Proceeds from Boise Cascade Holdings, L.L.C., for sale of shares of Boise Inc. |
86,117 | — | — | — | 86,117 | |||||||||||
Due to (from) affiliates |
(510 | ) | (3,910 | ) | 4,420 | — | — | |||||||||
Net cash provided by (used for) financing |
2,156 | (3,910 | ) | 4,420 | — | 2,666 | ||||||||||
Net increase (decrease) in cash and cash equivalents |
(22,635 | ) | (3 | ) | 138 | — | (22,500 | ) | ||||||||
Balance at beginning of the period |
286,999 | 19 | 83 | — | 287,101 | |||||||||||
Balance at end of the period |
$ | 264,364 | $ | 16 | $ | 221 | $ | — | $ | 264,601 | ||||||
49
Notes to Consolidated Financial Statements (Continued)
18. Consolidating Guarantor and Nonguarantor Financial Information (Continued)
Boise Cascade Company, and Subsidiaries
Consolidating Statements of Cash Flows
For the Year Ended December 31, 2011
| |
Boise Cascade Company (Parent) |
Guarantor Subsidiaries |
Non- guarantor Subsidiaries |
Eliminations | Consolidated | |||||||||||
|---|---|---|---|---|---|---|---|---|---|---|---|---|---|---|---|---|
| |
(thousands) |
|
||||||||||||||
Cash provided by (used for) operations |
||||||||||||||||
Net loss |
$ | (46,363 | ) | $ | (9,441 | ) | $ | (3,430 | ) | $ | 12,871 | $ | (46,363 | ) | ||
Items in net loss not using (providing) cash |
||||||||||||||||
Equity in net loss of affiliates |
12,871 | — | — | (12,871 | ) | — | ||||||||||
Depreciation and amortization, including deferred financing costs and other |
2,450 | 35,010 | 1,772 | — | 39,232 | |||||||||||
Pension expense |
11,368 | — | — | — | 11,368 | |||||||||||
Other |
564 | 1,250 | 406 | — | 2,220 | |||||||||||
Decrease (increase) in working capital, net of acquisitions |
||||||||||||||||
Receivables |
(866 | ) | (15,369 | ) | 560 | — | (15,675 | ) | ||||||||
Inventories |
— | (21,416 | ) | 517 | — | (20,899 | ) | |||||||||
Prepaid expenses and other |
112 | (183 | ) | (1 | ) | — | (72 | ) | ||||||||
Accounts payable and accrued liabilities |
(829 | ) | 3,130 | (423 | ) | — | 1,878 | |||||||||
Pension contributions |
(13,621 | ) | — | — | — | (13,621 | ) | |||||||||
Other |
(685 | ) | (358 | ) | (6 | ) | — | (1,049 | ) | |||||||
Net cash used for operations |
(34,999 | ) | (7,377 | ) | (605 | ) | — | (42,981 | ) | |||||||
Cash provided by (used for) investment |
||||||||||||||||
Expenditures for property and equipment |
(21 | ) | (32,703 | ) | (813 | ) | — | (33,537 | ) | |||||||
Acquisitions of businesses and facilities |
— | (5,782 | ) | — | — | (5,782 | ) | |||||||||
Proceeds from sales of assets |
— | 3,126 | — | — | 3,126 | |||||||||||
Other |
(265 | ) | (60 | ) | (99 | ) | — | (424 | ) | |||||||
Net cash used for investment |
(286 | ) | (35,419 | ) | (912 | ) | — | (36,617 | ) | |||||||
Cash provided by (used for) financing |
||||||||||||||||
Credit facility financing costs |
(2,548 | ) | — | — | — | (2,548 | ) | |||||||||
Due to (from) affiliates |
(44,205 | ) | 42,800 | 1,405 | — | — | ||||||||||
Net cash provided by (used for) financing |
(46,753 | ) | 42,800 | 1,405 | — | (2,548 | ) | |||||||||
Net increase (decrease) in cash and cash equivalents |
(82,038 | ) | 4 | (112 | ) | — | (82,146 | ) | ||||||||
Balance at beginning of the period |
264,364 | 16 | 221 | — | 264,601 | |||||||||||
Balance at end of the period |
$ | 182,326 | $ | 20 | $ | 109 | $ | — | $ | 182,455 | ||||||
50
Notes to Consolidated Financial Statements (Continued)
18. Consolidating Guarantor and Nonguarantor Financial Information (Continued)
Boise Cascade Company, and Subsidiaries
Consolidating Statements of Cash Flows
For the Year Ended December 31, 2012
| |
Boise Cascade Company (Parent) |
Guarantor Subsidiaries |
Non- guarantor Subsidiaries |
Eliminations | Consolidated | |||||||||||
|---|---|---|---|---|---|---|---|---|---|---|---|---|---|---|---|---|
| |
(thousands) |
|||||||||||||||
Cash provided by (used for) operations |
||||||||||||||||
Net income (loss) |
$ | 41,496 | $ | 84,290 | $ | (4,411 | ) | $ | (79,879 | ) | $ | 41,496 | ||||
Items in net income (loss) not using (providing) cash |
||||||||||||||||
Equity in net income of affiliates |
(79,879 | ) | — | — | 79,879 | — | ||||||||||
Depreciation and amortization, including deferred financing costs and other |
3,924 | 31,691 | 1,596 | — | 37,211 | |||||||||||
Pension expense |
12,653 | — | — | — | 12,653 | |||||||||||
Other |
(61 | ) | (115 | ) | (295 | ) | — | (471 | ) | |||||||
Decrease (increase) in working capital, net of acquisitions |
— | — | — | |||||||||||||
Receivables |
772 | (17,558 | ) | (396 | ) | (56 | ) | (17,238 | ) | |||||||
Inventories |
— | (41,699 | ) | (129 | ) | — | (41,828 | ) | ||||||||
Prepaid expenses and other |
(71 | ) | (596 | ) | 15 | — | (652 | ) | ||||||||
Accounts payable and accrued liabilities |
3,787 | 49,115 | 83 | 56 | 53,041 | |||||||||||
Pension contributions |
(8,486 | ) | — | — | — | (8,486 | ) | |||||||||
Other |
4,066 | 342 | 2 | — | 4,410 | |||||||||||
Net cash provided by (used for) operations |
(21,799 | ) | 105,470 | (3,535 | ) | — | 80,136 | |||||||||
Cash provided by (used for) investment |
||||||||||||||||
Expenditures for property and equipment |
(28 | ) | (26,886 | ) | (472 | ) | — | (27,386 | ) | |||||||
Acquisition of businesses and facilities |
— | (2,355 | ) | — | — | (2,355 | ) | |||||||||
Proceeds from sales of assets |
— | 246 | — | — | 246 | |||||||||||
Other |
(4 | ) | 1 | 64 | — | 61 | ||||||||||
Net cash used for investment |
(32 | ) | (28,994 | ) | (408 | ) | — | (29,434 | ) | |||||||
Cash provided by (used for) financing |
||||||||||||||||
Issuances of long-term debt |
300,000 | — | — | — | 300,000 | |||||||||||
Payments of long-term debt |
(244,560 | ) | — | — | — | (244,560 | ) | |||||||||
Distributions to Boise Cascade Holdings, L.L.C. |
(228,268 | ) | — | — | — | (228,268 | ) | |||||||||
Financing costs |
(5,822 | ) | — | — | — | (5,822 | ) | |||||||||
Due to (from) affiliates |
72,449 | (76,461 | ) | 4,012 | — | — | ||||||||||
Net cash provided by (used for) financing |
(106,201 | ) | (76,461 | ) | 4,012 | — | (178,650 | ) | ||||||||
Net increase (decrease) in cash and cash equivalents |
(128,032 | ) | 15 | 69 | — | (127,948 | ) | |||||||||
Balance at beginning of the period |
182,326 | 20 | 109 | — | 182,455 | |||||||||||
Balance at end of the period |
$ | 54,294 | $ | 35 | $ | 178 | $ | — | $ | 54,507 | ||||||
51
Report of Independent Registered Public Accounting Firm
The
Board of Directors and Stockholders
Boise Cascade Company:
We have audited the accompanying consolidated balance sheets of Boise Cascade Company and subsidiaries as of December 31, 2012 and 2011, and the related consolidated statements of operations, comprehensive income (loss), stockholder's equity, and cash flows for each of the years in the three-year period ended December 31, 2012. These consolidated financial statements are the responsibility of the Company's management. Our responsibility is to express an opinion on these consolidated financial statements based on our audits.
We conducted our audits in accordance with the standards of the Public Company Accounting Oversight Board (United States). Those standards require that we plan and perform the audit to obtain reasonable assurance about whether the financial statements are free of material misstatement. An audit includes examining, on a test basis, evidence supporting the amounts and disclosures in the financial statements. An audit also includes assessing the accounting principles used and significant estimates made by management, as well as evaluating the overall financial statement presentation. We believe that our audits provide a reasonable basis for our opinion.
In our opinion, the consolidated financial statements referred to above present fairly, in all material respects, the financial position of Boise Cascade Company and subsidiaries as of December 31, 2012 and 2011, and the results of their operations and their cash flows for each of the years in the three-year period ended December 31, 2012, in conformity with U.S. generally accepted accounting principles.
/s/ KPMG LLP
Boise,
Idaho
March 7, 2013, except as
to Note 18, which is as of
April 1, 2013.
52
Boise Cascade Company Consolidated Statements of Operations
Boise Cascade Company Consolidated Statements of Comprehensive Income (Loss)
Boise Cascade Company Consolidated Balance Sheets
Boise Cascade Company Consolidated Statements of Cash Flows
Boise Cascade Company Consolidated Statements of Stockholder's Equity
Notes to Consolidated Financial Statements
Report of Independent Registered Public Accounting Firm