Attached files
| file | filename |
|---|---|
| 8-K - CURRENT REPORT OF MATERIAL EVENTS OR CORPORATE CHANGES - DYNEGY INC. | a13-8240_38k.htm |
Exhibit 99.1
|
|
Dynegy Lenders’ Presentation $500,000,000 2-Year Senior Secured Term Loan B Facility $800,000,000 7-Year Senior Secured Term Loan B Facility $500,000,000 5-Year Senior Secured Revolving Credit Facility April 2, 2013 |
|
|
Cautionary Statement Regarding Forward-Looking Statements This presentation contains statements reflecting assumptions, expectations, projections, intentions or beliefs about future events that are intended as “forward looking statements.” You can identify these statements by the fact that they do not relate strictly to historical or current facts. Management cautions that any or all of Dynegy’s forward-looking statements may turn out to be wrong. Please read Dynegy’s annual, quarterly and current reports filed under the Securities Exchange Act of 1934, including its 2012 Form 10-K for additional information about the risks, uncertainties and other factors affecting these forward-looking statements and Dynegy generally. Dynegy’s actual future results may vary materially from those expressed or implied in any forward-looking statements. All of Dynegy’s forward-looking statements, whether written or oral, are expressly qualified by these cautionary statements and any other cautionary statements that may accompany such forward-looking statements. In addition, Dynegy disclaims any obligation to update any forward-looking statements to reflect events or circumstances after the date hereof. Non-GAAP Financial Measures This presentation contains non-GAAP financial measures including EBITDA, Adjusted EBITDA and Free Cash Flow. Reconciliations of these measures to the most directly comparable GAAP financial measures to the extent available without unreasonable effort are contained in Dynegy’s current report on Form 8-K filed with the SEC on March 14, 2013 for 2012 financial performance and the current report on Form 8-K filed with the SEC on January 17, 2013 for the 2013 earnings guidance, which are available on Dynegy’s website free of charge, www.dynegy.com. To the extent required, statements disclosing the definitions, utility and purposes of these measures are set forth in Item 2.02 to Dynegy’s current report on Form 8-K filed with the SEC on March 14, 2013, which is available on Dynegy’s website free of charge, www.dynegy.com. 2 Forward-Looking Statements |
|
|
3 Agenda I. Introductions II. Company Overview III. Dynegy’s Proposed Acquisition of Ameren Energy Resources IV. Financial Review V. Syndication Timetable and Summary of Indicative Terms |
|
|
4 Speakers Introductions: Credit Suisse Robert C. Flexon President and Chief Executive Officer Clint Freeland Chief Financial Officer |

|
|
Transaction Summary Dynegy Inc. (“Dynegy,” or the “Company”) is seeking to raise $1,800 million of new Senior Secured First Lien Credit Facilities (“the Senior Secured Facilities”), consisting of: $500 million, 2-year Senior Secured Term Loan B Facility (“Tranche B-1 Term Loan”) $800 million, 7-year Senior Secured Term Loan B Facility (“Tranche B-2 Term Loan”) $500 million, 5-year Senior Secured Revolving Credit Facility Dynegy’s intent is to refinance the Tranche B-1 Term Loan with $500 million of unsecured notes in the near term after pro forma financials are available for Dynegy’s acquisition of Ameren Energy Resources Dynegy is only allowed to refinance the Tranche B-1 Term Loan with unsecured debt under financing documents Use of Proceeds: Repay $1,330 million in outstanding indebtedness under the existing senior secured credit facilities at wholly owned subsidiaries Dynegy Power, LLC (“GasCo”) and Dynegy Midwest Generation, LLC (“CoalCo”) (the “Refinancing”) Pay related transaction fees and expenses Refinancing opportunistically accesses capital markets to improve Dynegy’s capital structure Removes bankruptcy-remote, ring-fenced structures at GasCo and CoalCo Increases corporate liquidity Releases restricted cash of $318 million Reduces interest and administrative costs Borrowings will reside at Dynegy Inc., with unconditional guarantees by Dynegy Inc. and each of its direct and indirect domestic restricted subsidiaries on a joint and several basis Upon closing, Dynegy Inc. will continue to maintain a low leverage profile of $133 total debt / kW ($74 net debt / kW), with significant asset coverage 5 |
|
|
6 Company Overview |
|
|
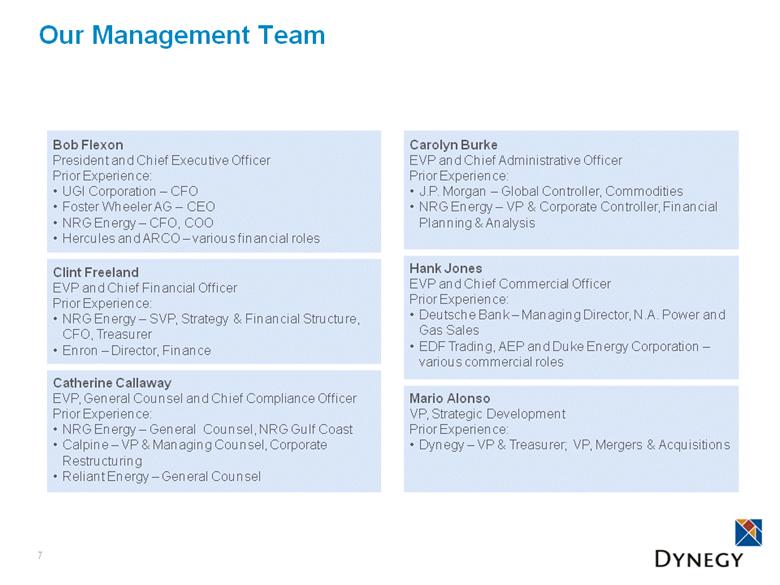
Our Management Team 7 Carolyn Burke EVP and Chief Administrative Officer Prior Experience: J.P. Morgan – Global Controller, Commodities NRG Energy – VP & Corporate Controller, Financial Planning & Analysis Hank Jones EVP and Chief Commercial Officer Prior Experience: Deutsche Bank – Managing Director, N.A. Power and Gas Sales EDF Trading, AEP and Duke Energy Corporation – various commercial roles Mario Alonso VP, Strategic Development Prior Experience: Dynegy – VP & Treasurer; VP, Mergers & Acquisitions Bob Flexon President and Chief Executive Officer Prior Experience: UGI Corporation – CFO Foster Wheeler AG – CEO NRG Energy – CFO, COO Hercules and ARCO – various financial roles Clint Freeland EVP and Chief Financial Officer Prior Experience: NRG Energy – SVP, Strategy & Financial Structure, CFO, Treasurer Enron – Director, Finance Catherine Callaway EVP, General Counsel and Chief Compliance Officer Prior Experience: NRG Energy – General Counsel, NRG Gulf Coast Calpine – VP & Managing Counsel, Corporate Restructuring Reliant Energy – General Counsel |
|
|
8 Scale and diversity of business Dynegy’s diverse asset portfolio Oakland 165 MW Moss Landing 1&2 1,020 MW Moss Landing 6&7 1,509 MW Morro Bay 650 MW 6,771 MW of generation with ~4,400 MW combined cycle capacity Fleet located across six states and five power markets Dispatch increases as natural gas prices decrease GasCo Assets CoalCo Assets 2,980 MW baseload dispatch portfolio Environmentally compliant with current EPA regulations All units burn ultra-low sulfur Powder River Basin coal Low cost structure as a result of favorable long-term rail agreements Baldwin 1,800 MW Havana 441 MW Wood River 446 MW Hennepin 293 MW Ontelaunee 580 MW Kendall 1,200 MW Independence 1,064 MW Black Mountain (1) 43 MW Casco Bay 540 MW 9,751 MW Note: Excludes ~4,100 MW of generation capacity from recently announced acquisition of Ameren Energy Resources. Net capacity shown based on winter capacity. For detailed plant information, please see Appendix Slide 35; (1) Dynegy owns 50% interest in Black Mountain. |
|
|
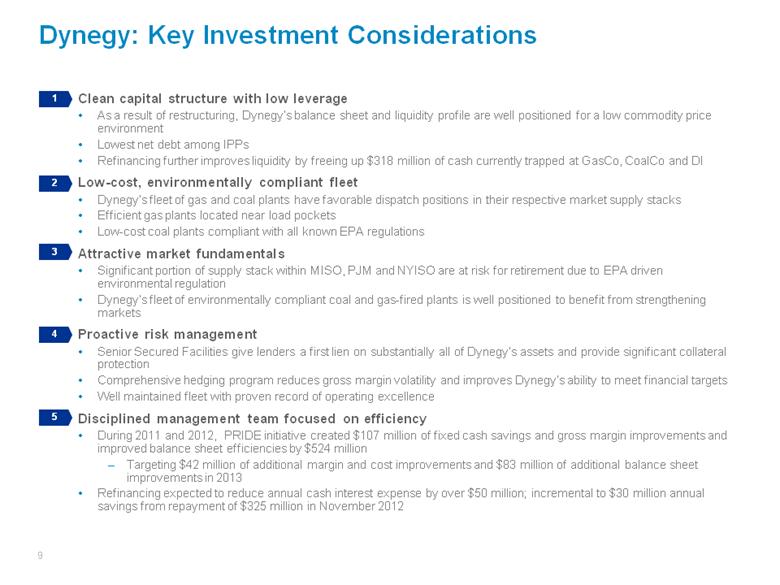
Dynegy: Key Investment Considerations Clean capital structure with low leverage As a result of restructuring, Dynegy’s balance sheet and liquidity profile are well positioned for a low commodity price environment Lowest net debt among IPPs Refinancing further improves liquidity by freeing up $318 million of cash currently trapped at GasCo, CoalCo and DI Low-cost, environmentally compliant fleet Dynegy’s fleet of gas and coal plants have favorable dispatch positions in their respective market supply stacks Efficient gas plants located near load pockets Low-cost coal plants compliant with all known EPA regulations Attractive market fundamentals Significant portion of supply stack within MISO, PJM and NYISO are at risk for retirement due to EPA driven environmental regulation Dynegy’s fleet of environmentally compliant coal and gas-fired plants is well positioned to benefit from strengthening markets Proactive risk management Senior Secured Facilities give lenders a first lien on substantially all of Dynegy’s assets and provide significant collateral protection Comprehensive hedging program reduces gross margin volatility and improves Dynegy’s ability to meet financial targets Well maintained fleet with proven record of operating excellence Disciplined management team focused on efficiency During 2011 and 2012, PRIDE initiative created $107 million of fixed cash savings and gross margin improvements and improved balance sheet efficiencies by $524 million Targeting $42 million of additional margin and cost improvements and $83 million of additional balance sheet improvements in 2013 Refinancing expected to reduce annual cash interest expense by over $50 million; incremental to $30 million annual savings from repayment of $325 million in November 2012 9 1 3 4 5 2 |
|
|
10 Clean capital structure with low leverage 1 IPP Net Debt ($/kW) IPP Net Debt / 2013E Adjusted EBITDA Note: Current balances as of 3/21/2013, pro forma for $25MM CoalCo loan prepayment on 3/28/2013; (1) As of 3/21/2013, pro forma for contemplated financing; (2) Restricted Cash is part of the Term Loan Facility; (3) Letters of Credit are cash collateralized; amount includes a required reserve of 3%. Source: Calpine and NRG net debt balances as of 12/31/2012 per company filings. Note: Calpine net debt includes net debt from unconsolidated projects. NRG net debt comprised of total debt less unrestricted cash and equivalents. 2013 Adjusted EBITDA per midpoint of management guidance. ($ in millions) Current Pro Forma (1) Cash & Cash Equivalents $389 $580 Collateral Posting Account (2) 68 – Revolver Capacity 150 500 L/C Capacity (2)(3) 250 – L/C & Revolver Outstanding (3) (245) (245) Total Liquidity $612 $835 2.7x 5.1x 5.1x Dynegy PF Calpine NRG $74 $344 $296 Dynegy PF Calpine NRG |
|
|
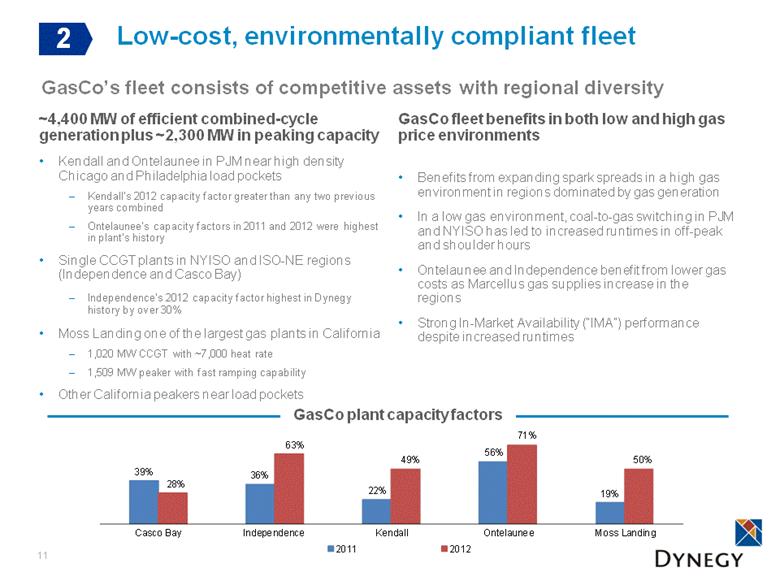
GasCo fleet benefits in both low and high gas price environments Benefits from expanding spark spreads in a high gas environment in regions dominated by gas generation In a low gas environment, coal-to-gas switching in PJM and NYISO has led to increased runtimes in off-peak and shoulder hours Ontelaunee and Independence benefit from lower gas costs as Marcellus gas supplies increase in the regions Strong In-Market Availability (“IMA”) performance despite increased runtimes ~4,400 MW of efficient combined-cycle generation plus ~2,300 MW in peaking capacity Kendall and Ontelaunee in PJM near high density Chicago and Philadelphia load pockets Kendall’s 2012 capacity factor greater than any two previous years combined Ontelaunee’s capacity factors in 2011 and 2012 were highest in plant’s history Single CCGT plants in NYISO and ISO-NE regions (Independence and Casco Bay) Independence’s 2012 capacity factor highest in Dynegy history by over 30% Moss Landing one of the largest gas plants in California 1,020 MW CCGT with ~7,000 heat rate 1,509 MW peaker with fast ramping capability Other California peakers near load pockets 11 Low-cost, environmentally compliant fleet 2 GasCo plant capacity factors GasCo’s fleet consists of competitive assets with regional diversity 39% 36% 22% 56% 19% 28% 63% 49% 71% 50% Casco Bay Independence Kendall Ontelaunee Moss Landing 2011 2012 |
|
|
MISO-CENTRAL 2014 DISPATCH COSTS(1) ($/MWh) MISO-CENTRAL DISPATCH ORDER Entire fleet MATS compliant Consent Decree environmental capital expenditures complete Burns low cost, low sulfur PRB coal Advantageous long-term rail contract in place Region has limited coal-to-gas switching as MISO is a coal-dominated market ADVANTAGES COAL FLEET CAPACITY FACTORS(2) (1) Based on Dynegy analysis; $4.00 Henry Hub; (2) Source: Ventyx, 2012 data is YTD through September 2012. Capacity factors based on weighted average of CoalCo fleet. Low-cost, environmentally compliant fleet (cont’d) 2 CoalCo’s sustainable low-cost competitive advantage 12 Baldwin1-3, Hennepin 1-2, Wood River 4-5, Havana 6 Estimated range of 80 – 90% |
|
|
Attractive market fundamentals 13 Rising Natural Gas Prices Rising Capacity Prices Rising Power Prices As more plants retire, reserve margins drop and capacity payments should rise A $2/kW-mo capacity price in MISO translates into $65MM annually in capacity revenue for CoalCo PJM and NYISO already seeing higher forward capacity pricing due to retirements(2) Over 27 GW of aging or coal-fired generation capacity is expected to retire in the MISO, NYISO and PJM regions, net of additions, during 2013-2016(1) 3 Dynegy’s MATS-compliant coal fleet and combined-cycle fleet are well-positioned to benefit from the tightening supply dynamics (1) See Slide 39 in appendix for annual net retirement projections and assumptions (2) PJM RTO pricing in base residual auctions increased from $16.46/MW-day for 2012/2013 to $136.00/MW-day for 2015/2016. Average NYISO May-Oct summer strip actual price ~$0.29/kW-mo for 2011; $2.27/kW-mo for 2012; current forecast of $4.25/kW-mo for 2013 As lower cost coal generation resources come off the grid, gas is on the margin more often Based on 2012 load, expected retirements could increase MISO-Central prices by ~$4/MWh and PJM prices by ~$1.35/MWh Gas-fired generation increasingly replaces retiring assets, natural gas demand should grow Coal retirements and new gas-fired capacity expected to add 3 to 4 Bcf/day of gas demand by 2017 |

|
|
Value Creation We hedge power and fuel to meet or exceed targeted EBITDA and Free Cash Flow requirements Our coal portfolio is largely open to realize upside in natural gas and power market recovery Upside Participation Downside Protection Extrinsic Value Capture Financial Targets Intrinsic Value Capture For our at-the-money assets, we pursue commercial strategies to capture temporary opportunities that exist as spark spreads change due to volatility in power and gas markets For our assets that operate deeper in-the-money, we transact to capture intrinsic value We employ “collar” strategies to provide downside price protection while retaining exposure to improved pricing Primarily Coal Portfolio Total Portfolio Total Portfolio Proactive risk management 4 Our flexible hedging strategy limits downside risk while allowing participation in market recovery 14 |
|
|
15 Environmentally Compliant (with all known EPA regulations) Coal Fleet If gas prices stay low If gas prices rise Benefits from rising capacity payments and “heat rates” due to increased retirements Significant upside leverage in a rising natural gas environment Benefits from increased capacity factors and rising capacity payments due to increased retirements Benefits from spark spread expansion as energy prices rise If gas prices stay low If gas prices rise CoalCo GasCo Efficient Combined-Cycle Gas Fleet Proactive risk management (cont’d) 4 Dynegy’s portfolio embeds a natural hedge to changing gas prices |
|
|
GasCo has consistently exhibited high annual availability factors, averaging ~90% over the last five years, improving EFOR rates due to PRIDE efforts and IMA of ~95% past 2 years during period of historic runtimes CoalCo has also demonstrated high availability, averaging ~87% over the last five years, improving EFOR rates due to PRIDE efforts and consistent IMA of 92% for the past 2 years 16 Proactive risk management (cont’d) 4 Consistent operating performance with proven track record (1) Portfolio equivalent availability reflects weighted average (by capacity) of annual equivalent availability. Excludes Black Mountain and assets from recently announced acquisition of Ameren Energy Resources; (2) EFOR stands for equivalent forced outage rate. IMA stands for in-market-availability. GasCo portfolio equivalent availability(1) CoalCo portfolio equivalent availability(1) GasCo EFOR and IMA(2) CoalCo EFOR and IMA(2) 4.1% 2.5% 0% 2% 4% 6% 8% 2011 2012 EFOR 7.1% 6.2% 0% 2% 4% 6% 8% 2011 2012 EFOR 86% 85% 87% 88% 86% 0% 20% 40% 60% 80% 100% 2008 2009 2010 2011 2012 Average: 86.6% 94% 95% 0% 20% 40% 60% 80% 100% 2011 2012 IMA 92% 92% 0% 20% 40% 60% 80% 100% 2011 2012 IMA |
|
|
Fixed Cash Savings $MM Gross Margin Improvements $MM Balance Sheet Efficiency $MM Producing Results through Innovation by Dynegy Employees Exceeded 2012 PRIDE fixed cash target by $6 million, achieving a $31 million improvement from 2011 actuals Exceeded 2012 PRIDE target of $100 million by ~50%, a $148 million improvement over 2011 actuals Met gross margin improvement target, a $13 million increase over 2011 actuals Disciplined management team focused on efficiency 5 17 $51 $31 $22 $104 PRIDE delivered over $100MM of fixed cash savings and gross margin improvement since 2011 with an additional $42MM targeted for 2013 |
|
|
18 Dynegy’s Proposed Acquisition of Ameren Energy Resources |
|
|
AER’s coal generation and retail marketing business is a natural fit with CoalCo Portfolio Overview ~4,100 MW of baseload coal generation in MISO and PJM ~900 MW in PJM by 2016 Ameren Energy Marketing and Homefield Energy – established retail and commercial energy providers 19 MISO Kendall Hennepin Wood River Baldwin Havana Edwards Coffeen Newton Duck Creek Joppa DYN Transaction Summary Dynegy’s newly created, non-recourse subsidiary(1), Illinois Power Holdings, acquires AER equity for no cash consideration At closing, AER and its subsidiaries will have $226 million in cash, $160 million in working capital and 2 years of collateral support from Ameren Synergy run-rate in 2014 targeted to exceed ~$60 million Accretive to Adj. EBITDA in 2014 and Free Cash Flow by 2015(2) Regulatory approvals include FERC, FCC and Illinois Pollution Control Board Estimated close during 4th quarter 2013 (1) Excluding a $25 million Dynegy guarantee to Ameren Corp; (2) Definitions of Adjusted EBITDA and Free Cash Flow are set forth in Item 2.02 to Dynegy’s current report on Form 8-K filed with the SEC on March 14, 2013. |

|
|
(1) Genco owns an 80% interest in EEI, which owns Joppa Steam and MEPI Joppa 6B. The transaction has been structured to mitigate risk and ensure liquidity 20 Merchant Generation (AEE) (AER) Illinois Power Holdings, LLC (IPH) Ameren Energy Generating Co. (Genco) Ameren Energy Resources Generating Co. (AERG) Ameren Energy Marketing Co. (AEM) Electric Energy, Inc. (EEI) 80% (1) Dynegy Midwest Generation LLC (CoalCo) Dynegy Power, LLC (GasCo) 1 2 Ameren, prior to closing, purchases Elgin, Grand Tower and Gibson City gas assets from Genco for a minimum price of $133 million to satisfy Genco put option 1 2 IPH acquires 100% equity of AER for no cash consideration Transaction Steps (ring-fenced) |

|
|
$25 million guarantee at signing, that extends for 2 years from closing for certain payment obligations of IPH prior to closing and certain indemnifications and reimbursement obligations of IPH post-closing The terms of the acquisition require minimal capital commitment from Dynegy Prior to closing, Ameren to satisfy Genco Put Agreement for a minimum of $133 million Cash contribution of $60 million to AERG and Genco for general corporate purposes AER subsidiaries also retaining $25 million in existing cash balances and ~$8 million in proceeds from sale of property AER net working capital at closing of $160 million, excluding cash, and two years of collateral support to AER Retention of non-operating locations and offsite environmental responsibilities subject to limited indemnification from IPH 21 AER and subsidiaries to retain the on-site environmental and business obligations, excluding the Duck Creek rail embankment Genco’s debt of $825 million remains outstanding Indemnify Ameren for future potential offsite liabilities associated with beneficial re-use and disposal of coal ash as follows: Up to $10 million – 50/50 AEE/IPH >$10-$30 million – 100% IPH >$30 million – 100% AEE Illinois Power Holdings, LLC |
|
|
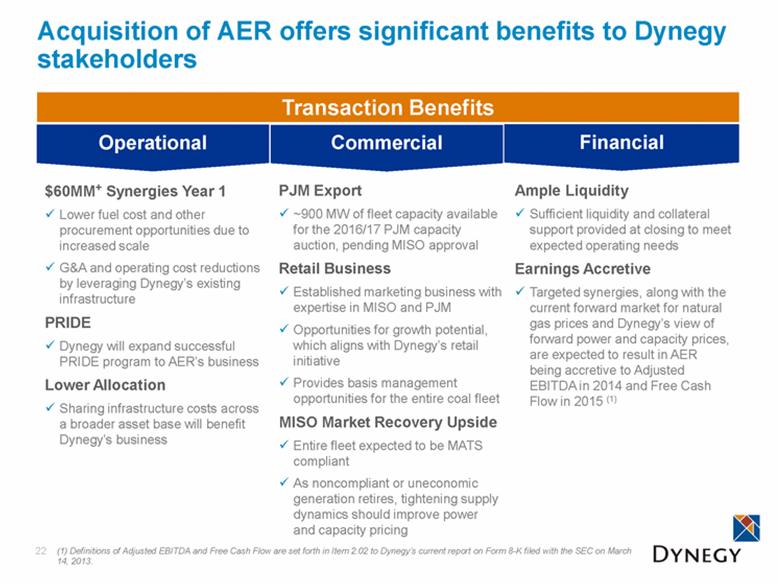
PJM Export ~900 MW of fleet capacity available for the 2016/17 PJM capacity auction, pending MISO approval Retail Business Established marketing business with expertise in MISO and PJM Opportunities for growth potential, which aligns with Dynegy’s retail initiative Provides basis management opportunities for the entire coal fleet MISO Market Recovery Upside Entire fleet expected to be MATS compliant As noncompliant or uneconomic generation retires, tightening supply dynamics should improve power and capacity pricing Acquisition of AER offers significant benefits to Dynegy stakeholders $60MM+ Synergies Year 1 Lower fuel cost and other procurement opportunities due to increased scale G&A and operating cost reductions by leveraging Dynegy’s existing infrastructure PRIDE Dynegy will expand successful PRIDE program to AER’s business Lower Allocation Sharing infrastructure costs across a broader asset base will benefit Dynegy’s business Ample Liquidity Sufficient liquidity and collateral support provided at closing to meet expected operating needs Earnings Accretive Targeted synergies, along with the current forward market for natural gas prices and Dynegy’s view of forward power and capacity prices, are expected to result in AER being accretive to Adjusted EBITDA in 2014 and Free Cash Flow in 2015 (1) Transaction Benefits (1) Definitions of Adjusted EBITDA and Free Cash Flow are set forth in Item 2.02 to Dynegy’s current report on Form 8-K filed with the SEC on March 14, 2013. 22 |
|
|
23 Financial Review |

|
|
Review of 2012 Financial Performance 24 Operational Performance Annual production volumes increased period-over-period by ~20% Annual production volumes for Gas segment increased ~70% period-over-period primarily due to increased spark spreads Annual production volumes for Coal segment decreased ~10% period-over-period due to lower power pricing and an increase in planned outages Strong operational performance with overall in-market-availability of ~93% during 2012 Safety performance continues to be a priority Financial Performance 4Q12 Adjusted EBITDA of $(42) million, down $28 million primarily due to lower realized prices at the Coal segment and legacy financial settlements at the Gas segment Annual Adjusted EBITDA of $57 million, down $224 million primarily due to lower realized prices at the Coal segment and legacy financial settlements PRIDE achieves 2012 targets to contribute ~$45 million in Fixed Cash Savings and Gross Margin improvements and ~$150 million in Balance Sheet Efficiency Reaffirm Adjusted EBITDA and Cash Flow Guidance for 2013 |
|
|
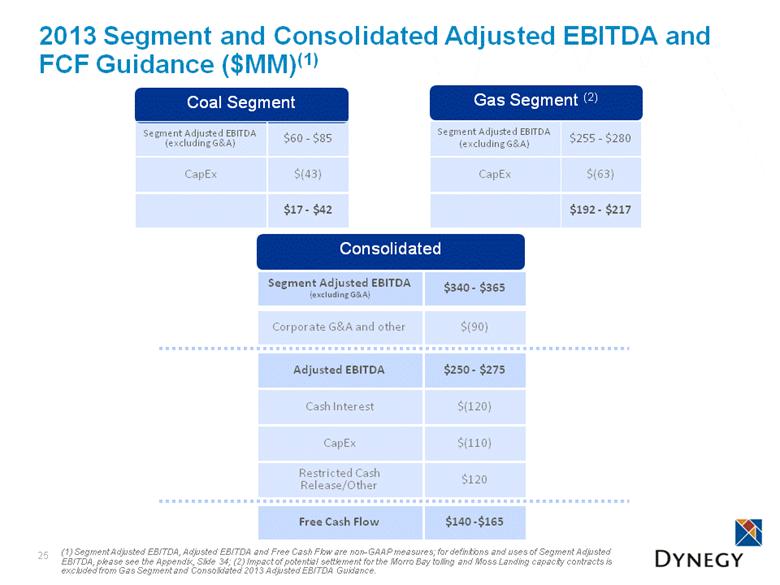
25 Gas Segment (2) Segment Adjusted EBITDA (excluding G&A) $255 - $280 Consolidated Segment Adjusted EBITDA (excluding G&A) $340 - $365 Cash Interest $(120) Free Cash Flow $140 -$165 CapEx $(110) CapEx $(63) Coal Segment Segment Adjusted EBITDA (excluding G&A) $60 - $85 CapEx $(43) $17 - $42 $192 - $217 Restricted Cash Release/Other $120 Corporate G&A and other $(90) Adjusted EBITDA $250 - $275 2013 Segment and Consolidated Adjusted EBITDA and FCF Guidance ($MM)(1) (1) Segment Adjusted EBITDA, Adjusted EBITDA and Free Cash Flow are non-GAAP measures; for definitions and uses of Segment Adjusted EBITDA, please see the Appendix, Slide 34; (2) Impact of potential settlement for the Morro Bay tolling and Moss Landing capacity contracts is excluded from Gas Segment and Consolidated 2013 Adjusted EBITDA Guidance. |
|
|
Significant year-over-year improvement due to higher commodity prices and lack of legacy commercial position settlements 26 Adjusted EBITDA 2012 to 2013 ($MM) Estimated Range of $250 – 275 million Year-Over-Year Performance Drivers Commercial hedge values virtually flat entering 2013 versus significantly out-of-the-money in 2012 Last legacy put options settled in December 2012 – no similar settlements in 2013 Improvement in Midwest basis assumed when forecasting 2013 |
|
|
Ring-fenced group Ring-fenced group Bankruptcy-remote entities Dynegy Gas Investments Holdings, LLC Dynegy Inc. (DI) Dynegy Midwest Generation, LLC (CoalCo) Dynegy Power, LLC (GasCo) Proposed Capital Structure Current Capital Structure (as of 3/21/2013) (1) Proposed Capital Structure $500 million 5-year Revolving Facility $500 million 2-year Senior Secured TLB $800 million 7-year Senior Secured TLB $580 million cash & cash equivalents Dynegy Coal Investments Holdings, LLC 27 Dynegy Gas Investments Holdings, LLC Dynegy Coal Investments Holdings, LLC Note: Above chart represents an abbreviated organizational structure; (1) Current capital structure pro forma for $25MM CoalCo loan prepayment on 3/28/2013; (2) Includes various subsidiaries of Dynegy Inc.; (3) Restricted Cash is part of the Term Loan Facility; (4) Letters of credit are cash collateralized. Amount includes a required reserve of 3%. ($MM) Dynegy Gas HoldCo, LLC Cash & cash equivalents $1 Dynegy Coal HoldCo, LLC Cash & cash equivalents $0 Dynegy Midwest Generation, LLC (CoalCo) 1st Lien Term Loan $493 Cash & cash equivalents 18 Collateral posting account (3) 4 L/C capacity (4) 12 L/C outstanding (4) (11) Total Liquidity $23 Dynegy Power, LLC (GasCo) 1st Lien Term Loan $837 Cash & cash equivalents $95 Collateral posting account (3) 64 Revolver capacity 150 L/C capacity (4) 210 L/C and revolver outstanding (4) (207) Total Liquidity $312 |
|
|
Sources/Uses and Pro forma Capitalization 28 Note: Funded debt excludes LCs posted under revolver; (1) Unrestricted cash, restricted cash and existing debt balances as of 3/21/2013, pro forma for $25MM CoalCo loan prepayment on 3/28/2013; (2) Assumes call price of 104.619 as of 4/15/2013; (3) EBITDA based on midpoint of management guidance. ($ in millions) Sources Uses Dynegy Inc. Tranche B-1 Term Loan $500 Repayment of Existing Loans at CoalCo and GasCo (1) $1,330 Dynegy Inc. Tranche B-2 Term Loan 800 Total Refinancing Premium (2) 61 Unrestricted Cash (1) 389 Total Fees, Expenses and OID 36 Released Restricted Cash (1) 318 Cash to Balance Sheet (Unrestricted) 580 Total Sources $2,007 Total Uses $2,007 |
|
|
29 Robust Collateral Coverage Pro Forma Collateral Coverage Based on Public Market Valuation Valuation Comparables $ / kW (2) (3) (4) (1) Based on 3/21/13 share price of $23.08; (2) Based on average of Fox Energy, Riverside, Ironwood and Red Oak transactions; (3) Based on average of Delta Person, Broad River and Bluegrass transactions. Bluegrass transaction was withdrawn after announcement; (4) Based on average of Brandon Shores and Cayuga / Somerset transactions. Implied Collateral Coverage No Value Attributed to Coal Implied Collateral Coverage Fair Value Attributed to Coal ($MM unless otherwise stated) Technology MWs $ / kW Valuation CCGTs 4,404 $559 $2,463 Gas peakers 2,367 343 812 Compliant coal 2,980 240 714 Total asset valuation 9,751 $409 $3,989 (+) Pro forma cash 580 Total collateral value $4,569 (/) Total debt 1,300 Implied collateral coverage 3.5x Pro forma funded debt $1,300 Equity value: stock (1) 2,308 Firm value including cash $3,608 (/) Total debt 1,300 Pro forma collateral coverage 2.8x Technology MWs $ / kW Valuation CCGTs 4,404 $559 $2,463 Gas peakers 2,367 343 812 Compliant coal 2,980 – – Total asset valuation 9,751 $336 $3,275 (+) Pro forma cash 580 Total collateral value $3,855 (/) Total debt 1,300 Implied collateral coverage 3.0x |
|
|
Syndication Timetable and Summary of Indicative Terms 30 |
|
|
Syndication Timetable April 2013 Su Mo Tu We Th Fr Sa 1 2 3 4 5 6 7 8 9 10 11 12 13 14 15 16 17 18 19 20 21 22 23 24 25 26 27 28 29 30 31 Key transaction dates Dates Event April 2nd, 2013 Bank Meeting & Lenders’ Presentation 1:30 PM: Registration 2:00 PM: Lenders’ presentation W New York – Great Room 1 541 Lexington Avenue (between 49th and 50th Streets) New York, NY 10022 Week of April 1st Legal documentation posted April 10th, 2013 Lender commitments due by 5:00 PM EST Week of April 15th, 2013 Expected Closing and Funding |
|
|
Summary of Indicative Terms 32 Borrower: Dynegy Inc. (the “Company” or the “Borrower”, and together with all subsidiaries, the “Credit Group”) Use of proceeds: To refinance the GasCo and CoalCo facilities and to pay fees and expenses associated with the transaction Facilities: $500 million revolving credit facility (the “Revolver”) Up to $1,300 million term loans, comprised of: (i) $500 million first lien term loan (the “Tranche B-1 Term Loan") and (ii) $800 million first lien term loan (the “Tranche B-2 Term Loan”) (collectively, the “Term Loans”) Tenors: Revolver: 5 years Tranche B-1 Term Loan: 2 years Tranche B-2 Term Loan: 7 years Assumed corporate rating: B2 / B Interest rate: [TBD] LIBOR floor: [TBD] OID: [TBD] Revolver commitment fee: 50 bps per annum, to be paid on the undrawn portion of the Revolver and subject to leverage-based step-downs Term loan amortization: 1% per annum Guarantors: Each of the Borrower's present and future, direct and indirect domestic restricted subsidiaries (the "Guarantors") Security: First priority perfected lien on all property and assets (tangible and intangible, and including all outstanding capital stock of the Company and each of its restricted subsidiaries) of the Credit Group and subject to customary exceptions. Unrestricted subsidiaries’ equity will not be required to be pledged and unrestricted subsidiaries will not be required to grant security interest in their assets Optional redemption Tranche B-1 Term Loan: Prepayable at par Tranche B-2 Term Loan: 101 soft call, par thereafter Mandatory prepayments: Customary for facilities of this type and including prepayments from the net proceeds of asset sales and the issuance of debt securities Affirmative covenants: Customary for facilities of this type Negative covenants: Customary for facilities of this type and including limitations on indebtedness, liens, guarantees, mergers and acquisitions, asset sales, restricted payments, transactions with affiliates and investments Financial covenants: Revolver: Maximum Senior Secured Leverage Ratio (with springing covenant set at 25%) Term Loans: None; covenant-lite |
|
|
Appendix 33 |
|
|
Segment Adjusted EBITDA Definition Segment Adjusted EBITDA is a non-GAAP measure which is utilized to more clearly demonstrate the financial results of each business segment. The measure reflects segment gross margin less operating expenses. Corporate allocations such as general and administrative expenses and the financial structure are not included in order to demonstrate the cash amount each business segment contributes towards the corporate cost and capital structures. 34 |
|
|
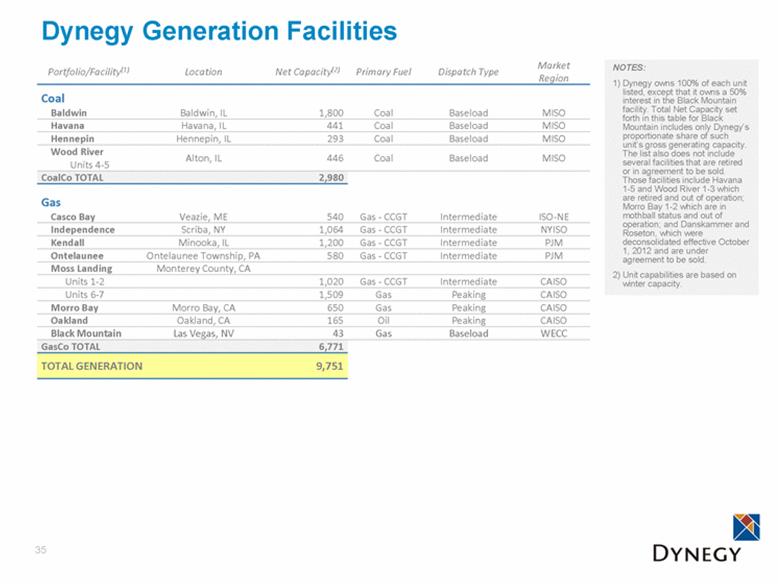
35 Dynegy Generation Facilities Portfolio/Facility(1) Location Net Capacity(2) Primary Fuel Dispatch Type Market Region Coal Baldwin Baldwin, IL 1,800 Coal Baseload MISO Havana Havana, IL 441 Coal Baseload MISO Hennepin Hennepin, IL 293 Coal Baseload MISO Wood River Units 4-5 Alton, IL 446 Coal Baseload MISO CoalCo TOTAL 2,980 Gas Casco Bay Veazie, ME 540 Gas - CCGT Intermediate ISO-NE Independence Scriba, NY 1,064 Gas - CCGT Intermediate NYISO Kendall Minooka, IL 1,200 Gas - CCGT Intermediate PJM Ontelaunee Ontelaunee Township, PA 580 Gas - CCGT Intermediate PJM Moss Landing Monterey County, CA Units 1-2 1,020 Gas - CCGT Intermediate CAISO Units 6-7 1,509 Gas Peaking CAISO Morro Bay Morro Bay, CA 650 Gas Peaking CAISO Oakland Oakland, CA 165 Oil Peaking CAISO Black Mountain Las Vegas, NV 43 Gas Baseload WECC GasCo TOTAL 6,771 TOTAL GENERATION 9,751 NOTES: Dynegy owns 100% of each unit listed, except that it owns a 50% interest in the Black Mountain facility. Total Net Capacity set forth in this table for Black Mountain includes only Dynegy’s proportionate share of such unit’s gross generating capacity. The list also does not include several facilities that are retired or in agreement to be sold. Those facilities include Havana 1-5 and Wood River 1-3 which are retired and out of operation; Morro Bay 1-2 which are in mothball status and out of operation; and Danskammer and Roseton, which were deconsolidated effective October 1, 2012 and are under agreement to be sold. Unit capabilities are based on winter capacity. |
|
|
Anticipated Capital Expenditures (2013–2015)(1) ($MM) 2013 2014 2015 Maintenance – Coal facilities $35 $48 $50 Maintenance – Gas facilities $59 $51 $61 Environmental $10 $9 $11 Corporate $4 $1 $1 Capitalized Interest $1 $1 $1 Discretionary $2 - - TOTAL CapEx $111 $110 $124 36 “Environmental” primarily consists of regular maintenance and FGD waste landfill Coal facility maintenance is relatively stable over time Maintenance – Gas facilities is largely a function of run-time and starts Future outages could be rescheduled (1) Does not include potential CapEx related to proposed acquisition of Ameren Energy Resources. |
|
|
Environmental Control Technologies Acid Gases Mercury Particulates CAPP NAPP or Lignite coal PRB coal Control Wet Flue Gas Desulfurization (FGD or scrubber) Dry FGD with particulate control Dry sorbent injection (DSI) Ultra low sulfur coal Activated carbon injection (ACI) or CaBr Electrostatic Precipitator (ESP) Fabric Filters (FF) or Baghouse Implementation time (1) 3 – 4 years 2- 3 years 9-12 months N/A 12-18 months 3 – 4 years 2 -4 years Average Capital Costs (2) $702/kW $601/kW $41/kW N/A $27/kW $70/kW $366/kW 37 How Dynegy complies Acid Gases Mercury Particulates Baldwin 1 Dry FGD ACI & CaBr ESP, FF Baldwin 2 Dry FGD ACI & CaBr ESP, FF Baldwin 3 Dry FGD ACI & CaBr ESP, FF Havana 6 Dry FGD ACI ESP, FF Hennepin 1-2 Ultra low sulfur coal ACI & CaBr ESP, FF Wood River 4 Ultra low sulfur coal ACI & CaBr ESP Wood River 5 Ultra low sulfur coal ACI & CaBr ESP (1) Source: Brattle Group, “Supply Chain and Outage Analysis of MISO Coal Retrofits for MATS”, May 2012; (2) EPA, EIA. |
|
|
Tolling Agreements Plant Contract Type Size (MW) Tenor Moss Landing 6&7 Tolling Agreement 1,509 Through 2013 Oakland RMR 165 Through Dec-2013 Independence Steam & Energy 44 Through Jan-2017 Kendall Tolling Agreement 50-85 Through Sep-2017 Capacity / Resource Adequacy Plant Contract Type Clearing Price (1) Size (MW) Tenor Casco Bay ISO-NE Capacity Auction $2.95/kw-mo 410 Jun-2012 to May-2013 $2.34/kw-mo 488 Jun-2013 to May-2014 $3.21/kw-mo 435 Jun-2014 to May-2015 $3.43/kw-mo 445 Jun-2015 to May-2016 Kendall PJM Capacity Auction $16.46/MW-day 1,019 Jun-2012 to May-2013 $27.73/MW-day 1,008 Jun-2013 to May-2014 $125.99/MW-day 1,016 Jun-2014 to May-2015 $136.00/MW-day 1,033 Jun-2015 to May 2016 Ontelaunee PJM Capacity Auction $133.37/MW-day 503 Jun-2012 to May-2013 $226.15/MW-day 504 Jun-2013 to May-2014 $136.50/MW-day 492 Jun-2014 to May-2015 $167.46/MW-day 503 Jun -2015 to May 2016 Moss Landing 1&2 RA Capacity 321 Avg Bilateral Sold 2013 25 Avg Bilateral Sold 2014 Independence ICAP - Con Ed 740 Through Oct-2014 Gas Segment: Tolling, Capacity and Other (1) Publicly disclosed clearing prices have been added where applicable. 38 |
|
|
39 (1) Source: MISO, Ventyx and Dynegy Analysis Expected Retirements by Region (MWs) Expected MISO Net Retirements(1) 6,500 MW of gas fired capacity coming online during the period with 2,300 MW in early development An additional 1,700 MW of other capacity additions likely with 180 MW in early development 21,000 MW of Retirements already announced An additional 2,800 MW likely to retire in 2015 due to MATS 1,500 MW of coal additions including a second 800 MW Prairie State unit 545 MW likely CC/CT Gas additions 12,500 MW of retirements, including 5,500 already announced Majority of retirements take place in 2015-2016 as MATS rules take effect 170 MW of nuclear uprates 1,800 MW of retirements announced, including Danskammer Excludes possible retirement of Indian Point Expected PJM Net Retirements(1) Expected NYISO Net Retirements(1) Likely Additions Likely Retirements Likely Additions Likely Retirements Likely Additions Likely Retirements |
|
|
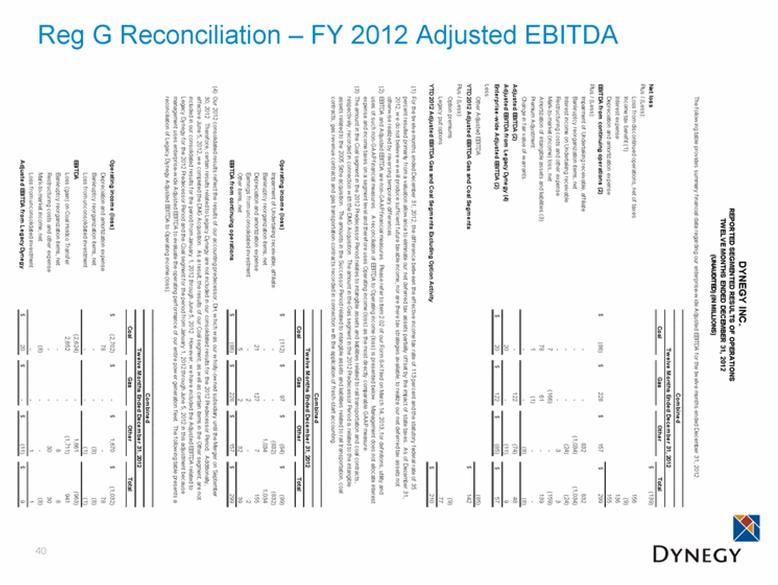
40 Reg G Reconciliation – FY 2012 Adjusted EBITDA Coal Gas Other Total Net loss (139) $ Plus / (Less): Loss from discontinued operations, net of taxes 156 Income tax benefit (1) (9) Interest expense 136 Depreciation and amortization expense 155 EBITDA from continuing operations (2) (86) $ 228 $ 157 $ 299 $ Plus / (Less): Impairment of Undertaking receivable, affiliate - - 832 832 Bankruptcy reorganization items, net - - (1,034) (1,034) Interest income on Undertaking receivable - - (24) (24) Restructuring costs and other expense - - 3 3 Mark-to-market (income) loss, net 7 (166) - (159) Amortization of intangible assets and liabilities (3) 78 61 - 139 Premium Adjustment 1 (1) - - Change in fair value of warrants - - (8) (8) Adjusted EBITDA (2) - 122 (74) 48 Adjusted EBITDA from Legacy Dynegy (4) 20 - (11) 9 Enterprise-wide Adjusted EBITDA (2) 20 $ 122 $ (85) $ 57 $ Less: Other Adjusted EBITDA (85) YTD 2012 Adjusted EBITDA Gas and Coal Segments 142 $ Plus / (Less): Option premiums (9) Legacy put options 77 YTD 2012 Adjusted EBITDA Gas and Coal Segments Excluding Option Activity 210 $ (1) (2) (3) Coal Gas Other Total Operating income (loss) (112) $ 97 $ (84) $ (99) $ Impairment of Undertaking receivable, affiliate - - (832) (832) Bankruptcy reorganization items, net - - 1,034 1,034 Depreciation and amortization expense 21 127 7 155 Earnings from unconsolidated investment - 2 - 2 Other items, net 5 2 32 39 EBITDA from continuing operations (86) $ 228 $ 157 $ 299 $ (4) Coal Gas Other Total Operating income (loss) (2,702) $ - $ 1,670 $ (1,032) $ Depreciation and amortization expense 78 - - 78 Bankruptcy reorganization items, net - - (8) (8) Loss from unconsolidated investment - - (1) (1) EBITDA (2,624) - 1,661 (963) Loss (gain) on Coal Holdco Transfer 2,652 - (1,711) 941 Bankruptcy reorganization items, net - - 8 8 Restructuring costs and other expense - - 30 30 Mark-to-market income, net (8) - - (8) Loss from unconsolidated investment - - 1 1 Adjusted EBITDA from Legacy Dynegy 20 $ - $ (11) $ 9 $ For the twelve months ended December 31, 2012, the difference between the effective income tax rate of 113 percent and the statutory federal rate of 35 percent resulted primarily from a valuation allowance to eliminate our net deferred tax assets partially offset by the impact of state taxes. As of December 31, 2012, we do not believe we will produce sufficient future taxable income, nor are there tax strategies available, to realize our net deferred tax assets not otherwise realized by reversing temporary differences. The amount in the Coal segment in the 2012 Predecessor Period relates to intangible assets and liabilities related to rail transportation and coal contracts, respectively, recorded in connection with the DMG Acquisition. The amount in the Gas segment in the 2012 Predecessor Period is related to the intangible assets related to the 2005 Sithe acquisition. The amounts in the Successor Period related to intangible assets and liabilities related to rail transportation, coal contracts, gas revenue contracts and gas transportation contracts recorded in connection with the application of fresh-start accounting. EBITDA and Adjusted EBITDA are non-GAAP financial measures. Please refer to Item 2.02 of our Form 8-K filed on March 14, 2013, for definitions, utility and uses of such non-GAAP financial measures. A reconciliation of EBITDA to Operating income (loss) is presented below. Management does not allocate interest expense and income taxes on a segment level and therefore uses Operating income (loss) as the most directly comparable GAAP measure. Combined Combined DYNEGY INC. REPORTED SEGMENTED RESULTS OF OPERATIONS TWELVE MONTHS ENDED DECEMBER 31, 2012 (UNAUDITED) (IN MILLIONS) Twelve Months Ended December 31, 2012 The following table provides summary financial data regarding our enterprise-wide Adjusted EBITDA for the twelve months ended December 31, 2012: Our 2012 consolidated results reflect the results of our accounting predecessor, DH, which was our wholly-owned subsidiary until the Merger on September 30, 2012. Therefore, certain results related to Legacy Dynegy are not included in our consolidated results for the 2012 Predecessor Period. Additionally, effective June 5, 2012, we completed the DMG Acquisition. As a result, the results of our Coal segment, as well as certain items in the Other segment, are not included in our consolidated results for the period from January 1, 2012 through June 5, 2012. However, we have included the Adjusted EBITDA related to Legacy Dynegy for the 2012 Predecessor Period and the Coal segment for the period from January 1, 2012 through June 5, 2012 in this adjustment because management uses enterprise-wide Adjusted EBITDA to evaluate the operating performance of our entire power generation fleet. The following table presents a reconciliation of Legacy Dynegy Adjusted EBITDA to Operating income (loss): Twelve Months Ended December 31, 2012 Twelve Months Ended December 31, 2012 Combined |
|
|
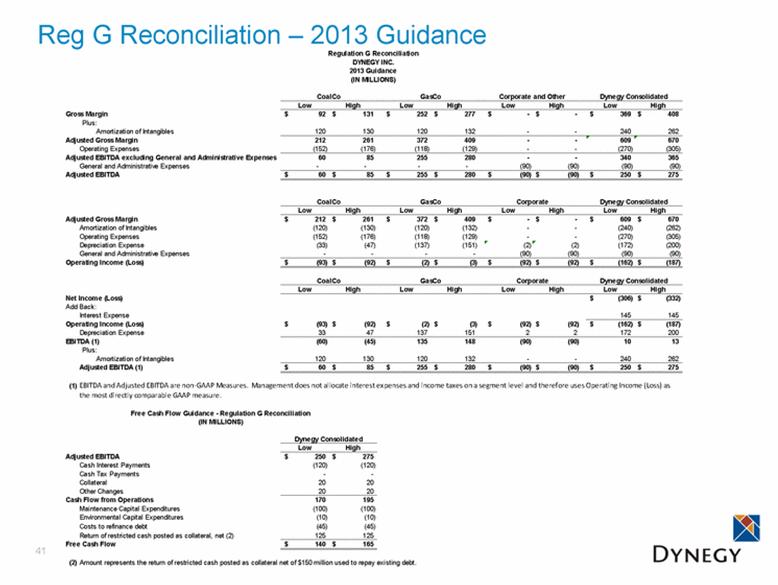
41 Reg G Reconciliation – 2013 Guidance Low High Low High Low High Low High Gross Margin 92 $ 131 $ 252 $ 277 $ - $ - $ 369 $ 408 $ Plus: Amortization of Intangibles 120 130 120 132 - - 240 262 Adjusted Gross Margin 212 261 372 409 - - 609 670 Operating Expenses (152) (176) (118) (129) - - (270) (305) Adjusted EBITDA excluding General and Administrative Expenses 60 85 255 280 - - 340 365 General and Administrative Expenses - - - - (90) (90) (90) (90) Adjusted EBITDA 60 $ 85 $ 255 $ 280 $ (90) $ (90) $ 250 $ 275 $ Low High Low High Low High Low High Adjusted Gross Margin 212 $ 261 $ 372 $ 409 $ - $ - $ 609 $ 670 $ Amortization of Intangibles (120) (130) (120) (132) - - (240) (262) Operating Expenses (152) (176) (118) (129) - - (270) (305) Depreciation Expense (33) (47) (137) (151) (2) (2) (172) (200) General and Administrative Expenses - - - - (90) (90) (90) (90) Operating Income (Loss) (93) $ (92) $ (2) $ (3) $ (92) $ (92) $ (162) $ (187) $ Low High Low High Low High Low High Net Income (Loss) (306) $ (332) $ Add Back: Interest Expense 145 145 Operating Income (Loss) (93) $ (92) $ (2) $ (3) $ (92) $ (92) $ (162) $ (187) $ Depreciation Expense 33 47 137 151 2 2 172 200 EBITDA (1) (60) (45) 135 148 (90) (90) 10 13 Plus: Amortization of Intangibles 120 130 120 132 - - 240 262 Adjusted EBITDA (1) 60 $ 85 $ 255 $ 280 $ (90) $ (90) $ 250 $ 275 $ (1) Low High Adjusted EBITDA 250 $ 275 $ Cash Interest Payments (120) (120) Cash Tax Payments - - Collateral 20 20 Other Changes 20 20 Cash Flow from Operations 170 195 Maintenance Capital Expenditures (100) (100) Environmental Capital Expenditures (10) (10) Costs to refinance debt (45) (45) Return of restricted cash posted as collateral, net (2) 125 125 Free Cash Flow 140 $ 165 $ (2) Dynegy Consolidated EBITDA and Adjusted EBITDA are non-GAAP Measures. Management does not allocate interest expenses and income taxes on a segment level and therefore uses Operating Income (Loss) as the most directly comparable GAAP measure. Dynegy Consolidated Corporate GasCo Amount represents the return of restricted cash posted as collateral net of $150 million used to repay existing debt. Regulation G Reconciliation DYNEGY INC. 2013 Guidance (IN MILLIONS) Dynegy Consolidated CoalCo GasCo Corporate and Other Dynegy Consolidated CoalCo GasCo Corporate Free Cash Flow Guidance - Regulation G Reconciliation (IN MILLIONS) CoalCo |