Attached files
| file | filename |
|---|---|
| 8-K - CURRENT REPORT ON FORM 8-K - US ECOLOGY, INC. | usecology_8k.htm |
Exhibit 99.1

Investor Presentation March 2013

During the course of this presentation the Company will be making forward - looking statements (as such term is defined in the Private Securities Litigation Reform Act of 1995 ) that are based on our current expectations, beliefs and assumptions about the industry and markets in which US Ecology, Inc . and its subsidiaries operate . Because such statements include risks and uncertainties, actual results may differ materially from what is expressed herein and no assurance can be given that the Company will meet its 2013 earnings estimates, successfully execute its growth strategy, or declare or pay future dividends . For information on other factors that could cause actual results to differ materially from expectations, please refer to US Ecology, Inc . ’s December 31 , 2012 Annual Report on Form 10 - K and other reports filed with the Securities and Exchange Commission . Many of the factors that will determine the Company’s future results are beyond the ability of management to control or predict . Participants should not place undue reliance on forward - looking statements, reflect management’s views only as of the date hereof . The Company undertakes no obligation to revise or update any forward - looking statements, or to make any other forward - looking statements, whether as a result of new information, future events or otherwise . Important assumptions and other important factors that could cause actual results to differ materially from those set forth in the forward - looking information include a loss of a major customer or contract, compliance with and changes to applicable laws, rules, or regulations, access to cost effective transportation services, access to insurance, surety bonds and other financial assurances, loss of key personnel, lawsuits, labor disputes, adverse economic conditions, government funding or competitive pressures, incidents or adverse weather conditions that could limit or suspend specific operations, implementation of new technologies, market conditions, average selling prices for recycled materials, our ability to replace business from recently completed large projects, our ability to perform under required contracts, our ability to permit and contract for timely construction of new or expanded disposal cells, our willingness or ability to pay dividends and our ability to effectively close and integrate future acquisitions . Safe Harbor 2

Company Snapshot US Ecology is a leading facilities - based environmental services company that has provided essential waste management and recycling solutions t o industry and government for over 60 years 3 Broad, North American service offering Unique and irreplaceable site assets Robust waste permits Diverse , blue chip customer base Solid financial performance ▪ 2012 revenue: $169 million ▪ 2012 Adjusted EPS 1 : $1.39 (Adj. EBITDA 1 $58 million) ▪ 2013 estimated EPS $1.45 - 1.55 (Adj. EBITDA 1 $62 - 65M) 14.6% return on invested capital 24.2% return on equity Strong balance sheet Attractive dividend yield of nearly 3% 1 Adj. EPS and Adj. EBITDA are non - GAAP measures. For a calculation and reconciliation to GAAP financial amounts see the appendices to this presentation or filings with SEC.

Refineries Chemicals General manufacturing Petrochemicals EPA Superfund sites cleanups Department of Defense, including chemical demilitarization Private cleanups Commercial real estate redevelopment Public utilities Aerospace Overview of Primary Markets 4 Radioactive Waste Market Hazardous Waste Market Public utilities (nuclear power plants) Fuel fabrication facilities Precious metals processing & refining Manhattan Project clean - up (via Army Corps of Engineers FUSRAP ) Department of Defense (military base closures) Oilfield NORM EPA Superfund site cleanups Radioactive waste processors / brokers Government research facilities 1. Environmental Business Journal Growing $9 billion 1 market Provides treatment, disposal & recycling services for generators of RCRA, CERCLA, TSCA and state regulated wastes Four LLRW landfills for Class A,B and or C waste; compact system limits competition Low activity radioactive waste disposed at certain RCRA hazardous waste sites
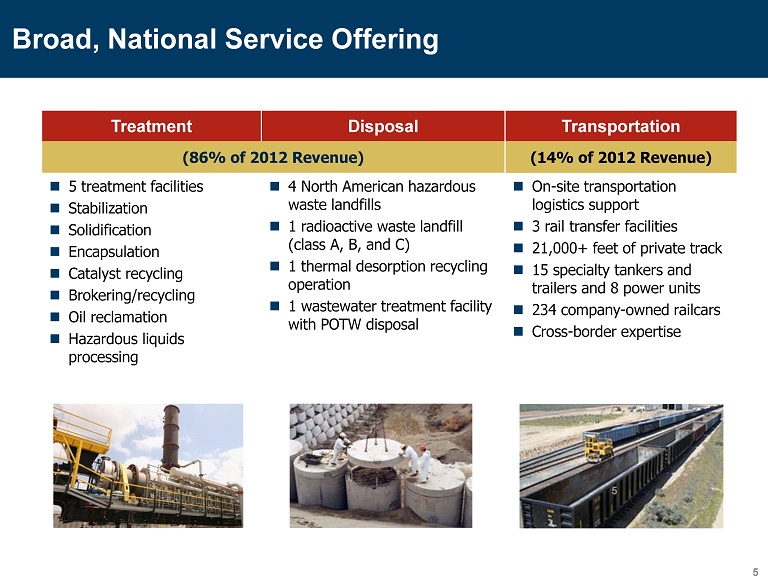
Broad, National Service Offering Treatment Disposal Transportation (86% of 2012 Revenue) ( 14% of 2012 Revenue) 5 treatment facilities Stabilization Solidification Encapsulation Catalyst recycling Brokering /recycling Oil reclamation Hazardous liquids processing 4 North American hazardous waste landfills 1 radioactive waste landfill (class A, B, and C) 1 thermal desorption recycling operation 1 wastewater treatment facility with POTW disposal On - site t ransportation logistics support 3 rail transfer facilities 21,000+ feet of private track 15 specialty tankers and trailers and 8 power units 234 company - owned railcars Cross - border expertise 5 5
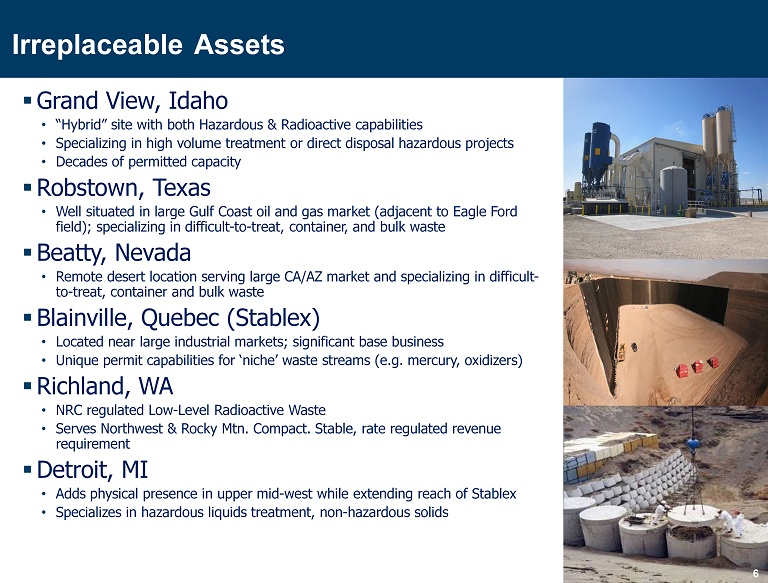
Irreplaceable Assets 6 ▪ Grand View, Idaho • “Hybrid” site with both Hazardous & Radioactive capabilities • Specializing in high volume treatment or direct disposal hazardous projects • Decades of permitted capacity ▪ Robstown, Texas • Well situated in large Gulf Coast oil and gas market (adjacent to Eagle Ford field); specializing in difficult - to - treat, container, and bulk waste ▪ Beatty, Nevada • Remote desert location serving large CA/AZ market and specializing in difficult - to - treat, container and bulk waste ▪ Blainville, Quebec (Stablex) • Located near large industrial markets; significant base business • Unique permit capabilities for ‘niche’ waste streams (e.g. mercury, oxidizers) ▪ Richland, WA • NRC regulated Low - Level Radioactive Waste • Serves Northwest & Rocky Mtn. Compact. Stable, rate regulated r evenue requirement ▪ Detroit, MI • Adds physical presence in upper mid - west while extending reach of Stablex • Specializes in hazardous liquids treatment, non - hazardous solids
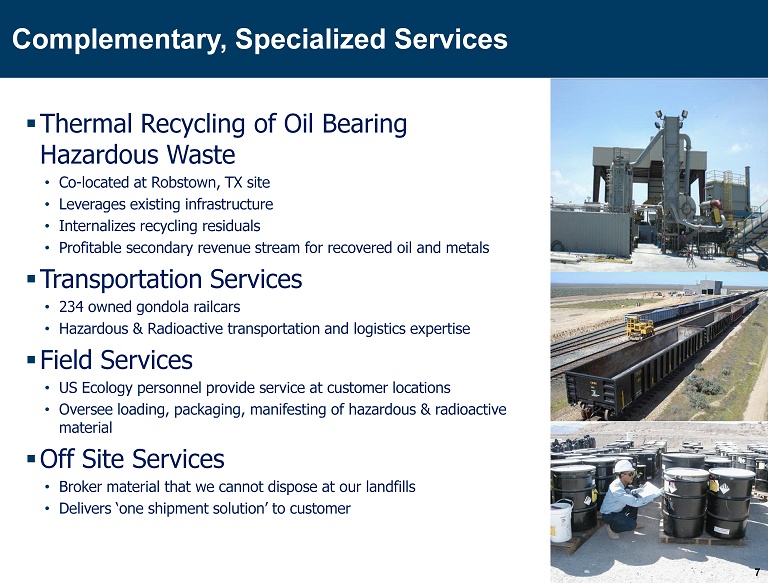
Complementary , Specialized Services 7 ▪ Thermal Recycling of Oil Bearing Hazardous Waste • Co - located at Robstown, TX site • Leverages existing infrastructure • Internalizes recycling residuals • Profitable secondary revenue stream for recovered oil and metals ▪ Transportation Services • 234 owned gondola railcars • Hazardous & Radioactive transportation and logistics expertise ▪ Field Services • US Ecology personnel provide service at customer locations • Oversee loading, packaging, manifesting of hazardous & radioactive material ▪ Off Site Services • Broker material that we cannot dispose at our landfills • Delivers ‘one shipment solution’ to customer

Diverse Markets and Customers ▪ Key End - Markets • Refineries, chemical and petro - chemical production, heavy manufacturers, electric utilities, steel mills, waste brokers, and government entities/agencies ▪ Base Business 65% of 2012 Revenue 2 • Base business is recurring in nature • Strong customer retention ▪ Diverse Customer Base • Largest account was 6% of 2012 revenue • Top 10 < 35% 8 Broker 51% Rate Regulated 4% Government 12 % Refinery 9 % Private Cleanup 6 % Other Industry 18% T&D Revenue 1 1. T&D Revenue for the year ended December 31, 2012 2. Excludes US Ecology Michigan
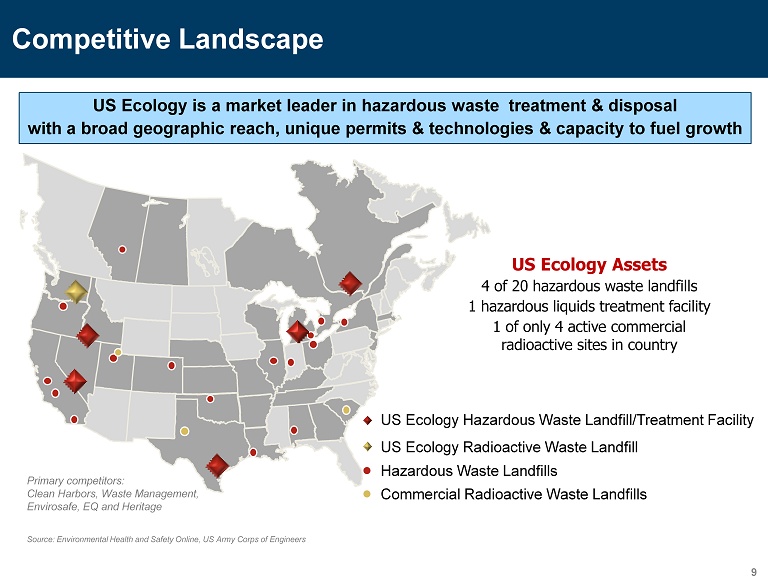
US Ecology is a market leader in hazardous waste treatment & disposal with a broad geographic reach, unique permits & technologies & capacity to fuel growth Competitive Landscape 9 Source: Environmental Health and Safety Online, US Army Corps of Engineers US Ecology Assets 4 of 20 hazardous waste landfills 1 hazardous liquids treatment facility 1 of only 4 active commercial radioactive sites in country Hazardous Waste Landfills Commercial Radioactive Waste Landfills US Ecology Hazardous Waste Landfill/Treatment Facility US Ecology Radioactive Waste Landfill Primary competitors: Clean Harbors, Waste Management, Envirosafe, EQ and Heritage

Growth Plan Leverage Regulatory Expertise Expand current permit capabilities Seek new permits for service expansion Capitalize on evolving regulatory environment Cross - border, import - export expertise Pursue Complementary Acquisitions Expand geographic footprint Increase service offerings Complement existing facilities Strategically move up and across service value chain; permitted, green & recycling operations Add rail served or transfer facilities Fixed facility bias Build on Robust Waste Handling Infrastructure Introduce new treatment technologies Maximize throughput at all facilities Develop low cost airspace Utilize company - owned rail assets Expand thermal recycling 10 Execute on Marketing Initiatives Target high margin, niche waste streams Develop new markets Develop new services Drive volumes to harvest inherent operating leverage Build base business Increase win rate on clean - up project pipeline Generate sustainable increases in EPS and cash flow

Opportunities Along the Environmental Services Continuum Low High Technical Services Emergency Response Remedial Construction Packaging & Collection Brokering Transportation Beneficial Re - use Thermal Recycling Incineration Treatment & Disposal US Ecology is focused on filling in service gaps across the value chain and leveraging core competencies to service generators of regulated and specialty waste Service Offered by US Ecology Field / On - Site Services 11 Service Not Offered by US Ecology Beyond the 3.5 million tons of hazardous waste disposed annually at landfills… Large volumes of waste are processed at solid & liquid treatment facilities (permitted TSDFs), deep wells, waste water treatment plants, etc. O pportunities exist in collection, transportation, remediation, packaging and interim storage of hazardous waste
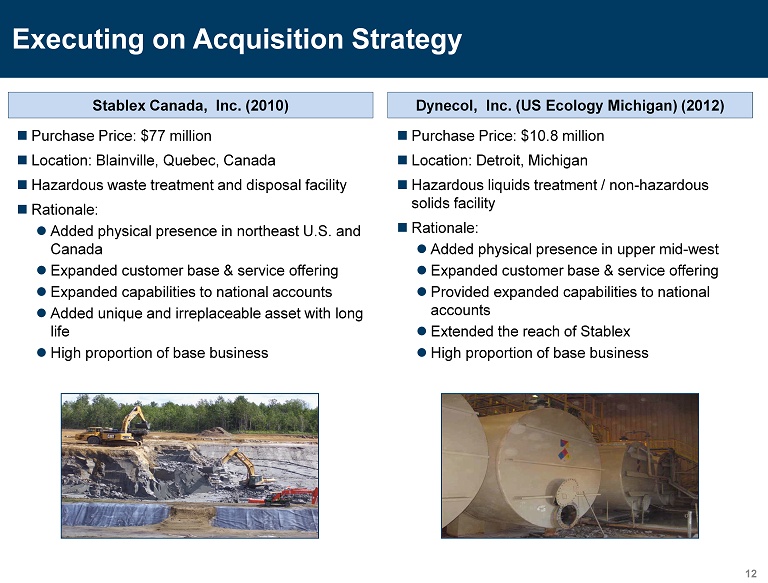
Executing on Acquisition Strategy 12 Stablex Canada, Inc. (2010) Dynecol, Inc. (US Ecology Michigan) (2012) Purchase Price: $77 million Location: Blainville, Quebec, Canada Hazardous waste treatment and disposal facility Rationale: Added physical presence in northeast U.S. and Canada Expanded customer base & service offering Expanded capabilities to national accounts Added unique and irreplaceable asset with long life High proportion of base business Purchase Price: $10.8 million Location: Detroit, Michigan Hazardous liquids treatment / non - hazardous solids facility Rationale: Added physical presence in upper mid - west Expanded customer base & service offering Provided expanded capabilities to national accounts Extended the reach of Stablex High proportion of base business
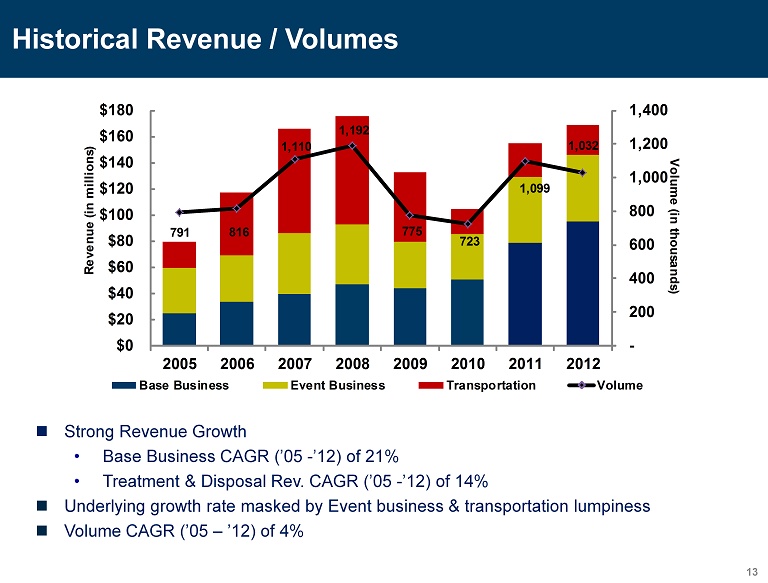
Historical Revenue / Volumes Strong Revenue Growth • Base Business CAGR (’05 - ’12) of 21% • Treatment & Disposal Rev. CAGR (’05 - ’12) of 14% Underlying growth rate masked by Event business & transportation lumpiness Volume CAGR (’05 – ’12) of 4% 13 791 816 1,110 1,192 775 723 1,099 1,032 - 200 400 600 800 1,000 1,200 1,400 $0 $20 $40 $60 $80 $100 $120 $140 $160 $180 2005 2006 2007 2008 2009 2010 2011 2012 Volume (in thousands) Revenue (in millions) Base Business Event Business Transportation Volume

1 Adj. EBITDA is a non - GAAP measure. For a calculation and reconciliation to GAAP financial amounts see the appendices to this presentation or filings with SEC. Adj. EBITDA and Operating Income margins calculated as a percent of T&D revenue. 2012 Highlights 14 44.9% 47.3% 48.1% 48.0% 40.4% 35.8% 38.6% 40.0% 0.0% 10.0% 20.0% 30.0% 40.0% 50.0% 60.0% $- $10 $20 $30 $40 $50 $60 $70 2005 2006 2007 2008 2009 2010 2011 2012 in millions Adj. EBITDA 1 Adj. EBITDA Adj. EBITDA T&D Margin 32.5% 35.4% 36.0% 37.1% 29.1% 23.8% 25.1% 27.9% 0.0% 10.0% 20.0% 30.0% 40.0% $ - $10 $20 $30 $40 $50 2005 2006 2007 2008 2009 2010 2011 2012 in millions Operating Income Operating Income Operating Income T&D Margin ▪ Strong operating income g rowth − 26% growth in 2012 over 2011 − 11% CAGR 2005 - 2012 ▪ Industry leading margins of 28% improving with business conditions ▪ Strong Adj. EBITDA growth − 17% growth in 2012 over 2011 − 12% CAGR from 2005 - 2012 ▪ Industry leading margins of 40% ▪ Strong cash flow to support organic growth initiatives, acquisitions and return of capital to shareholders (i.e. dividend)

▪ EPS to range from $1.45 to $1.55 1 • Guidance reflects more diverse customer base, geography and service mix • Growing diversity powers earnings and improves sustainability ▪ Adjusted EBITDA to range from $62 million to $65 million ▪ T&D disposal margin expected to range between 43% and 45% ▪ Expect Capital Expenditures to range from $22 to $23 million • Includes approximately $3.4 million carryover projects from 2012 • New landfill construction at multiple facilities is largest investment • Land acquisition, ongoing infrastructure upgrades and equipment replacement at operating facilities also planned 2013 Business Outlook: Financial 1 Guidance excludes foreign currency translation gains or losses 15

▪ Strategy: Build on our successes in 2011 & 2012 • Drive organic growth with increased market penetration and expanded service offering – keep taking market share • Operational Excellence - Flawless execution • Expand asset base through acquisitions via a hub & spoke model • Ongoing commitment to Health, Safety & Compliance ▪ Continued revenue & EBITDA growth projected in 2013 • Base Business growth expected to continue • Event Business looks strong with multiple clean - up projects under contract and shipping • Thermal recycling business expected to grow from 2012 with regulatory requirements clarified Business Outlook: Strategy & 2013 Outlook 16

▪ Unique and irreplaceable set of disposal assets ▪ High barriers to entry ▪ Highly leveragable business model with earnings upside ▪ Experienced management team ▪ Return on invested capital: 14.6% TTM ▪ Attractive dividend yield at approximately 3% ▪ Strong balance sheet with available borrowing capacity ▪ Acquisitions part of future growth strategy 17 US Ecology Investment Highlights

18 Appendix

19 Appendix: Adjusted EBITDA & EPS Non - GAAP Results and Reconciliation US Ecology reports adjusted EBITDA and adjusted earnings per diluted share results, which are non - GAAP financial measures, as a complement to results provided in accordance with generally accepted accounting principles in the United States (GAAP) and believes that such information provides analysts, shareholders, and other users information to better understand the Company’ s operating performance. Because adjusted EBITDA and adjusted earnings per diluted share are not measurements determined in accordance with GAAP and are thus susceptible to varying calculations they may not be comparable to similar measures used by other companies. Items excluded from adjusted EBITDA and adjusted earnings per diluted share are significant components in understanding and assessing financial performance. Adjusted EBITDA and adjusted earnings per diluted share should not be considered in isolation or as an alternative to, or sub sti tute for, net income, cash flows generated by operations, investing or financing activities, or other financial statement data pre sen ted in the consolidated financial statements as indicators of financial performance or liquidity. Adjusted EBITDA and adjusted earn ing s per diluted share have limitations as analytical tools and should not be considered in isolation or a substitute for analyzin g o ur results as reported under GAAP. Some of the limitations are: - Adjusted EBITDA does not reflect changes in, or cash requirements for, our working capital needs; - Adjusted EBITDA does not reflect our interest expense, or the requirements necessary to service interest or principal payments on our debt; - Adjusted EBITDA does not reflect our income tax expenses or the cash requirements to pay our taxes; - Adjusted EBITDA does not reflect our cash expenditures or future requirements for capital expenditures or contractual commitments; and - although depreciation and amortization charges are non - cash charges, the assets being depreciated and amortized will often have to be replaced in the future, and Adjusted EBITDA does not reflect cash requirements for such replacements.

20 Appendix: Adjusted EBITDA (in thousands) 2012 2011 Net Income 25,659$ 18,370$ Income tax expense 16,059 11,437 Interest expense 878 1,604 Interest income (17) (26) Foreign currency (gain)/loss (1,213) 1,321 Other income (728) (341) Depreciation and amortization of plant and equipment 13,916 13,933 Amortization of intangibles 1,469 1,419 Stock-based compensation 846 837 Accretion and non-cash adjustments of closure & post-closure liabilities 1,483 1,295 Adjusted EBITDA 58,352$ 49,849$ For the Year Ended December 31, Adjusted EBITDA The Company defines Adjusted EBITDA as net income before interest expense, interest income, income tax expense, depreciation, amortization, stock based compensation, accretion of closure and post - closure liabilities, foreign currency gain/loss and other income/expense, which are not considered part of usual business operations. The following reconciliation itemizes the differ enc es between reported net income and Adjusted EBITDA for the Year ended December 31, 2012 and 2011:
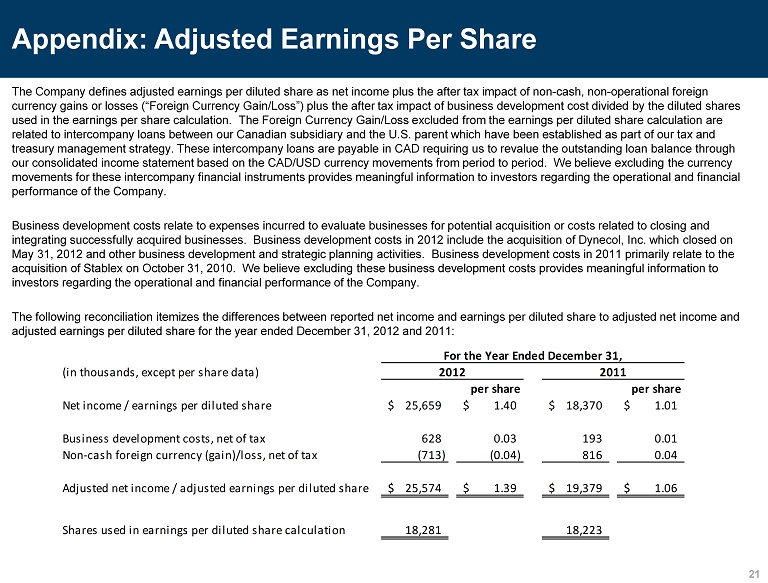
21 Appendix: Adjusted Earnings Per Share The Company defines adjusted earnings per diluted share as net income plus the after tax impact of non - cash, non - operational for eign currency gains or losses (“Foreign Currency Gain/Loss”) plus the after tax impact of business development cost divided by the di luted shares used in the earnings per share calculation. The Foreign Currency Gain/Loss excluded from the earnings per diluted share calc ula tion are related to intercompany loans between our Canadian subsidiary and the U.S. parent which have been established as part of our tax and treasury management strategy. These intercompany loans are payable in CAD requiring us to revalue the outstanding loan balanc e t hrough our consolidated income statement based on the CAD/USD currency movements from period to period. We believe excluding the cu rre ncy movements for these intercompany financial instruments provides meaningful information to investors regarding the operational an d financial performance of the Company. Business development costs relate to expenses incurred to evaluate businesses for potential acquisition or costs related to c los ing and integrating successfully acquired businesses. Business development costs in 2012 include the acquisition of Dynecol, Inc. wh ich closed on May 31, 2012 and other business development and strategic planning activities. Business development costs in 2011 primarily rel ate to the acquisition of Stablex on October 31, 2010. We believe excluding these business development costs provides meaningful inform ati on to investors regarding the operational and financial performance of the Company. The following reconciliation itemizes the differences between reported net income and earnings per diluted share to adjusted net income and adjusted earnings per diluted share for the year ended December 31, 2012 and 2011: (in thousands, except per share data) per share per share Net income / earnings per diluted share 25,659$ 1.40$ 18,370$ 1.01$ Business development costs, net of tax 628 0.03 193 0.01 Non-cash foreign currency (gain)/loss, net of tax (713) (0.04) 816 0.04 Adjusted net income / adjusted earnings per diluted share 25,574$ 1.39$ 19,379$ 1.06$ Shares used in earnings per diluted share calculation 18,281 18,223 For the Year Ended December 31, 2012 2011