Attached files
| file | filename |
|---|---|
| 8-K - 8-K - BROADWIND, INC. | a13-7655_18k.htm |
Exhibit 99.1
|
|
Roth 25th Annual Conference March 20, 2013 Peter Duprey, CEO |
|
|
Industry Data Disclaimer and Forward-Looking Statements Broadwind obtained the industry and market data used throughout this presentation from our own research, internal surveys and studies conducted by third parties, independent industry associations or general publications and other publicly available information. Independent industry publications and surveys generally state that they have obtained information from sources believed to be reliable, but do not guarantee the accuracy and completeness of such information. Forecasts are particularly likely to be inaccurate, especially over long periods of time. We are not aware of any misstatements in the industry data we have presented herein, but estimates involve risks and uncertainties and are subject to change based on various factors beyond our control. This presentation includes various forward-looking statements related to future, not past, events. Statements in this release that are not historical are forward-looking statements. These statements are based on current expectations and we undertake no obligation to update these statements to reflect events or circumstances occurring after this presentation. Such statements are subject to various risks and uncertainties that could cause actual results to vary materially from those stated. Such risks and uncertainties include, but are not limited to: expectations regarding our business, end-markets, relationships with customers and management’s ability to diversify our customer base; the impact of competition and economic volatility on many of the industries in which we compete; our ability to realize revenue from customer orders and backlog; the impact of regulation on end-markets, including the wind energy industry in particular; the sufficiency of our liquidity and working capital; our restructuring plans and the associated cost savings; the ability to preserve and utilize our tax net operating loss carry-forwards; and other risks and uncertainties described in our filings with the Securities and Exchange Commission. This document contains non-GAAP financial information. We believe that certain non-GAAP financial measures may provide users of this financial information meaningful comparisons between current results and results in prior operating periods. We believe that these non-GAAP financial measures can provide additional meaningful reflection of underlying trends of the business because they provide a comparison of historical information that excludes certain infrequently occurring or non-operational items that impact the overall comparability. Non-GAAP financial measures should be viewed in addition to, and not as an alternative for, our reported results prepared in accordance with GAAP. Please see our earnings release dated as of February 27, 2013 for a reconciliation of certain non-GAAP measures presented in this document. 2 |
|
|
Broadwind Today 3 Towers and Weldments Leading wind tower manufacturer Leveraging welding competencies in industrial markets Gearing 85 year history Precision gearing manufacturer, 1 meter and larger In-house heat treat capabilities Enclosed drives and loose gearing expertise Services Non-routine maintenance service on aging fleet of 45,000 wind turbines in US Core competency around drivetrain, blades, bearings and other large components 3.0 MW test stand to remanufacture and test gearboxes for wind and oil & gas industries Forecast for 2013 |
|
|
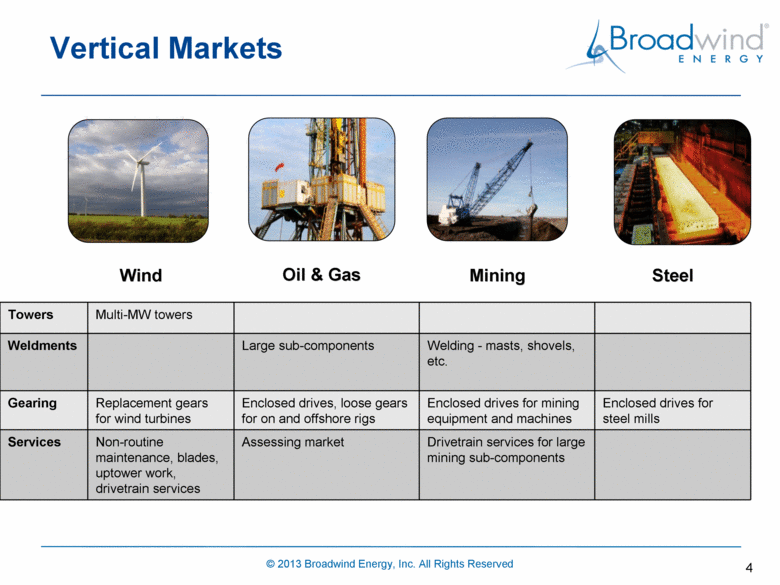
4 Wind Oil & Gas Mining Steel Vertical Markets Towers Multi-MW towers Weldments Large sub-components Welding - masts, shovels, etc. Gearing Replacement gears for wind turbines Enclosed drives, loose gears for on and offshore rigs Enclosed drives for mining equipment and machines Enclosed drives for steel mills Services Non-routine maintenance, blades, uptower work, drivetrain services Assessing market Drivetrain services for large mining sub-components |
|
|
Historical Cost of Wind Energy 5 Source: NREL Cost Curve, in Black & Veatch Report, October 2007 Wind energy cost per kWh has declined 90% since the early 1980s Over the past 10 years, wind represented 35% of new capacity brought on-line in the US Tower Supply and Demand in Better Balance 5 competitors have exited Significant tariffs imposed on subsidized Vietnamese and Chinese towers Multi-purpose facilities now being repurposed to other industries (railcar and fabrication) Data Source: AWEA U.S. Wind Industry Annual Market Report Year Ending 2011 Data Source: AWEA, Energy Information Administration, SEIA, SNL |
|
|
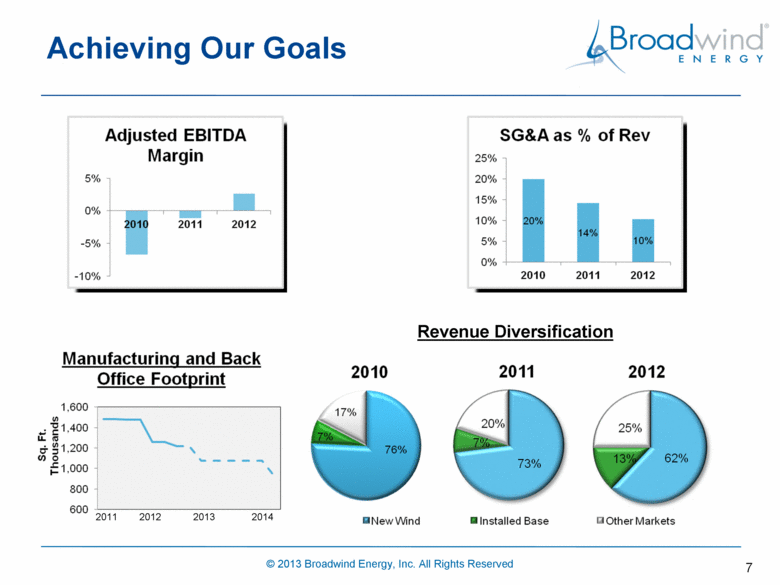
6 2 Years into a 4-Year Turnaround Initiative 1. Reduce manufacturing footprint and cost base 2. Diversify customers and industries 3. Improve financial flexibility Target Reduce by 40% or ~600K Sq. Ft. Target a 50/50 wind/industrial mix Become profitable; self-funded growth |
|
|
Achieving Our Goals 7 Revenue Diversification 2011 2012 2013 2014 |
|
|
Our Path to Profitability 8 *2015 depreciation will decline further by ~$2.5M |
|
|
3-Year Financial History 9 Significant improvement has been made in 2 years: Revenue up 54% GP% up 2.6 ppts Adj. EBITDA improved $15M 2010 EPS includes effect of ($3.84) EPS impairment expense and EPS of ($1.45) related to discontinued operations 2010 2011 2012 2013 E Revenue-$M 136.9 185.9 210.7 215-225 Gross Profit-$M 1.9 7.2 6.8 -% (ex. Restructuring) 1.4% 3.9% 4.0% Operating Expense-$M 71.2 27.6 24.1 -% (ex. Restructuring) 52.0% 14.6% 11.1% Adj. EBITDA-$M (9.2) (2.1) 5.5 9-12 EPS- $ (8.01) (1.89) (1.27) (.55) - (.75) |
|
|
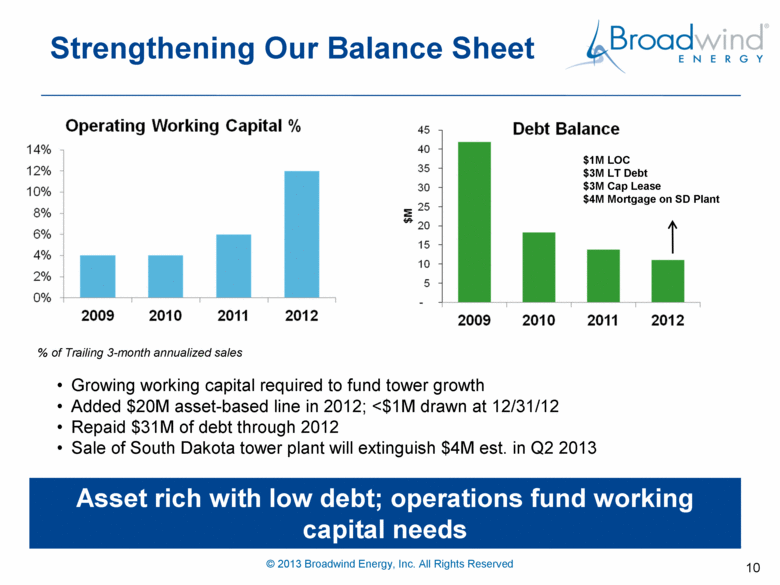
Strengthening Our Balance Sheet 10 Asset rich with low debt; operations fund working capital needs Growing working capital required to fund tower growth Added $20M asset-based line in 2012; <$1M drawn at 12/31/12 Repaid $31M of debt through 2012 Sale of South Dakota tower plant will extinguish $4M est. in Q2 2013 $1M LOC $3M LT Debt $3M Cap Lease $4M Mortgage on SD Plant % of Trailing 3-month annualized sales |
|
|
Building For Our Future Leverage core competencies Invest in continuous improvement Build customer intimacy Continue customer and industry diversification 11 |
|
|
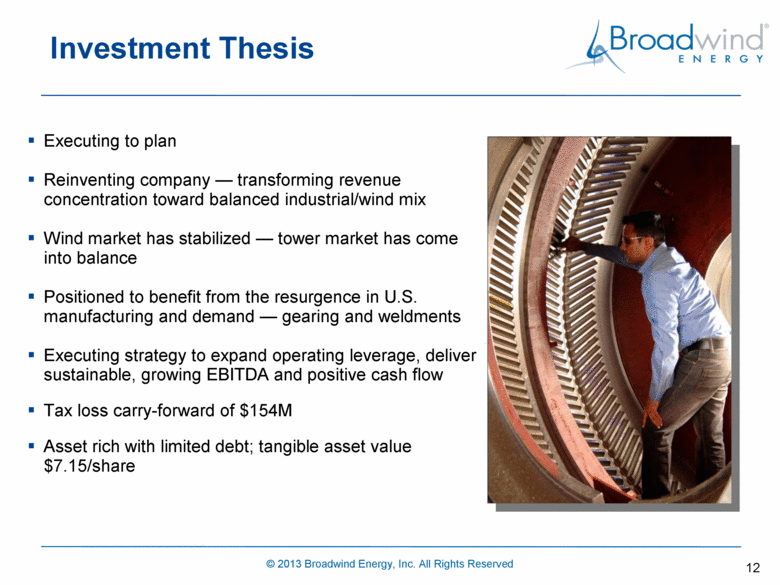
Investment Thesis Executing to plan Reinventing company — transforming revenue concentration toward balanced industrial/wind mix Wind market has stabilized — tower market has come into balance Positioned to benefit from the resurgence in U.S. manufacturing and demand — gearing and weldments Executing strategy to expand operating leverage, deliver sustainable, growing EBITDA and positive cash flow Tax loss carry-forward of $154M Asset rich with limited debt; tangible asset value $7.15/share 12 |
|
|
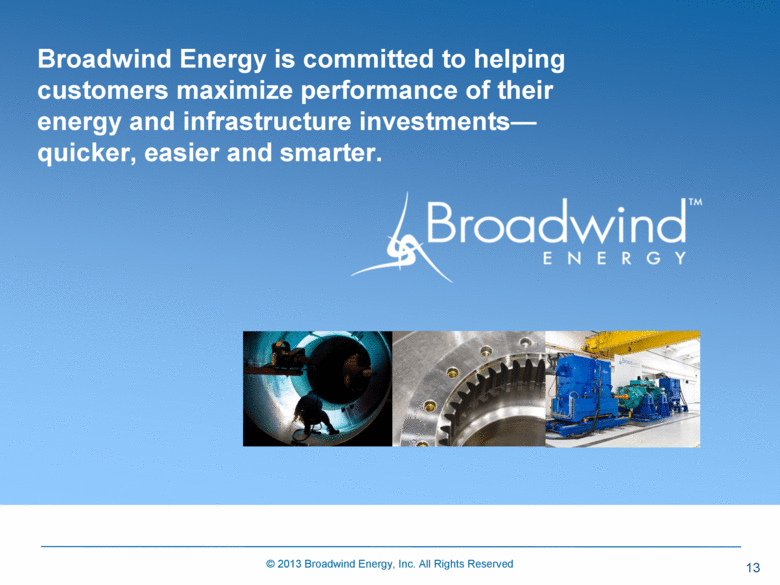
13 Broadwind Energy is committed to helping customers maximize performance of their energy and infrastructure investments— quicker, easier and smarter. |

