Attached files
| file | filename |
|---|---|
| 8-K - 8-K - Agiliti Health, Inc. | a13-7678_18k.htm |
| EX-99.1 - EX-99.1 - Agiliti Health, Inc. | a13-7678_1ex99d1.htm |
Exhibit 99.2
|
|
UHOS Q4 2012 Earnings Teleconference March 15, 2013 |
|
|
Safe Harbor Statement under the Private Securities Litigation Reform Act of 1995: Universal Hospital Services, Inc. believes statements in this presentation looking forward in time involve risks and uncertainties based on management’s current views and assumptions. Actual events may differ materially. Please refer to the cautionary statement regarding forward-looking statements and risk factors that appear in the Company’s Annual Report on Form 10-K for the year ended December 31, 2012, and other filings with the SEC, which can be accessed at www.UHS.com under “Financials.” This presentation contains non-GAAP measures as defined by SEC rules. Reconciliations of these measures to the most directly comparable GAAP measures are contained in the appendix. Forward Looking Statements 2 |
|
|
2012 Results (Adjusted EBITDA) $29.7 $28.8 2011 2012 $29.7 $34.7 $5.9 2012 Recap: Growth Drivers take center stage Asset360 Patient Handling Surgical Services Rental Headwinds $122.2 $118.0 2011 2012 $15.4 $140.8 $133.4 $18.6 4th Quarter Year-to-Date 3 Base + 3.5% Recall Gains |

|
|
What Sets UHS Apart: Trusted Advisors Our customer focus: How we do it: 4 |
|
|
Gateway Solutions Comprehensive Solutions Vertical Solutions “Solutions” Approach to Customers 5 Infusion Patient Handling Negative Pressure Wound Therapy |
|
|
Recently signed another “hospital system” Asset360 program serving 6 hospitals Implement over first 4 months of 2013 In a 360 setting, we become a trusted advisor within the hospital, leading to the welcome introduction of additional solutions 360 Solutions are the “Tip of the Spear” for Providing High Value Customer Solutions 360 Other Solutions 6 |
|
|
Comprehensive Solutions Evolution 7 Surgical Equipment Management NPWT Rental NPWT 360 |
|
|
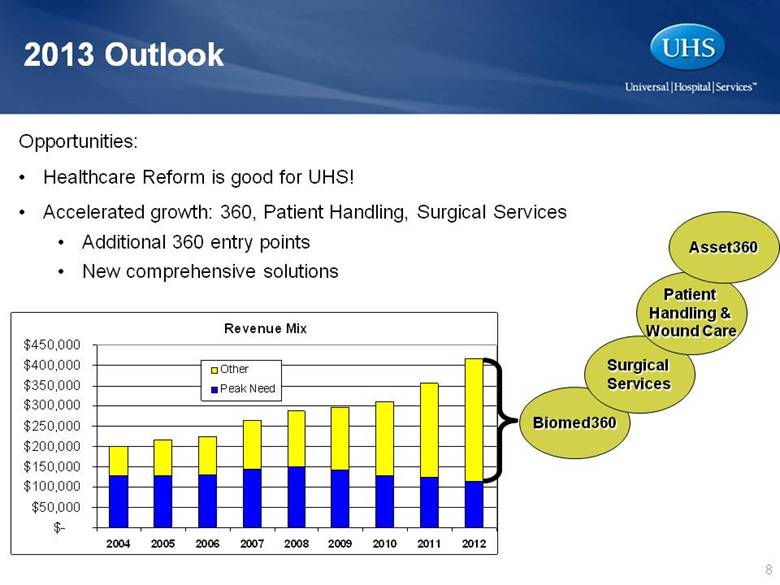
8 2013 Outlook Biomed360 Surgical Services Patient Handling & Wound Care Asset360 Opportunities: Healthcare Reform is good for UHS! Accelerated growth: 360, Patient Handling, Surgical Services Additional 360 entry points New comprehensive solutions Revenue Mix $- $50,000 $100,000 $150,000 $200,000 $250,000 $300,000 $350,000 $400,000 $450,000 2004 2005 2006 2007 2008 2009 2010 2011 2012 Other Peak Need |
|
|
Financial Review 4th Quarter 2012 |
|
|
Refer to Appendix for reconciliation of Gross Margin Pre-ASC 805 to Gross Margin & Historical Depreciation to Depreciation Medical Equipment Outsourcing RENTAL OF UHS-OWNED EQUIPMENT Supplemental (short-term) Long-Term Bariatrics: Suite of specialty equipment for obese patients Surgery: Suite of minimally invasive lasers RENTAL OF MANUFACTURER-OWNED EQUIPMENT ASSET360TM EQUIPMENT MANAGEMENT PROGRAM On-site management to drive better equipment utilization (UHS people, technology & processes) Trend Analysis 2011 and 2012 include Revenue, Cash Gross Margin and Gross Margin from the Surgical Services acquisition beginning April 1st 2011. In addition, Q4 2011 included $5.9 of recall gains. Momentum in our growth areas of Asset360™, Patient Handling, and Wound Therapy, as well as gains on recalled equipment offset continued weak Peak Need Rental caused by ongoing weak hospital admissions and acuity levels 10 * Includes recall gains of $0.0 and $5.9 for Q4 2012 and 2011, and $18.6 and $15.4 for YTD 2012 and 2011 (In millions) 2012 2011 % Chg 2012 2011 % Chg Revenues 76.1 $ 70.7 $ 7.6% 302.7 $ 275.9 $ 9.7% Cash Gross Margin Pre ASC 805* 43.8 47.1 -7.0% 196.9 182.9 7.7% % of Revenue 57.6% 66.6% 65.0% 66.3% Historical Depreciation (19.6) (17.6) (75.3) (67.9) Gross Margin Pre ASC 805* 24.2 $ 29.5 $ -18.0% 121.6 $ 115.0 $ 5.8% % of Revenue 31.8% 41.7% 40.2% 41.7% December YTD 4th Quarter |
|
|
Technical and Professional Services TECHNICAL SERVICES Maintain & Repair Customer owned Equipment: Non-resident, response based/ scheduled Biomedical Services Manufacturer Services BIOMED360TM EQUIPMENT MAINTENANCE PROGRAM Customizable on-site biomedical services program Refer to Appendix for reconciliation of Gross Margin Pre-ASC 805 to Gross Margin & Historical Depreciation to Depreciation Trend Analysis Will be “lumpy” going forward with large BioMed360 signings 11 (In millions) 2012 2011 % Chg 2012 2011 % Chg Revenues 19.7 $ 18.0 $ 9.4% 82.2 $ 54.1 $ 52.1% Cash Gross Margin Pre ASC 805 4.6 4.2 9.5% 20.5 13.9 47.5% % of Revenue 23.4% 23.4% 24.9% 25.8% Historical Depreciation (0.2) (0.1) (0.7) (0.4) Gross Margin Pre ASC 805 4.4 $ 4.1 $ 7.3% 19.8 $ 13.5 $ 46.2% % of Revenue 22.3% 22.8% 24.1% 25.1% 4th Quarter December YTD |
|
|
Medical Equipment Sales and Remarketing ASSET RECOVERY & EQUIPMENT BROKERAGE NEW EQUIPMENT SALES DISPOSABLE SALES Refer to Appendix for reconciliation of Gross Margin Pre-ASC 805 to Gross Margin & Historical Depreciation to Depreciation Trend Analysis Results in this segment will fluctuate based on equipment availability, transactional size and the transactional nature of the business 12 (In millions) 2012 2011 % Chg 2012 2011 % Chg Revenues 7.1 $ 7.2 $ -1.4% 30.4 $ 25.2 $ 20.6% Cash Gross Margin Pre ASC 805 1.7 1.7 0.0% 7.1 5.8 22.4% % of Revenue 23.9% 23.3% 23.4% 23.1% Historical Depreciation (0.1) (0.1) (0.4) (0.3) Gross Margin Pre ASC 805 1.6 $ 1.6 $ 0.0% 6.7 $ 5.5 $ 22.7% % of Revenue 22.5% 22.2% 22.2% 21.8% 4th Quarter December YTD |
|
|
$235 Bank Line (as of December 31) Liquidity Profile Remains Solid (Includes LOCs of $3) Borrowing Base = $202 13 (In millions) 7.625% Fixed Rate Notes $235 Revolver due 2017* * Pro forma for the call and redemption of $230 Floating Rate notes completed on March 14, 2013; excludes capital lease maturities Additional Commitment = $34 Available Liquidity = ~ $170 Used = ~ $31 Borrowing Base = $201 (Includes LOCs of $3) |
|
|
Leverage Trend Refer to Appendix for reconciliation of Adjusted EBIDTA to Cash Flow from Operations and pro forma calculation Note that our calculations include accrued interest for conservatism 14 Recap Recap Equity Payout 12/31/2012 12/31/2011 Floating Rate Notes 230.0 $ 230.0 $ PIK Toggle Notes - 405.0 Unamortized Bond Premium - 3.4 7.625% Notes 425.0 - Bank Line 28.0 14.5 Consolidated Capital Leases 16.0 18.2 Total Debt 699.0 671.1 Less: Cash On Hand - (1.2) Add: Accrued Interest 13.8 4.9 Net Debt 712.8 $ 674.8 $ Pro forma Adj EBITDA 141.3 $ 136.8 $ Leverage 5.0 4.9 UHS Debt Structure (In millions) |
|
|
2011 2012 2013 E Adjusted EBITDA Base: $118.0 Recall: $15.4 Total: $133.4 Pro forma: 136.8* Base: $122.2 Recall: $18.6 Total: $140.8 Pro forma: 141.3* $130 + / - (Recall: $0) Accrual CAPEX $80.2 $55.4 $70 + / - Year-end Leverage 4.9x* 5.0x* Mid to Upper 5’s Street Guidance for 2013 * Refer to later slide for pro forma calculations 15 (In millions) |
|
|
Selected Financial Data Consolidating Reconciliations EBITDA Reconciliation: 2011 & 2012 EBITDA Reconciliation: 2003 –2012 Selected Reconciliations Gross Margin Pre-ASC 805 to Gross Margin Depreciation and Amortization Reconciliation Other Reconciliations Appendix 16 |
|
|
Selected Financial Data 17 * Includes recall gains of $0.0 and $5.9 for Q4 2012 and 2011, and $18.6 and $15.4 for YTD 2012 and 2011 (In millions) 2012 2011 % Chg 2012 2011 % Chg Consolidated Revenues 102.9 $ 95.9 $ 7.3% 415.3 $ 355.2 $ 16.9% Cash Gross Margin Pre-ASC 805* 50.1 53.0 -5.5% 224.5 202.6 10.8% % of Revenues 48.7% 55.3% 54.1% 57.0% Historical Depreciation (19.9) (17.8) (76.4) (68.6) Gross Margin Pre-ASC 805 30.2 35.2 -14.2% 148.1 134.0 10.5% % of Revenues 29.3% 36.7% 35.7% 37.7% Cash SG&A 20.2 18.1 11.6% 82.9 68.8 20.5% % of Revenues 19.6% 18.9% 20.0% 19.4% Non Controlling Interest 0.2 0.2 0.8 0.4 % of Revenues 0.2% 0.2% 0.2% 0.1% Adjusted EBITDA* Actual 29.7 $ 34.7 $ -14.4% 140.8 $ 133.4 $ 5.5% Pro forma Acquisition Adjustment 0.5 3.4 Pro forma Adjusted EBITDA 141.3 $ 136.8 $ 4th Quarter December YTD |
|
|
Consolidating Reconciliations 18 * Includes recall gains of $0.0 and $18.6 for Q4 and YTD 2012 (In millions) Surgical Surgical Actual: UHS Services Total UHS Services Total Cash Gross Margin* 44.5 $ 5.6 $ 50.1 $ 201.6 $ 22.9 $ 224.5 $ Depreciation - Historical (18.3) (1.6) (19.9) (71.3) (5.1) (76.4) Gross Margin Pre ASC 805 26.2 4.0 30.2 130.3 17.8 148.1 Adj Cash SGA 17.7 2.5 20.2 72.3 10.6 82.9 Non Controlling Interest in LLC's - 0.2 0.2 - 0.8 0.8 EBITDA* 21.8 2.8 24.6 104.2 10.4 114.6 Management, board, and strategic fees 0.7 0.1 0.8 2.4 0.4 2.8 Loss on extinguishment of debt - - - 12.3 - 12.3 Reorganization costs 3.5 - 3.5 6.3 0.7 7.0 Stock options expense 0.8 - 0.8 4.0 - 4.0 ASC 805 Impact - - - 0.1 - 0.1 Adjusted EBITDA* 26.8 $ 2.9 $ 29.7 $ 129.3 $ 11.5 $ 140.8 $ Surgical laser services acquisition 0.5 ** Pro forma Adjusted EBITDA 141.3 $ ** Pro forma adjustments include the 6 months prior to the 7/1/12 acquisition Consolidated Q4 2012 Consolidated YTD 2012 |
|
|
EBITDA Reconciliation Adjusted EBITDA Reconciliation. Adjusted EBITDA is defined by UHS as Earnings Before Interest, Taxes, Depreciation and Amortization (“EBITDA”), before management, board and strategic fees, stock option expense, reorganization costs, ASC 805 impact, loss on extinguishment of debt, transaction and related costs and other. In addition to using Adjusted EBITDA internally as a measure of operational performance, we disclose Adjusted EBITDA externally to assist analysts, investors and lenders in their comparisons of operational performance, valuation and debt capacity across companies with differing capital, tax and legal structures. Management also understands that some industry analysts and investors consider Adjusted EBITDA as a supplementary non-GAAP financial measure useful in analyzing a company’s ability to service debt. Adjusted EBITDA, however, is not a measure of financial performance under Generally Accepted Accounting Principals (“GAAP”) and should not be considered as an alternative to, or more meaningful than, net income as a measure of operating performance or to cash flows from operating, investing or financing activities or as a measure of liquidity. Since Adjusted EBITDA is not a measure determined in accordance with GAAP and is thus susceptible to varying interpretations and calculations, Adjusted EBITDA, as presented, may not be comparable to other similarly titled measures of other companies. Adjusted EBITDA does not represent an amount of funds that is available for management’s discretionary use. A reconciliation of consolidated net income (loss) to EBITDA and Adjusted EBITDA is included below. 19 * Includes recall gains of $0.0 and $5.9 for Q4 2012 and 2011, and $18.6 and $15.4 for YTD 2012 and 2011 (In millions) 2012 2011 2012 2011 Consolidated net income (loss)* (12.6) $ (8.1) $ (35.2) $ (22.4) $ Interest expense 12.2 15.4 55.7 55.0 Provision (benefit) for income taxes 0.3 (2.0) (2.6) (8.2) Depreciation and amortization 24.7 27.0 96.7 96.5 EBITDA* 24.6 32.3 114.6 120.9 Management, board & strategic fees 0.8 1.4 2.8 7.3 Loss on extinguishment of debt - - 12.3 - Reorganization costs 3.5 - 7.0 - Stock option expense 0.8 1.0 4.0 4.3 ASC 805 impact - - 0.1 0.9 Adjusted EBITDA* 29.7 $ 34.7 $ 140.8 $ 133.4 $ Pro forma for Acquisition 0.5 3.4 Pro forma Adjusted EBITDA 141.3 $ 136.8 $ December YTD 4th Quarter |
|
|
EBITDA Reconciliation: 2003 – 2012 20 * Includes recall gains of $18.6, $15.4, and $4.4 for 2012, 2011, and 2010 (In millions) 2003 2004 2005 2006 2007 2008 2009 2010 2011 2012 Net Cash provided by Operating Activities* 16.0 $ 38.0 $ 44.0 $ 48.9 $ 29.8 $ 56.2 $ 56.0 $ 76.2 $ 57.7 $ 72.5 $ Changes in Operating Assets and Liabilities 7.9 2.2 2.3 0.7 6.7 3.6 6.2 (2.1) 0.6 10.7 Other and Non-Cash Expenses* (7.9) (3.4) (3.3) (4.1) (28.5) 6.5 6.3 (11.5) 15.9 (21.7) Income Tax Expense 0.3 1.2 0.8 0.6 (9.7) (15.4) (11.5) 1.7 (8.3) (2.6) Interest Expense 20.2 30.5 31.1 31.6 40.2 46.9 46.5 46.5 55.0 55.7 EBITDA* 36.5 68.5 74.9 77.7 38.5 97.8 103.5 110.8 120.9 114.6 Recapitalization, company sale, stock compensation and severance expenses 14.4 - - - 27.2 - - - - - Loss on extinguishment of debt 13.3 - - - 23.4 - - - - 12.3 Financing and Reorganization Charges 27.7 - - - 50.6 - - - - 12.3 Management, board & strategic fees 0.3 0.7 0.8 1.6 1.0 1.3 1.3 2.4 7.3 2.8 Reorganization costs - - - - - - - - - 7.0 Stock option expense - - - 1.7 3.7 2.5 1.3 7.3 4.3 4.0 ASC 805 impact - - - - 2.4 2.3 2.0 1.1 0.9 0.1 Other - - - - (0.7) 0.1 - - - - Adjusted EBITDA* 64.5 $ 69.2 $ 75.7 $ 81.0 $ 95.5 $ 104.0 $ 108.1 $ 121.6 $ 133.4 140.8 Pro forma for Acquisition 3.4 0.5 Pro forma Adjusted EBITDA 136.8 $ 141.3 $ Total Revenue 171.0 $ 199.6 $ 215.9 $ 225.1 $ 264.0 $ 289.1 $ 297.2 $ 312.1 $ 355.2 $ 415.3 $ Total Debt & Accrued Int, Less Cash & Investments 276.7 $ 301.9 $ 305.0 $ 315.0 $ 501.1 $ 521.7 $ 522.3 $ 528.6 $ 674.8 $ 712.8 $ Leverage (Total Net Debt & Accrued Interest Less Cash & Investments/ LTM adj EBITDA) 4.3 4.4 4.0 3.9 5.2 5.0 4.8 4.3 4.9 5.0 |
|
|
Selected Reconciliations 21 (In millions) 2012 2011 2012 2011 Gross Margin ASC 805 Impact Depreciation 0.1 $ 0.1 $ 0.4 $ 4.6 $ Other - - - 0.2 Total Gross Margin ASC 805 Impact 0.1 0.1 0.4 4.8 SG&A per GAAP to Cash SG&A SG&A per GAAP 30.0 29.6 128.9 104.4 Management, Board, & Strategic Fees (0.8) (1.4) (2.8) (7.3) Loss on extinguishment of debt - - (12.3) - Reorganization costs (3.5) - (7.0) - Stock Option Expense (0.8) (1.0) (4.0) (4.3) Historical Depreciation & Amortization (1.1) (1.2) (4.9) (3.9) ASC 805 Depreciation & Amortization (3.6) (7.9) (15.0) (19.4) Other ASC 805 Impact - - - (0.7) Adjusted Cash SG&A 20.2 $ 18.1 $ 82.9 $ 68.8 $ 4th Quarter December YTD |
|
|
Selected Reconciliations: Gross Margin Pre-ASC 805 to Gross Margin 22 (In millions) 4th Quarter 2012 2011 2012 2011 Medical Equipment Outsourcing Gross Margin Pre-ASC 805 24.2 $ 29.5 $ 121.6 $ 115.0 $ ASC 805 Outsourcing Depreciation 0.1 0.1 0.4 4.6 Other ASC 805 Items - - - 0.2 Gross Margin per GAAP 24.1 29.4 121.2 110.2 Technical & Professional Services Gross Margin Pre-ASC 805 4.4 4.1 19.8 13.5 Gross Margin per GAAP 4.4 4.1 19.8 13.5 Medical Equipment Sales & Remarketing Gross Margin Pre-ASC 805 1.6 1.6 6.7 5.5 Gross Margin per GAAP 1.6 1.6 6.7 5.5 Total Gross Margin Pre-ASC 805 30.2 35.2 148.1 134.0 Total ASC 805 Depreciation 0.1 0.1 0.4 4.6 Total Other ASC 805 Items - - - 0.2 Total Gross Margin per GAAP 30.1 $ 35.1 $ 147.7 $ 129.2 $ December YTD |
|
|
Depreciation & Amortization Reconciliations 23 (In millions) 2012 2011 2012 2011 Historical Outsourcing Depreciation 19.6 $ 17.6 $ 75.3 $ 67.9 $ ASC 805 Outsourcing Depreciation 0.1 0.1 0.4 4.6 Total Outsourcing Depreciation 19.7 17.7 75.7 72.5 Historical Technical & Professional Services Depreciation 0.2 0.1 0.7 0.4 Total Technical & Professional Services Depreciation 0.2 0.1 0.7 0.4 Historical Sales & Remarketing Depreciation 0.1 0.1 0.4 0.3 Total Sales & Remarketing Depreciation 0.1 0.1 0.4 0.3 Historical Gross Margin Depreciation 19.9 17.8 76.4 68.6 Gross Margin ASC 805 Depreciation 0.1 0.1 0.4 4.6 Total Gross Margin Depreciation 20.0 17.9 76.8 73.2 Historical Selling, General, and Admin Depreciation 1.1 1.2 4.9 3.9 Total Selling, General, and Admin Depreciation 1.1 1.2 4.9 3.9 Total ASC 805 Selling, General, and Admin Amortization 3.6 7.9 15.0 19.4 Total Depreciation and Amortization 24.7 $ 27.0 $ 96.7 $ 96.5 $ December YTD 4th Quarter |
|
|
Other Reconciliations 24 (In millions) 2003 2004 2005 2006 2007 2008 2009 2010 2011 2012 Cash used in Investing Activities 36.8 $ 65.2 $ 40.6 $ 51.7 $ 418.9 $ 71.4 $ 50.6 $ 74.2 $ 153.2 $ 73.6 $ - Acquisitions (1.9) (15.1) (1.1) - (349.7) - - - (70.0) (14.4) - / + Other (0.2) - - - 1.4 - 1.5 3.3 - - ME in A/P prior period (6.0) (10.5) (3.8) (5.8) (7.4) (9.0) (5.7) (4.7) (11.8) (8.8) + ME in A/P current period 10.5 3.8 5.8 7.4 9.0 5.7 4.7 11.8 8.8 5.0 Accrual CAPEX 39.2 $ 43.4 $ 41.5 $ 53.3 $ 72.2 $ 68.1 $ 51.1 $ 84.6 $ 80.2 $ 55.4 $ Certain Intellamed Assets - $ - $ - $ - $ (14.6) $ - $ - $ - $ - $ - $ UHS by Parent - - - - (335.1) - - - - - Emergent, net of cash received - - - - - - - - (58.5) - SLS, net of cash received - - - - - - - - - (11.4) Epic/Rogue, net of cash received - - - - - - - - - (2.6) Other (1.9) (15.1) (1.1) - - - - - (11.5) (0.4) Total Acquisitions (1.9) $ (15.1) $ (1.1) $ - $ (349.7) $ - $ - $ - $ (70.0) $ (14.4) $ ACCRUAL CAPEX RECONCILIATION ACQUISITIONS |