Attached files
| file | filename |
|---|---|
| 8-K - 8-K - PACIFIC PREMIER BANCORP INC | a2213404z8-k.htm |
| EX-2.1 - EX-2.1 - PACIFIC PREMIER BANCORP INC | a2213404zex-2_1.htm |
| EX-99.1 - EX-99.1 - PACIFIC PREMIER BANCORP INC | a2213404zex-99_1.htm |
Exhibit 99.2
|
|
PPBI to Expand into San Diego County with the Acquisition of San Diego Trust Bank Investor Presentation March 6, 2013 |
|
|
Forward-Looking Statements and Where to Find Additional Information 2 Forward-Looking Statements This investor presentation may contain forward-looking statements regarding Pacific Premier Bancorp, Inc. (“PPBI”), including its wholly owned subsidiary Pacific Premier Bank, the pending acquisition of First Associations Bank (“FAB”), San Diego Trust Bank (“SDBK”) and the proposed acquisition of SDBK. These statements involve certain risks and uncertainties that could cause actual results to differ materially from those in the forward-looking statements. Such risks and uncertainties include, but are not limited to, the following factors: the expected cost savings, synergies and other financial benefits from the acquisition might not be realized within the expected time frames or at all; governmental approval of the acquisition may not be obtained or adverse regulatory conditions may be imposed in connection with governmental approvals of the acquisition; conditions to the closing of the acquisition may not be satisfied; and the shareholders of SDBK may fail to approve the consummation of the acquisition. Annualized, pro forma, projected and estimated numbers in this investor presentation are used for illustrative purposes only, are not forecasts and may not reflect actual results. PPBI and SDBK undertake no obligation to revise or publicly release any revision or update to these forward-looking statements to reflect events or circumstances that occur after the date on which such statements were made. Notice to SDBK Shareholders This investor presentation does not constitute an offer to sell or the solicitation of an offer to buy any securities or a solicitation of any vote or approval. In connection with the proposed acquisition transaction, a registration statement on Form S-4 will be filed with the Securities and Exchange Commission (“SEC”) by PPBI. The registration statement will contain a proxy statement/prospectus to be distributed to the shareholders of SDBK in connection with their vote on the acquisition. SHAREHOLDERS OF SDBK ARE ENCOURAGED TO READ THE REGISTRATION STATEMENT AND ANY OTHER RELEVANT DOCUMENTS FILED WITH THE SEC, INCLUDING THE PROXY STATEMENT/PROSPECTUS THAT WILL BE PART OF THE REGISTRATION STATEMENT, BECAUSE THEY WILL CONTAIN IMPORTANT INFORMATION ABOUT THE PROPOSED ACQUISITION. The final proxy statement/prospectus will be mailed to shareholders of SDBK. Investors and security holders will be able to obtain the documents free of charge at the SEC's website, www.sec.gov. In addition, documents filed with the SEC by PPBI will be available free of charge by (1) accessing PPBI’s website at www.ppbi.com under the “Investor Relations” link and then under the heading “SEC Filings”, (2) writing PPBI at 17901 Von Karman Avenue, Suite 1200, Irvine, CA 92614, Attention: Investor Relations, or (3) writing SDBK at 2550 Fifth Avenue, Suite 1010, San Diego, CA 92103, Attention: Corporate Secretary. The directors, executive officers and certain other members of management and employees of PPBI may be deemed to be participants in the solicitation of proxies in favor of the acquisition from the shareholders of SDBK. Information about the directors and executive officers of PPBI is included in the proxy statement for its 2012 annual meeting of PPBI shareholders, which was filed with the SEC on April 16, 2012. The directors, executive officers and certain other members of management and employees of SDBK may also be deemed to be participants in the solicitation of proxies in favor of the acquisition from the shareholders of SDBK. Information about the directors and executive officers of SDBK will be included in the proxy statement/prospectus for the acquisition. Additional information regarding the interests of those participants and other persons who may be deemed participants in the transaction may be obtained by reading the proxy statement/prospectus regarding the proposed acquisition when it becomes available. Free copies of this document may be obtained as described in the preceding paragraph. |
|
|
Forward-Looking Statements and Where to Find Additional Information 3 Notice to FAB Shareholders This presentation does not constitute an offer to sell or the solicitation of an offer to buy any securities or a solicitation of any vote or approval. In connection with the proposed acquisition of First Associations Bank (“FAB”), Pacific Premier filed a registration statement on Form S-4 (the “Registration Statement”) with the SEC, which contains a proxy statement of FAB and a prospectus of PPBI (collectively, the “proxy statement/prospectus”). The Registration Statement was declared effective on February 6, 2013. A definitive proxy statement/prospectus has been filed with the SEC on February 7, 2013 and has been mailed to the shareholders of FAB in connection with their vote on the acquisition of FAB on or about February 8, 2013. SHAREHOLDERS OF FAB ARE ENCOURAGED TO READ THE REGISTRATION STATEMENT AND THE DEFINITIVE PROXY STATEMENT/PROSPECTUS AND ALL OTHER RELEVANT DOCUMENTS FILED WITH THE SEC, AS WELL AS SUPPLEMENTS TO THOSE DOCUMENTS, BECAUSE THEY WILL CONTAIN IMPORTANT INFORMATION ABOUT THE PROPOSED ACQUISITION OF FAB. Investors and security holders will be able to obtain the definitive proxy statement/prospectus and the other documents free of charge at the SEC's website, www.sec.gov. In addition, documents filed with the SEC by Pacific Premier will be available free of charge by (1) accessing PPBI’s website at www.ppbi.com under the “Investor Relations” link and then under the heading “SEC Filings,” (2) writing PPBI at 17901 Von Karman Ave., Suite 1200, Irvine, California 92614, Attention: Investor Relations or (3) writing FAB at 12001 N. Central Expressway, Suite 1165, Dallas, Texas 75243, Attention: Corporate Secretary. The directors, executive officers and certain other members of management and employees of Pacific Premier may be deemed to be participants in the solicitation of proxies in favor of the proposed acquisition from the shareholders of FAB. Information about the directors and executive officers of Pacific Premier is included in the definitive proxy statement/prospectus for the proposed acquisition of FAB. The directors, executive officers and certain other members of management and employees of FAB may also be deemed to be participants in the solicitation of proxies in favor of the proposed acquisition from the shareholders of FAB. Information about the directors and executive officers of FAB is included in the definitive proxy statement/prospectus for the proposed acquisition of FAB. Additional information regarding the interests of those participants and other persons who may be deemed participants in the transaction may be obtained by reading the definitive proxy statement/prospectus regarding the proposed acquisition. Free copies of this document may be obtained as described in the preceding paragraph. |
|
|
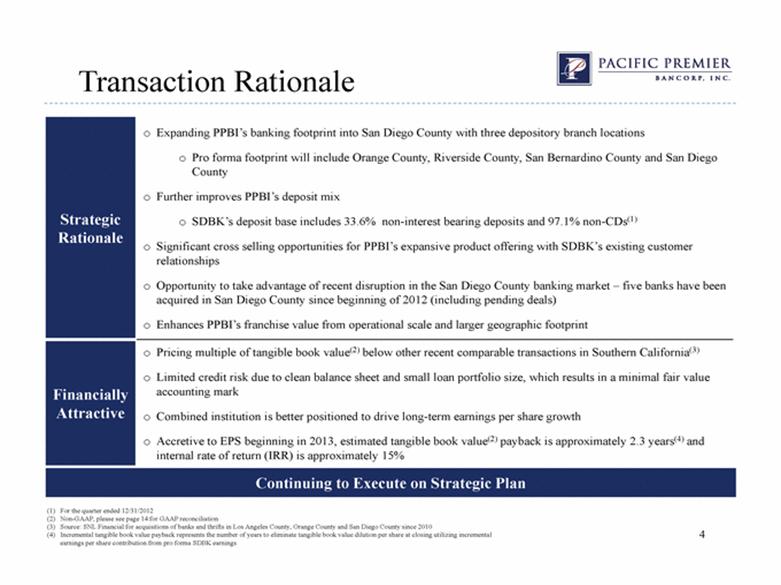
Transaction Rationale Strategic Rationale Expanding PPBI’s banking footprint into San Diego County with three depository branch locations Pro forma footprint will include Orange County, Riverside County, San Bernardino County and San Diego County Further improves PPBI’s deposit mix SDBK’s deposit base includes 33.6% non-interest bearing deposits and 97.1% non-CDs(1) Significant cross selling opportunities for PPBI’s expansive product offering with SDBK’s existing customer relationships Opportunity to take advantage of recent disruption in the San Diego County banking market – five banks have been acquired in San Diego County since beginning of 2012 (including pending deals) Enhances PPBI’s franchise value from operational scale and larger geographic footprint Financially Attractive Pricing multiple of tangible book value(2) below other recent comparable transactions in Southern California(3) Limited credit risk due to clean balance sheet and small loan portfolio size, which results in a minimal fair value accounting mark Combined institution is better positioned to drive long-term earnings per share growth Accretive to EPS beginning in 2013, estimated tangible book value(2) payback is approximately 2.3 years(4) and internal rate of return (IRR) is approximately 15% 4 Continuing to Execute on Strategic Plan (1) For the quarter ended 12/31/2012 (2) Non-GAAP, please see page 14 for GAAP reconciliation (3) Source: SNL Financial for acquisitions of banks and thrifts in Los Angeles County, Orange County and San Diego County since 2010 (4) Incremental tangible book value payback represents the number of years to eliminate tangible book value dilution per share at closing utilizing incremental earnings per share contribution from pro forma SDBK earnings |
|
|
|
|
|
Overview of San Diego Trust Bank Source: SNL Financial data for the year ending 12/31/2012, unless specifically noted otherwise (1) Source: SDBK’s audited financial statements for the year ending12/31/2012 Note: All dollars in thousands 5 PPBI branch location SDBK branch location Corporate Information Financial Summary Headquarters San Diego, CA Balance Sheet Date Established 10/30/2003 Total Assets (1) 242,005 $ Number of Branches 3 Total Loans 37,225 $ Total Deposits (1) 187,875 $ Non-Int. Bearing Dep. / Total Deposits 33.6% Non-CDs / Total Deposits 97.1% Loan / Deposit Ratio 19.8% Capital and Asset Quality Tangible Common Equity 25,734 $ Tg. Common Equity Ratio 10.63% Loan Loss Reserve / Total Loans 2.72% NPAs / Total Assets 0.71% Non-Accrual Loans / Total Loans 0.00% Income Statement Net Income (1) 1,815 $ Performance Ratios ROAA 0.85% ROAE 7.40% Efficiency Ratio 78.6% Net Interest Margin 3.05% Non-Interest Income / Average Assets 0.23% Non-Interest Expense / Average Assets 2.57% |
|
|
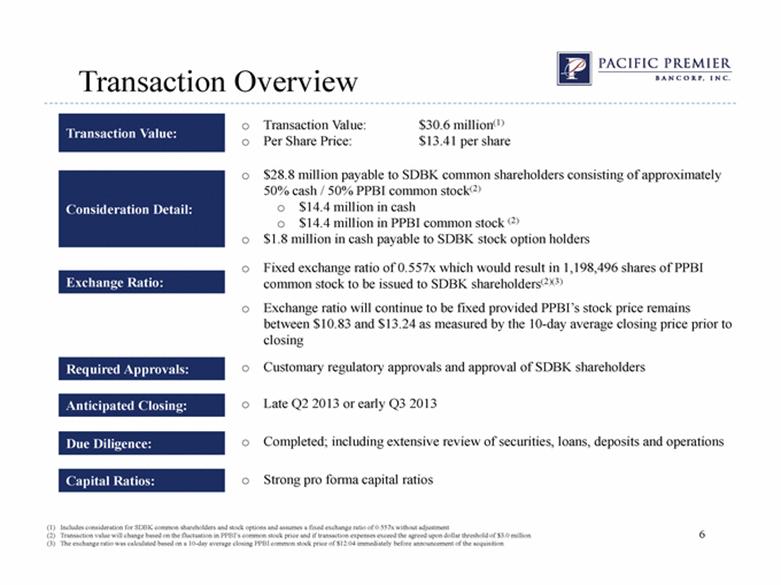
Transaction Overview Transaction Value: Consideration Detail: Due Diligence: Anticipated Closing: Exchange Ratio: Transaction Value: $30.6 million(1) Per Share Price: $13.41 per share Fixed exchange ratio of 0.557x which would result in 1,198,496 shares of PPBI common stock to be issued to SDBK shareholders(2)(3) Exchange ratio will continue to be fixed provided PPBI’s stock price remains between $10.83 and $13.24 as measured by the 10-day average closing price prior to closing Late Q2 2013 or early Q3 2013 Completed; including extensive review of securities, loans, deposits and operations $28.8 million payable to SDBK common shareholders consisting of approximately 50% cash / 50% PPBI common stock(2) $14.4 million in cash $14.4 million in PPBI common stock (2) $1.8 million in cash payable to SDBK stock option holders Required Approvals: Customary regulatory approvals and approval of SDBK shareholders (1) Includes consideration for SDBK common shareholders and stock options and assumes a fixed exchange ratio of 0.557x without adjustment (2) Transaction value will change based on the fluctuation in PPBI’s common stock price and if transaction expenses exceed the agreed upon dollar threshold of $3.0 million (3) The exchange ratio was calculated based on a 10-day average closing PPBI common stock price of $12.04 immediately before announcement of the acquisition 6 Capital Ratios: Strong pro forma capital ratios |
|
|
Pro Forma Loan Portfolio SDBK’s loan portfolio of $37.3 million 86.4% of SDBK’s loans are Commercial Real Estate (CRE) and Commercial & Industrial (C&I) SDBK (12/31/2012) Pro Forma PPBI + FAB + SDBK (12/31/2012) 7 PPBI + FAB* (12/31/2012) Source: PPBI earnings release data and SDBK regulatory call report data, each as of 12/31/2012 *Pro forma PPBI including the impact from the pending acquisition of FAB, based on regulatory call report data of FAB as of 12/31/2012 Note: Pro forma does not include purchase accounting or merger related adjustments Note: All dollars in thousands Note: All financial data is unaudited Construction, Land & Development 0.9% 1 - 4 Family 9.7% Multi - Family 15.5% CRE - Non - Owner Occupied 25.1% CRE - Owner Occupied 15.0% Commercial & Industrial 11.4% SBA 0.7% Warehouse Facilities 19.4% Other 2.4% Construction, Land & Development 1.2% 1 - 4 Family 9.4% Multi - Family 15.0% CRE - Non - Owner Occupied 25.6% CRE - Owner Occupied 15.7% Commercial & Industrial 11.5% SBA 0.7% Warehouse Facilities 18.7% Consumer 0.0% Other 2.3% Balance ($000s) % of Total Loans Balance ($000s) % of Total Loans Balance ($000s) % of Total Loans Construction, Land & Development 8,774 $ 0.9% Construction, Land & Development 3,822 $ 10.3% Construction, Land & Development 12,596 $ 1.2% 1-4 Family 97,463 $ 9.7% 1-4 Family 953 $ 2.6% 1-4 Family 98,416 $ 9.4% Multi-Family 156,424 $ 15.5% Multi-Family 39 $ 0.1% Multi-Family 156,463 $ 15.0% CRE - Non-Owner Occupied 253,409 $ 25.1% CRE - Non-Owner Occupied 14,427 $ 38.7% CRE - Non-Owner Occupied 267,836 $ 25.6% CRE - Owner Occupied 150,934 $ 15.0% CRE - Owner Occupied 13,032 $ 35.0% CRE - Owner Occupied 163,966 $ 15.7% Commercial & Industrial 115,354 $ 11.4% Commercial & Industrial 4,728 $ 12.7% Commercial & Industrial 120,082 $ 11.5% SBA 6,882 $ 0.7% SBA - $ 0.0% SBA 6,882 $ 0.7% Warehouse Facilities 195,761 $ 19.4% Warehouse Facilities - $ 0.0% Warehouse Facilities 195,761 $ 18.7% Consumer - $ 0.0% Consumer 269 $ 0.7% Consumer 269 $ 0.0% Other 23,829 $ 2.4% Other 1 $ 0.0% Other 23,830 $ 2.3% Total Loans 1,008,830 $ 100.0% Total Loans 37,271 $ 100.0% Total Loans 1,046,101 $ 100.0% Less: Unearned Income (306) $ Less: Unearned Income (46) $ Less: Unearned Income (352) $ Gross Loans 1,008,524 $ Gross Loans 37,225 $ Gross Loans 1,045,749 $ Total CRE and C&I 519,697 $ 51.5% Total CRE and C&I 32,187 $ 86.4% Total CRE and C&I 551,884 $ 52.8% Gross Loans / Deposits 82.4% Gross Loans / Deposits 19.8% Gross Loans / Deposits 74.0% Yield on Loans 6.17% Yield on Loans 6.01% Yield on Loans 6.16% Construction, Land & Development 10.3% 1 - 4 Family 2.6% Multi - Family 0.1% CRE - Non - Owner Occupied 38.7% CRE - Owner Occupied 35.0% Commercial & Industrial 12.7% Consumer 0.7% |
|
|
Pro Forma Deposit Franchise Strengthens PPBI’s deposit franchise with low-cost deposit funding platform (SDBK cost of deposits was 0.25% during Q4 2012) SDBK’s deposit base includes 33.6% non-interest bearing demand deposits and 97.1% non-CDs 8 SDBK (12/31/2012) Pro Forma PPBI + FAB + SDBK (12/31/2012) PPBI + FAB* (12/31/2012) Source: PPBI earnings release data and SDBK audited financial statements, each as of 12/31/2012 *Pro forma PPBI including the impact from the pending acquisition of FAB, based on regulatory call report data of FAB as of 12/31/2012 Note: Pro forma does not include purchase accounting or merger related adjustments Note: All dollars in thousands Note: All financial data is unaudited, unless specifically noted otherwise Balance ($000s) % of Total Deposits Balance ($000s) % of Total Deposits Balance ($000s) % of Total Deposits Non-Interest-Bearing Demand 299,449 $ 24.5% Non-Interest-Bearing Demand 63,056 $ 33.6% Non-Interest-Bearing Demand 362,505 $ 25.7% Interest Bearing Checking 90,777 $ 7.4% Interest Bearing Checking 13,816 $ 7.4% Interest Bearing Checking 104,593 $ 7.4% Money Market 373,127 $ 30.5% Money Market 100,268 $ 53.4% Money Market 473,395 $ 33.5% Savings 79,420 $ 6.5% Savings 5,320 $ 2.8% Savings 84,740 $ 6.0% Total CDs 381,783 $ 31.2% Total CDs 5,415 $ 2.9% Total CDs 387,198 $ 27.4% Total Deposits 1,224,556 $ 100.0% Total Deposits 187,875 $ 100.0% Total Deposits 1,412,431 $ 100.0% Interest-Bearing Deposits 925,107 $ 75.5% Interest-Bearing Deposits 124,819 $ 66.4% Interest-Bearing Deposits 1,049,926 $ 74.3% Non-CDs 842,773 $ 68.8% Non-CDs 182,460 $ 97.1% Non-CDs 1,025,233 $ 72.6% Cost of Interest-Bearing Deposits 0.61% Cost of Interest-Bearing Deposits 0.36% Cost of Interest-Bearing Deposits 0.58% Cost of Total Deposits 0.46% Cost of Total Deposits 0.25% Cost of Total Deposits 0.43% Cost of Funds 0.54% Cost of Funds 0.23% Cost of Funds 0.50% Non - Interest - Bearing Demand 33.6% Interest Bearing Checking 7.4% Money Market 53.4% Savings 2.8% Total CDs 2.9% Non - Interest - Bearing Demand 24.5% Interest Bearing Checking 7.4% Money Market 30.5% Savings 6.5% Total CDs 31.2% |
|
|
San Diego County Market Share Source: SNL Financial, as of 6/30 for the respective years Note: All dollars in thousands *Indicates bank headquartered in San Diego County 9 SDBK has 3rd largest deposit market share among banks headquartered in San Diego County Five San Diego banks have been acquired (including pending deals) since 2012 with total deposits of $856.2 million, or 1.56% of total market share (as of 6/30/2011) Rank (2012) Institution (ST) Number of Branches (2012) Deposits in Market (2012) Market Share (2012) Rank (2011) Institution (ST) Number of Branches (2011) Deposits in Market (2011) Market Share (2011) 1 Wells Fargo & Co. (CA) 105 14,999,843 $ 25.49% 1 Wells Fargo & Co. (CA) 106 13,005,998 $ 23.64% 2 Mitsubishi UFJ Finl Grp Inc 59 9,835,793 $ 16.71% 2 Bank of America Corp. (NC) 74 9,750,994 $ 17.72% 3 Bank of America Corp. (NC) 72 8,507,403 $ 14.46% 3 Mitsubishi UFJ Finl Grp Inc 60 7,907,414 $ 14.37% 4 JPMorgan Chase & Co. (NY) 97 7,018,190 $ 11.93% 4 JPMorgan Chase & Co. (NY) 90 6,338,455 $ 11.52% 5 U.S. Bancorp (MN) 81 3,725,163 $ 6.33% 5 U.S. Bancorp (MN) 81 3,653,930 $ 6.64% 6 Zions Bancorp. (UT) 27 2,720,094 $ 4.62% 6 Zions Bancorp. (UT) 27 2,735,910 $ 4.97% 7 Citigroup Inc. (NY) 25 1,583,564 $ 2.69% 7 Citigroup Inc. (NY) 25 1,508,256 $ 2.74% 8 Western Alliance Bancorp (AZ) 8 1,223,771 $ 2.08% 8 PacWest Bancorp (CA) 18 1,093,016 $ 1.99% 9 PacWest Bancorp (CA) 16 1,136,091 $ 1.93% 9 Western Alliance Bancorp (AZ) 8 1,050,292 $ 1.91% 10 First Republic Bank (CA) 5 942,798 $ 1.60% 10 IMB Management Holdings LP (CA) 3 971,505 $ 1.77% 11 IMB Management Holdings LP (CA) 3 921,984 $ 1.57% 11 First Republic Bank (CA) 5 804,992 $ 1.46% 12 Comerica Inc. (TX) 15 734,633 $ 1.25% 12 Comerica Inc. (TX) 14 653,879 $ 1.19% 13 City National Corp. (CA) 7 518,518 $ 0.88% 13 First PacTrust Bancorp Inc. (CA) 8 629,197 $ 1.14% 14 BNP Paribas 5 512,631 $ 0.87% 14 BNP Paribas 6 556,285 $ 1.01% 15 First PacTrust Bancorp Inc. (CA) 7 484,291 $ 0.82% 15 City National Corp. (CA) 8 503,135 $ 0.91% 16 Grandpoint Capital Inc. (CA) 7 438,738 $ 0.75% 16 First Citizens BancShares Inc. (NC) 9 477,937 $ 0.87% 17 First Citizens BancShares Inc. (NC) 8 396,487 $ 0.67% 17 HSBC 3 381,369 $ 0.69% 18 SKBHC Holdings LLC (WA) 7 330,121 $ 0.56% 18 Regents Bank (CA)* 4 235,232 $ 0.43% 19 Silvergate Capital Corp. (CA)* 5 315,658 $ 0.54% 19 California Community Bank (CA)* 5 209,694 $ 0.38% 20 HSBC 3 227,026 $ 0.39% 20 Security Business Bancorp (CA)* 3 193,639 $ 0.35% 21 Coronado First Bank (CA)* 3 217,833 $ 0.37% 21 San Diego Trust Bank (CA)* 3 171,372 $ 0.31% 22 BBVA 6 206,520 $ 0.35% 22 Northern Trust Corp. (IL) 2 164,607 $ 0.30% 23 Northern Trust Corp. (IL) 2 181,051 $ 0.31% 23 Silvergate Capital Corp. (CA)* 4 156,794 $ 0.28% 24 San Diego Trust Bank (CA)* 3 180,471 $ 0.31% 24 Capitol Bancorp Ltd. (MI) 3 155,807 $ 0.28% 25 Seacoast Commerce Bank (CA)* 3 133,165 $ 0.23% 25 First Banks Inc. (MO) 4 128,316 $ 0.23% 26 Sterling Financial Corp. (WA) 4 129,893 $ 0.22% 26 American Heritage Holdings (CA)* 4 121,653 $ 0.22% 27 Bank of Southern California NA (CA)* 4 123,968 $ 0.21% 27 Bank of Southern California NA (CA)* 4 112,241 $ 0.20% 28 First Banks Inc. (MO) 4 118,165 $ 0.20% 28 Seacoast Commerce Bank (CA)* 1 110,394 $ 0.20% 29 MetroCorp Bancshares Inc. (TX) 1 103,068 $ 0.18% 29 MetroCorp Bancshares Inc. (TX) 2 102,533 $ 0.19% 30 Vibra Bank (CA)* 1 98,363 $ 0.17% 30 BBVA 6 99,533 $ 0.18% 31 Duke Financial Group Inc. (MN) 4 96,573 $ 0.16% 31 Neighborhood Bancorp (CA)* 3 99,337 $ 0.18% 32 Neighborhood Bancorp (CA)* 3 94,966 $ 0.16% 32 Duke Financial Group Inc. (MN) 4 98,615 $ 0.18% 33 Carpenter Bank Partners Inc. (CA) 1 93,408 $ 0.16% 33 San Diego Private Bank (CA)* 1 95,970 $ 0.17% Total For Institutions In Market 627 $ 58,849,098 Total For Institutions In Market 624 $ 55,024,605 Out of 48 Institutions Out of 51 Institutions 11 Aggregate From Banks Acquired Since 2012 17 856,188 $ 1.56% San Diego County - 2012 San Diego County - 2011 |
|
|
Transaction Assumptions Attractive Valuation Multiples: Price / tangible book value 119.0%(1)(2) Core deposit premium 2.66%(1) Price / earnings (last twelve months)(1) 16.9x Other Transaction Assumptions: Cost Savings: Total one-time transaction expenses of approximately $6.1 million Core deposit intangible asset of $919k, or 0.50% of SDBK’s core deposits 2.72% fair value mark on SDBK’s gross loans (equal to 12/31/2012 loan loss reserve) Estimated cost savings in excess of 25.0% Cost savings are 25.0% phased in during 2013 and 100.0% phased in by 2014 (1) As of 12/31/2012 (2) Non-GAAP, please see page 14 for GAAP reconciliation (3) Excluding one-time transaction expenses of approximately $6.1 million in 2013 (4) Incremental tangible book value payback represents the number of years to eliminate tangible book value dilution per share at closing utilizing incremental earnings per share contribution from pro forma SDBK earnings Pro Forma Impact to PPBI: Accretive to earnings per share (EPS) beginning in 2013(3) Tangible book value payback period approximately 2.3 years(2)(4) IRR of approximately 15% 10 |

|
|
Pro Forma Capital Ratios On (1) 12/6/2012, PPBI completed a public offering of common stock for gross proceeds of $33.0 million. Subsequently on 1/9/2013, the underwriters exercised the overallotment for an additional 15.0% of the shares issued for gross proceeds of approximately $5.0 million (2) As of 12/31/2012 (3) Based on transaction assumptions for SDBK acquisition as identified on previous slides (4) Non-GAAP, please see page 14 for GAAP reconciliation Financial assumptions for PPBI, FAB and SDBK as of 12/31/2012 Includes pro forma impact from the pending acquisition of FAB, which remains subject to receiving FAB shareholder approval and satisfaction of customary closing conditions, and the impact from PPBI’s exercised overallotment option by the underwriters for PPBI’s recent public offering of common stock(1) Includes pro forma scenario for PPBI with transaction assumptions for SDBK Pro forma PPBI will remain well capitalized Approximately $19 million in excess capital above target leverage ratio of 8.00%, which provides flexibility for additional growth opportunities PPBI(2) Pro Forma With FAB and Overallotment (1) Pro Forma With FAB + SDBK (1)(3) Tangible Common Equity Ratio(4) 11.26% 9.29% 8.46% Leverage Ratio 12.71% 10.38% 9.19% Tier-1 Ratio 13.61% 13.26% 12.55% Risk Based Capital Ratio 14.43% 14.01% 13.25% 11 |
|
|
Closing Thoughts New market entry into San Diego County Strategically and financially compelling acquisition Further improves PPBI’s deposit mix with low-cost core deposits Acquiring a profitable and clean bank – minimal credit risk Combining PPBI’s product offering with SDBK’s existing customer relationships Key members of SDBK team are expected to be retained Effective use of capital, enhancing both profitability and shareholder value 12 Continuing to Execute on Strategic Plan |
|
|
Appendix 13 |
|
|
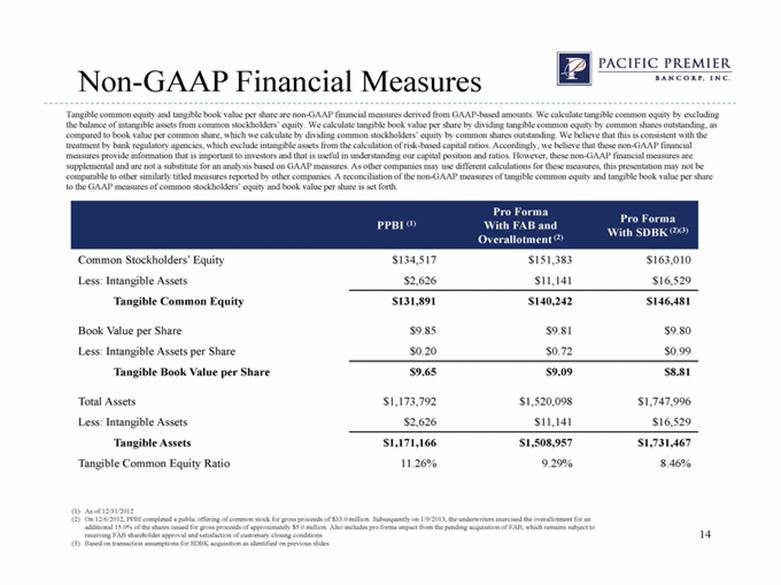
Non-GAAP Financial Measures Tangible common equity and tangible book value per share are non-GAAP financial measures derived from GAAP-based amounts. We calculate tangible common equity by excluding the balance of intangible assets from common stockholders’ equity. We calculate tangible book value per share by dividing tangible common equity by common shares outstanding, as compared to book value per common share, which we calculate by dividing common stockholders’ equity by common shares outstanding. We believe that this is consistent with the treatment by bank regulatory agencies, which exclude intangible assets from the calculation of risk-based capital ratios. Accordingly, we believe that these non-GAAP financial measures provide information that is important to investors and that is useful in understanding our capital position and ratios. However, these non-GAAP financial measures are supplemental and are not a substitute for an analysis based on GAAP measures. As other companies may use different calculations for these measures, this presentation may not be comparable to other similarly titled measures reported by other companies. A reconciliation of the non-GAAP measures of tangible common equity and tangible book value per share to the GAAP measures of common stockholders’ equity and book value per share is set forth. PPBI (1) Pro Forma With FAB and Overallotment (2) Pro Forma With SDBK(2)(3) Common Stockholders’ Equity $134,517 $151,383 $163,010 Less: Intangible Assets $2,626 $11,141 $16,529 Tangible Common Equity $131,891 $140,242 $146,481 Book Value per Share $9.85 $9.81 $9.80 Less: Intangible Assets per Share $0.20 $0.72 $0.99 Tangible Book Value per Share $9.65 $9.09 $8.81 Total Assets $1,173,792 $1,520,098 $1,747,996 Less: Intangible Assets $2,626 $11,141 $16,529 Tangible Assets $1,171,166 $1,508,957 $1,731,467 Tangible Common Equity Ratio 11.26% 9.29% 8.46% 14 (1) As of 12/31/2012 (2) On 12/6/2012, PPBI completed a public offering of common stock for gross proceeds of $33.0 million. Subsequently on 1/9/2013, the underwriters exercised the overallotment for an additional 15.0% of the shares issued for gross proceeds of approximately $5.0 million. Also includes pro forma impact from the pending acquisition of FAB, which remains subject to receiving FAB shareholder approval and satisfaction of customary closing conditions (3) Based on transaction assumptions for SDBK acquisition as identified on previous slides |