Attached files
| file | filename |
|---|---|
| EX-32.1 - CERTIFICATION OF THE CEO & CFO PURSUANT TO 18 U.S.C. SECTION 1350 - RUCKUS WIRELESS INC | exhibit_32x1xcertification.htm |
| EX-31.1 - CERTIFICATION OF THE CEO - RUCKUS WIRELESS INC | exhibit_31x1xcertification.htm |
| EX-21.1 - LIST OF SUBSIDIARIES - RUCKUS WIRELESS INC | exhibit_21x1xlistxofxsubsi.htm |
| EX-31.2 - CERTIFICATION OF THE CFO - RUCKUS WIRELESS INC | exhibit_31x2xcertification.htm |
| EX-10.18 - SEVERANCE BENEFIT PLAN - RUCKUS WIRELESS INC | exhibit_10x18xseverancexbe.htm |
| EX-23.1 - CONSENT OF DELOITTE & TOUCHE LLP - RUCKUS WIRELESS INC | exhibit_23x1xconsentxofxdt.htm |
UNITED STATES SECURITIES AND EXCHANGE COMMISSION Washington, D.C. 20549 | |
Form 10-K
x ANNUAL REPORT PURSUANT TO SECTION 13 OR 15(d) OF THE SECURITIES EXCHANGE ACT OF 1934
For the fiscal year ended December 31, 2012
o TRANSITION REPORT PURSUANT TO SECTION 13 OR 15(d) OF THE SECURITIES EXCHANGE ACT OF 1934
For the transition period from to
Commission file number: 001-35734
Ruckus Wireless, Inc. |
(Exact name of registrant as specified in its charter) |
Delaware | 54-2072041 | |||
(State or other jurisdiction of incorporation or organization) | (I.R.S. Employer Identification Number) | |||
350 West Java Drive
Sunnyvale, California 94089
(650) 265-4200
(Address, including zip code, and telephone number, including area code, of registrant's principal executive offices) |
Securities registered pursuant to Section 12(b) of the Act:
Title of Each Class | Name of Exchange on Which Registered | |
Common Stock, par value $0.001 per share | New York Stock Exchange | |
Securities registered pursuant to Section 12(g) of the Act:
None
Indicate by check mark if the registrant is a well-known seasoned issuer, as defined in Rule 405 of the Securities Act. Yes o No x
Indicate by check mark if the registrant is not required to file reports pursuant to Section 13 or Section 15(d) of the Securities Exchange Act of 1934 (the “Exchange Act”). Yes o No x
Indicate by check mark whether the registrant: (1) has filed all reports required to be filed by Section 13 or 15(d) of the Exchange Act during the preceding 12 months (or for such shorter period that the registrant was required to file such reports), and (2) has been subject to such filing requirements for the past 90 days. Yes x No ¨
Indicate by check mark whether the registrant has submitted electronically and posted on its corporate Web site, if any, every Interactive Data File required to be submitted and posted pursuant to Rule 405 of Regulation S-T (§232.405 of this chapter) during the preceding 12 months (or for such shorter period that the registrant was required to submit and post such files). Yes o No o
Indicate by a check mark if disclosure of delinquent filers pursuant to Item 405 of Regulation S-K (§229.405 of this chapter) is not contained herein, and will not be contained, to the best of registrant's knowledge, in definitive proxy or information statements incorporated by reference in Part III of this Form 10-K or any amendment to this Form 10-K. ¨
Indicate by check mark whether the registrant is a large accelerated filer, an accelerated filer, a non-accelerated filer, or a smaller reporting company. See the definitions of “large accelerated filer,” “accelerated filer” and “smaller reporting company” in Rule 12b-2 of the Exchange Act. (Check one):
Large accelerated filer ¨ | Accelerated filer ¨ | |
Non-accelerated filer x (Do not check if a smaller reporting company) | Smaller reporting company ¨ | |
Indicate by check mark whether the registrant is a shell company (as defined in Rule 12b-2 of the Exchange Act). Yes o No x
The registrant's common stock was not publicly traded as of the last business day of the registrant's most recently completed second fiscal quarter.
On February 28, 2013, 74,309,144 shares of the registrant's common stock, $0.001 par value, were outstanding.
DOCUMENTS INCORPORATED BY REFERENCE |
Portions of the information called for by Part III of this Form 10-K, to the extent not set forth herein, are hereby incorporated by reference from the definitive proxy statement relating to our 2013 annual meeting of stockholders, which will be filed with the Securities and Exchange Commission not later than 120 days after December 31, 2012.
TABLE OF CONTENTS
PART I | Page | |
Item 1. | ||
Item 1A. | ||
Item 1B. | ||
Item 2. | ||
Item 3. | ||
Item 4. | ||
PART II | ||
Item 5. | ||
Item 6. | ||
Item 7. | ||
Item 7A. | ||
Item 8. | ||
Item 9. | ||
Item 9A. | ||
Item 9B. | ||
PART III | ||
Item 10. | ||
Item 11. | ||
Item 12. | ||
Item 13. | ||
Item 14. | ||
PART IV | ||
Item 15. | ||
“Ruckus Wireless,” the Ruckus logos and other trademarks or service marks of Ruckus Wireless, Inc. appearing in this prospectus are the property of Ruckus Wireless, Inc. Trade names, trademarks and service marks of other companies appearing in this report are the property of their respective holders.
1
SPECIAL NOTE REGARDING FORWARD-LOOKING STATEMENTS
This Annual Report on Form 10-K, including the sections entitled “Business,” “Risk Factors,” and “Management's Discussion and Analysis of Financial Condition and Results of Operations,” contains forward-looking statements within the meaning of Section 27A of the Securities Act of 1933, as amended and Section 21E of the Securities Exchange Act of 1934, as amended. The words “believe,” “will,” “may,” “estimate,” “continue,” “anticipate,” “intend,” “should,” “plan,” “expect,” “predict,” “could,” “potentially” and similar expressions that convey uncertainty of future events or outcomes are intended to identify forward-looking statements.
These forward-looking statements include, but are not limited to, statements concerning the following:
• | our ability to predict our revenue, operating results and gross margin accurately; |
• | our ability to maintain an adequate rate of revenue growth and remain profitable; |
• | the length and unpredictability of our sales cycles with service provider end-customers; |
• | any potential loss of or reductions in orders from our larger customers; |
• | the effects of increased competition in our market; |
• | our ability to continue to enhance and broaden our product offering; |
• | our ability to maintain, protect and enhance our brand; |
• | our ability to effectively manage our growth; |
• | our ability to maintain proper and effective internal controls; |
• | the quality of our products and services; |
• | our ability to continue to build and enhance relationships with channel partners; |
• | the attraction and retention of qualified employees and key personnel; |
• | our ability to sell our products and effectively expand internationally; |
• | our ability to protect our intellectual property; |
• | claims that we infringe intellectual property rights of others; and |
• | other risk factors included under the section titled “Risk Factors." |
These forward-looking statements are subject to a number of risks, uncertainties, and assumptions, including those described in “Risk Factors” included in Part I, Item 1A and elsewhere in this report. Moreover, we operate in a very competitive and rapidly changing environment, and new risks emerge from time to time. It is not possible for our management to predict all risks, nor can we assess the impact of all factors on our business or the extent to which any factor, or combination of factors, may cause actual results to differ materially from those contained in any forward-looking statements we may make. In light of these risks, uncertainties, and assumptions, the forward-looking events and circumstances discussed in this report may not occur, and actual results could differ materially and adversely from those anticipated or implied in the forward-looking statements. We undertake no obligation to revise or publicly release the results of any revision to these forward-looking statements, except as required by law. Given these risks and uncertainties, readers are cautioned not to place undue reliance on such forward-looking statements.
2
PART I
ITEM 1. BUSINESS
Overview
Ruckus Wireless, Inc. (“Ruckus” or “we” or “the Company”) is a leading provider of carrier-class Wi-Fi solutions. Our solutions, which we call Smart Wi-Fi, are used by service providers and enterprises to solve network capacity and coverage challenges associated with the rapidly increasing traffic and number of users on wireless networks. Our Smart Wi-Fi solutions offer carrier-class enhanced reliability, consistent performance, extended range and massive scalability. Our products include gateways, controllers and access points. These products incorporate our proprietary technologies, including Smart Radio, Smart QoS, Smart Mesh, SmartCell and Smart Scaling, to enable high performance in a variety of challenging operating conditions faced by service providers and enterprises.
Technology
Our core Smart Wi-Fi technologies include:
Smart Radio—Our Smart Radio is a set of advanced hardware and software capabilities that automatically adjust Wi-Fi signals to changes in environmental conditions. This adaptability results in greater wireless coverage, carrier-class reliability and higher levels of system performance, all without any manual tuning. A primary component of Smart Radio technology is BeamFlex, a patented smart antenna system that makes Wi-Fi signals stronger by focusing them only where they are needed and dynamically steering them in directions that yield the highest throughput for each receiving device. Another component is ChannelFly, a performance optimization capability that automatically determines which radio frequencies or channels will deliver the greatest network throughput based on actual observed capacity, a key benefit for high-density, noisy Wi-Fi environments.
Smart QoS—Our Smart QoS is a sophisticated software technology that manages traffic load to enhance the user experience. Smart QoS was developed to handle the increasing volumes of VoIP and streaming video traffic. Smart QoS offers automatic prioritization of different traffic types through intelligent analytics that classify, prioritize and schedule traffic for transmission. Smart QoS employs advanced queuing techniques and dedicated software queues on a per device basis to ensure fairness and optimize overall system performance. Smart QoS includes our band steering, rate limiting, client load balancing and airtime fairness techniques.
Smart Mesh—Our Smart Mesh is carrier-class software technology that uses advanced self-organizing network principles to create highly resilient, high-speed Wi-Fi backbone links between access points. Smart Mesh simplifies the deployment of both service provider and enterprise wireless networks by reducing cumbersome radio planning and costly cabling needed to reliably connect every Wi-Fi access point. Smart Mesh automatically establishes wireless connections between individual access points using patented smart antenna technology and self-heals in the event of a failed link. Smart Mesh gives service providers the flexibility to deploy infrastructure assets where needed with the assurance that both cellular and Wi-Fi traffic can be reliably and cost effectively backhauled.
SmartCell—Our SmartCell is a key technology behind our carrier-class SmartCell Gateway platform that integrates proprietary software and specialized hardware deployed at the edge of service provider networks to facilitate the integration of Wi-Fi and cellular infrastructures. SmartCell includes a set of modular software components as well as standard network interfaces into the mobile core that enable Wi-Fi to become a standard access mechanism for service providers. Management components provide configuration, user management, analytics, accounting and other operational and maintenance functions. Within a single architecture, SmartCell provides essential services necessary to incorporate Wi-Fi into existing mobile networks and next generation networks including Fourth Generation or Long Term Evolution networks, commonly referred to as 4G and LTE. We complement our gateway solution with incorporation of SmartCell technology and modular architecture in our access points. This permits us to provide a platform for combining high-speed Wi-Fi access, small cellular radios and wireless backhaul into a single, lightweight access point unit. This allows service providers the flexibility to install combinations of Wi-Fi and any cellular technology as needed, speeding deployment times, reducing the cost and complexity of small cell site acquisition, and lowering backhaul cost.
Smart Scaling—Our Smart Scaling uses advanced highly scalable database management techniques to enable the support of hundreds of thousands to millions of client devices across the Wi-Fi network. Smart Scaling employs intelligent data distribution techniques to extend client information, statistics and other vital user information across any number of nodes within the system without a single point of failure and with linear scalability. Smart Scaling is incorporated in our purpose-built hardware and software, making it capable of supporting hundreds of thousands of access points and user session workloads at the scale required by service providers.
Products and Services
Our Smart Wi-Fi solutions are marketed under the SmartCell, ZoneDirector, ZoneFlex and FlexMaster brands and include a full range of indoor and outdoor access points, or APs, long range point-to-point and point-to-multipoint bridges, wireless local area network, or LAN, controllers, network management software and gateway systems with integrated advanced wireless software.
The following is a description of our hardware products organized alphabetically by product family:
SmartCell Gateway—Our SmartCell Gateway is a carrier-class platform designed to be deployed at the edge of service provider networks to support and manage our Smart Wi-Fi APs and to serve as a platform for integration of Wi-Fi and other services into service provider network infrastructure. Our SmartCell Gateway is designed to be vendor-agnostic and can control third-party APs. Our SmartCell Gateway provides standard-based interfaces into existing and future mobile networks to simplify integration. As a highly scalable platform architecture capable of managing hundreds of thousands of access points and millions of clients, the SmartCell Gateway also functions as a modular service delivery platform for introducing value-added capabilities.
3
SmartCell Access Point—Our SmartCell access point addresses the capacity and density needs of service providers deploying networks within urban environments. SmartCell APs employ modular multimode architecture to enable service providers to deploy Wi-Fi, 3G/4G small cell cellular technology and Wi-Fi mesh backhaul within a single device. This provides operators with the ability to enhance and extend their macro networks, injecting much needed capacity into high traffic user environments with the flexibility to deploy Wi-Fi with Smart Mesh backhaul today and upgrade to Wi-Fi with 3G/LTE when and where desired without any mounting or backhaul changes.
ZoneDirector Smart Wireless LAN Controllers—Our family of Smart Wi-Fi controllers streamline the configuration and management of our access points. Our ZoneDirectors can be deployed onsite or remotely and include different models to serve small, medium and large-scale end-customers requiring from six to 1,000 access points. ZoneDirectors are typically deployed in a distributed forwarding architecture, eliminating the need to send all wireless traffic through the system. This mitigates any potential bottlenecks or any single point of failure. If customer requirements dictate, all wireless traffic can be tunneled to the ZoneDirector. Our software on all of our ZoneDirector Smart WLAN controllers uses a highly intuitive Web user interface to make configuration and administration extremely simple. This software includes a variety of advanced capabilities such as adaptive meshing, integrated client performance tools, extensive authentication support, simplified guest access and user policy, wireless intrusion prevention, automatic traffic redirection, integrated Wi-Fi client performance tools and robust network management.
ZoneFlex Indoor Smart Wi-Fi Products—Our ZoneFlex access points incorporate patented BeamFlex adaptive antenna array technology to deliver robust Wi-Fi performance, reliability and capacity. These devices support multiple virtual wireless LANs, Wi-Fi encryption and advanced traffic handling. ZoneFlex APs leverage our Smart Radio technology to extend signal range, automatically mitigate radio frequency, or RF, interference and intelligently route Wi-Fi transmissions over the fastest available signal paths. This allows customers and end-customers to deploy fewer APs for any particular coverage area. Flexible deployment options allow our Smart Wi-Fi access points to be installed as stand-alone APs or to be centrally managed through our ZoneDirector wireless LAN controller or our SmartCell Gateway platform. Within a centrally managed architecture, end-customers can extend their wireless networks through the use of our Smart Mesh technology without the need to run Ethernet cabling to locations where Ethernet is not possible or is cost prohibitive.
ZoneFlex Outdoor Smart Wi-Fi Products—Our high-capacity ZoneFlex outdoor Smart Wi-Fi access points and point-to-point and multipoint bridges can be deployed as stand-alone APs or be centrally managed. If no Ethernet cabling or broadband backhaul is available, our outdoor access points mesh with adjacent nodes leveraging our Smart Mesh technology. This gives end-customers cost advantages and deployment flexibility. Our ZoneFlex outdoor APs also incorporate BeamFlex adaptive antenna arrays to enable pervasive performance in high density use areas. ZoneFlex point-to-point and point-to-multipoint bridges provide a cost-effective solution to extend wireless capacity over long distances.
In addition to our hardware products, we also sell the following software products, and support and maintenance services:
FlexMaster—FlexMaster is a Linux-based Wi-Fi management service platform used by enterprises and service providers to monitor and administrate large-scale networks. FlexMaster provides configuration, fault detection, audit, performance management and optimization of remote Ruckus access points or wireless LAN controllers. It offers a single point for management and a number of automated and customized facilities such as an intuitive dashboard. FlexMaster is designed to operate with existing operational support system and features tiered administration to provide managed wireless LAN or cloud-based wireless services.
Support and Maintenance—We offer technical support and maintenance programs that encompass hardware, software, bug fixes, and access to future software upgrades on a when-and-if available basis. We offer Premium Support, Partner Premium Support and Software Upgrade Only Support through our technical support engineers and through our network of certified value-added resellers and distributors, which we refer to as our channel partners. For Partner Premium Support, our certified channel partners typically deliver level-one and level-two support and we provide level-three support. For Premium Support and Partner Premium Support, we provide expedited replacement for any defective hardware. We use a third-party logistics provider to manage our worldwide deployment of spares parts. Support and maintenance services are provided 24 hours a day, seven days a week through regional support centers that are located worldwide. These services are typically sold to channel partners and to end-customers for one to five year terms at the time of the initial product sale and may be renewed for successive periods.
Segment Information
The Company operates in one industry segment selling access points and controllers along with related software and services. Financial information about our operating segment and geographic areas is presented in Note 14 of Notes to Consolidated Financial Statements.
Customers
We sell our products to service providers and enterprises globally and have sold our products to over 21,700 end-customers worldwide. We added over 10,100 new end-customers during the year ended December 31, 2012. We sell to enterprises through a worldwide network of channel partners. Our enterprise end-customers are typically mid-sized organizations in a variety of industries, including hospitality, education, healthcare, warehousing and logistics, corporate enterprise, retail, state and local government and public venues, such as stadiums, convention centers, airports and major outdoor public areas. We also sell directly and indirectly to a range of service providers including mobile operators, cable companies, wholesale operators and fixed-line carriers. We have over 65 service provider end-customers, including Bright House Networks, The Cloud (a BSkyB Company), KDDI, Tikona Digital Networks, Time Warner Cable and Towerstream.
4
Sales and Marketing
We sell our products globally through direct and indirect channels. We target both enterprises and service providers that require carrier-class Wi-Fi solutions through our global force of sales personnel and systems engineers. They work with our global channel partners, which include value-added resellers and distributors. These channel partners provide lead generation, pre-sales support, product fulfillment and, in certain circumstances, post-sales customer service and support. In some instances, service providers may also act as a channel partner for sales of our solutions to enterprises. Our sales personnel and systems engineers typically engage directly with large service providers and certain enterprises whether or not product fulfillment involves our channel partners.
Customer Service and Support and Training
We employ a worldwide team of support engineers and other support personnel to provide customer service and technical support for our products. Our channel partners often provide customer support directly to end-customers. We then provide support to those channel partners as they require. In other situations, we provide customer support directly to end-customers. We also offer product training, primarily to our channel partners.
Research and Development
We have invested significant time and financial resources in the development of our ZoneFlex, SmartCell and other product lines and believe that continued investment in research and development is critical to our ongoing success. Our engineering group is located in research and design centers in California, Taiwan, China, and India. We expect to continue to expand our product offerings and solutions capabilities in the future and to invest significantly in continued research and development efforts.
Manufacturing
We outsource the warehousing and delivery of our products to a third-party logistics provider for worldwide fulfillment. In 2012, the Company began warehousing and delivering some products in the United States from our headquarters in Sunnyvale, California. We perform quality assurance and testing at our Sunnyvale, California facilities.
We use components from many suppliers. We have multiple sources for most of our components. However, we do depend on single source manufacturers for certain critical components. These critical components are technically unique and only available from these manufacturers. We maintain a close direct relationship with these manufacturers to ensure supply meets our requirements and ensure that we always have at least one month of supply on hand. If one of our single source suppliers suffers an interruption in their businesses, or experiences delays, disruptions or quality control problems in its manufacturing operations, or we otherwise have to change or add additional contract manufacturers or suppliers, our ability to ship products to our customers could be delayed, and our business adversely affected.
Competition
The market for wireless products is highly competitive and continually evolving.
Our competitors fall into three primary categories:
• | large telecommunications and networking equipment vendors, such as Cisco Systems and Ericsson; |
• | diversified technology companies, such as Hewlett-Packard and Motorola, that offer wireless products; and |
• | enterprise Wi-Fi companies, such as Aruba Networks, that offer products and services that compete with some of our products and capabilities. |
The principal competitive factors in our market include:
• | brand awareness and reputation; |
• | price and total cost of ownership; |
• | strength and scale of sales and marketing efforts, professional services and customer support; |
• | product features, reliability and performance; |
• | incumbency of current provider, either for Wi-Fi products or other products; |
• | scalability of products; |
• | ability to integrate with other technology infrastructures; and |
• | breadth of product offerings. |
We compete primarily based on the advanced coverage and scalability features of our products. Many of our competitors have substantially greater financial, technical and other resources, greater name recognition, larger sales and marketing budgets, broader distribution and larger and more mature intellectual property portfolios.
5
Intellectual Property
Our success depends in part upon our ability to protect our core technology and intellectual property. To accomplish this, we rely on federal, state, common law and international rights, including patents, trade secrets, copyrights and trademarks. We also rely on confidentiality and contractual restrictions, including entering into confidentiality and invention assignment agreements with our employees and contractors and confidentiality agreements with third parties.
We pursue registration of our patents, trademarks and domain names in the United States and certain locations outside the United States, focusing our patent, trademark, copyright and trade secret protection primarily in the United States, China, Taiwan and Europe. We actively seek patent protection covering inventions originating from the company. As of December 31, 2012 we have a portfolio of over 75 patents awarded by the United States Patent and Trademark Office and other patent offices around the world, as well as a number of pending patent applications, which cover a wide-range of Wi-Fi innovations. We currently have trademark applications and registrations in the United States and other countries, including the US Registered Trademark RUCKUS WIRELESS.
Circumstances outside our control could pose a threat to our intellectual property rights. For example, effective intellectual property protection may not be available in the United States or other countries in which we operate. The efforts we have taken to protect our proprietary rights may not be sufficient or effective. Any significant impairment of our intellectual property rights could harm our business or our ability to compete. Protecting our intellectual property rights is costly and time-consuming. Any unauthorized disclosure or use of our intellectual property could make it more expensive to do business and harm our operating results.
We operate in an industry with a significant level of intellectual property disputes, which may be between competitors or involve claims against operating companies brought by non-practicing entities. We currently face, and have faced in the past, allegations that we have infringed the patents of third parties, including our competitors and non-practicing entities. As we face increasing competition and as our business grows, we will likely face more claims of infringement of patents or other intellectual property rights.
Employees
As of December 31, 2012, we had 669 employees, 350 of whom were primarily engaged in research and development, 213 of whom were primarily engaged in sales and marketing and 106 of whom were primarily engaged in providing customer support, operations and administration and finance services. As of December 31, 2012, 380 of these employees are located outside the United States. None of our employees are represented by a labor union or covered by a collective bargaining agreement. We consider our relationship with our employees to be good.
Corporate Information
We were incorporated in 2002 in Delaware as Sceos Technologies, Inc. and subsequently changed our name to Video54 Technologies, Inc. and then to Ruckus Wireless, Inc. We effectively commenced operations on June 1, 2004, when a new board of directors was appointed and senior management was hired. We completed our initial public offering in November 2012 and our common stock is listed on the New York Stock Exchange under the symbol “RKUS.” Our headquarters are located at 350 West Java Drive, Sunnyvale, California 94089 and our telephone number is (650) 265-4200. Our website address is www.ruckuswireless.com. Information contained in, or accessible through, our website is not incorporated by reference into and does not form a part of this report.
We are an emerging growth company as defined in the Jumpstart Our Business Startups Act of 2012, or JOBS Act. We will remain an emerging growth company until the earlier of (1) the last day of the fiscal year (a) following the fifth anniversary of our initial public offering, (b) in which we have total annual gross revenue of at least $1.0 billion, or (c) in which we are deemed to be a large accelerated filer, which means the market value of our common stock that is held by non-affiliates exceeds $700 million as of the prior June 30th, or (2) the date on which we have issued more than $1.0 billion in non-convertible debt securities during the prior three year period.
Available Information
Our website is located at www.ruckuswireless.com, and our investor relations website is located at http://investors.ruckuswireless.com/. The contents of our website are not intended to be incorporated by reference into this Annual Report on Form 10-K or in any other report or document we file with the Securities and Exchange Commission, or SEC, and any references to our websites are intended to be inactive textual references only. The following filings are available through our investor relations website after we file them with the SEC: Annual Reports on Form 10-K, Quarterly Reports on Form 10-Q, Current Reports on Form 8-K, as well as any amendments to such reports and all other filings pursuant to Section 13(a) or 15(d) of the Securities Act. These filings are also available for download free of charge on our investor relations website. Additionally, copies of materials filed by us with the SEC may be accessed at the SEC's Public Reference Room at 100 F Street, N.E., Washington, D.C. 20549 or at www.sec.gov. For information about the SEC's Public Reference Room, contact 1-800-SEC-0330.
6
ITEM 1A. RISK FACTORS
In evaluating Ruckus and our business, you should carefully consider the risks and uncertainties described below, together with all of the other information in this report, including our consolidated financial statements and related notes. The risks and uncertainties described below are not the only ones we face. If any of the following risks occur, our business, financial condition, operating results, and prospects could be materially harmed. In that event, the price of our common stock could decline, and you could lose part or all of your investment.
Risks Related to Our Business and Industry
If the market for our products does not develop as we expect, demand for our products may not grow as we expect.
We develop and provide Wi-Fi products for service providers and enterprises. The success of our business depends on the continued growth and reliance on Wi-Fi in these markets. The recent growth of the market for Wi-Fi networks is being driven by the increased use of Wi-Fi-enabled mobile devices and the use of Wi-Fi as a preferred connectivity option to support video, voice and other higher-bandwidth uses.
A number of barriers may prevent service providers or their subscribers from adopting Wi-Fi technology to address the capacity gap in wireless networks. For example, Wi-Fi operates over an unlicensed radio spectrum, and if the Wi-Fi spectrum becomes crowded, Wi-Fi solutions will be a less attractive option for service providers. In addition, in order for Wi-Fi solutions to adequately address the potential future capacity gap between cellular capacity and demand, mobile devices should automatically switch from a cellular data network to the service provider’s Wi-Fi network, when available and appropriate. Generally, mobile devices do not switch to unauthenticated Wi-Fi networks without input from the device user, and often require the user to log in when a new Wi-Fi network is accessed, which may tend to limit a subscriber’s use of Wi-Fi. These and other factors could limit or slow the adoption of Wi-Fi technologies by service providers as a means to address this potential future capacity gap.
There is no guarantee that service providers and enterprises will continue to utilize Wi-Fi technology, that use of Wi-Fi-enabled mobile devices will continue to increase or that Wi-Fi will continue to be the preferred connectivity option for the uses described above. There is also no guarantee that service providers and enterprises will understand the benefits we believe that our Smart Wi-Fi solutions provide. If another technology were found to be superior to Wi-Fi by service providers and enterprises, it would have a material adverse effect on our business, operating results and financial condition. As a result, demand for our products may not continue to develop as we anticipate, or at all.
Our operating results may fluctuate significantly, which makes our future operating results difficult to predict and could cause our operating results to fall below expectations or our guidance.
Our quarterly and annual operating results have fluctuated in the past and may fluctuate significantly in the future, which makes it difficult for us to predict our future operating results. The timing and size of sales of our products are highly variable and difficult to predict and can result in significant fluctuations in our net revenue from period to period. This is particularly true of our sales to service providers, whose purchases are generally larger than those of our enterprise customers, causing greater variation in our results based on when service providers take delivery of our products.
In addition, our budgeted expense levels depend in part on our expectations of future revenue. Because any substantial adjustment to expenses to account for lower levels of revenue is difficult and takes time, we may not be able to reduce our costs sufficiently to compensate for an unexpected shortfall in net revenue, and even a small shortfall in net revenue could disproportionately and adversely affect our operating margin and operating results for a given quarter.
Our operating results may also fluctuate due to a variety of other factors, many of which are outside of our control, including the changing and volatile U.S., European and global economic environments, and any of which may cause our stock price to fluctuate. In addition to other risks listed in this “Risk Factors” section, factors that may affect our operating results include:
• | fluctuations in demand for our products and services, including seasonal variations in certain enterprise sectors such as hospitality and education, where end-customers place orders most heavily in the second and third quarters; |
• | the inherent complexity, length and associated unpredictability of our sales cycles for our products and services, particularly with respect to sales to service providers; |
• | changes in customers’ budgets for technology purchases and delays in their purchasing cycles; |
• | technical challenges in service providers’ overall networks, unrelated to our products, which could delay adoption and installation of our products; |
• | changing market conditions, including current and potential service provider consolidation; |
• | any significant changes in the competitive dynamics of our markets, including new entrants, or further consolidation; |
• | variation in sales channels, product costs or mix of products sold; |
• | our contract manufacturers and component suppliers’ ability to meet our product demand forecasts at acceptable prices, or at all; |
• | the timing of product releases or upgrades by us or by our competitors; |
• | our ability to develop, introduce and ship in a timely manner new products and product enhancements and anticipate future market demands that meet our customers’ requirements; |
• | our ability to successfully expand the suite of products we sell to existing customers; |
7
• | the potential need to record incremental inventory reserves for products that may become obsolete due to our new product introductions; |
• | our ability to control costs, including our operating expenses and the costs of the components we purchase; |
• | any decision to increase or decrease operating expenses in response to changes in the marketplace or perceived marketplace opportunities; |
• | growth in our headcount and other related costs incurred in our customer support organization; |
• | volatility in our stock price, which may lead to higher stock compensation expenses; |
• | our ability to derive benefits from our investments in sales, marketing, engineering or other activities; and |
• | general economic or political conditions in our domestic and international markets, in particular the restricted credit environment impacting the credit of our customers. |
The cumulative effects of these factors could result in large fluctuations and unpredictability in our quarterly and annual operating results. As a result, comparing our operating results on a period-to-period basis may not be meaningful. You should not rely on our past results as an indication of our future performance. This variability and unpredictability could also result in our failing to meet the expectations of industry or financial analysts or investors for any period. If our revenue or operating results fall below the expectations of analysts or investors or below any forecasts we may provide to the market, or if the forecasts we provide to the market are below the expectations of analysts or investors, the price of our common stock could decline substantially. Such a stock price decline could occur even when we have met any previously publicly stated revenue and/or earnings forecasts we may provide.
The growth rate in recent periods of our revenue, net income and margin may not be indicative of our future performance.
You should not consider the growth rate in our revenue, net income or margin in recent periods as indicative of our future performance. We do not expect to achieve similar revenue, net income or margin growth rates in future periods. You should not rely on our revenue, net income or margin for any prior quarterly or annual periods as any indication of our future revenue, net income or margin, or their rate of growth. If we are unable to maintain consistent revenue, net income or margin, or growth of any of these financial measures, our stock price could be volatile, and it may be difficult to maintain profitability.
Our sales cycles can be long and unpredictable, particularly to service providers, and our sales efforts require considerable time and expense. As a result, our sales and revenue are difficult to predict and may vary substantially from period to period, which may cause our operating results to fluctuate significantly.
The timing of our revenues is difficult to predict. Our sales efforts involve educating our potential end-customers and channel partners about the applications and benefits of our products, including the technical capabilities of our products. Service providers typically require long sales cycles, which generally range between one and three years, but can be longer. The sale to a large service provider usually begins with an evaluation, followed by one or more network trials, followed by vendor selection and contract negotiation and finally followed by installation, testing and deployment. Sales cycles for enterprises are typically less than 90 days. We spend substantial time and resources on our sales efforts without any assurance that our efforts will produce any sales. In addition, purchases of our products are frequently subject to budget constraints, multiple approvals, and unplanned administrative, processing and other delays. Moreover, the evolving nature of the market may lead prospective end-customers to postpone their purchasing decisions pending resolution of Wi-Fi or other standards or adoption of technology by others. Even if an end-customer makes a decision to purchase our products, there may be circumstances or terms relating to the purchase that delay our ability to recognize revenue from that purchase, which makes our revenue difficult to forecast. As a result, it is difficult to predict whether a sale will be completed, the particular fiscal period in which a sale will be completed or the fiscal period in which revenue from a sale will be recognized. Our operating results may therefore vary significantly from quarter to quarter.
With respect to service providers, we have only a short history of making sales, and there remains uncertainty as to whether a significant service provider market for our products will develop. Sales to service providers have been characterized by large and sporadic purchases, in addition to long sales cycles. Sales activity to service providers depends upon the stage of completion of expanding network infrastructures, the availability of funding, and the extent to which service providers are affected by regulatory, economic and business conditions in their country of operations. The nature of this sales activity to service providers can result in further fluctuations in our operating results from period to period. Orders from service providers could decline for many reasons unrelated to the competitiveness of our products and services within their respective markets, such as advances in competing technologies. Our service provider end-customers typically have long implementation cycles, require a broader range of services, and often require acceptance terms that can lead to a delay in revenue recognition. Some of our current or prospective service provider end-customers have cancelled or delayed and may in the future cancel or delay spending on the development or roll-out of capital and technology projects with us due to continuing economic uncertainty and, consequently, our financial position, results of operations or cash flows may be adversely affected. Weakness in orders from service providers, including as a result of any slowdown in capital expenditures by service providers, which may be more prevalent during a global economic downturn or periods of economic uncertainty, could have a material adverse effect on our business, financial position, results of operations, cash flows and stock price.
Our large end-customers, particularly service providers, have substantial negotiating leverage, which may require that we agree to terms and conditions that could result in decreased revenues and gross margins. The loss of a single large end-customer could adversely affect our business.
Many of our end-customers are service providers or larger enterprises that have substantial purchasing power and leverage in negotiating contractual arrangements with us. These end-customers may require us to develop additional product features, may require penalties for non-performance of certain obligations, such as delivery, outages or response time, and may have multi-vendor strategies. The leverage held by these large end-customers could result in decreases in our revenues and gross margins. The loss of a single large end-customer could materially harm our business and operating results.
8
We compete in highly competitive markets, and competitive pressures from existing and new companies may harm our business, revenues, growth rates and market share. In addition, many of our current or potential competitors have longer operating histories, greater brand recognition, larger customer bases and significantly greater resources than we do, and we may lack sufficient financial or other resources to maintain or improve our competitive position.
The markets in which we compete are intensely competitive, and we expect competition to increase in the future from established competitors and new market entrants. The markets are influenced by, among others, the following competitive factors:
• | brand awareness and reputation; |
• | price and total cost of ownership; |
• | strength and scale of sales and marketing efforts, professional services and customer support; |
• | product features, reliability and performance; |
• | incumbency of current provider, either for Wi-Fi products or other products; |
• | scalability of products; |
• | ability to integrate with other technology infrastructures; and |
• | breadth of product offerings. |
Our competitors include Cisco Systems, Ericsson, Hewlett-Packard, Motorola and Aruba Networks. We expect competition to intensify in the future as other companies introduce new products into our markets. This competition could result in increased pricing pressure, reduced profit margins, increased sales and marketing expenses and failure to increase, or the loss of, market share, any of which would likely seriously harm our business, operating results or financial condition. If we do not keep pace with product and technology advances, there could be a material and adverse effect on our competitive position, revenues and prospects for growth.
A number of our current or potential competitors such as Cisco Systems, Ericsson, Hewlett-Packard and Motorola, have longer operating histories, greater name recognition, larger customer bases and significantly greater financial, technical, sales, marketing and other resources than we do. Our competitors may be able to anticipate, influence or adapt more quickly to new or emerging technologies and changes in customer requirements, devote greater resources to the promotion and sale of their products and services, initiate or withstand substantial price competition, take advantage of acquisitions or other opportunities more readily and develop and expand their product and service offerings more quickly than we can. In addition, certain competitors may be able to leverage their relationships with customers based on other products or incorporate functionality into existing products to gain business in a manner that discourages customers from purchasing our products, including through selling at zero or negative margins, product bundling or closed technology platforms. Potential end-customers may prefer to purchase all of their equipment from a single provider, or may prefer to purchase wireless networking products from an existing supplier rather than a new supplier, regardless of product performance or features.
We expect increased competition from our current competitors, as well as other established and emerging companies, to the extent our markets continue to develop and expand. Conditions in our markets could change rapidly and significantly as a result of technological advancements or other factors. Some of our competitors have made acquisitions or entered into partnerships or other strategic relationships to offer a more comprehensive solution than they individually had offered. We expect this trend to continue as companies attempt to strengthen or maintain their market positions in an evolving industry and as companies enter into partnerships or are acquired. The companies resulting from these possible consolidations may create more compelling product offerings and be able to offer greater pricing flexibility, making it more difficult for us to compete effectively, including on the basis of price, sales and marketing programs, technology or product functionality. Continued industry consolidation may adversely impact customers’ perceptions of the viability of smaller and even medium-sized technology companies such as us and, consequently, customers’ willingness to purchase from such companies. These pressures could materially adversely affect our business, operating results and financial condition.
We compete in rapidly evolving markets and depend upon the development of new products and enhancements to our existing products. If we fail to predict and respond to emerging technological trends and our customers’ changing needs, we may not be able to remain competitive.
The Wi-Fi and wireless networking market is generally characterized by rapidly changing technology, changing end-customer needs, evolving industry standards and frequent introductions of new products and services. To succeed, we must effectively anticipate, and adapt in a timely manner to, end-customer requirements and continue to develop or acquire new products and features that meet market demands, technology trends and regulatory requirements. Likewise, if our competitors introduce new products and services that compete with ours, we may be required to reposition our product and service offerings or introduce new products and services in response to such competitive pressure. If we fail to develop new products or product enhancements, or our end-customers or potential end-customers do not perceive our products to have compelling technical advantages, our business could be adversely affected, particularly if our competitors are able to introduce solutions with such increased functionality. Developing our products is expensive, complex and involves uncertainties. Each phase in the development of our products presents serious risks of failure, rework or delay, any one of which could impact the timing and cost-effective development of such product and could jeopardize end-customer acceptance of the product. We have experienced in the past and may in the future experience design, manufacturing, marketing and other difficulties that could delay or prevent the development, introduction or marketing of new products and enhancements. In addition, the introduction of new or enhanced products requires that we carefully manage the transition from older products to minimize disruption in customer ordering practices and ensure that new products can be timely delivered to meet our customers’ demand. As a result, we may not be successful in modifying our current products or introducing new products in a timely or appropriately responsive manner, or at all. If we fail to address these changes successfully, our business and operating results could be materially harmed.
9
We base our inventory purchasing decisions on our forecasts of customers’ demand, and if our forecasts are inaccurate, our operating results could be materially harmed.
We place orders with our manufacturers based on our forecasts of our customers’ demand. Our forecasts are based on multiple assumptions, each of which may cause our estimates to be inaccurate, affecting our ability to provide products to our customers. When demand for our products increases significantly, we may not be able to meet demand on a timely basis, and we may need to expend a significant amount of time working with our customers to allocate limited supply and maintain positive customer relations, or we may incur additional costs in order to rush the manufacture and delivery of additional products. If we underestimate customers’ demand, we may forego revenue opportunities, lose market share and damage our customer relationships. Conversely, if we overestimate customer demand, we may purchase more inventory than we are able to sell at any given time or at all. In addition, we grant our distributors stock rotation rights, which require us to accept stock back from a distributor’s inventory, including obsolete inventory. As a result of our failure to estimate demand for our products, and our distributor’s stock rotation rights, we could have excess or obsolete inventory, resulting in a decline in the value of our inventory, which would increase our costs of revenues and reduce our liquidity. Our failure to accurately manage inventory relative to demand would adversely affect our operating results.
If we are unable to manage our growth and expand our operations successfully, our business and operating results will be harmed and our reputation may be damaged.
We have expanded our operations significantly since inception and anticipate that further significant expansion will be required to achieve our business objectives. The growth and expansion of our business and product offerings places a continuous and significant strain on our management, operational and financial resources. Any such future growth would also add complexity to and require effective coordination throughout our organization.
To manage any future growth effectively, we must continue to improve and expand our information technology and financial infrastructure, our operating and administrative systems and controls, and our ability to manage headcount, capital and processes in an efficient manner. We may not be able to successfully implement improvements to these systems and processes in a timely or efficient manner, which could result in additional operating inefficiencies and could cause our costs to increase more than planned. If we do increase our operating expenses in anticipation of the growth of our business and this growth does not meet our expectations, our operating results may be negatively impacted. If we are unable to manage future expansion, our ability to provide high quality products and services could be harmed, which could damage our reputation and brand and may have a material adverse effect on our business, operating results and financial condition.
If material weaknesses occur, we may not be able to report our financial results accurately, prevent fraud or file our periodic reports as a public company in a timely manner.
In connection with the audit of our consolidated financial statements for the years ended December 31, 2011 and 2010, our independent registered public accountants identified a material weakness in our internal control over financial reporting. The material weakness resulted in the need for adjustments to our financial statements during the audit. A “material weakness” is a deficiency, or a combination of deficiencies, in internal control over financial reporting such that there is a reasonable possibility that a material misstatement of our annual or interim financial statements will not be prevented or detected on a timely basis.
The material weakness related to a failure to properly design our financial closing and reporting process, which resulted from insufficient accounting resources throughout the years being audited to analyze, record, review and monitor compliance with generally accepted accounting principles for transactions on a timely basis. The resulting errors primarily related to improper estimation of best estimated selling price and vendor specific objective evidence as required properly to recognize revenue and to the capitalization of overhead in inventory.
As of December 31, 2012, we have remediated the previously identified material weakness. We cannot be certain, however, that the remediation of the material weaknesses will be sustained, or that other material weaknesses will not be discovered in the future. If material weaknesses occur in the future, we may be unable to report our financial results accurately on a timely basis or help prevent fraud, which could cause our reported financial results to be materially misstated and result in the loss of investor confidence or delisting and cause the market price of our common stock to decline.
Failure to successfully implement our new enterprise resource planning system could impact our ability to operate our business, lead to internal control and reporting weaknesses and adversely affect our results of operations and financial condition.
We are in the process of implementing a new ERP information management system to provide for greater depth and breadth of functionality and effectively manage our business data, communications, supply chain, order entry and fulfillment, inventory and warehouse management and other business processes. A delay in such implementation, problems with transitioning to our upgraded ERP system or a failure of our new system to perform as we anticipate may result in transaction errors, processing inefficiencies and the loss of sales, may otherwise disrupt our operations and materially and adversely affect our business, results of operations and financial condition and may harm our ability to accurately forecast sales demand, manage our supply chain, fulfill customer orders and report financial and management information on a timely and accurate basis. In addition, due to the internal control features embedded within ERP systems, we may experience difficulties that may affect our internal control over financial reporting, which may create a significant deficiency or material weakness in our overall internal controls. Initial implementation for our new ERP system began in the first quarter of 2013. We stopped using our old ERP system immediately when we launched our new ERP system, so we do not have an immediate backup system if our new ERP system fails to perform as we anticipate.
10
We have a limited operating history, which makes it difficult to evaluate our prospects and future financial results and may increase the risk that we will not be successful.
We were incorporated in August 2002, began commercial shipments of our products and systems in 2005 and only achieved significant levels of revenue in 2010. As a result of our limited operating history, it is very difficult to forecast our future operating results. Our prospects should be considered and evaluated in light of the risks and uncertainties frequently encountered by companies with limited operating histories. These risks and difficulties include challenges in accurate financial planning as a result of limited historical data and the uncertainties resulting from having had a relatively limited time period in which to implement and evaluate our business strategies as compared to older companies with longer operating histories.
Some of the components and technologies used in our products are purchased from a single source or a limited number of sources. The loss of any of these suppliers may cause us to incur additional transition costs, result in delays in the manufacturing and delivery of our products, or cause us to carry excess or obsolete inventory and could cause us to redesign our products.
Although supplies of our components are generally available from a variety of sources, we currently depend on a single source or limited number of sources for several components for our products. We have also entered into license agreements with some of our suppliers for technologies that are used in our products, and the termination of these licenses, which can generally be done on relatively short notice, could have a material adverse effect on our business. For example, we purchase standard Wi-Fi chipsets only from Qualcomm Atheros and our products incorporate certain technology that we license from Qualcomm Atheros. If that license agreement were terminated, we would be required to redesign some of our products in order to incorporate technology from alternative sources, and any such termination of the license agreement and redesign of certain of our products could require additional licenses and materially and adversely affect our business and operating results.
Because there are no other sources identical to several of our components and technologies, if we lost any of these suppliers or licenses, we could be required to transition to a new supplier or licensor, which could increase our costs, result in delays in the manufacturing and delivery of our products or cause us to carry excess or obsolete inventory. Additionally, poor quality in any of the sole-sourced components in our products could result in lost sales or lost sales opportunities. If the quality of the components does not meet our or our customers’ requirements, if we are unable to obtain components from our existing suppliers on commercially reasonable terms, or if any of our sole source providers cease to remain in business or continue to manufacture such components, we could be required to redesign our products in order to incorporate components or technologies from alternative sources. The resulting stoppage or delay in selling our products and the expense of redesigning our products could result in lost sales opportunities and damage to customer relationships, which would adversely affect our reputation, business and operating results.
In addition, for certain components for which there are multiple sources, we are subject to potential price increases and limited availability due to market demand for such components. In the past, unexpected demand for communication products caused worldwide shortages of certain electronic parts. If such shortages occur in the future and we are unable to pass component price increases along to our customers or maintain stable or competitive pricing, our gross margins and operating results could be negatively impacted.
Because we rely on third parties to manufacture our products, our ability to supply products to our customers may be disrupted.
We outsource the manufacturing of our products to third-party manufacturers. Our reliance on these third-party manufacturers reduces our control over the manufacturing process and exposes us to risks, including reduced control over quality assurance, product costs, and product supply and timing. Any manufacturing disruption by these third-party manufacturers could severely impair our ability to fulfill orders. Our reliance on outsourced manufacturers also yields the potential for infringement or misappropriation of our intellectual property. If we are unable to manage our relationships with these third-party manufacturers effectively, or if these third-party manufacturers suffer delays or disruptions for any reason, experience increased manufacturing lead-times, capacity constraints or quality control problems in their manufacturing operations, or fail to meet our future requirements for timely delivery, our ability to ship products to our customers would be severely impaired, and our business and operating results would be seriously harmed.
These manufacturers typically fulfill our supply requirements on the basis of individual orders. We do not have long term contracts with our third-party manufacturers that guarantee capacity, the continuation of particular pricing terms or the extension of credit limits. Accordingly, our third-party manufacturers are not obligated to continue to fulfill our supply requirements, which could result in supply shortages, and the prices we are charged for manufacturing services could be increased on short notice. In addition, as a result of current global financial market conditions, natural disasters or other causes, it is possible that any of our manufacturers could experience interruptions in production, cease operations or alter our current arrangements. If our manufacturers are unable or unwilling to continue manufacturing our products in required volumes, we will be required to identify one or more acceptable alternative manufacturers. It is time-consuming and costly and could be impractical to begin to use new manufacturers, and changes in our third-party manufacturers may cause significant interruptions in supply if the new manufacturers have difficulty manufacturing products to our specification. As a result, our ability to meet our scheduled product deliveries to our customers could be adversely affected, which could cause the loss of sales to existing or potential customers, delayed revenue or an increase in our costs. Any production interruptions for any reason, such as a natural disaster, epidemic, capacity shortages or quality problems, at one of our manufacturers would negatively affect sales of our product lines manufactured by that manufacturer and adversely affect our business and operating results.
We rely significantly on channel partners to sell and support our products, and the failure of this channel to be effective could materially reduce our revenue.
The majority of our sales are through channel partners. We believe that establishing and maintaining successful relationships with these channel partners is, and will continue to be, important to our financial success. Recruiting and retaining qualified channel partners and training them in our technology and product offerings require significant time and resources. To develop and expand our channel, we must continue to scale and improve our processes and procedures that support our channel partners, including investment in systems and training.
11
Existing and future channel partners will only work with us if we are able to provide them with competitive products on terms that are commercially reasonable to them. If we fail to maintain the quality of our products or to update and enhance them, existing and future channel partners may elect to work instead with one or more of our competitors. In addition, the terms of our arrangements with our channel partners must be commercially reasonable for both parties. If we are unable to reach agreements that are beneficial to both parties, then our channel partner relationships will not succeed.
We have no minimum purchase commitments with any of our channel partners, and our contracts with channel partners do not prohibit them from offering products or services that compete with ours, including products they currently offer or may develop in the future and incorporate into their own systems. Some of our competitors may have stronger relationships with our channel partners than we do and we have limited control, if any, as to whether those partners use our products, rather than our competitors’ products, or whether they devote resources to market and support our competitors’ products, rather than our offerings.
The reduction in or loss of sales by these channel partners could materially reduce our revenue. If we fail to maintain relationships with our channel partners, fail to develop new relationships with other channel partners in new markets, fail to manage, train or incentivize existing channel partners effectively, fail to provide channel partners with competitive products on terms acceptable to them, or if these channel partners are not successful in their sales efforts, our revenue may decrease and our operating results could suffer.
Our ability to sell our products is highly dependent on the quality of our support and services offerings, and our failure to offer high quality support and services would have a material adverse effect on our sales and results of operations.
Once our products are deployed, our channel partners and end-customers depend on our support organization to resolve any issues relating to our products. A high level of support is important for the successful marketing and sale of our products. In many cases, our channel partners provide support directly to our end-customers. We do not have complete control over the level or quality of support provided by our channel partners. These channel partners may also provide support for other third-party products, which may potentially distract resources from support for our products. If we and our channel partners do not effectively assist our end-customers in deploying our products, succeed in helping our end-customers quickly resolve post-deployment issues or provide effective ongoing support, it would adversely affect our ability to sell our products to existing end-customers and could harm our reputation with potential end-customers. In some cases, we guarantee a certain level of performance to our channel partners and end-customers, which could prove to be resource-intensive and expensive for us to fulfill if unforeseen technical problems were to arise.
Many of our service provider and large enterprise customers have more complex networks and require higher levels of support than our smaller end-customers. We have recently expanded our support organization for service provider and large enterprise end-customers, and continue to develop this organization. If we fail to build this organization quickly enough, or it fails to meet the requirements of our service provider or large enterprise end-customers, it may be more difficult to execute on our strategy to increase our sales to large end-customers. In addition, given the extent of our international operations, our support organization faces challenges, including those associated with delivering support, training and documentation in languages other than English. As a result of all of these factors, our failure to maintain high quality support and services would have a material adverse effect on our business, operating results and financial condition.
The loss of key personnel or an inability to attract, retain and motivate qualified personnel may impair our ability to expand our business.
Our success is substantially dependent upon the continued service and performance of our senior management team and key technical, marketing and production personnel, including Selina Lo, who is our President and Chief Executive Officer, William Kish, who is one of our co-founders and our Chief Technology Officer, and Victor Shtrom, who is our other co-founder and Chief Wireless Architect. Our employees, including our senior management team, are at-will employees, and therefore may terminate employment with us at any time with no advance notice. The replacement of any members of our senior management team or other key personnel likely would involve significant time and costs and may significantly delay or prevent the achievement of our business objectives.
Our future success also depends, in part, on our ability to continue to attract, integrate and retain highly skilled personnel. Competition for highly skilled personnel is frequently intense, especially in the San Francisco Bay Area, where we have a substantial presence and need for highly skilled personnel. Volatility or lack of performance in our stock price may also affect our ability to attract and retain our key employees. Many of our employees have become, or will soon become, vested in a substantial amount of stock or stock options. Our employees may be more likely to leave us if the shares they own or the shares underlying their vested options have significantly appreciated in value relative to the original purchase prices of the shares or the exercise prices of the options, or if the exercise prices of the options that they hold are significantly above the market price of our common stock. Further, our employees’ ability to exercise those options and sell their stock in a public market is likely to result in a higher than normal turnover rate. Any failure to successfully attract, integrate or retain qualified personnel to fulfill our current or future needs may negatively impact our growth. Also, to the extent we hire personnel from our competitors, we may be subject to allegations that these new hires have been improperly solicited, or that they have divulged proprietary or other confidential information, or that their former employers own their inventions or other work product.
Our products incorporate complex technology and may contain defects or errors. We may become subject to warranty claims, product returns, product liability and product recalls as a result, any of which could cause harm to our reputation and adversely affect our business.
Our products incorporate complex technology and must operate with cellular networks and a significant number and range of mobile devices using Wi-Fi, while supporting new and complex applications in a variety of environments that utilize different Wi-Fi communication industry standards. Our products have contained, and may contain in the future, undetected defects or errors. Some errors in our products have been and may in the future only be discovered after a product has been installed and used by end-customers. These issues are most prevalent when new products are introduced into the market. Defects or errors have delayed and may in the future delay the introduction of our new products. Since our products contain components that we purchase from third parties, we also expect our products to contain latent defects and errors from time to time related to those third-party components.
12
Additionally, defects and errors may cause our products to be vulnerable to security attacks, cause them to fail to help secure networks or temporarily interrupt end-customers’ networking traffic. Because the techniques used by computer hackers to access or sabotage networks are becoming increasingly sophisticated, change frequently and generally are not recognized until launched against a target, our products and third-party security products may be unable to anticipate these techniques and provide a solution in time to protect our end-customers’ networks. In addition, defects or errors in the mechanism by which we provide software updates for our products could result in an inability to update end-customers’ hardware products and thereby leave our end-customers vulnerable to attacks.
Real or perceived defects or errors in our products could result in claims by channel partners and end-customers for losses that they sustain, including potentially losses resulting from security breaches of our end-customers’ networks and/or downtime of those networks. If channel partners or end-customers make these types of claims, we may be required, or may choose, for customer relations or other reasons, to expend additional resources in order to help correct the problem, including warranty and repair costs, process management costs and costs associated with remanufacturing our inventory. Liability provisions in our standard terms and conditions of sale may not be enforceable under some circumstances or may not fully or effectively protect us from claims and related liabilities and costs. In addition, regardless of the party at fault, errors of these kinds divert the attention of our engineering personnel from our product development efforts, damage our reputation and the reputation of our products, cause significant customer relations problems and can result in product liability claims. We maintain insurance to protect against certain types of claims associated with the use of our products, but our insurance coverage may not adequately cover any such claims. In addition, even claims that ultimately are unsuccessful could result in expenditures of funds in connection with litigation and divert management’s time and other resources. We also may incur costs and expenses relating to a recall of one or more of our products. The process of identifying recalled products that have been widely distributed may be lengthy and require significant resources, and we may incur significant replacement costs, contract damage claims from our customers and significant harm to our reputation. The occurrence of these problems could result in the delay or loss of market acceptance of our products and could adversely impact our business, operating results and financial condition.
If our products do not interoperate with cellular networks and mobile devices, future sales of our products could be negatively affected.
Our products are designed to interoperate with cellular networks and mobile devices using Wi-Fi technology. These networks and devices have varied and complex specifications. As a result, we must attempt to ensure that our products interoperate effectively with these existing and planned networks and devices. To meet these requirements, we have and must continue to undertake development and testing efforts that require significant capital and employee resources. We may not accomplish these development efforts quickly or cost-effectively, or at all. If our products do not interoperate effectively, orders for our products could be delayed or cancelled, which would harm our revenue, gross margins and our reputation, potentially resulting in the loss of existing and potential end-customers. The failure of our products to interoperate effectively with cellular networks or mobile devices may result in significant warranty, support and repair costs, divert the attention of our engineering personnel from our product development efforts and cause significant customer relations problems. In addition, our end-customers may require our products to comply with new and rapidly evolving security or other certifications and standards. If our products are late in achieving or fail to achieve compliance with these certifications and standards, or our competitors achieve compliance with these certifications and standards, such end-customers may not purchase our products, which would harm our business, operating results and financial condition.
Although certain technical problems experienced by users may not be caused by our products, our business and reputation may be harmed if users perceive our solution as the cause of a slow or unreliable network connection, or a high profile network failure.
Our products have been deployed in many different locations and user environments and are capable of providing connectivity to many different types of Wi-Fi-enabled devices operating a variety of applications. The ability of our products to operate effectively can be negatively impacted by many different elements unrelated to our products. For example, a user’s experience may suffer from an incorrect setting in a Wi-Fi device. Although certain technical problems experienced by users may not be caused by our products, users often may perceive the underlying cause to be a result of poor performance of the wireless network. This perception, even if incorrect, could harm our business and reputation. Similarly, a high profile network failure may be caused by improper operation of the network or failure of a network component that we did not supply, but other service providers may perceive that our products were implicated, which, even if incorrect, could harm our business, operating results and financial condition.
Our corporate culture has contributed to our success, and if we cannot maintain this culture, especially as we grow, we could lose the innovation, creativity, and teamwork fostered by our culture, and our business may be harmed.
We believe that a critical contributor to our success has been our corporate culture, which we believe fosters innovation, teamwork, passion for customers, and focus on execution, as well as facilitating critical knowledge transfer and knowledge sharing. As we grow and change, we may find it difficult to maintain these important aspects of our corporate culture, which could limit our ability to innovate and operate effectively. Any failure to preserve our culture could also negatively affect our ability to retain and recruit personnel, continue to perform at current levels or execute on our business strategy.
Our business, operating results and growth rates may be adversely affected by current or future unfavorable economic and market conditions.
Our business depends on the overall demand for wireless network technology and on the economic health and general willingness of our current and prospective end-customers to make those capital commitments necessary to purchase our products. If the conditions in the U.S. and global economies remain uncertain or continue to be volatile, or if they deteriorate further, our business, operating results and financial condition may be materially adversely affected. Economic weakness, end-customer financial difficulties, limited availability of credit and constrained capital spending have resulted, and may in the future result, in challenging and delayed sales cycles, slower adoption of new technologies and increased price competition, and could negatively impact our ability to forecast future periods, which could result in an inability to satisfy demand for our products and a loss of market share.
13
In particular, we cannot be assured of the level of spending on wireless network technology, the deterioration of which would have a material adverse effect on our results of operations and growth rates. The purchase of our products or willingness to replace existing infrastructure is discretionary and highly dependent on a perception of continued rapid growth in consumer usage of mobile devices and in many cases involves a significant commitment of capital and other resources. Therefore, weak economic conditions or a reduction in capital spending would likely adversely impact our business, operating results and financial condition. A reduction in spending on wireless network technology could occur or persist even if economic conditions improve.
In addition, if interest rates rise or foreign exchange rates weaken for our international customers, overall demand for our products and services could decline and related capital spending may be reduced. Furthermore, any increase in worldwide commodity prices may result in higher component prices for us and increased shipping costs, both of which may negatively impact our financial results.
Our reported financial results may be adversely affected by changes in accounting principles applicable to us.
Generally accepted accounting principles in the United States, or U.S. GAAP, are subject to interpretation by the Financial Accounting Standards Board, or FASB, the SEC and other various bodies formed to promulgate and interpret appropriate accounting principles. A change in these principles or interpretations could have a significant effect on our reported financial results, and could affect the reporting of transactions completed before the announcement of any such change. Any difficulties in the implementation of these pronouncements could cause us to fail to meet our financial reporting obligations, which could result in regulatory discipline.
If our estimates relating to our critical accounting policies are based on assumptions or judgments that change or prove to be incorrect, our operating results could fall below expectations of financial analysts and investors, resulting in a decline in our stock price.
The preparation of financial statements in conformity with U.S. GAAP requires our management to make estimates, assumptions and judgments that affect the amounts reported in the financial statements and accompanying notes. We base our estimates on historical experience and on various other assumptions that we believe to be reasonable under the circumstances, the results of which form the basis for making judgments about the carrying values of assets, liabilities, equity, revenue and expenses that are not readily apparent from other sources. Our operating results may be adversely affected if our assumptions change or if actual circumstances differ from those in our assumptions, which could cause our operating results to fall below the expectations of financial analysts and investors, resulting in a decline in our stock price. Significant assumptions and estimates used in preparing our financial statements include those related to revenue recognition, inventory, product warranties, allowance for doubtful accounts, stock-based compensation expense and income taxes.
Our exposure to the credit risks of our customers may make it difficult to collect accounts receivable and could adversely affect our operating results and financial condition.
In the course of our sales to customers, we may encounter difficulty collecting accounts receivable and could be exposed to risks associated with uncollectible accounts receivable. Economic conditions may impact some of our customers’ ability to pay their accounts payable. While we attempt to monitor these situations carefully and attempt to take appropriate measures to collect accounts receivable balances, we have written down accounts receivable and written off doubtful accounts in prior periods and may be unable to avoid accounts receivable write-downs or write-offs of doubtful accounts in the future. Such write-downs or write-offs could negatively affect our operating results for the period in which they occur.
U.S. and global political, credit and financial market conditions may negatively impact or impair the value of our current portfolio of cash and cash equivalents, including U.S. Treasury securities and U.S.-backed investment vehicles.
Our cash and cash equivalents are held in a variety of interest bearing instruments, primarily in U.S. Treasury securities. As a result of the uncertain domestic and global political, credit and financial market conditions, investments in these types of financial instruments pose risks arising from liquidity and credit concerns. Given that future deterioration in the U.S. and global credit and financial markets is a possibility, no assurance can be made that losses or significant deterioration in the fair value of our cash, cash equivalents or possible investments will not occur. For example, in August 2011, Standard and Poor’s downgraded the U.S.’s credit rating to account for the risk that U.S. lawmakers would fail to raise the debt ceiling and/or reduce its overall deficit. Such a downgrade could continue to impact the stability of future U.S. treasury auctions and affect the trading market for U.S. government securities. Uncertainty surrounding U.S. congressional action or inaction could impact the trading market for U.S. government securities or impair the U.S. government’s ability to satisfy its obligations under such treasury securities. These factors could impact the liquidity or valuation of our current portfolio of cash, cash equivalents and possible investments. If any such losses or significant deteriorations occur, it may negatively impact or impair our current portfolio of cash, cash equivalents and possible investments, which may affect our ability to fund future obligations. Further, unless and until the current U.S. and global political, credit and financial market crisis has been sufficiently resolved, it may be difficult for us to liquidate our investments prior to their maturity without incurring a loss, which would have a material adverse effect on our business, operating results and financial condition.
14
Our business is subject to the risks of earthquakes, fire, floods and other natural catastrophic events, and to interruption by manmade problems such as network security breaches, computer software or system errors or viruses, or terrorism.
Our corporate headquarters are located in the San Francisco Bay Area, and many of our contract manufacturers are located in eastern Asia, both regions known for seismic activity. A significant natural disaster, such as an earthquake, a fire or a flood, occurring near our headquarters, or near the facilities of our contract manufacturers, could have a material adverse impact on our business, operating results and financial condition. Despite the implementation of network security measures, our networks also may be vulnerable to computer viruses, break-ins and similar disruptions from unauthorized tampering with our products. In addition, natural disasters, acts of terrorism or war could cause disruptions in our or our customers’ businesses, our suppliers’ and manufacturers’ operations or the economy as a whole. We also rely on information technology systems to operate our business and to communicate among our workforce and with third parties. For example, we use business management and communication software products provided by third parties, such as Microsoft Online and salesforce.com, and security flaws or outages in such products would adversely affect our operations. Any disruption to these systems, whether caused by a natural disaster or by manmade problems, such as power disruptions, could adversely affect our business. To the extent that any such disruptions result in delays or cancellations of customer orders or impede our suppliers’ and/or our manufacturers’ ability to timely deliver our products and product components, or the deployment of our products, our business, operating results and financial condition would be adversely affected.
New regulations or standards or changes in existing regulations or standards in the United States or internationally related to our products may result in unanticipated costs or liabilities, which could have a material adverse effect on our business, results of operations and future sales, and could place additional burdens on the operations of our business.
Our products are subject to governmental regulations in a variety of jurisdictions. In order to achieve and maintain market acceptance, our products must continue to comply with these regulations as well as a significant number of industry standards. In the United States, our products must comply with various regulations defined by the Federal Communications Commission, or FCC, Underwriters Laboratories and others. We must also comply with similar international regulations. For example, our wireless communication products operate through the transmission of radio signals, and radio emissions are subject to regulation in the United States and in other countries in which we do business. In the United States, various federal agencies including the Center for Devices and Radiological Health of the Food and Drug Administration, the FCC, the Occupational Safety and Health Administration and various state agencies have promulgated regulations that concern the use of radio/electromagnetic emissions standards. Member countries of the European Union have enacted similar standards concerning electrical safety and electromagnetic compatibility and emissions, and chemical substances and use standards.
As these regulations and standards evolve, and if new regulations or standards are implemented, we will be required to modify our products or develop and support new versions of our products, and our compliance with these regulations and standards may become more burdensome. The failure of our products to comply, or delays in compliance, with the various existing and evolving industry regulations and standards could prevent or delay introduction of our products, which could harm our business. End-customer uncertainty regarding future policies may also affect demand for communications products, including our products. Moreover, channel partners or end-customers may require us, or we may otherwise deem it necessary or advisable, to alter our products to address actual or anticipated changes in the regulatory environment. Our inability to alter our products to address these requirements and any regulatory changes may have a material adverse effect on our business, operating results and financial condition.
We are evaluating and may adopt a corporate structure more closely aligned with the international nature of our business activities, which will require us to incur expenses but could fail to achieve the intended benefits.
We intend to reorganize our corporate structure and intercompany relationships to more closely align with the international nature of our business activities. This proposed corporate structure may result in a reduction in our overall effective tax rate through changes in how we use our intellectual property, international procurement, and sales operations. This proposed corporate structure may also allow us to obtain financial and operational efficiencies. These efforts will require us to incur expenses in the near term for which we may not realize related benefits. If the intended structure is not accepted by the applicable taxing authorities, changes in domestic and international tax laws negatively impact the proposed structure, including proposed legislation to reform U.S. taxation of international business activities, or we do not operate our business consistent with the proposed structure and applicable tax provisions, we may fail to achieve the financial and operational efficiencies that we anticipate as a result of the proposed structure and our future financial condition and results of operations may be negatively impacted.
Risks Related to Our International Operations
Our international operations expose us to additional business risks and failure to manage these risks may adversely affect our international revenue.
We derive a significant portion of our revenues from customers outside the United States. For the years ended December 31, 2012, 2011 and 2010, 57%, 65% and 70% of our revenue, respectively, was attributable to our international customers. As of December 31, 2012, approximately 57% of our full-time employees were located abroad. We expect that our international activities will be dynamic over the foreseeable future as we continue to pursue opportunities in international markets, which will require significant management attention and financial resources. Therefore, we are subject to risks associated with having worldwide operations.
We have a limited history of marketing, selling, and supporting our products and services internationally. As a result, we must hire and train experienced personnel to staff and manage our foreign operations. To the extent that we experience difficulties in recruiting, training, managing, and retaining an international staff, and specifically staff related to sales management and sales personnel, we may experience difficulties in sales productivity in foreign markets. In addition, business practices in the international markets that we serve may differ from those in the United States and may require us to include non-standard terms in customer contracts, such as extended payment or warranty terms. To the extent that we may enter into contracts with our international customers in the future that include non-standard terms related to payment, warranties or performance obligations, our operating results may be adversely impacted. International operations are subject to other inherent risks and our future results could be adversely affected by a number of factors, including:
15
• | tariffs and trade barriers, export regulations and other regulatory or contractual limitations on our ability to sell or develop our products in certain foreign markets; |
• | requirements or preferences for domestic products, which could reduce demand for our products; |
• | differing technical standards, existing or future regulatory and certification requirements and required product features and functionality; |
• | management communication and integration problems related to entering new markets with different languages, cultures and political systems; |
• | difficulties in enforcing contracts and collecting accounts receivable, and longer payment cycles, especially in emerging markets; |
• | heightened risks of unfair or corrupt business practices in certain geographies and of improper or fraudulent sales arrangements that may impact financial results and result in restatements of, and irregularities in, financial statements; |
• | difficulties and costs of staffing and managing foreign operations; |
• | the uncertainty of protection for intellectual property rights in some countries; |
• | potentially adverse tax consequences, including regulatory requirements regarding our ability to repatriate profits to the United States; |
• | added legal compliance obligations and complexity; |
• | the increased cost of terminating employees in some countries; and |
• | political and economic instability and terrorism. |
To the extent we continue to expand our business globally, our success will depend, in large part, on our ability to anticipate and manage effectively these and other risks associated with our international operations. Our failure to manage any of these risks successfully could harm our international operations and reduce our international sales, adversely affecting our business, operating results and financial condition.
We may not successfully sell our products in certain geographic markets or develop and manage new sales channels in accordance with our business plan.
We expect to continue to sell our products in certain geographic markets where we do not have significant current business and to a broader customer base. To succeed in certain of these markets, we believe we will need to develop and manage new sales channels and distribution arrangements. Because we have limited experience in developing and managing such channels, we may not be successful in further penetrating certain geographic regions or reaching a broader customer base. Failure to develop or manage additional sales channels effectively would limit our ability to succeed in these markets and could adversely affect our ability to grow our customer base and revenue.
We are exposed to fluctuations in currency exchange rates, which could negatively affect our financial condition and operating results.
To date, substantially all of our international sales have been denominated in U.S. dollars; however, most of our expenses associated with our international operations are denominated in local currencies. As a result, a decline in the value of the U.S. dollar relative to the value of these local currencies could have a material adverse effect on the gross margins and profitability of our international operations. Conversely, an increase in the value of the U.S. dollar relative to the value of these local currencies results in our products being more expensive to potential customers and could have an adverse impact on our pricing or our ability to sell our products internationally. To date, we have not used risk management techniques to hedge the risks associated with these fluctuations. Even if we were to implement hedging strategies, not every exposure can be hedged and, where hedges are put in place based on expected foreign currency exchange exposure, they are based on forecasts that may vary or that may later prove to have been inaccurate. As a result, fluctuations in foreign currency exchange rates or our failure to successfully hedge against these fluctuations could have a material adverse effect on our operating results and financial condition.
Failure to comply with the U.S. Foreign Corrupt Practices Act and similar laws associated with our activities outside the United States could subject us to penalties and other adverse consequences.
A significant portion of our revenues is and will be from jurisdictions outside of the United States. As a result, we are subject to the U.S. Foreign Corrupt Practices Act, or the FCPA, which generally prohibits U.S. companies and their intermediaries from making corrupt payments to foreign officials for the purpose of directing, obtaining or keeping business, and requires companies to maintain reasonable books and records and a system of internal accounting controls. The FCPA applies to companies and individuals alike, including company directors, officers, employees and agents. Under the FCPA, U.S. companies may be held liable for the corrupt actions taken by employees, strategic or local partners or other representatives. In addition, the government may seek to rely on a theory of successor liability and hold us responsible for FCPA violations committed by companies or associated with assets which we acquire.
In many foreign countries where we operate, particularly in countries with developing economies, it may be a local custom for businesses to engage in practices that are prohibited by the FCPA or other similar laws and regulations. In contrast, we have implemented a company policy requiring our employees and consultants to comply with the FCPA and similar laws. Although we have not conducted formal FCPA compliance training, we are in the process of devising a training schedule for certain of our employees, agents and partners. Nevertheless, there can be no assurance that our employees, partners and agents, as well as those companies to which we outsource certain of our business operations, will not take actions in violation of the FCPA or our policies for which we may be ultimately held responsible. As a result of our rapid growth, our development of infrastructure designed to identify FCPA matters and monitor compliance is at an early stage. If we or our intermediaries fail to comply with the requirements of the FCPA or similar legislation, governmental authorities in the U.S. and elsewhere could seek to impose civil and/or criminal fines
16
and penalties which could have a material adverse effect on our business, operating results and financial conditions. We may also face collateral consequences such as debarment and the loss of our export privileges.
We are subject to governmental export and import controls that could impair our ability to compete in international markets due to licensing requirements and subject us to liability if we are not in compliance with applicable laws.
Our products and solutions are subject to export control and import laws and regulations, including the U.S. Export Administration Regulations, U.S. Customs regulations and various economic and trade sanctions regulations administered by the U.S. Treasury Department’s Office of Foreign Assets Controls. Exports of our products and solutions must be made in compliance with these laws and regulations. If we fail to comply with these laws and regulations, we and certain of our employees could be subject to substantial civil or criminal penalties, including the possible loss of export or import privileges, fines, which may be imposed on us and responsible employees or managers, and, in extreme cases, the incarceration of responsible employees or managers. In addition, if our channel partners fail to obtain appropriate import, export or re-export licenses or authorizations, we may also be adversely affected through reputational harm and penalties. Obtaining the necessary authorizations, including any required license, for a particular sale may be time-consuming, is not guaranteed and may result in the delay or loss of sales opportunities. Changes in our products or solutions or changes in applicable export or import laws and regulations may also create delays in the introduction and sale of our products and solutions in international markets, prevent our end-customers with international operations from deploying our products and solutions or, in some cases, prevent the export or import of our products and solutions to certain countries, governments or persons altogether. Any change in export or import laws and regulations, shift in the enforcement or scope of existing laws and regulations, or change in the countries, governments, persons or technologies targeted by such laws and regulations, could also result in decreased use of our products and solutions, or in our decreased ability to export or sell our products and solutions to existing or potential end-customers with international operations. Any decreased use of our products and solutions or limitation on our ability to export or sell our products and solutions would likely adversely affect our business, financial condition and results of operations.
Furthermore, we incorporate encryption technology into certain of our products and solutions. Various countries regulate the import of certain encryption technology, including through import permitting and licensing requirements, and have enacted laws that could limit our ability to distribute our products and solutions or could limit our customers’ ability to implement our products and solutions in those countries. Encryption products and solutions and the underlying technology may also be subject to export control restrictions. Governmental regulation of encryption technology and regulation of imports or exports of encryption products, or our failure to obtain required import or export approval for our products and solutions, when applicable, could harm our international sales and adversely affect our revenues. Compliance with applicable regulatory laws and regulations regarding the export of our products and solutions, including with respect to new releases of our solutions, may create delays in the introduction of our products and solutions in international markets, prevent our end-customers with international operations from deploying our products and solutions throughout their globally-distributed systems or, in some cases, prevent the export of our products and solutions to some countries altogether. U.S. export control laws and economic sanctions programs also prohibit the shipment of certain products and services to countries, governments and persons that are subject to U.S. economic embargoes and trade sanctions. Even though we take precautions to prevent our products and solutions from being shipped or provided to U.S. sanctions targets, our products and solutions could be shipped to those targets or provided by third-parties despite such precautions. Any such shipment could have negative consequences, including government investigations, penalties and reputational harm. Furthermore, any new embargo or sanctions program, or any change in the countries, governments, persons or activities targeted by such programs, could result in decreased use of our products and solutions, or in our decreased ability to export or sell our products and solutions to existing or potential end-customers, which would likely adversely affect our business and our financial condition.
Risks Related to Our Intellectual Property
Claims by others that we infringe their intellectual property rights could harm our business.
Our industry is characterized by vigorous protection and pursuit of intellectual property rights, which has resulted in protracted and expensive litigation for many companies. We are subject to claims and litigation by third parties that we infringe their intellectual property rights and we expect claims and litigation with respect to infringement to occur in the future. As our business expands and the number of products and competitors in our market increases and overlaps occur, we expect that infringement claims may increase in number and significance. Any claims or proceedings against us, whether meritorious or not, could be time-consuming, result in costly litigation, require significant amounts of management time or result in the diversion of significant operational resources, any of which could materially and adversely affect our business and operating results.
Intellectual property lawsuits are subject to inherent uncertainties due to the complexity of the technical issues involved, and we cannot be certain that we will be successful in defending ourselves against intellectual property claims. In addition, we currently have a limited portfolio of issued patents compared to our larger competitors, and therefore may not be able to effectively utilize our intellectual property portfolio to assert defenses or counterclaims in response to patent infringement claims or litigation brought against us by third parties. Further, litigation may involve patent holding companies or other adverse patent owners who have no relevant products or revenues and against whom our potential patents provide no deterrence, and many other potential litigants have the capability to dedicate substantially greater resources to enforce their intellectual property rights and to defend claims that may be brought against them. Furthermore, a successful claimant could secure a judgment that requires us to pay substantial damages or prevents us from distributing certain products or performing certain services. We might also be required to seek a license and pay royalties for the use of such intellectual property, which may not be available on commercially acceptable terms or at all. Alternatively, we may be required to develop non-infringing technology, which could require significant effort and expense and may ultimately not be successful.
17
If we are unable to protect our intellectual property rights, our competitive position could be harmed or we could be required to incur significant expenses to enforce our rights.
Our ability to compete effectively is dependent in part upon our ability to protect our proprietary technology. We protect our proprietary information and technology through licensing agreements, third-party nondisclosure agreements and other contractual provisions, as well as through patent, trademark, copyright and trade secret laws in the United States and similar laws in other countries. There can be no assurance that these protections will be available in all cases or will be adequate to prevent our competitors from copying, reverse engineering or otherwise obtaining and using our technology, proprietary rights or products. The laws of some foreign countries, including countries in which our products are sold or manufactured, are in many cases not as protective of intellectual property rights as those in the United States, and mechanisms for enforcement of intellectual property rights may be inadequate. In addition, third parties may seek to challenge, invalidate or circumvent our patents, trademarks, copyrights and trade secrets, or applications for any of the foregoing. There can be no assurance that our competitors will not independently develop technologies that are substantially equivalent or superior to our technology or design around our proprietary rights. We have focused patent, trademark, copyright and trade secret protection primarily in the United States, China, Taiwan and Europe. As a result, we may not have sufficient protection of our intellectual property in all countries where infringement may occur. In each case, our ability to compete could be significantly impaired.
To prevent substantial unauthorized use of our intellectual property rights, it may be necessary to prosecute actions for infringement and/or misappropriation of our proprietary rights against third parties. Any such action could result in significant costs and diversion of our resources and management’s attention, and there can be no assurance that we will be successful in such action. Furthermore, many of our current and potential competitors have the ability to dedicate substantially greater resources to enforce their intellectual property rights than we do. Accordingly, despite our efforts, we may not be able to prevent third parties from infringing upon or misappropriating our intellectual property.
We are generally obligated to indemnify our channel partners and end-customers for certain expenses and liabilities resulting from intellectual property infringement claims regarding our products, which could force us to incur substantial costs.
We have agreed, and expect to continue to agree, to indemnify our channel partners and end-customers for certain intellectual property infringement claims regarding our products. As a result, in the case of infringement claims against these channel partners and end-customers, we could be required to indemnify them for losses resulting from such claims or to refund amounts they have paid to us. Some of our channel partners and end-customers have sought, and we expect that certain of our channel partners and end-customers in the future may seek, indemnification from us in connection with infringement claims brought against them. In addition, some of our channel partners and end-customers have tendered to us the defense of claims brought against them for infringement. We evaluate each such request on a case-by-case basis and we may not succeed in refuting all such claims. If a channel partner or end-customer elects to invest resources in enforcing a claim for indemnification against us, we could incur significant costs disputing it. If we do not succeed in disputing it, we could face substantial liability.
We rely on the availability of third-party licenses. If these licenses are available to us only on less favorable terms or not at all in the future, our business and operating results would be harmed.
We have incorporated third-party licensed technology into our products. For example, our products incorporate certain technology that we license from Qualcomm Atheros. It may be necessary in the future to renew licenses relating to various aspects of these products or to seek additional licenses for existing or new products. There can be no assurance that the necessary licenses will be available on acceptable terms or at all. The inability to obtain certain licenses or other rights, or to obtain those licenses or rights on favorable terms, or the need to engage in litigation regarding these matters, could result in delays in product releases until such time, if ever, as equivalent technology could be identified, licensed or developed and integrated into our products and might have a material adverse effect on our business, operating results and financial condition. Moreover, the inclusion in our products of intellectual property licensed from third parties on a nonexclusive basis could limit our ability to protect our proprietary rights in our products.
Our use of open source software could impose limitations on our ability to commercialize our products.
Our products contain software modules licensed for use from third-party authors under open source licenses, such as Linux and Cassandra. Use and distribution of open source software may entail greater risks than use of third-party commercial software, as open source licensors generally do not provide warranties or other contractual protections regarding infringement claims or the quality of the code. Some open source licenses contain requirements that we make available source code for modifications or derivative works we create based upon the type of open source software we use. If we combine our proprietary software with open source software in a certain manner, we could, under certain of the open source licenses, be required to release the source code of our proprietary software to the public. This could allow our competitors to create similar products with lower development effort and time, and ultimately could result in a loss of product sales for us.
Although we monitor our use of open source software, the terms of many open source licenses have not been interpreted by U.S. courts, and there is a risk that such licenses could be construed in a manner that could impose unanticipated conditions or restrictions on our ability to commercialize our products. In such event, we could be required to seek licenses from third parties in order to continue offering our products, to re-engineer our products or to discontinue the sale of our products in the event re-engineering cannot be accomplished on a timely basis, any of which could materially and adversely affect our business and operating results.
18
Risks Related to Ownership of Our Common Stock
The price of our common stock has been and will likely continue to be volatile.
The trading price of our common stock has fluctuated, and is likely to continue to fluctuate, substantially. The trading price of our common stock depends on a number of factors, including those described in this “Risk Factors” section, many of which are beyond our control and may not be related to our operating performance.
Since shares of our common stock were sold at our initial public offering in November 2012 at a price of $15.00 per share, our stock price has ranged as low as $12.25 and as high as $26.50 through February 28, 2013. Factors that may have and could cause fluctuations in the trading price of our common stock include the following:
• | price and volume fluctuations in the overall stock market from time to time; |
• | volatility in the market prices and trading volumes of high technology stocks; |
• | changes in operating performance and stock market valuations of other technology companies generally, or those in our industry in particular; |
• | sales of shares of our common stock by us or our stockholders; |
• | failure of financial analysts to maintain coverage of us, changes in financial estimates by any analysts who follow our company, or our failure to meet these estimates or the expectations of investors; |
• | the financial projections we may provide to the public, any changes in those projections or our failure to meet those projections; |
• | announcements by us or our competitors of new products or new or terminated significant contracts, commercial relationships or capital commitments; |
• | the public’s reaction to our press releases, other public announcements and filings with the SEC; |
• | rumors and market speculation involving us or other companies in our industry; |
• | actual or anticipated changes in our results of operations or fluctuations in our operating results; |
• | actual or anticipated developments in our business or our competitors’ businesses or the competitive landscape generally; |
• | litigation involving us, our industry or both or investigations by regulators into our operations or those of our competitors; |
• | developments or disputes concerning our intellectual property or other proprietary rights; |
• | announced or completed acquisitions of businesses or technologies by us or our competitors; |
• | new laws or regulations or new interpretations of existing laws or regulations applicable to our business; |
• | changes in accounting standards, policies, guidelines, interpretations or principles; |
• | any major change in our management; |
• | general economic conditions and slow or negative growth of our markets; and |
• | other events or factors, including those resulting from war, incidents of terrorism or responses to these events. |
In addition, the stock market in general, and the market for technology companies in particular, have experienced extreme price and volume fluctuations that have often been unrelated or disproportionate to the operating performance of those companies. Broad market and industry factors may seriously affect the market price of our common stock, regardless of our actual operating performance. In addition, in the past, following periods of volatility in the overall market and the market prices of particular companies’ securities, securities class action litigations have often been instituted against these companies. Litigation of this type, if instituted against us, could result in substantial costs and a diversion of our management’s attention and resources.
Sales of substantial amounts of our common stock in the public markets, or the perception that they might occur, could reduce the price that our common stock might otherwise attain and may dilute your voting power and your ownership interest in us.
Sales of a substantial number of shares of our common stock in the public market, or the perception that these sales could occur, could adversely affect the market price of our common stock and may make it more difficult for stockholders to sell their common stock at appropriate times and prices.
Upon release of the underwriters’ lockup from our initial public offering, or IPO, which is currently scheduled to expire after the close of trading on May 15, 2013, approximately 65.8 million shares of common stock will be eligible for sale, subject in some cases to volume and other restrictions of Rules 144 and 701 under the Securities Act of 1933, as amended, as well as our insider trading policy. In addition, holders of up to approximately 49,626,757 shares of our common stock, or 66.9% of our total outstanding common stock, based on shares outstanding as of December 31, 2012, will be entitled to rights with respect to registration of these shares under the Securities Act pursuant to an investors’ rights agreement. If these holders of our common stock, by exercising their registration rights, sell a large number of shares, they could adversely affect the market price for our common stock. If we file a registration statement for the purposes of selling additional shares to raise capital and are required to include shares held by these holders pursuant to the exercise of their registration rights, our ability to raise capital may be impaired. Sales of substantial amounts of our common stock in the public market following the release of the lock-up or otherwise, or the perception that these sales could occur, could cause the market price of our common stock to decline.
19
Insiders continue to have substantial control over us, which could limit a stockholder's ability to influence the outcome of key transactions, including a change of control.
As of December 31, 2012, our directors, executive officers and each of our stockholders who own greater than 5% of our outstanding common stock and their affiliates, in the aggregate, will beneficially own approximately 43.5% of the outstanding shares of our common stock. As a result, these stockholders, if acting together, will be able to influence or control matters requiring approval by our stockholders, including the election of directors and the approval of mergers, acquisitions or other extraordinary transactions. This concentration of ownership may have the effect of delaying, preventing or deterring a change of control of our company, could deprive our stockholders of an opportunity to receive a premium for their common stock as part of a sale of our company and might ultimately affect the market price of our common stock.
We do not intend to pay dividends for the foreseeable future.
We have never declared or paid any cash dividends on our common stock and do not intend to pay any cash dividends in the foreseeable future. We anticipate that we will retain all of our future earnings for use in the development of our business and for general corporate purposes. Any determination to pay dividends in the future will be at the discretion of our board of directors. Accordingly, investors must rely on sales of their common stock after price appreciation, which may never occur, as the only way to realize any future gains on their investments.
The requirements of being a public company may strain our resources, divert management’s attention and affect our ability to attract and retain qualified members of our board of directors.
We are subject to the reporting requirements of the Securities Exchange Act of 1934, as amended, or the Exchange Act, the Dodd-Frank Act, the listing requirements of the New York Stock Exchange and other applicable securities rules and regulations. Compliance with these rules and regulations has increased and will continue to increase our legal and financial compliance costs, make some activities more difficult, time-consuming or costly, and increase demand on our systems and resources. The Sarbanes-Oxley Act requires, among other things, that we maintain effective disclosure controls and procedures and internal control over financial reporting. In order to maintain and, if required, improve our disclosure controls and procedures and internal control over financial reporting to meet this standard, significant resources and management oversight may be required. As a result, management’s attention may be diverted from other business concerns, which could harm our business and operating results. Although we have hired additional employees to comply with these requirements, we may need to hire more employees in the future, which will increase our costs and expenses.
In addition, changing laws, regulations and standards relating to corporate governance and public disclosure are creating uncertainty for public companies, increasing legal and financial compliance costs and making some activities more time consuming. These laws, regulations and standards are subject to varying interpretations, in many cases due to their lack of specificity, and, as a result, their application in practice may evolve over time as new guidance is provided by regulatory and governing bodies. This could result in continuing uncertainty regarding compliance matters and higher costs necessitated by ongoing revisions to disclosure and governance practices. We intend to invest resources to comply with evolving laws, regulations and standards, and this investment may result in increased general and administrative expenses and a diversion of management’s time and attention from revenue-generating activities to compliance activities. If our efforts to comply with new laws, regulations and standards differ from the activities intended by regulatory or governing bodies due to ambiguities related to practice, regulatory authorities may initiate legal proceedings against us and our business may be harmed.
As a public company that is subject to these rules and regulations, we may find that it is more expensive for us to obtain director and officer liability insurance, and we may be required to accept reduced coverage or incur substantially higher costs to obtain coverage. These factors could also make it more difficult for us to attract and retain qualified members of our board of directors and qualified executive officers.
We may acquire other businesses which could require significant management attention, disrupt our business, dilute stockholder value and adversely affect our operating results.
As part of our business strategy, we may make investments in complementary companies, products or technologies. However, we have not made any significant acquisitions to date, and as a result, our ability as an organization to acquire and integrate other companies, products or technologies in a successful manner is unproven. We may not be able to find suitable acquisition candidates, and we may not be able to complete such acquisitions on favorable terms, if at all. If we do complete acquisitions, we may not ultimately strengthen our competitive position or achieve our goals, and any acquisitions we complete could be viewed negatively by our end-customers, investors and financial analysts. In addition, if we are unsuccessful at integrating such acquisitions, or the technologies associated with such acquisitions, into our company, the revenue and operating results of the combined company could be adversely affected. Any integration process may require significant time and resources, and we may not be able to manage the process successfully. We may not successfully evaluate or utilize the acquired technology or personnel, or accurately forecast the financial impact of an acquisition transaction, including accounting charges. We may have to pay cash, incur debt or issue equity securities to pay for any such acquisition, each of which could adversely affect our financial condition or the value of our common stock. The sale of equity or issuance of debt to finance any such acquisitions could result in dilution to our stockholders. The incurrence of indebtedness would result in increased fixed obligations and could also include covenants or other restrictions that would impede our ability to manage our operations.
Our future capital needs are uncertain, and we may need to raise additional funds in the future. If we require additional funds in the future, those funds may not be available on acceptable terms, or at all.
We believe that our existing cash and cash equivalents will be sufficient to meet our anticipated cash requirements for at least the next 12 months. We may, however, need to raise substantial additional capital to:
• | fund our operations; |
• | continue our research and development; |
• | develop and commercialize new products; |
20
• | acquire companies, in-licensed products or intellectual property; or |
• | expand sales and marketing activities. |
Our future funding requirements will depend on many factors, including:
• | market acceptance of our products and services; |
• | the cost of our research and development activities; |
• | the cost of defending, in litigation or otherwise, claims that we infringe third-party patents or violate other intellectual property rights; |
• | the cost and timing of establishing additional sales, marketing and distribution capabilities; |
• | the cost and timing of establishing additional technical support capabilities; |
• | the effect of competing technological and market developments; and |
• | the market for different types of funding and overall economic conditions. |
We may require additional funds in the future, and we may not be able to obtain those funds on acceptable terms, or at all. If we raise additional funds by issuing equity securities, our stockholders may experience dilution. Debt financing, if available, may involve covenants restricting our operations or our ability to incur additional debt. Any debt or additional equity financing that we raise may contain terms that are not favorable to us or our stockholders.
If we do not have, or are not able to obtain, sufficient funds, we may have to delay development or commercialization of our products or license to third parties the rights to commercialize products or technologies that we would otherwise seek to commercialize. If we raise additional funds through collaboration and licensing arrangements with third parties, it may be necessary to relinquish some rights to our technologies or our products, or to grant licenses on terms that are not favorable to us. If we are unable to raise adequate funds, we may have to liquidate some or all of our assets, or delay, reduce the scope of or eliminate some or all of our development programs. We also may have to reduce marketing, customer support or other resources devoted to our products or cease operations. Any of these actions could harm our operating results.
We are an “Emerging Growth Company,” and any decision on our part to comply only with certain reduced disclosure requirements applicable to Emerging Growth Companies could make our common stock less attractive to investors.
We are an “emerging growth company,” as defined in the Jumpstart Our Business Startups Act enacted in April 2012, and, for as long as we continue to be an “emerging growth company,” we may choose to take advantage of exemptions from various reporting requirements applicable to other public companies but not to “emerging growth companies,” including, but not limited to, not being required to comply with the auditor attestation requirements of Section 404 of the Sarbanes-Oxley Act, reduced disclosure obligations regarding executive compensation in our periodic reports and proxy statements, and exemptions from the requirements of holding a nonbinding advisory vote on executive compensation and stockholder approval of any golden parachute payments not previously approved. We can be an “emerging growth company” for up to five years after our initial public offering, although if the market value of our common stock that is held by non-affiliates exceeds $700 million as of any June 30 before that time or if we have total annual gross revenues of $1 billion or more during any fiscal year before that time, we would cease to be an “emerging growth company” as of the end of that fiscal year, or if we issue more than $1 billion in non-convertible debt in a three year period, we would cease to be an “emerging growth company” immediately. We cannot predict if investors will find our common stock less attractive if we choose to rely on these exemptions. If some investors find our common stock less attractive as a result of any choices to reduce future disclosure, there may be a less active trading market for our common stock and our stock price may be more volatile.
Under the Jumpstart Our Business Startups Act, emerging growth companies can delay adopting new or revised accounting standards until such time as those standards apply to private companies. We have irrevocably elected not to avail ourselves of this exemption from new or revised accounting standards and, therefore, we will be subject to the same new or revised accounting standards as other public companies that are not emerging growth companies.
As a result of becoming a public company, we are obligated to maintain proper and effective internal controls over financial reporting. We may not complete our analysis of our internal controls over financial reporting in a timely manner, or these internal controls may not be determined to be effective, which may adversely affect investor confidence in our company and, as a result, the value of our common stock.
As a public company, we are required, pursuant to the Exchange Act, to furnish a report by management on, among other things, the effectiveness of our internal control over financial reporting for the first fiscal year beginning after the date of our IPO. This assessment will need to include disclosure of any material weaknesses identified by our management in our internal control over financial reporting, and if we cease to be an “emerging growth company,” a statement that our auditors have issued an attestation report on our management's assessment of our internal controls.
21
We are in the early stages of the costly and challenging process of evaluating our internal controls, identifying and remediating deficiencies in those internal controls, and documenting the results of our evaluation, testing, and remediation. We may not be able to complete our evaluation, testing, and any required remediation in a timely fashion. During the evaluation and testing process, if we identify one or more material weaknesses in our internal control over financial reporting that we are unable to remediate before the end of the same fiscal year in which the material weakness is identified, we will be unable to assert that our internal controls are effective. If we are unable to assert that our internal control over financial reporting is effective, or if our auditors are unable to attest to management's report on the effectiveness of our internal controls or determine we have a material weakness in our internal controls, we could lose investor confidence in the accuracy and completeness of our financial reports, which would cause the price of our common stock to decline.
As a public company, we are required to disclose material changes made in our internal control and procedures on a quarterly basis. However, our independent registered public accounting firm will not be engaged to formally attest to the effectiveness of our internal control over financial reporting pursuant to Section 404 of the Sarbanes-Oxley Act until the first annual report required to be filed with the SEC when we cease being an “emerging growth company.” To comply with the requirements of being a public company, we may need to undertake various actions, such as implementing new internal controls and procedures and hiring accounting or internal audit staff.
If financial or industry analysts do not publish research or reports about our business, or if they issue an adverse or misleading opinion regarding our common stock, our stock price and trading volume could decline.
The trading market for our common stock may be influenced by the research and reports that industry or financial analysts publish about us or our business. We do not control these analysts or the content and opinions included in their reports. As a new public company, we may be slow to attract research coverage and the analysts who publish information about our common stock will have had relatively little experience with our company, which could affect their ability to accurately forecast our results and make it more likely that we fail to meet their estimates. In the event we obtain industry or financial analyst coverage, if any of the analysts who cover us issue an adverse or misleading opinion regarding our stock price, our stock price would likely decline. If one or more of these analysts cease coverage of our company or fail to publish reports on us regularly, we could lose visibility in the financial markets, which in turn could cause our stock price or trading volume to decline.
Certain provisions in our charter documents and under Delaware law could limit attempts by our stockholders to replace or remove members of our board of directors or current management and may adversely affect the market price of our common stock.
Our restated certificate of incorporation and our restated bylaws may have the effect of delaying or preventing a change of control or changes in our board or directors or management. These provisions include the following:
• | our board of directors has the right to elect directors to fill a vacancy created by the expansion of the board of directors or the resignation, death or removal of a director, which prevents stockholders from being able to fill vacancies on our board of directors; |
• | our stockholders may not act by written consent or call special stockholders’ meetings; as a result, a holder, or holders, controlling a majority of our capital stock would not be able to take certain actions other than at annual stockholders’ meetings or special stockholders’ meetings called by the board of directors, the chairman of the board, the chief executive officer or the president; |
• | our certificate of incorporation prohibits cumulative voting in the election of directors, which limits the ability of minority stockholders to elect director candidates; |
• | stockholders must provide advance notice and additional disclosures in order to nominate individuals for election to the board of directors or to propose matters that can be acted upon at a stockholders’ meeting, which may discourage or deter a potential acquiror from conducting a solicitation of proxies to elect the acquiror’s own slate of directors or otherwise attempting to obtain control of our company; and |
• | our board of directors may issue, without stockholder approval, shares of undesignated preferred stock; the ability to issue undesignated preferred stock makes it possible for our board of directors to issue preferred stock with voting or other rights or preferences that could impede the success of any attempt to acquire us. |
As a Delaware corporation, we are also subject to certain Delaware anti-takeover provisions. Under Delaware law, a corporation may not engage in a business combination with any holder of 15% or more of its capital stock unless the holder has held the stock for three years or, among other things, the board of directors has approved the transaction. Our board of directors could rely on Delaware law to prevent or delay an acquisition of us.
Certain of our executive officers or directors may be entitled to accelerated vesting of their stock options pursuant to the terms of their employment arrangements or option grants upon a change of control of the company. In addition to the arrangements currently in place with some of our executive officers, we may enter into similar arrangements in the future with other officers. Such arrangements could delay or discourage a potential acquisition of the company.
22
ITEM 1B. UNRESOLVED STAFF COMMENTS
None.
ITEM 2. PROPERTIES
Our headquarters currently occupy approximately 95,000 square feet of office space in Sunnyvale, California pursuant to a lease that expires in 2022. We also maintain two additional facilities in Sunnyvale, California totaling 40,000 square feet used for marketing purposes and for research and development testing. In addition, we maintain offices in China, India, Japan, Taiwan, Singapore, and the United Kingdom. We believe that these facilities are suitable and adequate to meet our current needs. We intend to add new facilities or expand existing facilities as we add employees, and we believe that suitable additional or substitute space will be available as needed to accommodate any such expansion of our operations.
ITEM 3. LEGAL PROCEEDINGS
We are party to litigation and subject to claims arising in the ordinary course of business, including claims related to intellectual property infringement. Although the results of litigation and claims cannot be predicted with certainty, we currently believe that the final outcome of these matters will not have a material adverse effect on our business. Regardless of the outcome, litigation can have an adverse impact on us because of defense and settlement costs, diversion of management resources and other factors.
ITEM 4. MINE SAFETY DISCLOSURES
Not applicable.
23
PART II
ITEM 5. MARKET FOR REGISTRANT'S COMMON EQUITY, RELATED STOCKHOLDER MATTERS, AND ISSUER PURCHASES OF EQUITY SECURITIES
Market Information
Our common stock, $0.001 par value per share, has been trading on the New York Stock Exchange since November 16, 2012, under the symbol “RKUS.”
Holders of Record
As of December 31, 2012 there were approximately 409 holders of record of our common stock. Because many of our shares of common stock are held by brokers and other institutions on behalf of stockholders, we are unable to estimate the total number of stockholders represented by these record holders.
Price Range of Our Common Stock
The following table sets forth the reported high and low sales closing prices of our common stock for the fourth quarter of 2012 from the date of our IPO, November 16, 2012, through December 31, 2012, as quoted on the New York Stock Exchange:
Year Ended December 31, 2012 | High | Low | |||||
Fourth Quarter (from November 16, 2012) | $ | 22.53 | $ | 12.25 | |||
Dividend Policy
We have never declared or paid, and do not anticipate declaring or paying in the foreseeable future, any cash dividends on our capital stock. Any future determination as to the declaration and payment of dividends, if any, will be at the discretion of our board of directors, subject to applicable laws and will depend on then existing conditions, including our financial condition, operating results, contractual restrictions, capital requirements, business prospects, and other factors our board of directors may deem relevant.
24
Stock Price Performance Graph
This performance graph shall not be deemed “filed” for purposes of Section 18 of the Securities Exchange Act of 1934, as amended (the "Exchange Act"), or incorporated by reference into any filing of Ruckus Wireless, Inc. under the Securities Act of 1933, as amended, or the Exchange Act, except as shall be expressly set forth by specific reference in such filing.
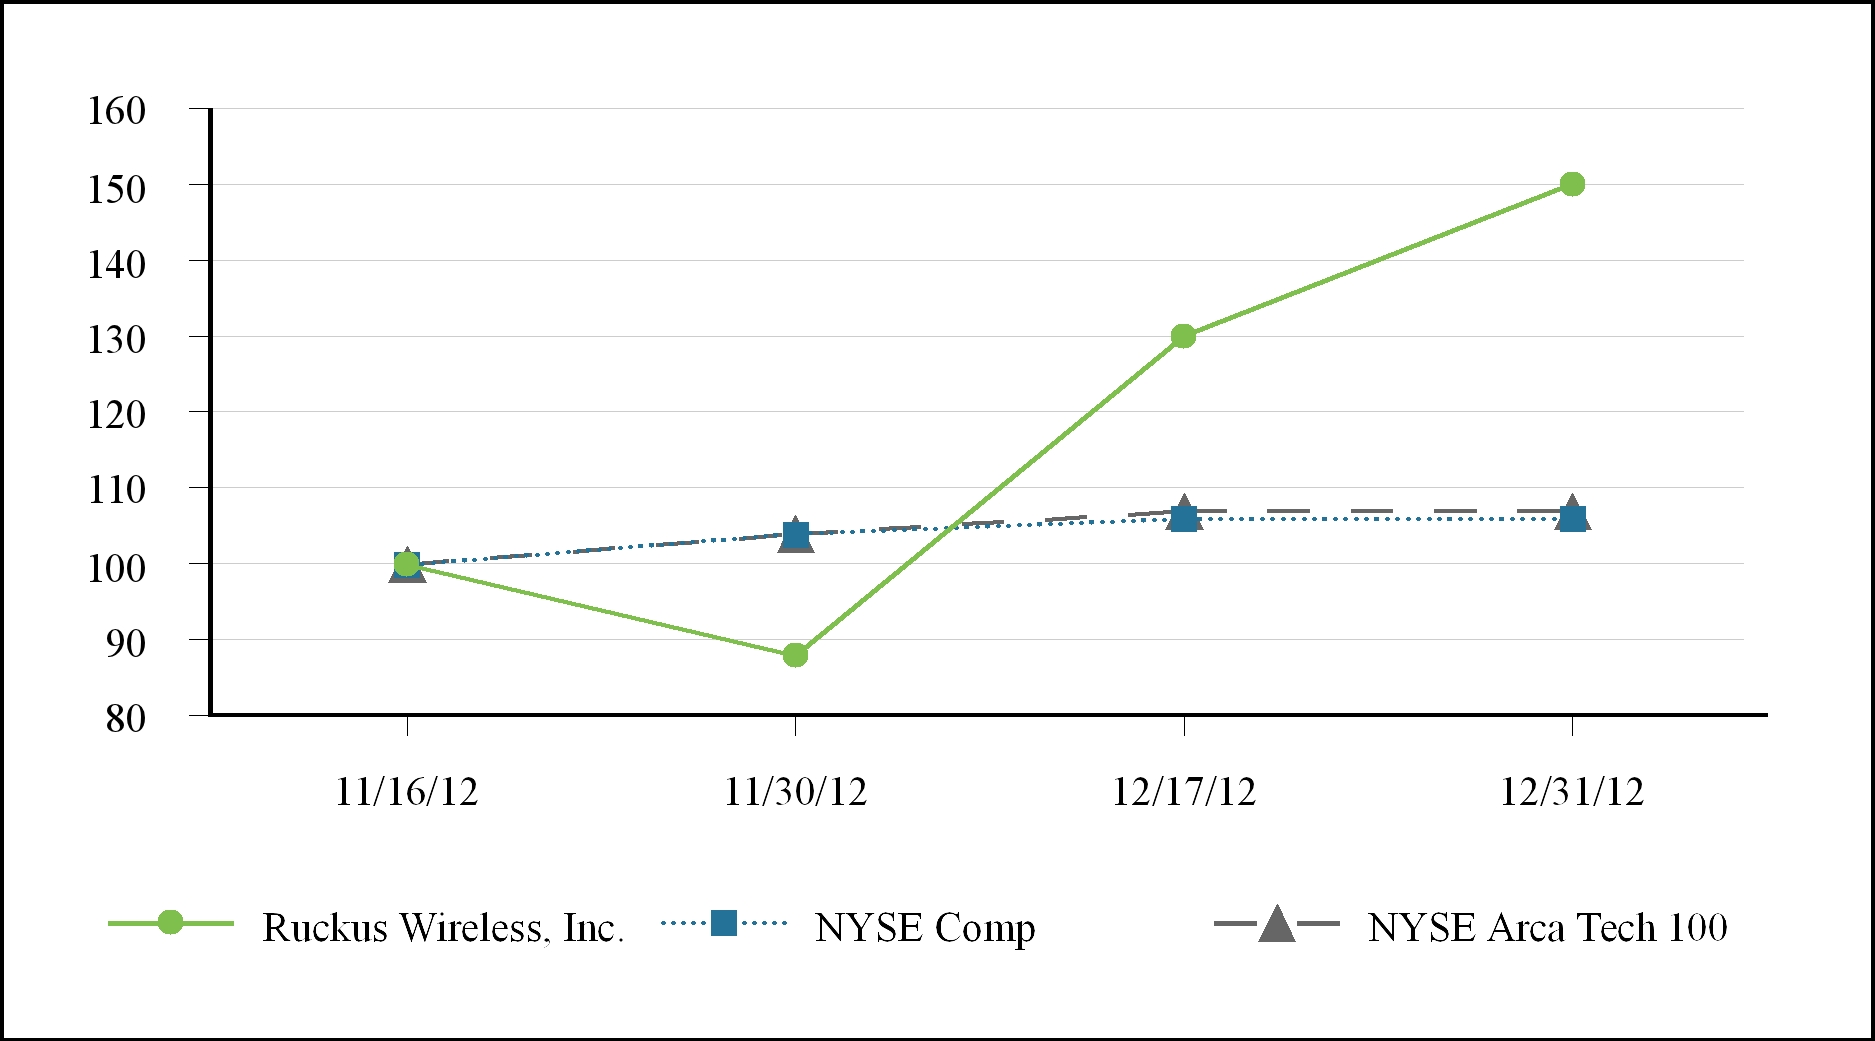
This graph compares, for the period ended December 31, 2012, the cumulative total return on our common stock, the NYSE Composite Index and the NYSE Arca Tech 100 Index. The graph assumes $100 was invested on November 16, 2012, in the common stock of Ruckus Wireless, Inc., the NYSE Composite Index and the NYSE Arca Tech 100 Index, and assumes the reinvestment of any dividends. The stock price performance on the following graph is not necessarily indicative of future stock price performance.
Company/Index | Base Period 11/16/2012 | Indexed Returns Period ended 12/31/2012 | |||||
Ruckus Wireless, Inc. | $ | 100.00 | $ | 150.20 | |||
NYSE Comp | $ | 100.00 | $ | 106.45 | |||
NYSE Arca Tech 100 | $ | 100.00 | $ | 107.25 | |||
Recent Sales of Unregistered Securities
(a) In February 2012 and April 2012, we issued 4,590,692 shares of our Series G preferred stock to accredited investors at a purchase price of $5.4458 for an aggregate consideration of $24,999,991.
(b) In November 2012, an accredited investor net exercised warrants to purchase an aggregate of 105,964 shares of our convertible preferred stock and 101,989 shares of our common stock. The warrants were exercisable for 120,900 shares of our preferred stock at an exercise price of $1.82 and $1.98, and 105,000 shares of our common stock at an exercise price of $0.43. In connection with the exercise, the number of shares were reduced pursuant to cashless exercises provisions in the warrant.
(c) From January 1, 2012 through December 31, 2012, pursuant to the terms of our equity incentive plans, options to purchase 811,891 shares of our common stock have been exercised by our officers, directors, and employees for an aggregate amount of cash consideration of $632,850.
The offers, sales, and issuances of the securities described in paragraphs (a) and (b) above were deemed to be exempt from registration under the Securities Act in reliance on Section 4(2) of the Securities Act or Regulation D promulgated thereunder as transactions by an issuer not involving a public offering. The recipients of securities in each of these transactions acquired the securities for investment only and not with a view to or for sale in connection with any distribution thereof and appropriate legends were affixed to the securities issued in these transactions. Each of the recipients of securities in these transactions was an accredited or sophisticated person and had adequate access, through employment, business or other relationships, to information about us.
25
The offers, sales and issuances of the securities described in paragraph (c) above were deemed to be exempt from registration under the Securities Act under either (1) Rule 701 promulgated under the Securities Act as offers and sale of securities pursuant to certain compensatory benefit plans and contracts relating to compensation in compliance with Rule 701 or (2) Section 4(2) of the Securities Act as transactions by an issuer not involving any public offering, or because they did not involve a sales of securities. The recipients of securities in each of these transactions represented their intention to acquire the securities for investment only and not with view to or for sale in connection with any distribution thereof and appropriate legends were affixed to the stock certificates and instruments issued in such transactions. All recipients had adequate access, through their relationships with us, to information about us.
Use of Proceeds
On November 15, 2012, our Registration Statement on Form S-1 (File No. 333-184309) was declared effective by the SEC for our IPO of common stock, pursuant to which we sold an aggregate of 7,000,000 shares of our common stock at a public offering price of $15.00 per share, for aggregate gross proceeds of $105.0 million.
Goldman, Sachs & Co. and Morgan Stanley & Co. LLC acted as lead joint bookrunning managers and representatives of the underwriters for the offering. Deutsche Bank Securities Inc. acted as bookrunning manager and Needham & Company, LLC, Oppenheimer & Co. Inc., William Blair & Company, LLC, and Craig-Hallum Capital Group LLC each acted as a co-manager. We paid to the underwriters underwriting discounts totaling approximately $7.4 million in connection with the offering. In addition, we incurred expenses of approximately $3.6 million in connection with the offering, $0.8 million of which was unpaid as of December 31, 2012. When added to the underwriting discounts, total expenses paid by us were approximately $11.0 million. Thus, the net offering proceeds to us, after deducting underwriting discounts and offering expenses, were approximately $94.0 million. No payments were made to our directors or officers or their associates, holders of 10% or more of any class of our equity securities or any affiliates.
We intend to use the net proceeds from this offering for working capital and other general corporate purposes, including sales and marketing activities and product development. We may also use a portion of the net proceeds for the acquisition of, or investment in, technologies, solutions or businesses that complement our business, although we have no present commitments or agreements to enter into any acquisitions or investments. As of February 28, 2013, the net offering proceeds have been invested in money market funds. We are currently considering higher yielding investment opportunities based on the Company's investment policies.
There has been no material change in the planned use of proceeds from our IPO as described in our final prospectus filed with the SEC on November 16, 2012 pursuant to Rule 424(b).
ITEM 6. SELECTED CONSOLIDATED FINANCIAL DATA
The selected consolidated statement of operations data for the years ended December 31, 2012, 2011, and 2010 and the consolidated balance sheet data as of December 31, 2012 and 2011 are derived from our audited consolidated financial statements included elsewhere in this report. Our historical results are not necessarily indicative of the results that may be expected in the future. The selected consolidated financial data below should be read in conjunction with the section entitled Item 7, “Management's Discussion and Analysis of Financial Condition and Results of Operations” and Item 8, "Consolidated Financial Statements and Supplementary Data."
26
Years Ended December 31, | |||||||||||
2012 | 2011 | 2010 | |||||||||
(in thousands, except per share data) | |||||||||||
Consolidated Statements of Operations Data: | |||||||||||
Revenues: | |||||||||||
Product | $ | 201,913 | $ | 114,684 | $ | 73,108 | |||||
Service | 12,740 | 5,339 | 2,381 | ||||||||
Total revenues | 214,653 | 120,023 | 75,489 | ||||||||
Cost of revenues: | |||||||||||
Product | 70,478 | 44,705 | 34,039 | ||||||||
Service | 5,306 | 2,502 | 1,705 | ||||||||
Total cost of revenues | 75,784 | 47,207 | 35,744 | ||||||||
Gross profit | 138,869 | 72,816 | 39,745 | ||||||||
Operating expenses: | |||||||||||
Research and development | 43,821 | 24,892 | 19,256 | ||||||||
Sales and marketing | 56,209 | 32,659 | 19,185 | ||||||||
General and administrative | 20,237 | 8,524 | 4,231 | ||||||||
Total operating expenses | 120,267 | 66,075 | 42,672 | ||||||||
Operating income (loss) | 18,602 | 6,741 | (2,927 | ) | |||||||
Interest expense | (472 | ) | (1,025 | ) | (1,011 | ) | |||||
Other expense, net | (3,664 | ) | (1,215 | ) | (290 | ) | |||||
Income (loss) before income taxes | 14,466 | 4,501 | (4,228 | ) | |||||||
Income tax benefit (expense) | 17,238 | (315 | ) | (176 | ) | ||||||
Net income (loss) | $ | 31,704 | $ | 4,186 | $ | (4,404 | ) | ||||
Net income (loss) attributable to common stockholders | $ | 9,036 | $ | 379 | $ | (4,404 | ) | ||||
Net income (loss) per share attributable to common stockholders: | |||||||||||
Basic | $ | 0.36 | $ | 0.02 | $ | (0.30 | ) | ||||
Diluted | $ | 0.24 | $ | 0.02 | $ | (0.30 | ) | ||||
Weighted average shares used in computing net income (loss) per share attributable to common stockholders: | |||||||||||
Basic | 24,847 | 15,584 | 14,498 | ||||||||
Diluted | 37,775 | 23,269 | 14,498 | ||||||||
27
Stock-based compensation expense included in the statements of operations data above was as follows:
Years Ended December 31, | |||||||||||
2012 | 2011 | 2010 | |||||||||
(in thousands) | |||||||||||
Cost of revenues | $ | 243 | $ | 148 | $ | 82 | |||||
Research and development | 2,409 | 1,055 | 468 | ||||||||
Sales and marketing | 1,787 | 471 | 242 | ||||||||
General and administrative | 4,012 | 594 | 421 | ||||||||
Total stock-based compensation expense | $ | 8,451 | $ | 2,268 | $ | 1,213 | |||||
Selected consolidated balance sheet data as of December 31, 2012 and 2011:
As of December 31, | |||||||||
2012 | 2011 | ||||||||
Consolidated Balance Sheet Data: | (in thousands) | ||||||||
Cash and cash equivalents | $ | 133,386 | $ | 11,200 | |||||
Working capital | 141,093 | (2,927 | ) | ||||||
Total assets | 243,839 | 65,690 | |||||||
Deferred revenue, current and long term | 40,486 | 17,181 | |||||||
Redeemable convertible preferred stock(1) | — | 51,257 | |||||||
Total stockholders’ equity (deficit)(1) | 170,211 | (44,743 | ) | ||||||
(1) The outstanding redeemable convertible preferred stock converted to common shares following the close of the Company's IPO.
28
ITEM 7. MANAGEMENT’S DISCUSSION AND ANALYSIS OF FINANCIAL CONDITION AND RESULTS OF OPERATIONS
You should read the following discussion and analysis of our financial condition and results of operations together with the consolidated financial statements and related notes that are included elsewhere in this report. This discussion contains forward-looking statements based upon current expectations that involve risks and uncertainties. Our actual results may differ materially from those anticipated in these forward-looking statements as a result of various factors, including those set forth under Item 1A,“Risk Factors” and in other parts of this report.
Overview
Ruckus is a leading provider of carrier-class Wi-Fi solutions. Our solutions, which we call Smart Wi-Fi, are used by service providers and enterprises to solve network capacity and coverage challenges associated with the rapidly increasing traffic and number of users on wireless networks. Our Smart Wi-Fi solutions offer carrier-class enhanced reliability, consistent performance, extended range and massive scalability. Our products include gateways, controllers and access points. These products incorporate our proprietary technologies, including Smart Radio, Smart QoS, Smart Mesh, SmartCell and Smart Scaling, to enable high performance in a variety of challenging operating conditions faced by service providers and enterprises.
Our products have been sold to over 21,700 end-customers worldwide. Our service provider end-customers include mobile operators, cable companies, wholesale operators and fixed-line carriers. Our enterprise end-customers span a wide range of industries, including hospitality, education, healthcare, warehousing and logistics, corporate enterprise, retail, state and local government and public venues, such as stadiums, convention centers, airports and major outdoor public areas.
Our revenue increased 79% to $214.7 million for the year ended December 31, 2012, from $120.0 million for the year ended December 31, 2011. Net income increased to $31.7 million for the year ended December 31, 2012, which included a $17.2 million income tax benefit, from net income of $4.2 million for the year ended December 31, 2011. The income tax benefit of $17.2 million for the year ended December 31, 2012, primarily relates to the release of our valuation allowance of $23.6 million, offset by tax expense associated with the use of net operating losses and minor amounts of state and foreign taxes.
We have focused since our inception in 2004 on developing products that combine industry standard Wi-Fi chip sets with our proprietary technology to deliver high performance Wi-Fi connectivity in challenging environments. We first commercialized our Wi-Fi technology in customer premise equipment, or CPE, that performed the highly demanding task of delivering live television over Wi-Fi. In 2005 we began selling our Smart Wi-Fi CPE products to broadband operators for Internet Protocol television, or IPTV, distribution within a home.
Following the launch of our CPE products, we began to apply the expertise that we gained in delivering a Wi-Fi solution for home use to address the capacity and coverage requirements of service providers and midsized enterprises. In late 2007, we first introduced our carrier-class ZoneFlex product line. ZoneFlex integrates our Smart Wi-Fi technologies into a set of access points and controllers that provide cost-effective, highly reliable and scalable solutions to service providers and enterprises.
In connection with the launch of our ZoneFlex product line we began to significantly increase our investments in our service provider and enterprise sales and marketing activities. At the same time we began to shift focus away from our CPE products. CPE revenue was less than 5% of total revenue for the year ended December 31, 2012, and we expect this revenue to decline as a percentage of total revenue in future periods.
As demand for our products from service providers increased, we recognized the need to enable service providers to integrate their Wi-Fi and cellular network infrastructures. We therefore significantly increased our research and development activities to address network integration requirements of service providers. Consistent with that focus, we acquired the business of IntelliNet Technologies, Inc., or IntelliNet, for total consideration of $15.6 million, which increased our ability to manage and control subscriber traffic across Wi-Fi and cellular networks.
We launched our SmartCell gateway in the first quarter of 2012 to enable service providers to support and manage our Smart Wi-Fi access points and to serve as a platform for integration of Wi-Fi and other services into the service provider network infrastructure. While this product was designed to address specific requirements of service providers, we generally develop and sell the same products for both our service provider and enterprise end-customers. This approach to our products provides us maximum leverage from our research and development and sales and marketing investments with respect to service providers and enterprises.
We target both service providers and enterprises that require carrier-class Wi-Fi solutions through our global force of sales personnel and systems engineers. They work with value-added resellers and distributors, which we collectively refer to as channel partners, to reach and service our end-customers. Our channel partners provide lead generation, pre-sales support, product fulfillment and, in certain circumstances, post-sales customer service and support. In some instances, service providers may also act as a channel partner for sales of our solutions to enterprises. Our sales personnel and systems engineers typically engage directly with selected large service providers and enterprises whether or not product fulfillment involves our channel partners. In contrast, the majority of our enterprise sales are originated and completed by our channel partners with little or no direct engagement with us.
Service providers typically require long sales cycles, which generally range between one and three years, but can be longer. The sale to a large service provider usually begins with an evaluation, followed by one or more network trials, followed by vendor selection and finally deployment and testing. A large service provider will frequently issue a request for proposals to shortlist competitive suppliers prior to the network trials. Completion of several of these steps is substantially outside of our control, which causes our revenue patterns from large service providers to vary widely from period to period. After initial deployment, subsequent purchases of our products typically have a more compressed sales cycle. The service providers that we consider to be primarily end-customers produced approximately one third of our revenue for the year ended December 31, 2012, and approximately one quarter of our revenue for the year ended December 31, 2011. Sales cycles for enterprises are typically less than 90 days.
29
We are a global business and, for the year ended December 31, 2012, more than 57% of our annual revenue has been generated from customers outside of the United States. Due primarily to the size of large service provider orders, the amount of revenue from a region may vary significantly from period to period. For example, for the year ended December 31, 2011, 37% of our revenue was generated from the Americas region, 35% was generated from the Asia Pacific, or APAC, region and 28% was generated from the Europe, Middle East and Africa, or EMEA, region. However, during the year ended December 31, 2012, 45% of our revenue was generated from the Americas, 32% was generated from the APAC region, and 23% was generated from the EMEA region. We derive revenue from sales of our products and from services, which are primarily maintenance and support. Over 94% of our revenue is from product sales.
We outsource the warehousing and delivery of our products to a third-party logistics provider for worldwide fulfillment. In 2012, the Company began warehousing and delivering some products in the United States from our headquarters in Sunnyvale, California. We perform quality assurance and testing at our Sunnyvale, California facilities.
We believe the market for our Smart Wi-Fi solutions is growing rapidly and our intention is to continue to invest for long-term growth. We expect to continue to invest heavily in research and development to expand the capabilities of our solutions with respect to services providers and enterprises. We also plan to continue to make significant investments in our field sales and marketing activities, both by increasing our service provider focused direct sales force and by expanding our network of channel partners.
Key Components of Our Results of Operations and Financial Condition
Revenues
We generate revenue from the sales of our products and services. As discussed further in “—Critical Accounting Policies and Estimates—Revenue Recognition” below, revenue is recognized when persuasive evidence of an arrangement exists, delivery has occurred, the fee is fixed or determinable, and collectability is reasonably assured.
Our total revenue is comprised of the following:
Product Revenue. The majority of our product revenue is generated from sales of our products, which predominately includes access points and controllers as well as corresponding controller licenses. We generally recognize product revenue on sales to distributors’ customers and at the time of shipment for all other customers, provided that all other revenue recognition criteria have been met.
Service Revenue. Service revenue is generated primarily from post-contract support, or PCS, and includes software updates on a "if and when available" basis, telephone and internet access to technical support personnel and hardware support. PCS terms are typically one year to five years and we recognize service revenue ratably over the contractual service period.
Cost of Revenues
Our total cost of revenues is comprised of the following:
Cost of Product Revenue. Cost of product revenue primarily includes manufacturing costs of our products payable to third-party contract manufacturers. Our cost of product revenue also includes shipping costs, third-party logistics costs, provisions for excess and obsolete inventory, warranty and personnel costs, including stock-based compensation, certain allocated costs for facilities and other expenses associated with logistics and quality control.
Cost of Service Revenue. Cost of service revenue primarily includes personnel costs, including stock-based compensation, and certain allocated costs for facilities and other expenses associated with our global support organization.
Gross Margin
Gross margin, or gross profit as a percentage of revenue, has been and will continue to be affected by a variety of factors, including the average sales price of our products, manufacturing costs, the mix of products sold, and the mix of revenue between products and services. For sales of our products, ZoneFlex products generally have higher gross margins than our CPE products. Our products currently have higher gross margins than our services, due to the continuing investment in our service operations to manage anticipated growth. We expect our gross margins to fluctuate over time depending on the factors described above.
Operating Expenses
Research and Development. Research and development expense consists primarily of personnel costs, including stock-based compensation, for employees and contractors engaged in research, design and development activities, as well as costs for prototype-related expenses, product certification, travel, depreciation, recruiting and allocated costs for certain facilities and benefits costs allocated based on headcount. We believe that continued investment in research and development and our products is important to attaining our strategic objectives. We expect research and development expense to increase in absolute dollars as we continue to invest in our future products and services, although our research and development expense may fluctuate as a percentage of total revenue.
Sales and Marketing. Sales and marketing expense consists primarily of personnel costs, commission costs and stock-based compensation for employees and contractors engaged in sales and marketing activities. Commission costs are calculated on shipment and expensed in the same period. Sales and marketing expense also includes the costs of trade shows, marketing programs, promotional materials, demonstration equipment, travel, depreciation, recruiting and allocated costs for certain facilities and benefits costs allocated based on headcount. We expect sales and marketing expense to continue to increase in absolute dollars as we increase the size of our sales and marketing organizations in support of our investment in our growth opportunities, although our sales and marketing expense may fluctuate as a percentage of total revenue.
30
General and Administrative. General and administrative expense consists primarily of personnel costs and stock-based compensation for our executive, finance, legal, human resources and other administrative employees. In addition, general and administrative expenses include outside consulting, legal, audit and accounting services, depreciation and facilities and other supporting overhead costs not allocated to other departments. We expect that our general and administrative expenses will increase on an absolute basis in the near term as we continue to expand our business and incur additional expenses associated with being a publicly traded company. However, we expect general and administrative to decrease as a percentage of revenue.
Interest Expense
Interest expense consists of interest on our outstanding debt and amortization of loan fees. All outstanding debt was repaid in full by the end of June 2012.
Other Expense, net
Other expense, net consists primarily of the changes in the fair value of our convertible preferred stock warrant liability and the contingent liability arising from the acquisition of IntelliNet. Both were classified as a liability on our 2011 consolidated balance sheet and their estimated fair values were re-measured at each balance sheet date with the corresponding change recorded within other expense, net.
Concurrent with the closing of our IPO in November 2012, the convertible preferred stock issuable upon exercise of the warrants became exercisable for common stock and the related liability was reclassified to additional paid-in capital in stockholders' equity (deficit).
The contingent liability arising from the acquisition of IntelliNet was settled in the fourth quarter of 2012.
Income Tax Expense
During the year ended December 31, 2012, we concluded that it was more likely than not that we would be able to realize our benefit of the U.S. federal and state deferred tax assets in the future. As a result, we reduced the valuation allowance on our net deferred tax assets by $23.6 million for the year ended December 31, 2012. The release of the valuation allowance contributed to the net income tax benefit of $17.2 million for the year ended December 31, 2012, after deducting tax expense associated with the use of net operating losses and minor amounts of state and foreign taxes.
Significant management judgment is required in determining the period in which the reversal of a valuation allowance should occur. We are required to consider all available evidence, both positive and negative, such as historical levels of income and future forecasts of taxable income amongst other items, in determining whether a full or partial release of our valuation allowance is required. We are also required to schedule future taxable income in accordance with accounting standards that address income taxes to assess the appropriateness of a valuation allowance, which further requires the exercise of significant management judgment. As a result, there can be no assurance that there will be a release in future periods of the remaining amount of our valuation allowance, or that an increase in such allowance may not be required in the future.
31
Results of Operations
The following tables set forth our results of operations for the periods presented as a percentage of total revenue for those periods. The period-to-period comparison of financial results is not necessarily indicative of future results.
Consolidated Statement of Operations.
Years Ended December 31, | ||||||||
2012 | 2011 | 2010 | ||||||
Revenues: | ||||||||
Product | 94.1 | % | 95.6 | % | 96.8 | % | ||
Service | 5.9 | 4.4 | 3.2 | |||||
Total revenues | 100.0 | 100.0 | 100.0 | |||||
Cost of revenues: | ||||||||
Product | 32.8 | 37.2 | 45.1 | |||||
Service | 2.5 | 2.1 | 2.3 | |||||
Total cost of revenues | 35.3 | 39.3 | 47.4 | |||||
Gross margin | 64.7 | 60.7 | 52.6 | |||||
Operating expenses: | ||||||||
Research and development | 20.4 | 20.7 | 25.5 | |||||
Sales and marketing | 26.2 | 27.2 | 25.4 | |||||
General and administrative | 9.4 | 7.1 | 5.6 | |||||
Total operating expenses | 56.0 | 55.0 | 56.5 | |||||
Operating margin | 8.7 | 5.7 | (3.9 | ) | ||||
Interest expense | (0.2 | ) | (0.9 | ) | (1.3 | ) | ||
Other expense, net | (1.7 | ) | (1.0 | ) | (0.4 | ) | ||
Income (loss) before income taxes | 6.8 | 3.8 | (5.6 | ) | ||||
Income tax benefit (expense) | 8.0 | (0.3 | ) | (0.2 | ) | |||
Net income (loss) | 14.8 | % | 3.5 | % | (5.8 | )% | ||
32
Revenues
Years Ended December 31, | ||||||||||||||||||||||||||||||||||
2012 | 2011 | 2010 | 2012 to 2011 | 2011 to 2010 | ||||||||||||||||||||||||||||||
Amount | % of Revenue | Amount | % of Revenue | Amount | % of Revenue | $ Change | % Change | $ Change | % Change | |||||||||||||||||||||||||
(dollars in thousands) | ||||||||||||||||||||||||||||||||||
Revenues: | ||||||||||||||||||||||||||||||||||
Product | $ | 201,913 | 94.1 | % | $ | 114,684 | 95.6 | % | $ | 73,108 | 96.8 | % | $ | 87,229 | 76.1 | % | $ | 41,576 | 56.9 | % | ||||||||||||||
Service | 12,740 | 5.9 | % | 5,339 | 4.4 | % | 2,381 | 3.2 | % | 7,401 | 138.6 | % | 2,958 | 124.2 | % | |||||||||||||||||||
Total revenue | $ | 214,653 | 100 | % | $ | 120,023 | 100 | % | $ | 75,489 | 100 | % | $ | 94,630 | 78.8 | % | $ | 44,534 | 59.0 | % | ||||||||||||||
Years Ended December 31, | ||||||||||||||||||||||||||||||||||
2012 | 2011 | 2010 | 2012 to 2011 | 2011 to 2010 | ||||||||||||||||||||||||||||||
Amount | % of Revenue | Amount | % of Revenue | Amount | % of Revenue | $ Change | % Change | $ Change | % Change | |||||||||||||||||||||||||
(dollars in thousands) | ||||||||||||||||||||||||||||||||||
Revenue by geographic region: | ||||||||||||||||||||||||||||||||||
Americas | $ | 96,732 | 45.0 | % | $ | 45,154 | 37.6 | % | $ | 24,038 | 31.8 | % | $ | 51,578 | 114.2 | % | $ | 21,116 | 87.8 | % | ||||||||||||||
APAC | 68,630 | 32.0 | % | 41,658 | 34.7 | % | 27,485 | 36.4 | % | 26,972 | 64.7 | % | 14,173 | 51.6 | % | |||||||||||||||||||
EMEA | 49,291 | 23.0 | % | 33,211 | 27.7 | % | 23,966 | 31.8 | % | 16,080 | 48.4 | % | 9,245 | 38.6 | % | |||||||||||||||||||
Total revenue | $ | 214,653 | 100 | % | $ | 120,023 | 100 | % | $ | 75,489 | 100 | % | $ | 94,630 | 78.8 | % | $ | 44,534 | 59.0 | % | ||||||||||||||
2012 Compared to 2011
The increase in product revenue for the year ended December 31, 2012 compared to the year ended December 31, 2011 was primarily driven by an increase of $92.8 million in ZoneFlex product sales to new and existing customers, offset slightly by a decrease of $5.6 million in CPE product sales due to increased focus on our higher margin products and shift away from sales of our CPE products. The increase in ZoneFlex product sales was due to increased adoption by our end-customers of our ZoneFlex products. Our total number of end-customers increased to approximately 21,700 at December 31, 2012 from approximately 11,600 at December 31, 2011.
The increase in service revenue for the year ended December 31, 2012 compared to the year ended December 31, 2011 is primarily related to the increase in PCS sales in connection with the increased sales of our ZoneFlex products. Service revenues are amortized over the contractual service period.
The Americas and APAC contributed to the majority of the revenue increase between the periods. Revenue from all regions increased during the year ended December 31, 2012 primarily due to our investment in increasing the size of our sales force and the number of channel partners in each region focused on selling our ZoneFlex product and significant orders from service providers, which can be large enough to make our revenue trend appear nonlinear. APAC revenues were positively impacted by sales by one of our distributors to a large service provider. The growth in the EMEA region was offset in part by a decline of approximately $3.8 million in revenues from CPE products.
2011 Compared to 2010
The increase in product revenue for the year ended December 31, 2011 compared to the year ended December 31, 2010 was primarily driven by an increase of $52.9 million in ZoneFlex product sales to new and existing customers, offset in part by a decrease of $11.3 million in CPE product sales due to increased focus on our higher margin products and a shift away from sales of our CPE products. The increase in product sales was due to increased adoption by end-customers of our ZoneFlex products. Our total number of aggregate end-customers increased to approximately 11,600 at December 31, 2011 from approximately 5,600 at December 31, 2010.
The increase in service revenue for the year ended December 31, 2011 compared to the year ended December 31, 2010 is primarily related to the increase over time in PCS sales in connection with the sales of our ZoneFlex products, as service revenues are amortized over the contractual service period.
The Americas and APAC regions contributed the largest portion of the revenue increase between the periods because of their larger and more established sale force. Revenue from all regions increased during the year ended December 31, 2011 primarily due to our investment in increasing the size of our sales force and the number of channel partners in each region. The growth in the Americas, APAC and EMEA regions was slightly offset by a decline of approximately $2.3 million, $6.0 million and $3.0 million, respectively, in revenues from CPE products due to increased focus on our higher margin products and a shift away from sales of our CPE products.
33
Cost of Revenues and Gross Margin
Years Ended December 31, | ||||||||||||||||||||||||||||||||||
2012 | 2011 | 2010 | 2012 to 2011 | 2011 to 2010 | ||||||||||||||||||||||||||||||
Amount | % of Cost of Revenue | Amount | % of Cost of Revenue | Amount | % of Cost of Revenue | $ Change | % Change | $ Change | % Change | |||||||||||||||||||||||||
(dollars in thousands) | ||||||||||||||||||||||||||||||||||
Cost of revenues | ||||||||||||||||||||||||||||||||||
Product | $ | 70,478 | 93.0 | % | $ | 44,705 | 94.7 | % | $ | 34,039 | 95.2 | % | $ | 25,773 | 57.7 | % | $ | 10,666 | 31.3 | % | ||||||||||||||
Service | 5,306 | 7.0 | % | 2,502 | 5.3 | % | 1,705 | 4.8 | % | 2,804 | 112.1 | % | 797 | 46.7 | % | |||||||||||||||||||
Total cost of revenues | $ | 75,784 | 100 | % | $ | 47,207 | 100 | % | $ | 35,744 | 100 | % | $ | 28,577 | 60.5 | % | $ | 11,463 | 32.1 | % | ||||||||||||||
Years Ended December 31, | ||||||||||||||||||||||||||||||||
2012 | 2011 | 2010 | 2012 to 2011 | 2011 to 2010 | ||||||||||||||||||||||||||||
Amount | Gross Margin | Amount | Gross Margin | Amount | Gross Margin | $ Change | Margin Change | $ Change | Margin Change | |||||||||||||||||||||||
(dollars in thousands) | ||||||||||||||||||||||||||||||||
Gross profit | ||||||||||||||||||||||||||||||||
Product | $ | 131,435 | 65.1 | % | $ | 69,979 | 61.0 | % | $ | 39,069 | 53.4 | % | $ | 61,456 | 4.1 | $ | 30,910 | 7.6 | ||||||||||||||
Service | 7,434 | 58.4 | % | 2,837 | 53.1 | % | 676 | 28.4 | % | 4,597 | 5.3 | 2,161 | 24.7 | |||||||||||||||||||
Total gross profit | $138,869 | 64.7 | % | $ | 72,816 | 60.7 | % | $ | 39,745 | 52.6 | % | $66,053 | 4.0 | $ | 33,071 | 8.1 | ||||||||||||||||
2012 Compared to 2011
Gross margin for the year ended December 31, 2012 compared to the year ended December 31, 2011 increased 4.0 percentage points. The increase of 4.1 percentage points in product gross margin was primarily due to a shift in product mix. In 2011, higher margin ZoneFlex products accounted for approximately 87% of product revenue, while low margin CPE products accounted for approximately 13% of product revenues. In 2012, the ZoneFlex products represented over 95% of product revenues, while CPE products accounted for less than 5%. In addition to product mix, product margins increased due to improved operational efficiencies and reduced CPE inventory write downs due to product end of life in 2011, partially offset by increased amortization of purchased technology resulting from our purchase of IntelliNet. Our product gross margin can be impacted by sales of ZoneFlex products to service providers and enterprises, regional revenue mix and sales of low margin CPE products. The increase of 5.3 percentage points in service gross margin was primarily a result of a 138.6% growth in service revenue offset, in part, by an increase in the cost of 112.1% arising from our investment in increasing our service operations to manage anticipated growth.
2011 Compared to 2010
Gross margin for the year ended December 31, 2011 compared to the year ended December 31, 2010 increased 8.1 percentage points. The increase of 7.6 percentage points in product gross margin was primarily due to a shift in product mix, with an increase in our higher margin ZoneFlex products compared to our lower margin CPE products and improved operational efficiencies. The increase of 24.7 percentage points in service gross margin was primarily a result of a 124.2% growth in service revenue while cost of service revenue only increased by 46.7% due to increased operating efficiencies in our service and support group.
34
Research and Development
Years Ended December 31, | |||||||||||||||||||||||||
2012 | 2011 | 2010 | 2012 to 2011 | 2011 to 2010 | |||||||||||||||||||||
Amount | Amount | Amount | $ Change | % Change | $ Change | % Change | |||||||||||||||||||
(dollars in thousands) | |||||||||||||||||||||||||
Research and development | $ | 43,821 | $ | 24,892 | $ | 19,256 | $ | 18,929 | 76.0 | % | $ | 5,636 | 29.3 | % | |||||||||||
% of revenue | 20.4 | % | 20.7 | % | 25.5 | % | |||||||||||||||||||
2012 Compared to 2011
The increase in research and development expenses for the year ended December 31, 2012 compared to the year ended December 31, 2011 was primarily attributable to increases in personnel and related costs of $11.1 million, which included stock-based compensation of $1.4 million and bonuses of $1.2 million, as we continued to add headcount and increase our investments in enhancing existing products and the development of future product offerings. Research and development expenses also increased due to higher expensed materials and supplies of $2.0 million, increased depreciation of $0.9 million, increased product design and implementation of $2.1 million, increased allocated facilities of $1.5 million, and increased other engineering costs of $1.3 million. We expect our research and development costs to continue to increase in absolute dollars, as we continue to invest in developing new products and developing new versions of our existing products.
2011 Compared to 2010
The increase in research and development expenses for the year ended December 31, 2011 compared to the year ended December 31, 2010 was primarily attributable to increases in personnel and related costs of $4.7 million, which included increased stock-based compensation of $0.6 million, as we continued to add headcount and increase our investments in future product offerings and by an aggregate of $0.9 million due in part to increased depreciation and other allocations.
Sales and Marketing
Years Ended December 31, | |||||||||||||||||||||||
2012 | 2011 | 2010 | 2012 to 2011 | 2011 to 2010 | |||||||||||||||||||
Amount | Amount | Amount | $ Change | % Change | $ Change | % Change | |||||||||||||||||
(dollars in thousands) | |||||||||||||||||||||||
Sales and marketing | $ | 56,209 | $ | 32,659 | $ | 19,185 | $23,550 | 72.1 | % | $ | 13,474 | 70.2 | % | ||||||||||
% of revenue | 26.2 | % | 27.2 | % | 25.4 | % | |||||||||||||||||
2012 Compared to 2011
The increase in sales and marketing expenses for the year ended December 31, 2012 compared to the year ended December 31, 2011 was primarily attributable to increases in headcount and related expenses as we increase our sales organization as part of our strategy to expand our reach into new service providers and channel partners. Personnel and related expenses increased $14.5 million, including increased bonus and commission expenses of $3.0 million related to our increased sales, and stock-based compensation of $1.3 million. Third-party commission expense increased by $1.3 million primarily related to our expansion in the Japanese market. Travel expenses increased $2.6 million and marketing programs increased $2.6 million due to an increase in tradeshows and public relations activities as we continue to focus our efforts on product marketing. Other sales and marketing expenses increased $2.6 million in consulting, general departmental expenses, including allocated facilities of $1.0 million, due to increased activity and headcount. We expect that sales and marketing expenses will continue to increase in absolute dollars as we continue our strategy of adding sales personnel to target service providers and enterprises.
2011 Compared to 2010
The increase in sales and marketing expenses for the year ended December 31, 2011 compared to the year ended December 31, 2010 was primarily attributable to increases in headcount and related expenses of $7.5 million, including commission expenses of $2.3 million related to increase in revenue and increased stock-based compensation expense of $0.2 million as we expand our sales organization to support our revenue growth. Third party commission expense increased by $1.8 million primarily due to expansion into the Japanese market. Marketing expenses increased $1.0 million due to an increase in tradeshows and public relations activities. Travel expenses increased $1.2 million as a result of the increased marketing activities as well as our increased sales headcount. Other sales and marketing costs, including consulting, depreciation and allocations, increased $2.0 million to support our continued growth and additional headcount.
35
General and Administrative
Years Ended December 31, | |||||||||||||||||||||||
2012 | 2011 | 2010 | 2012 to 2011 | 2011 to 2010 | |||||||||||||||||||
Amount | Amount | Amount | $ Change | % Change | $ Change | % Change | |||||||||||||||||
(dollars in thousands) | |||||||||||||||||||||||
General and administrative | $ | 20,237 | $ | 8,524 | $ | 4,231 | $11,713 | 137.4 | % | $ | 4,293 | 101.5 | % | ||||||||||
% of revenue | 9.4 | % | 7.1 | % | 5.6 | % | |||||||||||||||||
2012 Compared to 2011
The increase in general and administrative expenses for the year ended December 31, 2012 compared to the year ended December 31, 2011 was primarily attributable to an increase in personnel costs of $7.0 million which includes stock-based compensation of $3.4 million. General and administrative costs also increased due to higher external legal, audit and accounting services of $2.6 million and other general expenses of $2.1 million including depreciation, facilities and IT expense. The increases were attributable to our efforts to support the growth of our business, preparing and eventually becoming a publicly held company. We expect that general and administrative expenses will continue to increase in absolute dollars due primarily to costs associated with being a public company and to support the growth in our business.
2011 Compared to 2010
The increase in general and administrative expenses for the year ended December 31, 2011 compared to the year ended December 31, 2010 was primarily attributable to an increase in personnel related costs of $1.0 million which includes increased stock-based compensation of $0.2 million, and to increased professional services costs of $2.0 million, including increased legal expenses of $1.6 million due principally to defending several lawsuits. We also incurred an increase of $0.6 million in consulting expenses related to the growth in our business and an increase of $0.9 million in other general and administrative expenses including depreciation, travel, facilities, and other overhead costs to support the business.
Interest Expense
Years Ended December 31, | |||||||||||||||||||||||||
2012 | 2011 | 2010 | 2012 to 2011 | 2011 to 2010 | |||||||||||||||||||||
Amount | Amount | Amount | $ Change | % Change | $ Change | % Change | |||||||||||||||||||
(dollars in thousands) | |||||||||||||||||||||||||
Interest expense | $ | 472 | $ | 1,025 | $ | 1,011 | $ | (553 | ) | (54.0 | )% | $ | 14 | 1.4 | % | ||||||||||
2012 Compared to 2011
Interest expense decreased to $0.5 million in the year ended December 31, 2012 from $1.0 million in the year ended December 31, 2011 due to the Company repaying all outstanding loans by the end of June 2012. Interest expense relates to our loans payable that accrued interest at fixed rates between 7.0% and 9.5% per year.
2011 Compared to 2010
Interest expense primarily relates to our loans payable that accrue interest at fixed rates of between 7.0% and 9.5% per year. Loans outstanding during the two years did not substantially change.
36
Other Expense, net
Years Ended December 31, | |||||||||||||||||||||||||
2012 | 2011 | 2010 | 2012 to 2011 | 2011 to 2010 | |||||||||||||||||||||
Amount | Amount | Amount | $ Change | % Change | $ Change | % Change | |||||||||||||||||||
(dollars in thousands) | |||||||||||||||||||||||||
Other expense, net | $ | 3,664 | $ | 1,215 | $ | 290 | $ | 2,449 | 201.6 | % | $ | 925 | 319.0 | % | |||||||||||
2012 Compared to 2011
Other expense, net increased to $3.7 million in the year ended December 31, 2012 from $1.2 million in the year ended December 31, 2011 primarily due to an increase in the revaluation of our outstanding convertible preferred stock warrants of $2.0 million and an increase in fair value of the contingent consideration liability arising from the acquisition of IntelliNet of $0.4 million.
2011 Compared to 2010
Other expense, net primarily consists of charges related to the revaluation of our convertible preferred stock warrants to fair value each reporting period.
Income Tax (Benefit) Expense
Years Ended December 31, | ||||||||||||||||||||||||
2012 | 2011 | 2010 | 2012 to 2011 | 2011 to 2010 | ||||||||||||||||||||
Amount | Amount | Amount | $ Change | % Change | $ Change | % Change | ||||||||||||||||||
(dollars in thousands) | ||||||||||||||||||||||||
Income tax (benefit) expense | $ | (17,238 | ) | $ | 315 | $ | 176 | $ | (17,553 | ) | - | $ | 139 | 79.0 | % | |||||||||
2012 Compared to 2011
The income tax benefit of $17.2 million for the year ended December 31, 2012 primarily relates to the release of our valuation allowance of $23.6 million, offset by tax expense associated with the use of net operating losses and minor amounts of state and foreign taxes.
The release of the valuation allowance is based on our determination during the year ended December 31, 2012 that it was more likely than not that we would be able to realize the benefit of the U.S. federal and state deferred tax assets in the future. We based this conclusion on our recent historical operations having generated taxable income, and our expectation that our future operations will continue to generate taxable income sufficient to realize the tax benefits associated with the deferred tax assets.
2011 Compared to 2010
The income tax expense primarily relates to amounts for state and foreign income taxes.
Selected Quarterly Financial Data
The following tables set forth our unaudited quarterly consolidated statement of operations data for each of the eight quarters ended December 31, 2012. In management's opinion, the data has been prepared on the same basis as the audited Consolidated Financial Statements included in this report, and reflects all necessary adjustments, consisting only of normal recurring adjustments, necessary for a fair statement of this data.
37
For the three months ended | |||||||||||||||
March 31, 2012 | June 30, 2012 | September 30, 2012 | December 31, 2012 | ||||||||||||
(in thousands) | |||||||||||||||
Consolidated Statement of Operations Data: | |||||||||||||||
Revenues: | |||||||||||||||
Product | $ | 42,547 | $ | 46,150 | $ | 55,263 | $ | 57,953 | |||||||
Service | 2,467 | 2,741 | 3,321 | 4,211 | |||||||||||
Total revenues | 45,014 | 48,891 | 58,584 | 62,164 | |||||||||||
Cost of revenues: | |||||||||||||||
Product | 15,636 | 16,280 | 19,034 | 19,528 | |||||||||||
Service | 945 | 1,014 | 1,424 | 1,923 | |||||||||||
Total cost of revenues | 16,581 | 17,294 | 20,458 | 21,451 | |||||||||||
Gross profit | 28,433 | 31,597 | 38,126 | 40,713 | |||||||||||
Operating expenses: | |||||||||||||||
Research and development | 8,749 | 9,438 | 12,291 | 13,343 | |||||||||||
Sales and marketing | 12,203 | 12,707 | 14,872 | 16,427 | |||||||||||
General and administrative | 2,981 | 5,456 | 5,356 | 6,444 | |||||||||||
Total operating expenses | 23,933 | 27,601 | 32,519 | 36,214 | |||||||||||
Operating income | 4,500 | 3,996 | 5,607 | 4,499 | |||||||||||
Interest expense | (228 | ) | (244 | ) | — | — | |||||||||
Other expense, net | (243 | ) | (724 | ) | (601 | ) | (2,096 | ) | |||||||
Income before income taxes | 4,029 | 3,028 | 5,006 | 2,403 | |||||||||||
Income tax benefit (expense) | (284 | ) | 17,600 | 453 | (531 | ) | |||||||||
Net income | $ | 3,745 | $ | 20,628 | $ | 5,459 | $ | 1,872 | |||||||
38
For the three months ended | |||||||||||||||
March 31, 2011 | June 30, 2011 | September 30, 2011 | December 31, 2011 | ||||||||||||
(in thousands) | |||||||||||||||
Consolidated Statement of Operations Data: | |||||||||||||||
Revenues: | |||||||||||||||
Product | $ | 20,418 | $ | 24,900 | $ | 30,169 | $ | 39,197 | |||||||
Service | 924 | 1,112 | 1,464 | 1,839 | |||||||||||
Total revenues | 21,342 | 26,012 | 31,633 | 41,036 | |||||||||||
Cost of revenues: | |||||||||||||||
Product | 9,011 | 9,971 | 11,401 | 14,322 | |||||||||||
Service | 566 | 592 | 609 | 735 | |||||||||||
Total cost of revenues | 9,577 | 10,563 | 12,010 | 15,057 | |||||||||||
Gross profit | 11,765 | 15,449 | 19,623 | 25,979 | |||||||||||
Operating expenses: | |||||||||||||||
Research and development | 4,927 | 5,833 | 6,434 | 7,698 | |||||||||||
Sales and marketing | 6,245 | 7,054 | 8,199 | 11,161 | |||||||||||
General and administrative | 1,518 | 1,552 | 2,801 | 2,653 | |||||||||||
Total operating expenses | 12,690 | 14,439 | 17,434 | 21,512 | |||||||||||
Operating income (loss) | (925 | ) | 1,010 | 2,189 | 4,467 | ||||||||||
Interest expense | (224 | ) | (226 | ) | (203 | ) | (372 | ) | |||||||
Other expense, net | (50 | ) | (310 | ) | (67 | ) | (788 | ) | |||||||
Income (loss) before income taxes | (1,199 | ) | 474 | 1,919 | 3,307 | ||||||||||
Income tax expense | (69 | ) | (68 | ) | (69 | ) | (109 | ) | |||||||
Net income (loss) | $ | (1,268 | ) | $ | 406 | $ | 1,850 | $ | 3,198 | ||||||
39
Liquidity and Capital Resources
December 31, | |||||||||||
2012 | 2011 | 2010 | |||||||||
(dollars in thousands) | |||||||||||
Cash and cash equivalents | $ | 133,386 | $ | 11,200 | $ | 1,891 | |||||
Years Ended December 31, | |||||||||||
2012 | 2011 | 2010 | |||||||||
(dollars in thousands) | |||||||||||
Net cash provided by (used in) operating activities | $ | 28,092 | $ | 14,951 | $ | (6,626 | ) | ||||
Net cash used in investing activities | (10,122 | ) | (9,664 | ) | (1,555 | ) | |||||
Net cash provided by (used in) financing activities | 104,216 | 4,022 | (525 | ) | |||||||
Net increase (decrease) in cash and cash equivalents | $ | 122,186 | $ | 9,309 | $ | (8,706 | ) | ||||
We had cash and cash equivalents of $133.4 million at December 31, 2012. Cash and cash equivalents consist of cash and money market funds. Cash held overseas was $1.2 million. We did not have any short-term or long-term investments.
Prior to our IPO, we financed our operations and capital expenditures through private sales of preferred stock, debt, and cash flows from our operations. On November 16, 2012, we closed our IPO, in which 8,400,000 shares of common stock were sold to the public (inclusive of 7,000,000 shares of common stock sold by us). The public offering price of the shares sold in the IPO was $15.00 per share. The total gross proceeds from the offering were $126.0 million. After deducting underwriting discounts and commissions, offering expenses payable by us, and net proceeds received by the selling stockholders, the aggregate net proceeds received by us totaled approximately $94.0 million, net of unpaid costs of $0.8 million as of December 31, 2012.
We also borrowed approximately $11.9 million under a loan and security agreement with a financial institution in 2007 and 2008 which was repaid in full in June 2012.
In October 2011, we acquired certain assets of IntelliNet for total cash consideration of $6.0 million and future consideration of up to $7.0 million. During the year ended December 31, 2012, we paid $5.0 million of the future consideration. This acquisition was partially financed through a short-term credit facility for $5.0 million, which was repaid in full in January 2012.
We plan to continue to invest for long-term growth. We anticipate that these investments will continue to increase in absolute dollars. We believe that our existing cash and cash equivalents balance together with cash proceeds from operations will be sufficient to meet our working capital requirements for at least the next 12 months. Our future capital requirements will depend on many factors including our growth rate, the timing and extent of spending to support development efforts, the expansion of sales and marketing activities, the introduction of new and enhanced products and services offerings, the costs to ensure access to adequate manufacturing capacity, and the continuing market acceptance of our products. In the event that additional financing is required from outside sources, we may not be able to raise it on terms acceptable to us or at all. If we are unable to raise additional capital when desired, our business, operating results, and financial condition would be adversely affected.
Operating Activities
We generated $28.1 million of cash from operating activities in the year ended December 31, 2012 resulting from our net income of $31.7 million, offset in part by changes in our operating assets and liabilities of $2.2 million and by non-cash net benefits of $1.4 million. The non-cash net benefit consisted primarily of the release of our valuation allowance for deferred income taxes of $18.3 million, partially offset by non-cash charges consisting mainly of depreciation and amortization of $4.9 million, stock-based compensation of $8.5 million, revaluation of our preferred stock warrants of $2.8 million, and revaluation of contingent liabilities of $0.4 million. The net change in our operating assets and liabilities was the result of a net increase in accounts payable, accrued compensation, and accrued liabilities of $9.0 million relating to the growth in our business, and an increase in deferred revenues of $23.3 million primarily due to increases in products held by our distributors, partially offset by increased inventories of $8.1 million, accounts receivable of $21.1 million, deferred costs of $3.7 million and prepaid and other current assets of $1.3 million, arising from the growth of our business.
40
We generated $15.0 million of cash from operating activities in the year ended December 31, 2011 resulting from our net income of $4.2 million, increased by non-cash charges primarily consisting of $5.4 million and changes in our operating assets and liabilities of $5.4 million. Non-cash charges consisted of stock-based compensation of $2.3 million, depreciation and amortization of $2.1 million and revaluation of preferred stock warrants of $0.9 million. The net changes in our operating assets and liabilities was the result of increased accounts payable and accrued expenses of $7.5 million relating to the growth in our business, increased accrued vacation due to our increased headcount and increased deferred rent for new facilities, increased deferred revenue of $6.9 million due to increased PCS sales, increase deferred product sales and increased stock at our distributors, and decreased inventories of $1.3 million as part of our effort to increase operational efficiency, offset in part by increased accounts receivable of $10.0 million due to increased sales.
We used $6.6 million of cash in operating activities in the year ended December 31, 2010 resulting from our net loss of $4.4 million and increased inventories of $9.5 million to satisfy growing demand partially offset in part by non-cash depreciation and amortization of $1.1 million, non-cash stock-based compensation of $1.2 million and increased accounts payable and accrued expenses of $5.3 million relating to the growth in the business.
Investing Activities
Our primary investing activities have consisted of purchases of property and equipment related to leasehold improvements, technology hardware and tooling to support our growth in headcount and to support operations and our corporate infrastructure. Purchases of property and equipment may vary from period to period due to the timing of the expansion of our operations.
Cash used in investing activities in the year ended December 31, 2012 was $10.1 million, of which $7.5 million related to purchases of property and equipment, $2.0 million was a partial payment on future consideration for the purchase of IntelliNet and $0.6 million related to refundable deposits on new facility leases.
Cash used in investing activities in the year ended December 31, 2011 was $9.7 million, of which $6.0 million was for the acquisition of IntelliNet and $3.7 million was related to purchases of property and equipment.
Cash used in investing activities in the year ended December 31, 2010 was $1.6 million, all of which was for the purchase of property and equipment.
Financing Activities
Our financing activities have primarily consisted of net proceeds from the sale of our common stock in our IPO, net proceeds from the issuance of convertible preferred stock and, to a much lesser extent, the issuance of common stock upon exercise of employee stock options.
We generated $104.2 million of cash from financing activities during the year ended December 31, 2012 primarily from proceeds, net of issuance costs paid, from our IPO of $94.8 million, net proceeds of $24.9 million from the sale of our Series G preferred stock financing and $0.6 million in proceeds from the exercises of stock options, offset in part by repayment of $13.6 million under our credit and loan facilities and settlement of the contingent consideration with IntelliNet of $2.6 million.
We generated $4.0 million of cash from financing activities in the year ended December 31, 2011, primarily due to a net increase of $3.4 million in borrowings under our credit facilities and $0.6 million in proceeds from the exercises of stock options.
We used $0.5 million of cash in financing activities in the year ended December 31, 2010 due to a net repayment of $0.8 million under our credit facilities, offset in part by $0.3 million in proceeds from the exercises of stock options.
Contractual Obligations & Commitments
We lease our headquarters in Sunnyvale, California and other locations worldwide under non-cancelable operating leases that expire at various dates through 2022. The following table summarizes our contractual obligations at December 31, 2012, including leases:
Payment Due by Period | |||||||||||||||||||
Total | Less than 1 Year | 1-3 Years | 3-5 Years | More than 5 Years | |||||||||||||||
Operating leases | $ | 27,607 | $ | 4,111 | $ | 6,727 | $ | 4,503 | $ | 12,266 | |||||||||
Purchase commitments(1) | 4,262 | 4,262 | — | — | — | ||||||||||||||
Acquisition liabilities | 2,000 | 2,000 | — | — | — | ||||||||||||||
Total | $ | 33,869 | $ | 10,373 | $ | 6,727 | $ | 4,503 | $ | 12,266 | |||||||||
(1) | Consists of minimum purchase commitments with our contract manufacturers. |
The table above excludes liabilities for deferred revenue of $40.5 million and uncertain tax positions and related interest and penalties accrual of $0.1 million. We have not provided a detailed estimate of the payment timing of uncertain tax positions due to the uncertainty of when the related tax settlements will become due.
41
Off-Balance Sheet Arrangements
Through December 31, 2012, we did not have any relationships with unconsolidated organizations or financial partnerships, such as structured finance or special purpose entities that would have been established for the purpose of facilitating off-balance sheet arrangements or other contractually narrow or limited purposes.
Critical Accounting Policies and Estimates
Our consolidated financial statements are prepared in accordance with GAAP. The preparation of these consolidated financial statements requires us to make estimates and assumptions that affect the reported amounts of assets, liabilities, revenue, expenses and related disclosures. We evaluate our estimates and assumptions on an ongoing basis. Our estimates are based on historical experience and various other assumptions that we believe to be reasonable under the circumstances. Our actual results could differ from these estimates.
We believe that the assumptions and estimates associated with revenue recognition, inventory, valuation of goodwill, intangible assets, income taxes, stock-based compensation, and warranties have the greatest potential impact on our consolidated financial statements. Therefore, we consider these to be our critical accounting policies and estimates. For further information on all of our significant accounting policies, please see Note 1 of the accompanying notes to our consolidated financial statements.
In connection with the audits of our consolidated financial statements for the years ended December 31, 2011 and 2010, our independent registered public accountants identified a material weakness in our internal control over financial reporting. As of December 31, 2012, we have remediated the previously identified material weakness.
Revenue Recognition
We generate revenue from the sales of hardware with embedded software and related PCS through a direct sales force and indirect relationships with our channel partners.
Revenue is recognized when all of the following criteria are met:
• | Persuasive evidence of an arrangement exists. We rely upon sales contracts and purchase orders to determine the existence of an arrangement. |
• | Delivery has occurred. Delivery is deemed to have occurred when title has transferred. We use shipping documents to verify transfer of title. |
• | The fee is fixed or determinable. We assess whether the fee is fixed or determinable based on the terms associated with the transaction. |
• | Collectability is reasonably assured. We assess collectability based on credit analysis and payment history. |
We recognize product revenue at the time title transfers provided that all other revenue recognition criteria have been met.
Certain of our distributors that stock our product are granted stock rotation rights as well as rebates for sales of our products. Therefore, the arrangement fee for this group of distributors is not fixed and determinable when products are shipped and revenue is therefore deferred until our products are shipped to the distributors’ customer.
Certain of our arrangements are multiple-element arrangements which consist of hardware products with embedded software and PCS. Our hardware with the embedded software, which is a proprietary operating system that together with the hardware delivers the functionality desired by our customers, is considered a separate unit of accounting from PCS as our customers often buy our hardware products without PCS. For multiple-element arrangements, we allocate revenue to each unit of accounting based on an estimated selling price at the inception of the arrangement. The total arrangement consideration is allocated to each separate unit of accounting using the relative estimated selling prices of each unit. We limit the amount of revenue recognized for delivered elements to an amount that is not contingent upon future delivery of additional products or service.
To determine the estimated selling price in multiple-element arrangements, we first look to establish vendor specific objective evidence, or VSOE, of the selling price using the prices charged for a deliverable when sold separately. If VSOE of the selling price cannot be established for a deliverable, we look to establish third-party evidence, or TPE, of the selling price by evaluating the pricing of similar and interchangeable competitor products or services in standalone arrangements. However, as our products contain a significant element of proprietary technology and offer substantially different features and functionality from our competitors, we have been unable to obtain comparable pricing information with respect to our competitors’ products. Therefore, we have not been able to obtain reliable evidence of TPE of the selling price. If neither VSOE nor TPE of the selling price can be established for a deliverable, we establish best estimate selling price, or BESP, by reviewing historical transaction information and considering several other internal factors including discounting and margin objectives. We have established VSOE of the selling price of PCS through an analysis of the historical separate sales of PCS, noting that such sales have occurred at consistent prices and with a high level of concentration with respect to such pricing. Furthermore, we have established BESP of the selling price of our hardware products with embedded software based on an analysis of our historical separate sales of hardware products with embedded software. The concentration of such pricing was not sufficient to assert VSOE of the selling price, and accordingly we have determined that we can only demonstrate BESP of the selling price.
We make certain estimates and maintain allowances for sales returns, stock rotation, and other programs based on our historical experience. To date, these estimates have not been significant.
We recognize services revenue from PCS ratably over the contractual service period, which is typically one to five years. Other services revenue is recognized as the services are rendered and has not been significant to date.
42
Revenue is reported net of sales taxes. Shipping charges billed to channel partners are included in revenue and related costs are included in cost of revenue. To date, shipping charges have not been significant. After receipt of a channel partner order, any amounts billed in excess of revenue recognized are recorded as deferred revenue.
Inventories
Inventories are carried at the lower of standard cost, which approximates actual cost on a first-in, first-out basis, or market or estimated net realizable value. We evaluate inventory for excess and obsolete products based on management’s assessment of future demand and market conditions. We subcontract manufacturing on substantially all of our products. At December 31, 2012 and 2011, inventories were predominately comprised of finished goods.
Goodwill
We evaluate goodwill for impairment annually in the fourth quarter of our fiscal year or whenever events or changes in circumstances indicate the carrying value of goodwill may not be recoverable. Triggering events that may indicate impairment include, but are not limited to, a significant adverse change in customer demand or business climate that could affect the value of goodwill or a significant decrease in expected cash flows. As of December 31, 2012, no impairment of goodwill has been identified.
Intangible Assets, Net
Acquired intangible assets consist of existing technology resulting from acquisitions. Acquired intangible assets are recorded at fair value, net of accumulated amortization. Intangible assets are amortized on a straight-line basis over their estimated useful lives.
Income Taxes
We utilize the asset and liability method of accounting for income taxes. Under this method, deferred tax assets and liabilities are determined based on the differences between financial reporting and tax reporting bases of assets and liabilities, and are measured using enacted tax rates and laws that are expected to be in effect when the differences are expected to reverse. Valuation allowances are provided when necessary to reduce deferred tax assets to the amount expected to be realized.
We record uncertain tax positions in accordance with accounting standards on the basis of a two-step process whereby (1) a determination is made as to whether it is more likely than not that the tax positions will be sustained based on the technical merits of the position and (2) for those tax positions that meet the more-likely-than-not recognition threshold we recognize the largest amount of tax benefit that is more likely than not to be realized upon ultimate settlement with the related tax authority.
Stock-Based Compensation
Stock-based compensation is measured at the grant date based on the fair value of the award and is recognized as expense, net of estimated forfeitures, over the requisite service period, which is generally the vesting period of the award.
Determining the fair value of stock-based awards at the grant date represent management’s best estimates, but the estimates involve inherent uncertainties and the application of management’s judgment. We use the Black-Scholes option pricing model to determine the fair value of stock options and purchases under our 2012 Employee Stock Purchase Plan ("ESPP"). The determination of the grant date fair value of options using an option pricing model is affected by our estimated common stock fair value, prior to our IPO, as well as assumptions regarding a number of other complex and subjective variables. These variables include the fair value of our common stock, our expected stock price volatility over the expected term of the options, stock option exercise and cancellation behaviors, risk-free interest rates and expected dividends, which are estimated as follows:
• | Fair Value of Our Common Stock. Prior to the IPO our stock was not publicly traded, therefore we estimated the fair value of our common stock, as discussed in “Pre-IPO Common Stock Valuations” below. Following our IPO, we established a policy of using the closing sale price per share of our common stock as quoted on the New York Stock Exchange on the date of grant for purposes of determining the exercise price per share of our options to purchase common stock. |
• | Expected Term. The expected term for stock options was estimated using the simplified method allowed under SEC guidance. The expected term for the ESPP is based on the term of the purchase period. |
• | Volatility. Given the limited trading history for our common stock, the expected stock price volatility for our common stock was estimated by taking the average historic price volatility for industry peers, which we have designated, based on daily price observations over a period equivalent to the expected term of the stock option grants. Industry peers, which we have designated, consist of several public companies in the industry similar in size, stage of life cycle and financial leverage. We did not rely on implied volatilities of traded options in these industry peers’ common stock because the volume of activity was relatively low. We intend to continue to consistently apply this process using the same or similar public companies until a sufficient amount of historical information regarding the volatility of our own common stock share price becomes available, or unless circumstances change such that the identified companies are no longer similar to us, in which case more suitable companies whose share prices are publicly available would be utilized in the calculation. |
• | Risk-free Rate. The risk-free interest rate is based on the yields of U.S. Treasury securities with maturities similar to the expected term of the options for each option group. |
• | Dividend Yield. We have never declared or paid any cash dividends and do not presently plan to pay cash dividends in the foreseeable future. Consequently, we used an expected dividend yield of zero. |
43
In addition to assumptions used in the Black-Scholes option-pricing model, we must also estimate a forfeiture rate to calculate the share-based compensation for our awards. Our forfeiture rate is based on an analysis of our actual historical forfeitures. Quarterly changes in the estimated forfeiture rate can have a significant impact on our share-based compensation expense as the cumulative effect of adjusting the rate is recognized in the period the forfeiture estimate is changed. If a revised forfeiture rate is higher than the previously estimated forfeiture rate, an adjustment is made that will result in a decrease to the share-based compensation expense recognized in the financial statements. If a revised forfeiture rate is lower than the previously estimated forfeiture rate, an adjustment is made that will result in an increase to the share-based compensation expense recognized in the financial statements.
We will continue to use judgment and estimates in evaluating the assumptions related to our share-based compensation on a prospective basis. As we continue to accumulate additional data, we may have refinements to our estimates, which could materially impact our future share-based compensation expense.
Pre-IPO Common Stock Valuations
Prior to the IPO, the fair value of the common stock underlying stock options was approved by our board of directors, which intended all options granted to have an exercise price per share equal to the per-share fair value of the common stock underlying those options on the date of grant. The valuations of our common stock were determined in accordance with the guidelines outlined in the American Institute of Certified Public Accountants Practice Aid, Valuation of Privately-Held-Company Equity Securities Issued as Compensation. In the absence of a public trading market, the board of directors, with input from management, exercised significant judgment and considered numerous objective and subjective factors to determine the fair value of our common stock as of the date of each option grant, including the following factors:
• | sales by the company of preferred stock and common stock to outside investors in arm’s-length transactions; |
• | the market performance of comparable publicly traded technology companies; |
• | the introduction by us of new products or services; |
• | the likelihood of achieving a liquidity event for the shares of common stock underlying these stock options, such as an initial public offering or sale of our company, given prevailing market conditions; |
• | adjustments necessary to recognize a lack of marketability for our common stock; |
• | the U.S. and global capital market conditions; and |
• | other changes in the company since the last time the board of directors had approved option grants and made a determination of fair value. |
In order to determine the fair value of our common stock underlying option grants issued prior to our initial public offering, the board of directors considered recent sales of common stock to outside investors in arm’s-length transactions and used the income approach to estimate the business enterprise value, or BEV, and then allocated the BEV to each element of our capital structure (preferred stock, common stock, warrants and options). In application of the income approach, a discounted cash flow method, or DCF, is utilized. The DCF method estimates enterprise value based on the estimated present value of future net cash flows the business is expected to generate over a forecasted period and an estimate of the present value of cash flows beyond that period, which is referred to as terminal value. In estimating the terminal value, a market comparable method was utilized. A market comparable method considers guideline public company trading multiples of certain financial metrics that can be applied to a subject company as an indication of value. A multiple of enterprise value to revenue was utilized as an exit multiple to estimate the undiscounted terminal value. The present value of the terminal value and the discrete cash flows were estimated using a discount rate, which accounts for the time value of money and the appropriate degree of risks inherent in the business. In allocating the total equity value between preferred and common stock, we assumed that the preferred stock would convert to common stock. Our indicated BEV at each valuation date was allocated to the shares of preferred stock, common stock, warrants and options, using an option pricing method, or OPM. Estimates of the volatility of our common stock were based on available information on the volatility of common stock of comparable, publicly traded companies.
For each valuation, we prepared financial projections to be used in the income approach. The financial projections took into account our historical financial operating results, our business experiences and our future expectations. We factored the risk associated with achieving our forecast into selecting the appropriate exit multiple and discount rate. There is inherent uncertainty in these estimates, as the assumptions we used were highly subjective and subject to change as a result of new operating data and economic and other conditions that impact our business.
Warranties
We offer a limited lifetime hardware warranty on our indoor wireless LAN products and a limited warranty for all other products for a period of up to one year for hardware and 90 days for software. We accrue for potential warranty claims as a component of cost of product revenues based on historical experience and other data. Accrued warranty is recorded in accrued liabilities on the consolidated balance sheets and is reviewed periodically for adequacy. If we experience an increase in warranty claims compared with our historical experience, or if the cost of servicing warranty claims is greater than expected, our gross margin could be adversely affected. To date, we have not accrued any significant costs associated with our warranty.
44
ITEM 7A. QUANTITATIVE AND QUALITATIVE DISCLOSURES ABOUT MARKET RISK
Interest Rate Sensitivity
We had cash and cash equivalents of $133.4 million and $11.2 million as of December 31, 2012 and 2011, respectively. These amounts were held primarily in cash deposits and money market funds. The fair value of our cash and cash equivalents would not be significantly affected by either an increase or decrease in interest rates due mainly to the short-term nature of these instruments.
Foreign Currency Risk
Most of our sales are denominated in U.S. dollars, and therefore, our revenues are not currently subject to significant foreign currency risk. Our operating expenses are denominated in the currencies of the countries in which our operations are located, and may be subject to fluctuations due to changes in foreign currency exchange rates, particularly changes in the Chinese Yuan, British Pound, Taiwan Dollar and Indian Rupee. Fluctuation in foreign currency exchange rates may cause us to recognize transaction gains and losses in our statement of operations. To date, foreign currency transaction gains and losses have not been material to our financial statements, and we have not engaged in any foreign currency hedging transactions.
45
ITEM 8. CONSOLIDATED FINANCIAL STATEMENTS AND SUPPLEMENTARY DATA
INDEX TO CONSOLIDATED FINANCIAL STATEMENTS
Ruckus Wireless, Inc. | ||
46
REPORT OF INDEPENDENT REGISTERED PUBLIC ACCOUNTING FIRM
To the Board of Directors and Stockholders of
Ruckus Wireless, Inc.
Sunnyvale, California
We have audited the accompanying consolidated balance sheets of Ruckus Wireless, Inc. and subsidiaries (the "Company") as of December 31, 2012 and 2011, and the related consolidated statements of operations, statements of redeemable convertible preferred stock and stockholders' equity (deficit), and cash flows for each of the three years in the period ended December 31, 2012. These financial statements are the responsibility of the Company's management. Our responsibility is to express an opinion on the financial statements based on our audits.
We conducted our audits in accordance with the standards of the Public Company Accounting Oversight Board (United States). Those standards require that we plan and perform the audit to obtain reasonable assurance about whether the financial statements are free of material misstatement. The Company is not required to have, nor were we engaged to perform, an audit of its internal control over financial reporting. Our audits included consideration of internal control over financial reporting as a basis for designing audit procedures that are appropriate in the circumstances, but not for the purpose of expressing an opinion on the effectiveness of the Company's internal control over financial reporting. Accordingly, we express no such opinion. An audit also includes examining, on a test basis, evidence supporting the amounts and disclosures in the financial statements, assessing the accounting principles used and significant estimates made by management, as well as evaluating the overall financial statement presentation. We believe that our audits provide a reasonable basis for our opinion.
In our opinion, such consolidated financial statements present fairly, in all material respects, the financial position of Ruckus Wireless, Inc. and subsidiaries as of December 31, 2012 and 2011, and the results of their operations and their cash flows for each of the three years in the period ended December 31, 2012, in conformity with accounting principles generally accepted in the United States of America.
/s/ Deloitte & Touche LLP
San Jose, California
March 5, 2013
47
RUCKUS WIRELESS, INC.
Consolidated Balance Sheets
(in thousands, except per share amounts)
December 31, | |||||||
2012 | 2011 | ||||||
ASSETS | |||||||
Current assets: | |||||||
Cash and cash equivalents | $ | 133,386 | $ | 11,200 | |||
Accounts receivable, net of allowance for doubtful accounts of $140 and $117 as of December 31, 2012 and 2011, respectively | 41,296 | 20,402 | |||||
Inventories | 19,041 | 10,925 | |||||
Deferred costs | 5,188 | 1,489 | |||||
Deferred tax assets | 9,055 | 231 | |||||
Prepaid expenses and other current assets | 2,722 | 1,409 | |||||
Total current assets | 210,688 | 45,656 | |||||
Property and equipment, net | 8,959 | 4,555 | |||||
Goodwill | 9,031 | 9,031 | |||||
Intangible assets, net | 4,991 | 6,311 | |||||
Noncurrent deferred tax asset | 9,214 | — | |||||
Other assets | 956 | 137 | |||||
Total assets | $ | 243,839 | $ | 65,690 | |||
LIABILITIES, REDEEMABLE CONVERTIBLE PREFERRED STOCK AND STOCKHOLDERS’ EQUITY (DEFICIT) | |||||||
Current liabilities: | |||||||
Accounts payable | $ | 16,164 | $ | 11,319 | |||
Short-term credit facility | — | 5,000 | |||||
Accrued compensation | 9,447 | 4,874 | |||||
Accrued liabilities | 5,371 | 4,269 | |||||
Liabilities related to acquisitions | 2,000 | 4,600 | |||||
Current portion of loans payable | — | 3,262 | |||||
Deferred revenue | 36,613 | 15,259 | |||||
Total current liabilities | 69,595 | 48,583 | |||||
Noncurrent portion of loans payable | – | 5,207 | |||||
Noncurrent deferred revenue | 3,873 | 1,922 | |||||
Noncurrent deferred tax liabilities | – | 268 | |||||
Preferred stock warrant liability | – | 1,050 | |||||
Other noncurrent liabilities | 160 | 2,146 | |||||
Total liabilities | 73,628 | 59,176 | |||||
Commitments and contingencies (Note 8) | |||||||
Redeemable convertible preferred stock, $0.001 par value per share; zero and 43,609 shares authorized as of December 31, 2012 and 2011, respectively; zero and 43,285 shares issued and outstanding as of December 31, 2012 and 2011, respectively | — | 51,257 | |||||
Stockholders’ equity (deficit): | |||||||
Common stock, $0.001 par value; 250,000 and 95,000 shares authorized as of December 31, 2012 and 2011, respectively: 74,166 and 18,273 shares issued and outstanding at December 31, 2012 and 2011, respectively | 74 | 18 | |||||
Additional paid–in capital | 193,731 | 10,537 | |||||
Accumulated Deficit | (23,594 | ) | (55,298 | ) | |||
Total stockholders’ equity (deficit) | 170,211 | (44,743 | ) | ||||
Total liabilities, redeemable convertible preferred stock and stockholders’ equity (deficit) | $ | 243,839 | $ | 65,690 | |||
See notes to consolidated financial statements.
48
RUCKUS WIRELESS, INC.
Consolidated Statements of Operations
(in thousands, except per share amounts)
Years Ended December 31, | |||||||||||
2012 | 2011 | 2010 | |||||||||
Revenues: | |||||||||||
Product | $ | 201,913 | $ | 114,684 | $ | 73,108 | |||||
Service | 12,740 | 5,339 | 2,381 | ||||||||
Total revenues | 214,653 | 120,023 | 75,489 | ||||||||
Cost of revenues: | |||||||||||
Product | 70,478 | 44,705 | 34,039 | ||||||||
Service | 5,306 | 2,502 | 1,705 | ||||||||
Total cost of revenues | 75,784 | 47,207 | 35,744 | ||||||||
Gross profit | 138,869 | 72,816 | 39,745 | ||||||||
Operating expenses: | |||||||||||
Research and development | 43,821 | 24,892 | 19,256 | ||||||||
Sales and marketing | 56,209 | 32,659 | 19,185 | ||||||||
General and administrative | 20,237 | 8,524 | 4,231 | ||||||||
Total operating expenses | 120,267 | 66,075 | 42,672 | ||||||||
Operating income (loss) | 18,602 | 6,741 | (2,927 | ) | |||||||
Interest expense | (472 | ) | (1,025 | ) | (1,011 | ) | |||||
Other expense, net | (3,664 | ) | (1,215 | ) | (290 | ) | |||||
Income (loss) before income taxes | 14,466 | 4,501 | (4,228 | ) | |||||||
Income tax benefit (expense) | 17,238 | (315 | ) | (176 | ) | ||||||
Net income (loss) | $ | 31,704 | $ | 4,186 | $ | (4,404 | ) | ||||
Net income (loss) attributable to common stockholders | $ | 9,036 | $ | 379 | $ | (4,404 | ) | ||||
Net income (loss) per share attributable to common stockholders: | |||||||||||
Basic | $ | 0.36 | $ | 0.02 | $ | (0.30 | ) | ||||
Diluted | $ | 0.24 | $ | 0.02 | $ | (0.30 | ) | ||||
Weighted average shares used in computing net income (loss) per share attributable to common stockholders: | |||||||||||
Basic | 24,847 | 15,584 | 14,498 | ||||||||
Diluted | 37,775 | 23,269 | 14,498 | ||||||||
See notes to consolidated financial statements.
49
RUCKUS WIRELESS, INC.
Consolidated Statements of Redeemable Convertible Preferred Stock and Stockholders’ Equity (Deficit)
(in thousands)
Redeemable Convertible Preferred Stock | Common Stock | Additional paid in capital | Accumulated deficit | Total Stockholders’ Equity (Deficit) | |||||||||||||||||||||
Shares | Amount | Shares | Amount | ||||||||||||||||||||||
Balances at December 31, 2009 (unaudited) | 43,054 | $ | 50,919 | 14,516 | $ | 14 | $ | 3,364 | $ | (55,080 | ) | $ | (51,702 | ) | |||||||||||
Stock-based compensation expense | — | — | — | — | 1,213 | — | 1,213 | ||||||||||||||||||
Issuance of common stock upon exercise of stock options | — | — | 648 | 1 | 198 | — | 199 | ||||||||||||||||||
Vesting of early exercised common stock options | — | — | — | — | 122 | — | 122 | ||||||||||||||||||
Repurchase of unvested early exercised common stock options | — | — | (32 | ) | — | — | — | — | |||||||||||||||||
Cashless exercise of preferred stock warrant | 231 | 338 | (263 | ) | — | (263 | ) | ||||||||||||||||||
Net loss | — | — | — | — | — | (4,404 | ) | (4,404 | ) | ||||||||||||||||
Balances at December 31, 2010 | 43,285 | 51,257 | 15,132 | 15 | 4,634 | (59,484 | ) | (54,835 | ) | ||||||||||||||||
Stock-based compensation expense | — | — | — | — | 2,268 | — | 2,268 | ||||||||||||||||||
Issuance of common stock upon exercise of stock options | — | — | 1,724 | 2 | 451 | — | 453 | ||||||||||||||||||
Vesting of early exercised common stock options | — | — | — | — | 61 | — | 61 | ||||||||||||||||||
Repurchase of unvested early exercised common stock options | — | — | (6 | ) | — | — | — | — | |||||||||||||||||
Common stock issued for IntelliNet acquisition | — | — | 1,423 | 1 | 3,030 | — | 3,031 | ||||||||||||||||||
Tax benefit from stock options exercised | — | — | — | — | 18 | — | 18 | ||||||||||||||||||
Issuance of warrants | — | — | — | — | 75 | — | 75 | ||||||||||||||||||
Net income | — | — | — | — | — | 4,186 | 4,186 | ||||||||||||||||||
Balances at December 31, 2011 | 43,285 | 51,257 | 18,273 | 18 | 10,537 | (55,298 | ) | (44,743 | ) | ||||||||||||||||
Stock-based compensation expense | — | — | — | — | 8,451 | — | 8,451 | ||||||||||||||||||
Issuance of common stock upon exercise of common stock options | — | — | 812 | 1 | 629 | — | 630 | ||||||||||||||||||
Vesting of early exercised common stock options | — | — | — | — | 113 | — | 113 | ||||||||||||||||||
Repurchase of unvested early exercised common stock options | — | — | (2 | ) | — | — | — | — | |||||||||||||||||
Issuance of Series G redeemable convertible preferred stock, net of issuance costs | 4,590 | 24,883 | — | — | — | — | — | ||||||||||||||||||
Cashless exercise of preferred stock warrant | 106 | 1,589 | — | — | — | — | — | ||||||||||||||||||
Cashless exercise of common stock warrant | — | — | 102 | — | — | — | — | ||||||||||||||||||
Issuance of common stock upon initial public offering, net of issuance costs | — | — | 7,000 | 7 | 93,992 | — | 93,999 | ||||||||||||||||||
50
Conversion of preferred stock to common stock upon initial public offering | (47,981 | ) | (77,729 | ) | 47,981 | 48 | 77,681 | — | 77,729 | ||||||||||||||||
Conversion of preferred stock warrants to common stock warrants upon initial public offering | — | — | — | — | 2,303 | — | 2,303 | ||||||||||||||||||
Tax benefit from stock options exercised | — | — | — | — | 25 | — | 25 | ||||||||||||||||||
Net income | — | — | — | — | — | 31,704 | 31,704 | ||||||||||||||||||
Balances at December 31, 2012 | — | $ | — | 74,166 | $ | 74 | $ | 193,731 | $ | (23,594 | ) | $ | 170,211 | ||||||||||||
See notes to consolidated financial statements.
51
RUCKUS WIRELESS, INC.
Consolidated Statements of Cash Flows
(in thousands)
Years Ended December 31, | |||||||||||
2012 | 2011 | 2010 | |||||||||
Cash Flows from Operating Activities: | |||||||||||
Net income (loss) | $ | 31,704 | $ | 4,186 | $ | (4,404 | ) | ||||
Adjustments to reconcile net income (loss) to cash provided by (used in) operating activities: | |||||||||||
Depreciation and amortization | 4,850 | 2,072 | 1,139 | ||||||||
Provision for doubtful accounts | 179 | 57 | 46 | ||||||||
Stock-based compensation | 8,451 | 2,268 | 1,213 | ||||||||
Change in fair value of preferred stock warrants | 2,842 | 868 | 29 | ||||||||
Revaluation of contingent liability | 400 | — | — | ||||||||
Accretion of debt discount | 93 | 84 | 29 | ||||||||
Deferred income taxes | (18,281 | ) | 55 | — | |||||||
Excess income tax benefit from the exercise of stock options | (25 | ) | (18 | ) | — | ||||||
Loss on disposal of property and equipment | 35 | — | 20 | ||||||||
Changes in operating assets and liabilities: | |||||||||||
Accounts receivable | (21,073 | ) | (9,983 | ) | (810 | ) | |||||
Inventories | (8,116 | ) | 1,261 | (9,514 | ) | ||||||
Deferred costs | (3,699 | ) | (16 | ) | 131 | ||||||
Prepaid expenses and other current assets | (1,313 | ) | (513 | ) | (173 | ) | |||||
Other assets | (228 | ) | 244 | 903 | |||||||
Accounts payable | 4,031 | 3,523 | 4,418 | ||||||||
Accrued compensation | 4,573 | 2,156 | 850 | ||||||||
Accrued liabilities | 364 | 1,806 | (13 | ) | |||||||
Deferred revenue | 23,305 | 6,901 | (490 | ) | |||||||
Net cash provided by (used in) operating activities | 28,092 | 14,951 | (6,626 | ) | |||||||
Cash Flows from Investing Activities: | |||||||||||
Cash used in acquisition | (2,000 | ) | (6,000 | ) | — | ||||||
Purchase of property and equipment | (7,531 | ) | (3,664 | ) | (1,555 | ) | |||||
Increase in facility lease deposits | (591 | ) | — | — | |||||||
Net cash used in investing activities | (10,122 | ) | (9,664 | ) | (1,555 | ) | |||||
Cash Flows from Financing Activities: | |||||||||||
Proceeds from initial public offering | 97,650 | — | — | ||||||||
Offering costs for common stock | (2,812 | ) | — | — | |||||||
Proceeds from exercise of vested stock options | 630 | 453 | 199 | ||||||||
Proceeds from exercise of unvested stock options, net of repurchases | 2 | 120 | 52 | ||||||||
Excess income tax benefit from the exercise of stock options | 25 | 18 | — | ||||||||
Proceeds from credit facilities | — | 7,500 | — | ||||||||
Payments on credit facilities | (5,000 | ) | (2,500 | ) | — | ||||||
Payments on loans payable | (8,562 | ) | (1,569 | ) | (776 | ) | |||||
Proceeds from issuance of redeemable convertible preferred stock | 25,000 | — | — | ||||||||
Issuance costs for redeemable convertible preferred stock | (117 | ) | — | — | |||||||
Settlement of contingent consideration | (2,600 | ) | — | — | |||||||
Net cash provided by (used in) financing activities | 104,216 | 4,022 | (525 | ) | |||||||
Net increase (decrease) in cash and cash equivalents | 122,186 | 9,309 | (8,706 | ) | |||||||
Cash and cash equivalents at beginning of year | 11,200 | 1,891 | 10,597 | ||||||||
Cash and cash equivalents at end of year | $ | 133,386 | $ | 11,200 | $ | 1,891 | |||||
See notes to consolidated financial statements.
52
RUCKUS WIRELESS, INC.
Consolidated Statements of Cash Flows
(in thousands)
Years Ended December 31, | |||||||||||
2012 | 2011 | 2010 | |||||||||
Supplemental Disclosure of Cash Flow Information: | |||||||||||
Income taxes paid | $ | 934 | $ | 221 | $ | 92 | |||||
Interest paid | $ | 761 | $ | 810 | $ | 766 | |||||
Noncash Investing and Financing Activities | |||||||||||
Conversion of preferred stock into common stock | $ | 77,729 | $ | — | $ | — | |||||
Issuance of warrants | $ | — | $ | 75 | $ | 25 | |||||
Cashless exercise of preferred stock warrant | $ | 1,589 | $ | — | $ | 75 | |||||
Unpaid offering costs in additional paid-in capital | $ | 839 | $ | — | $ | — | |||||
Vesting of early exercised stock options | $ | 113 | $ | 61 | $ | 122 | |||||
Contingent consideration accrued for IntelliNet asset acquisition | $ | — | $ | 6,600 | $ | — | |||||
Common stock issued for IntelliNet asset acquisition | $ | — | $ | 3,031 | $ | — | |||||
Purchases of property and equipment recorded in accounts payable and accrued liabilities | $ | 928 | $ | 490 | $ | 303 | |||||
See notes to consolidated financial statements.
53
NOTE 1—ORGANIZATION AND SIGNIFICANT ACCOUNTING POLICIES
Description of Business—Ruckus Wireless, Inc. (“Ruckus”) is a leading provider of carrier-class Wi-Fi solutions. Ruckus’s solutions, which it calls Smart Wi-Fi, are used by service providers and enterprises to solve network capacity and coverage challenges associated with the rapidly increasing traffic and number of users on wireless networks. Ruckus’s Smart Wi-Fi solutions offer carrier-class enhanced reliability, consistent performance, extended range and massive scalability. Ruckus’s products include gateways, controllers and access points. These products incorporate the Company’s proprietary technologies, including Smart Radio, Smart QoS, Smart Mesh, SmartCell and Smart Scaling, to enable high performance in a variety of challenging operating conditions faced by service providers and enterprises.
Principles of Consolidation—The consolidated financial statements include the accounts of Ruckus and its wholly owned subsidiaries (collectively, the “Company”). All intercompany balances and transactions have been eliminated in consolidation.
Use of Estimates—The preparation of financial statements in conformity with generally accepted accounting principles (“GAAP”) in the United States of America requires management to make estimates and assumptions that affect the amounts reported in the consolidated financial statements and accompanying notes. Significant estimates and assumptions made by management include the determination of revenue recognition and deferred revenue, goodwill and intangible valuation, the fair value of stock awards and preferred stock warrant liability, inventory valuation, estimates of warranty liability and accounting for income taxes. Management bases its estimates on historical experience and also on assumptions that it believes are reasonable. Actual results could materially differ from those estimates.
Concentrations of Credit Risk and Significant Customers—Financial instruments that subject the Company to significant concentrations of credit risk primarily consist of cash and cash equivalents and accounts receivable. The Company maintains its cash and cash equivalents with well-capitalized financial institutions. Deposits held with banks may exceed the amount of insurance provided on such deposits. The Company sells its products primarily to distributors and carriers located in the Americas, Europe, and Asia Pacific. The Company generally does not require its customers to provide collateral to support accounts receivable. To reduce credit risk, management performs ongoing credit evaluations of its customers’ financial condition. The Company has recorded an allowance for doubtful accounts for those receivables management has determined to not be collectible.
The percentages of revenues from individual customers totaling greater than 10% of total consolidated Company revenues were as follows:
Year Ended, December 31, | ||||||||
2012 | 2011 | 2010 | ||||||
Distributor A | 16.3 | % | 16.3 | % | 10.9 | % | ||
Distributor B | 12.5 | % | 12.7 | % | * | |||
Distributor C | * | 11.4 | % | * | ||||
End-customer A | * | * | 12.6 | % | ||||
* Less than 10% | ||||||||
The percentage of receivables from individual customers totaling greater than 10% of total consolidated Company accounts receivable were as follows:
December 31, | |||||||
2012 | 2011 | ||||||
Distributor A | 10.3 | % | 12.9 | % | |||
* Less than 10% | |||||||
Deferred Costs—When the Company’s products have been delivered, but the product revenue associated with the arrangement has been deferred as a result of not meeting the revenue recognition criteria (see “Revenue Recognition” below), the related product costs are also deferred. The deferred costs are recognized in cost of revenues when the related deferred revenue is recognized.
Foreign Currency—The functional currency of the Company’s foreign subsidiaries is the U.S. dollar. Monetary assets and liabilities are re-measured using the current exchange rate at the balance sheet date. Non-monetary assets and liabilities and capital accounts are re-measured using historical exchange rates. Revenues and expenses are re-measured using the average exchange rates in effect during the period. Foreign currency re-measurement gains and losses have not been material for any periods presented.
54
Cash and Cash Equivalents—The Company considers all highly liquid financial instruments with original maturities of 90 days or less to be cash equivalents. Cash and cash equivalents are stated at cost, which approximates fair value. At December 31, 2012, the Company’s cash equivalents included interest-bearing accounts and money market funds. At December 31, 2011, the Company’s cash equivalents included interest-bearing bank accounts.
Provision for Doubtful Accounts—The Company records a provision for doubtful accounts based on historical experience and a detailed assessment of the collectability of its accounts receivable. In estimating the allowance for doubtful accounts, management considers, among other factors, the aging of the accounts receivable, historical write-offs, and the credit-worthiness of each customer. If circumstances change, such as higher-than-expected defaults or an unexpected material adverse change in a major customer’s ability to meet its financial obligations, the Company’s estimate of the recoverability of the amounts due could be reduced by a material amount.
Activity in the provision for doubtful accounts was as follows:
Years Ended December 31, | |||||||||||
2012 | 2011 | 2010 | |||||||||
(in thousands) | |||||||||||
Balance at beginning of year | $ | 117 | $ | 66 | $ | 265 | |||||
Charged to expenses | 179 | 57 | 46 | ||||||||
Write-offs | (156 | ) | (6 | ) | (245 | ) | |||||
Balance at end of year | $ | 140 | $ | 117 | $ | 66 | |||||
Inventories—Inventories are carried at the lower of standard cost (which approximates actual cost on a first-in, first-out basis) or market value (estimated net realizable value). The Company evaluates inventory for excess and obsolete products, based on management’s assessment of future demand and market conditions. The Company subcontracts manufacturing on substantially all of its products. At December 31, 2012 and 2011, inventories were predominately comprised of finished goods.
Property and Equipment, Net—Property and equipment are stated at cost, less accumulated depreciation and amortization. Depreciation is calculated using the straight-line method over the estimated useful lives of the respective assets, which are generally three to seven years for computer hardware and software, office furniture and fixtures, and machinery, equipment and tooling. Leasehold improvements are amortized using the straight-line method over the shorter of the estimated useful lives of the leasehold improvements or the term of the related lease.
Impairment of Long-Lived Assets—Management reviews property, equipment and intangible assets for impairment whenever events or changes in circumstances indicate the carrying amount of an asset may not be recoverable. Recoverability of these assets is measured by a comparison of the carrying amounts to the future undiscounted cash flows the assets are expected to generate. If property and equipment or intangible assets are considered to be impaired, the impairment to be recognized equals the amount by which the carrying value of the asset exceeds its fair market value. No impairment of property, equipment or intangible assets has been identified as of December 31, 2012.
Revenue Recognition—The Company generates revenue from the sales of hardware with embedded software and related post contract support (“PCS”) through a direct sales force and indirect relationships with its channel partners.
Revenue is recognized when all of the following criteria are met:
• | Persuasive evidence of an arrangement exists. The Company relies upon sales contracts and purchase orders to determine the existence of an arrangement. |
• | Delivery has occurred. Delivery is deemed to have occurred when title has transferred. The Company uses shipping documents to verify transfer of title. |
• | The fee is fixed or determinable. The Company assesses whether the fee is fixed or determinable based on the terms associated with the transaction. |
• | Collectability is reasonably assured. The Company assesses collectability based on credit analysis and payment history. |
The Company recognizes product revenue at the time of title transfer provided that all other revenue recognition criteria have been met.
Certain distributors that stock the Company’s products are granted stock rotation rights as well as rebates for sales of the Company’s products. Therefore, the arrangement fee for this group of distributors is not fixed and determinable when products are shipped and revenue is deferred until the Company’s products are shipped to the distributor’s customer.
55
Certain of the Company’s arrangements are multiple-element arrangements which consist of hardware products with embedded software and PCS. The Company’s hardware with the embedded software (which is a proprietary operating system that together with the hardware delivers the functionality desired by the Company’s customers), is considered a separate unit of accounting from PCS as the Company’s customers often buy its hardware products without PCS. For multiple-element arrangements, the Company allocates revenue to each unit of accounting based on an estimated selling price at the inception of the arrangement. The total arrangement consideration is allocated to each separate unit of accounting using the relative estimated selling prices of each unit. The Company limits the amount of revenue recognized for delivered elements to an amount that is not contingent upon future delivery of additional products or service.
To determine the estimated selling price in multiple-element arrangements, the Company first looks to establish vendor specific objective evidence (“VSOE”) of selling price using the prices charged for a deliverable when sold separately. If VSOE of selling price cannot be established for a deliverable, the Company looks to establish third-party evidence (“TPE”) of selling price by evaluating the pricing of similar and interchangeable competitor products or services in standalone arrangements. However, as the Company’s products contain a significant element of proprietary technology and offer substantially different features and functionality from its competitors, the Company is unable to obtain comparable pricing information with respect to its competitors’ products. Therefore, the Company has not been able to obtain reliable evidence of TPE of selling price. If neither VSOE nor TPE of selling price can be established for a deliverable, the Company establishes best estimated selling price (“BESP”) by reviewing historical transaction information and considering several other internal factors including discounting and margin objectives. The Company has established VSOE of selling price of PCS through an analysis of the historical separate sales of PCS, noting that such sales have occurred at consistent prices and with a high level of concentration with respect to such pricing. Furthermore, the Company has established BESP of selling price of its hardware with embedded software based on an analysis of its historical separate sales of hardware products with embedded software. The concentration of such pricing was not sufficient to assert VSOE of selling price, and accordingly the Company has determined that it can only demonstrate BESP of selling price.
The Company makes certain estimates and maintains allowances for sales returns, stock rotation, and other programs based on its historical experience. To date, these estimates have not been significant. The Company recognizes services revenue from PCS ratably over the contractual service period, which is typically one to five years. Other services revenue is recognized as the services are rendered and has not been significant to date.
Revenues are reported net of sales taxes. Shipping charges billed to partners are included in revenues and related costs are included in cost of revenue.
Research and Development Costs—Research and development costs are expensed as incurred. Based on the Company product development process, technological feasibility is established upon completion of the working model. To date, costs incurred by the Company between the completion of a working model and the point at which the product is ready for general release have been insignificant. Accordingly, the Company has charged all such costs to research and development expense in the period incurred.
Stock-Based Compensation—The Company measures compensation expense for all stock-based payment awards, including stock options granted to employees and purchases under the Company's Employee Stock Purchase Plan ("ESPP"), based on the estimated fair values on the date of the grant. The fair value of each stock option granted is estimated using the Black-Scholes option pricing model. The fair value of purchases under the Company's ESPP is calculated based on the closing price of the Company's stock on the date of grant and the value of put and call options estimated using the Black-Scholes pricing model. Stock-based compensation is recognized on a straight-line basis over the requisite service period, net of estimated forfeitures. The forfeiture rate is based on an analysis of the Company’s actual historical forfeitures.
The Company accounts for stock options issued to nonemployees based on the fair value of the awards determined using the Black-Scholes option pricing model. The fair value of stock options granted to nonemployees is re-measured as the stock options vest, and the resulting change in fair value, if any, is recognized in the Company’s consolidated statement of operations during the period the related services are rendered.
Goodwill—The Company evaluates goodwill for impairment annually in the fourth quarter of the Company’s fiscal year or whenever events or changes in circumstances indicate the carrying value of goodwill may not be recoverable. Triggering events that may indicate impairment include, but are not limited to, a significant adverse change in customer demand or business climate that could affect the value of goodwill or a significant decrease in expected cash flows. No impairment of goodwill has been identified through December 31, 2012.
Intangible Assets, Net—Acquired intangible assets consist of purchased technology resulting from the Company’s acquisition. Acquired intangible assets are recorded at fair value, net of accumulated amortization. Intangible assets are amortized on a straight-line basis over their estimated useful lives.
Preferred Stock Warrant Liability—Upon completion of the Company's initial public offering ("IPO") in November 2012, there were no freestanding warrants to purchase shares of convertible preferred stock. As such, no preferred stock warrant liability remained outstanding after the IPO. Before the Company's IPO, freestanding warrants related to shares that are redeemable or contingently redeemable were classified as a liability in the Company’s consolidated balance sheet. The convertible preferred stock warrants were subject to re-measurement at each balance sheet date, and any change in fair value was recognized as a component of other expense, net. The Company adjusted the convertible preferred stock warrant liability to the estimated fair value of the warrants until the completion of an IPO, at which time the convertible preferred stock issuable upon exercise of the warrants became warrants to purchase common stock and the related liability was reclassified to additional paid-in capital in stockholders' equity (deficit).
56
Income Taxes—The Company utilizes the asset and liability method of accounting for income taxes. Under this method, deferred tax assets and liabilities are determined based on the differences between financial reporting and tax reporting bases of assets and liabilities, and are measured using enacted tax rates and laws that are expected to be in effect when the differences are expected to reverse. Valuation allowances are provided when necessary to reduce deferred tax assets to the amount expected to be realized. Significant management judgment is required in determining the period in which the reversal of a valuation allowance should occur. The Company is required to consider all available evidence, both positive and negative, such as historical levels of income and future forecasts of taxable income amongst other items, in determining whether a full or partial release of its valuation allowance is required. The Company is also required to forecast future taxable income in accordance with accounting standards that address income taxes to assess the appropriateness of a valuation allowance, which further requires the exercise of significant management judgment.
During the year ended December 31, 2012, the Company concluded that it was more likely than not that the Company would be able to realize the benefit of the U.S. federal and state deferred tax assets, principally consisting of net operating losses, in the future. As a result, the Company reduced the valuation allowance on the Company’s net deferred tax assets by $23.6 million. The income tax benefit of $17.2 million for the year ended December 31, 2012 primarily relates to the release of the Company's valuation allowance of $23.6 million, offset by the federal statutory tax expense associated with the use of net operating losses and minor amounts of state and foreign taxes.
The Company records uncertain tax positions in accordance with accounting standards on the basis of a two-step process whereby (1) a determination is made as to whether it is more likely than not that the tax positions will be sustained based on the technical merits of the position and (2) for those tax positions that meet the more-likely-than-not recognition threshold the Company recognizes the largest amount of tax benefit that is greater than 50% likely to be realized upon ultimate settlement with the related tax authority.
Comprehensive Income (Loss)—In June 2011, the FASB issued an accounting standards update that requires an entity to present the total of comprehensive income, the components of net income, and the components of other comprehensive income either in a single continuous statement of comprehensive income or in two separate but consecutive statements. This guidance eliminates the option to present the components of other comprehensive income as part of the statement of equity. The Company retrospectively adopted these new standards in the first quarter of 2012. The adoption had no impact on the Company’s financial statements as the Company does not have items of accumulated other comprehensive income.
Warranties—The Company offers a limited lifetime hardware warranty on its indoor wireless local area network ("LAN") products and a limited warranty for all other products for a period of up to one year for hardware and 90 days for software. The Company estimates the costs that may be incurred under its limited or limited lifetime or limited warranty and records a liability for products sold as a charge to cost of revenues. Estimates of future warranty costs are largely based on historical experience of product failure rates and material usage incurred in correcting product failures. The Company periodically assesses the adequacy of its recorded warranty liability and adjusts the amounts as necessary.
The warranty liability is included as a component of accrued liabilities in the accompanying consolidated balance sheets. Changes in the warranty liability are as follows:
Years Ended December 31, | |||||||||||
2012 | 2011 | 2010 | |||||||||
(in thousands) | |||||||||||
Balance at beginning of year | $ | 489 | $ | 605 | $ | 216 | |||||
Changes in existing warranty | 47 | (74 | ) | (135 | ) | ||||||
Warranty expense | 784 | 657 | 710 | ||||||||
Obligations fulfilled | (595 | ) | (699 | ) | (186 | ) | |||||
Balance at end of year | $ | 725 | $ | 489 | $ | 605 | |||||
NOTE 2—FAIR VALUE DISCLOSURE
Assets and liabilities recorded at fair value in the consolidated financial statements are categorized based upon the level of judgment associated with the inputs used to measure their fair value. The Company categorizes its financial instruments into a fair value hierarchy that prioritizes the inputs to valuation techniques used to measure fair value. The hierarchy gives the highest priority to unadjusted quoted prices in active markets for identical assets or liabilities (Level 1 measurements) and the lowest priority to unobservable inputs (Level 3 measurements).
A financial instrument’s level within the fair value hierarchy is based on the lowest level of any input that is significant to the fair value measurement. Hierarchical levels that are directly related to the amount of subjectivity associated with the inputs to the valuation of these assets or liabilities are as follows:
Level 1 | Quoted prices (unadjusted) in active markets that are accessible at the measurement date for identical assets or liabilities. | |
Level 2 | Observable prices that are based on inputs not quoted on active markets, but corroborated by market data. | |
Level 3 | Unobservable inputs are used when little or no market data is available. | |
57
The Company’s liabilities that were measured at fair value by level within the fair value hierarchy are as follows:
December 31, 2012 | |||||||||||||||
Fair Value | Level 1 | Level 2 | Level 3 | ||||||||||||
Assets: | (in thousands) | ||||||||||||||
Money market funds | $ | 109,020 | $ | 109,020 | $ | — | $ | — | |||||||
December 31, 2011 | |||||||||||||||
Fair Value | Level 1 | Level 2 | Level 3 | ||||||||||||
Liabilities: | (in thousands) | ||||||||||||||
Redeemable convertible preferred stock warrant liability | $ | (1,050 | ) | $ | — | $ | — | $ | (1,050 | ) | |||||
Contingent consideration for purchase of certain assets of IntelliNet(1) | (2,600 | ) | — | — | (2,600 | ) | |||||||||
Total liabilities measured and recorded at fair value | $ | (3,650 | ) | $ | — | $ | — | $ | (3,650 | ) | |||||
(1) The fair value of contingent consideration arising from the purchase of certain assets of IntelliNet Technologies, Inc. (“IntelliNet”) (see Note 3), was classified within Level 3 of the fair value hierarchy since it was based on a probability that includes significant unobservable inputs. The significant unobservable inputs included projected orders, probability of occurrence and discount rate to present value the expected payments. The fair value of the contingent consideration was calculated on a quarterly basis by the Company based on a collaborative effort of the Company’s operations, finance and accounting groups based on additional information as it becomes available. Any change in the fair value was recorded in the earnings of that period.
The following table presents the fair value activity for the contingent consideration for purchase of certain assets of IntelliNet:
Fair Value | |||
(in thousands) | |||
As of December 31, 2011 | $ | 2,600 | |
Change in fair value | 400 | ||
Settlement with IntelliNet | (3,000 | ) | |
As of December 31, 2012 | $ | — | |
A reconciliation of the redeemable convertible preferred stock warrants measured and recorded at fair value on a recurring basis, using significant unobservable inputs (Level 3) is as follows:
Years Ended December 31, | |||||||
2012 | 2011 | ||||||
(in thousands) | |||||||
Balance at beginning of year | $ | 1,050 | $ | 182 | |||
Changes in fair value of warrants | 2,842 | 868 | |||||
Reclassification to equity upon exercise | (1,589 | ) | — | ||||
Conversion of redeemable convertible preferred stock warrants to common stock warrants | (2,303 | ) | — | ||||
Balance at end of year | $ | — | $ | 1,050 | |||
Additional quantitative information related to the redeemable convertible preferred stock warrants is included in Note 10.
58
NOTE 3—ACQUISITION
On October 12, 2011 (the “Closing Date”), pursuant to a purchase agreement (the “Agreement”) dated September 30, 2011, the Company completed the acquisition (the “Acquisition”) of certain assets of IntelliNet. The Company acquired IntelliNet’s previously developed software suite (the “Purchased Technology”), certain fixed assets and an organized workforce having the necessary skills and experience to provide the necessary processes in order to integrate IntelliNet’s operations into the Company’s operations and further continue development of the Purchased Technology. Prior to the Acquisition, IntelliNet had previously generated revenue from the sale of its software. Accordingly, the Acquisition was accounted under the acquisition method of accounting for a business as defined in ASC 805 Business Combinations. IntelliNet was a provider of network convergence solutions that accelerated the deployment of applications and services to the telecommunications industry and is expected to enable the Company to expand its SmartCell gateway product offering.
Pursuant to the terms of the Agreement, the total purchase price was approximately $15.6 million and consisted of the following:
Amount | |||||
(in thousands) | |||||
Cash consideration paid at closing | $ | 6,000 | |||
Common stock issued at closing (1.4 million shares) | 3,031 | ||||
Holdback based on standard representations and warranties | 4,000 | ||||
Contingent consideration ($3.0 million, net of $0.4 million discount) | 2,600 | ||||
Total consideration | $ | 15,631 | |||
The hold back amount of $4.0 million is payable in cash in four equal installments of $1.0 million every six months for two years. As of December 31, 2012, the Company had made $2.0 million in payments with respect to the hold back amount.
Contingent consideration of $3.0 million, was paid in the fourth quarter of 2012. The estimated fair value at the date of acquisition was $2.6 million. A change in the fair value of the contingent consideration subsequent to the Closing Date of $0.4 million was recorded in the Company’s statement of operations in other expense, net for the year ended December 31, 2012.
The Company determined the fair value of the various assets acquired, which consisted principally of the Purchased Technology; the fixed assets acquired were not material to the Company. The Company did not assume any liabilities as a result of the Acquisition. The excess of the purchase price over the fair value of the Purchased Technology was allocated to goodwill.
The following table summarizes the estimated purchase price allocation:
Amount | Estimated Useful Lives | ||||
(in thousands, except estimated useful lives) | |||||
Purchased technology | $ | 6,600 | 5 years | ||
Goodwill | 9,031 | N/A (1) | |||
Total | $ | 15,631 | |||
(1) Goodwill is not amortized but tested for impairment annually or more frequently if impairment indicators arise. In part, goodwill reflects the competitive advantages the Company expects to realize from the assembled workforce. The goodwill is deductible for tax purposes.
The Company incurred approximately $0.5 million of expenses related to the operations of IntelliNet from the Closing Date to December 31, 2011 in the accompanying consolidated statement of operations.
The Company expensed $0.3 million of acquisition-related costs (i.e., legal, accounting, valuation and other costs) as general and administrative expenses in the accompanying consolidated statements of operations for the year ended December 31, 2011.
The following pro forma condensed financial information presents the results of operations of the Company and IntelliNet as if the Acquisition had occurred on January 1, 2010. The pro forma financial information is provided for comparative purposes only and is not necessarily indicative of what the actual results would have been had the Acquisition occurred at the beginning of 2010.
59
Pro Forma for the Years Ended December 31, | |||||||
2011 | 2010 | ||||||
(in thousands) | |||||||
(unaudited) | |||||||
Revenues | $ | 121,145 | $ | 78,659 | |||
Income (loss) before taxes | 3,336 | (6,191 | ) | ||||
Net income (loss) | 3,021 | (6,406 | ) | ||||
NOTE 4—GOODWILL AND INTANGIBLE ASSETS
As a result of the acquisition of certain assets from IntelliNet on October 12, 2011, the Company recorded the fair value of purchased technology of $6.6 million and goodwill in the amount of $9.0 million for the excess of purchase consideration over the fair value of assets acquired. There was no change to goodwill subsequent to the acquisition.
The intangible assets were as follows:
Gross Carrying Amount | Accumulated Amortization | Net Carrying Amount | Weighted Average Remaining Life | ||||||||||
(in thousands) | |||||||||||||
December 31, 2012: | |||||||||||||
Purchased technology | $ | 6,600 | $ | (1,609 | ) | $ | 4,991 | 3.8 years | |||||
December 31, 2011: | |||||||||||||
Purchased technology | $ | 6,600 | $ | (289 | ) | $ | 6,311 | 4.8 years | |||||
Amortization expense for the year ended December 31, 2012 and 2011 was $1.3 million and $0.3 million, respectively, and is included as a component of cost of revenue in the accompanying consolidated statements of operations.
Estimated future amortization of purchased intangible assets at December 31, 2012, was as follows:
Year ending December 31, | Amount | ||
(in thousands) | |||
2013 | $ | 1,320 | |
2014 | 1,320 | ||
2015 | 1,320 | ||
2016 | 1,031 | ||
Total amortization | $ | 4,991 | |
60
NOTE 5—BALANCE SHEET INFORMATION
The following tables provide details of selected consolidated balance sheet items:
Property and equipment consisted of the following:
December 31 | |||||||
2012 | 2011 | ||||||
(in thousands) | |||||||
Computer hardware | $ | 3,413 | $ | 2,406 | |||
Computer software | 2,075 | 1,197 | |||||
Machinery, equipment, and tooling | 6,818 | 4,114 | |||||
Furniture and fixtures | 1,427 | 362 | |||||
Leasehold improvements | 2,270 | 1,005 | |||||
16,003 | 9,084 | ||||||
Less accumulated depreciation and amortization | (7,044 | ) | (4,529 | ) | |||
Property and equipment, net | $ | 8,959 | $ | 4,555 | |||
For the years ended December 31, 2012, 2011 and 2010, expense related to depreciation and amortization of property and equipment was $3.5 million, $1.8 million and $1.1 million respectively.
Deferred revenue consisted of the following:
December 31, | |||||||
2012 | 2011 | ||||||
(in thousands) | |||||||
Product | $ | 27,831 | $ | 9,579 | |||
Service | 12,655 | 7,602 | |||||
Total deferred revenue | $ | 40,486 | $ | 17,181 | |||
Reported as: | |||||||
Current | $ | 36,613 | $ | 15,259 | |||
Noncurrent | 3,873 | 1,922 | |||||
Total deferred revenue | $ | 40,486 | $ | 17,181 | |||
Deferred product revenue relates to arrangements where not all revenue recognition criteria have been met. Deferred services revenue represents support contracts billed on an annual basis in advance and revenue is recognized ratably over the support period, typically one to five years.
As of December 31, 2012, the Company deferred $5.2 million in revenue related to a service provider for future products that presently expire in 2013. Approximately $2.6 million of the deferred product revenue will be recognized with no related cost of product in the first quarter of 2013.
NOTE 6—SHORT TERM CREDIT FACILITIES
In September 2011, the Company entered into a loan with a financial institution for borrowings of up to $5.0 million to be utilized for the IntelliNet acquisition. Amounts borrowed under the loan bear interest at an annual rate of 8%, with interest only payments due monthly and the principal balance due upon the earlier of (1) January 31, 2012 or (2) receipt of $10.0 million in proceeds from an equity offering. The Company borrowed $5.0 million under the facility in October 2011 in connection with the closure of the IntelliNet acquisition, all of which remained outstanding as of December 31, 2011. The loan was secured by a security interest in the Company’s intellectual property. The Company repaid the loan in full in January 2012. The Company currently has no short-term credit facilities in place.
61
NOTE 7—LOANS PAYABLE
In October 2007 and September 2008, the Company entered into a loan and security agreement (“Loan Agreement”) with a financial institution, which as amended provided for borrowings of up to approximately $12.0 million. In July 2010, the Company amended the Loan Agreement to provide up to an additional $10.0 million in receivable financing through July 2012. The Company had no borrowing outstanding under the receivable financing line as of December 31, 2011 and the receivable financing portion of the agreement expired in July 2012. The borrowings under the Loan Agreement were secured by all assets of the Company, excluding intellectual property. The Company repaid all outstanding amounts under the Loan Agreement in 2012.
Loans payable are shown below:
December 31, | |||||||
2012 | 2011 | ||||||
(in thousands) | |||||||
$2.0 million loan payable (as amended) issued October 2007, with variable monthly interest only payments at the greater of 9.5% or prime plus 1.25% through September 30, 2011 (9.5% at December 31, 2011) and equal monthly installments of interest and principal from October 1, 2011 to September 30, 2014. | $ | — | $ | 264 | |||
$10.0 million loan payable (as amended) issued in September 2008 and December 2008 in equal $5.0 million installments, with variable monthly interest only payments at 7.0% through September 30, 2011 (7.0% at December 31, 2011) and equal monthly installments of interest and principal monthly installments from October 1, 2011 to September 30, 2014. | — | 8,298 | |||||
Total principal balance | — | 8,562 | |||||
Debt discount | — | (93 | ) | ||||
Total loans payable | $ | — | $ | 8,469 | |||
NOTE 8—COMMITMENTS AND CONTINGENCIES
Operating Leases—The Company’s primary facilities are located in Sunnyvale, California, Shenzhen, China, and Taipei, Taiwan, and are leased under noncancelable operating lease arrangements. Rent expense was $2.9 million, $1.1 million, and $0.7 million for the years ended December 31, 2012, 2011 and 2010, respectively.
Future minimum lease payments under non-cancellable operating leases are as follows:
Years ending December 31, | Amount | ||
(in thousands) | |||
2013 | $ | 4,111 | |
2014 | 3,804 | ||
2015 | 2,923 | ||
2016 | 2,218 | ||
2017 | 2,285 | ||
Thereafter | 12,266 | ||
$ | 27,607 | ||
Litigation—From time to time, the Company may become involved in legal proceedings, claims, and litigation arising in the ordinary course of business. Management is not currently aware of any matters that it expects will have a material adverse effect on the consolidated financial position, results of operations, or cash flows of the Company.
Purchase Commitments—As of December 31, 2012, the Company had current purchase commitments with contract manufacturers for inventory totaling approximately $4.3 million.
Indemnification Agreements—The Company indemnifies its directors for certain events or occurrences, subject to certain limits, while the director is or was serving at the Company’s request in such capacity. The term of the indemnification period is for the director’s term of service. The Company may terminate the indemnification agreements with its directors upon the termination of their services as directors of the Company, but termination will not affect claims for indemnification related to events occurring prior to the effective date of termination. The maximum amount of potential future indemnification is unlimited; however, the Company has a director insurance liability policy that limits its exposure. The Company believes the fair value of these indemnification agreements is minimal. The Company has also entered into customary indemnification agreements with each of its officers.
62
The Company indemnifies its channel partners against certain claims alleging that the Company’s products (excluding custom products and/or custom support) infringe a patent, copyright, trade secret, or trademark, provided that a channel partner promptly notifies the Company in writing of the claim and such channel partner cooperates with the Company and grants the Company the authority to control the defense and any related settlement.
The Company has not recorded any liabilities for these agreements as of December 31, 2012 and 2011.
NOTE 9—REDEEMABLE CONVERTIBLE PREFERRED STOCK AND STOCKHOLDERS’ EQUITY (DEFICIT)
Initial Public Offering
In November 2012, the Company closed its IPO, in which 8,400,000 shares of common stock were sold to the public (inclusive of 7,000,000 shares of common stock sold by the Company). The public offering price of the shares sold in the IPO was $15.00 per share. The total gross proceeds from the offering were $126.0 million. After deducting underwriting discounts and commissions, offering expenses payable by the Company, and net proceeds received by the selling stockholders, the aggregate net proceeds received by the Company totaled approximately $94.0 million, net of unpaid costs of $0.8 million at December 31, 2012.
The Company's Registration Statement on Form S-1 was declared effective by the SEC on November 15, 2012. The close of the public offering occurred on November 20, 2012, when the shares were delivered to the public. In accordance with the redeemable convertible preferred stock and warrant agreements, the instruments converted to common shares and common stock warrants following the closing of a firmly underwritten public offering, which occurred on November 20, 2012.
Redeemable Convertible Preferred Stock
Prior to the closing of the Company's IPO on November 20, 2012, the Company had the following redeemable convertible preferred stock outstanding, all of which were converted to common stock in connection with the initial public offering (in thousands)
November 20, 2012 | December 31, 2011 | ||||||||||||||||||
Redeemable convertible preferred stock: | Shares Authorized | Shares Issued and Outstanding | Carrying Value | Shares Authorized | Shares Issued and Outstanding | Carrying Value | |||||||||||||
Series A-1 | 5,515 | 5,515 | $ | 1,221 | 5,515 | 5,515 | $ | 1,221 | |||||||||||
Series B | 7,194 | 7,194 | 3,496 | 7,194 | 7,194 | 3,496 | |||||||||||||
Series C | 7,996 | 7,835 | 8,960 | 7,996 | 7,835 | 8,960 | |||||||||||||
Series D | 12,560 | 12,560 | 18,188 | 12,560 | 12,560 | 18,188 | |||||||||||||
Series E | 4,258 | 4,205 | 8,729 | 4,258 | 4,121 | 7,465 | |||||||||||||
Series F | 6,086 | 6,082 | 12,252 | 6,086 | 6,060 | 11,927 | |||||||||||||
Series G | 4,600 | 4,590 | 24,883 | — | — | — | |||||||||||||
48,209 | 47,981 | $ | 77,729 | 43,609 | 43,285 | $ | 51,257 | ||||||||||||
The rights, preferences, and privileges of the redeemable convertible preferred stock were as follows:
Dividends—The holders of Series A-1, Series B, Series C, Series D, Series E, Series F and Series G (collectively “Preferred Stock”) redeemable convertible preferred stock were each entitled to noncumulative dividends at the rate of 6% of the original issue price per annum if and when declared by the Board of Directors. Dividends to all Preferred Stock stockholders were to be paid in advance of any distributions to common stockholders. In the event dividends were paid on any share of common stock, an additional dividend would have been paid with respect to all outstanding shares of Preferred Stock equal (on an as-if-converted to common stock basis) to the amount paid for each share of common stock. No dividends were ever declared related to any series of the Company's redeemable convertible preferred stock.
Voting—The holders of a share of redeemable convertible preferred stock were entitled to voting rights equivalent to the number of shares of common stock into which the respective preferred shares were convertible.
Liquidation—In the event of voluntary or involuntary liquidation, before any payment is made to the Company’s common stockholders, the holders of Series A-1, Series B, Series C, Series D, Series E, Series F and Series G redeemable convertible preferred stock were entitled to be paid a liquidation preference of $0.23, $0.49, $1.15, $1.46, $1.82, $1.98 and $5.45 per share, respectively, plus all declared and unpaid dividends. In addition, in the event of a voluntary or involuntary liquidation, the holders of Series A-1, Series B, Series C, and Series D redeemable convertible preferred stock would have received an additional liquidation preference equal to 6% of the original issue price per annum, accrued from the date on which the first share of Series D redeemable convertible preferred stock was issued. The holders of Series E redeemable convertible preferred stock would have received an additional liquidation preference equal to 6% of the original issuance price per annum, accrued from October 5, 2007. The holders of Series F redeemable convertible preferred stock would have received an additional liquidation preference equal to 6% of the original issuance price per annum, accrued from September 2, 2009. The holders of Series G redeemable convertible preferred stock would have received an additional liquidation preference equal to 6% of the original issuance price per annum, accrued from February 3, 2012. If the assets of the Company were insufficient to make payment in full to all preferred stockholders, then the assets or consideration would have been distributed among the preferred stockholders on a pro-rata basis in proportion to the full amounts to which they would otherwise be respectively entitled.
63
Conversion—Each share of Preferred Stock was convertible at the stockholder’s option at any time into the number of shares of common stock that was equal to the original issuance price divided by the appropriate conversion price. The conversion price per share for any Preferred Stock would have been adjusted for certain recapitalizations, stock splits, and combinations. Conversion of all outstanding Preferred Stock was automatic upon: (1) the affirmative election of the holders of at least 60% of the outstanding shares of redeemable convertible preferred stock or (2) the closing of a firmly underwritten public offering pursuant to an effective registration statement under the Securities Act of 1933, as amended, covering the offer and sale of common stock for the Company in which the gross cash proceeds to the Company (before underwriting discounts, commissions, and fees) are at least $40.0 million.
Contingent Redemption—The holders of Preferred Stock had no voluntary rights to redeem shares. A liquidation or winding up of the Company, a greater than 50% change in control, or a sale of substantially all of its assets would constitute a redemption event. Although the Preferred Stock was not mandatorily or redeemable at any point during which the shares were outstanding, a liquidation or winding up of the Company would have constituted a redemption event outside the Company's control. Therefore, all shares of Preferred Stock were presented outside of permanent equity.
Preferred Stock—The Company is authorized to issue 10 million share of $0.001 par value stock. No shares of preferred stock are outstanding as of December 31, 2012.
Common Stock—The Company is authorized to issue 250 million shares of $0.001 par value stock. The holder of each share of common stock has the right to one vote.
Common Stock Reserved for Future Issuance—At December 31, 2012 and 2011, the Company has reserved the following shares of common stock for future issuances in connection with:
December 31, 2012 | December 31, 2011 | ||||
(in thousands) | |||||
Conversion of redeemable convertible preferred stock | — | 43,285 | |||
Warrants to purchase redeemable convertible preferred stock | — | 323 | |||
Warrants to purchase common stock | 296 | 199 | |||
Shares reserved for employee stock purchase plan | 1,500 | — | |||
Stock options outstanding | 24,400 | 17,228 | |||
Stock options reserved for future grants | 6,961 | 164 | |||
Total reserved for future issuance | 33,157 | 61,199 | |||
Stock Option Plans—The Company has two equity incentive plans (the “Plans”): the 2002 Stock Incentive Plan (the “2002 Plan”) and the 2012 Equity Incentive Plan (the “2012 Plan”). Effective January 31, 2012, the Company's board of directors terminated the 2002 Plan. The 2012 Plan is the successor to and continuation of the 2002 Plan. The 2012 Plan was subsequently amended and restated in July 2012 and further amended in September 2012, and approved by the Company's stockholders in October 2012.
The Company's 2012 Plan provides for the granting of stock options, restricted stock awards, restricted stock units, stock appreciation rights, and performance shares to employees, directors, and consultants. Awards granted under the 2012 Plan vest over the periods determined by the board of directors, generally four years, beginning from the vesting commencement date, and expire no more than 10 years from the date of grant.
The maximum number of shares of common stock that may be issued under the Company's 2012 Plan is 32,000,000, which includes shares reserved for issuance under the 2002 Stock Plan at the time the 2012 Plan became effective, and any shares granted under the 2002 Stock Plan that would have otherwise returned to the 2002 Plan. On the first day of each fiscal year, starting with January 1, 2013, the number of shares in the reserve will increase by the lesser of by 5% of the total number of shares of the Company's capital stock outstanding on December 31 of the preceding calendar year, or a lesser number of shares determined by the board of directors. As of December 31, 2012 and 2011, approximately 31.4 million and 17.4 million shares were authorized for issuance under the Plans.
Subject to obtaining any necessary approvals, the Company is in the process of implementing the 2012 Plan in certain foreign jurisdictions, including China, India and the United Kingdom.
Employee Stock Purchase Plan—The Company's 2012 Employee Stock Purchase Plan ("ESPP") was adopted by the board of directors and approved by the stockholders on October 5, 2012 and was effective upon completion of the Company's initial public offering.
Under the Company's Employee Stock Purchase Plan, the Company can grant stock purchase rights to all eligible employees during a one year offering period with purchase dates at the end of each six-month purchase periods. Each offering period will begin on the first trading date on or after May 16 and November 16 of each year. Shares are purchased through employees' payroll deductions, up to a maximum of 15% of employees' compensation for each purchase period, at purchase prices equal to 85% of the lesser of the fair market value of the Company's common stock at the first trading day of the applicable offering period or the purchase date. No participant may purchase more than $25,000 worth of common stock or 2,000 shares of common stock in any one year offering period. The ESPP is compensatory and results in compensation expense.
64
A total of 1,500,000 shares of common stock have been reserved for future issuance under the ESPP. The number of shares of common stock reserved for issuance under the ESPP will increase automatically each year, beginning on January 1, 2013 and continuing through and including January 1, 2022, by the lesser of (i) 2% of the total number of shares of the common stock outstanding on December 31 of the preceding calendar year; (ii) 3,000,000 shares of common stock; or (iii) such lesser number as determined by the board of directors. Shares subject to purchase rights granted under the Company's ESPP that terminate without having been exercised in full will not reduce the number of shares available for issuance under the ESPP.
Subject to obtaining any necessary approvals, the Company is in the process of implementing the ESPP in certain foreign jurisdictions, including China, India and the United Kingdom.
Stock-Based Compensation—The Company uses the Black-Scholes option pricing model to determine the grant date fair value of stock options and ESPP purchases and recognizes stock-based compensation expense on a straight-line basis over the requisite service period. The determination of the fair value on the date of grant is affected by the estimated underlying common stock price, as well as assumptions regarding a number of complex and subjective variables. These variables include expected stock price volatility over the term of the awards, actual and projected employee stock option exercise behaviors, risk-free interest rates, and expected dividends.
The grant date fair value of the Company’s stock options granted to employees for the years ended December 31, 2012, 2011, and 2010, was estimated using the following weighted average assumptions:
Years Ended December 31, | ||||||||
Employee Stock Options: | 2012 | 2011 | 2010 | |||||
Volatility | 69.1 | % | 69.5 | % | 69.9 | % | ||
Expected term (years) | 6.03 | 6.12 | 6.16 | |||||
Risk-free interest rate | 0.98 | % | 1.75 | % | 2.28 | % | ||
Dividend yield | — | — | — | |||||
The grant date fair value of the ESPP purchases for the years ended December 31, 2012, was estimated using the following weighted average assumptions:
Years Ended December 31, | ||||||
ESPP: | 2012 | |||||
Volatility | 70 | % | ||||
Expected term (years) | 0.7 | |||||
Risk-free interest rate | 0.2 | % | ||||
Dividend yield | — | |||||
Dividend Yield—The Company has never declared or paid any cash dividends and does not plan to pay cash dividends in the foreseeable future and, therefore, used an expected dividend yield of zero in the valuation model.
Expected Term—The Company’s expected term represents the period that the Company’s stock-based awards are expected to be outstanding and was calculated as the average of the option vesting and contractual terms, based on the simplified method provided by the Securities and Exchange Commission’s Staff Accounting Bulletin No. 110. The expected term for the ESPP is based on the term of the purchase period.
Risk-Free Interest Rate—The risk-free interest rate is based on the U.S. Treasury zero coupon issues with remaining terms similar to the expected term of the stock option grants.
Volatility—The Company determined the share price volatility factor based on historical volatility of its peer group due to the limited trading history of its common stock.
The following table summarizes the stock-based compensation expense recorded for stock options issued to employees and non-employees:
65
Years Ended December 31, | |||||||||||
2012 | 2011 | 2010 | |||||||||
(in thousands) | |||||||||||
Cost of revenue | $ | 243 | $ | 148 | $ | 82 | |||||
Research and development | 2,409 | 1,055 | 468 | ||||||||
Sales and marketing | 1,787 | 471 | 242 | ||||||||
General and administrative | 4,012 | 594 | 421 | ||||||||
Total stock-based compensation | 8,451 | 2,268 | 1,213 | ||||||||
Tax benefit from stock-based compensation | (2,417 | ) | — | — | |||||||
Total stock-based compensation, net of tax effect | $ | 6,034 | $ | 2,268 | $ | 1,213 | |||||
At December 31, 2012, the total unrecognized stock-based compensation expense related to employee and director options and ESPP was $29.8 million, net of estimated forfeitures. The remaining unamortized expense as of December 31, 2012 will be amortized over a weighted-average period of 2.8 years.
The Company granted stock options for 37,000 and 221,000 shares to non-employees during the years ended December 31, 2012 and 2011, respectively. The fair value of these options granted to non-employees was initially determined on the date of grant using the Black-Scholes option pricing model and is re-measured as the options vest.
66
A summary of the Company’s stock option activity is as follows:
Common Stock Options Outstanding | ||||||||||||||||
Shares Available for Grant | Number of Shares | Weighted Average Exercise Price | Weighted Average Remaining Contractual Life (Years) | Aggregate Intrinsic Value | ||||||||||||
(in thousands, except price and years) | ||||||||||||||||
Balance, December 31, 2011 | 164 | 17,228 | $ | 1.06 | 7.91 | $ | 54,811 | |||||||||
Additional shares reserved for issuance | 14,779 | |||||||||||||||
Granted | (8,306) | 8,306 | 6.25 | |||||||||||||
Options exercised | — | (812) | 0.78 | |||||||||||||
Options forfeited | 322 | (322) | 2.60 | |||||||||||||
Repurchased | 2 | — | — | |||||||||||||
Balance, December 31, 2012 | 6,961 | 24,400 | $ | 2.82 | 7.72 | $ | 480,878 | |||||||||
Options exercisable as of December 31, 2012 | 11,649 | $ | 1.21 | 6.60 | $ | 248,293 | ||||||||||
Options vested and expected to vest as of December 31, 2012 | 23,016 | $ | 2.70 | 7.65 | $ | 456,487 | ||||||||||
The weighted average grant date fair value per share of stock options was approximately $3.91, $1.24 and $0.75 for the years ended December 31, 2012, 2011 and 2010, respectively.
The total intrinsic value of options exercised was approximately $4.8 million, $3.5 million and $0.6 million for the years ended December 31, 2012, 2011 and 2010, respectively. The aggregate intrinsic value represents the difference between the Company's estimated fair value of its common stock, prior to the IPO, or the closing stock price of the Company's common stock, following the IPO, compared to the exercise price of the outstanding, in-the-money options.
The following table summarizes information about stock options outstanding and stock options vested and exercisable at December 31, 2012:
Exercise Price Per Share | Number Outstanding | Weighted- Average Remaining Contractual Life (Years) | Vested and Exercisable | Weighted Average Exercise Price | |||
(in thousands, except price and years) | |||||||
$0.12 - 0.20 | 2,315 | 5.28 | 2,023 | $0.18 | |||
0.43 | 3,796 | 5.24 | 3,714 | 0.43 | |||
0.44 - 1.09 | 3,048 | 7.04 | 2,078 | 0.84 | |||
1.24 - 1.98 | 2,628 | 7.80 | 1,191 | 1.41 | |||
2.01 | 3,858 | 8.37 | 1,506 | 2.01 | |||
2.13 - 4.63 | 1,656 | 8.97 | 312 | 3.18 | |||
5.71 | 5,964 | 9.42 | 818 | 5.71 | |||
7.34 - 15.00 | 1,135 | 9.68 | 7 | 12.42 | |||
24,400 | 7.72 | 11,649 | $1.21 | ||||
67
NOTE 10—PREFERRED AND COMMON STOCK WARRANTS
Preferred Stock Warrants—Prior to the IPO, the Company had outstanding warrants to purchase 322,868 shares of its redeemable convertible preferred stock. The fair value of these warrants was recorded in preferred stock warrant liability in the Company’s consolidated balance sheets and was subject to re-measurement at each balance sheet date, with the change in fair value recognized as a component of other expense, net.
Immediately prior to the IPO, 95,900 shares of Series E and 25,000 shares of Series F redeemable convertible preferred stock warrants were exercised into 84,264 shares of Series E and 21,700 shares of Series F redeemable convertible preferred stock in accordance with the net cashless exercise feature as provided under the original warrant agreements. In connection with the net exercise, the Company re-measured the preferred stock warrant liability as of the date of exercise and recorded an incremental charge of $0.8 million to other expense, net. The Company reclassified approximately $1.6 million from preferred stock warrant liability to preferred stock for the estimated fair value of the warrants on the date of exercise.
Concurrent with the closing of the IPO on November 20, 2012, all shares of outstanding convertible preferred stock warrants converted to common stock warrants, of which 201,968 shares were unexercised. In connection with the conversion of the preferred stock warrants, the Company re-measured the preferred stock warrant liability as of the date of conversion and recorded an incremental charge of $1.1 million to other expense, net. The Company also reclassified approximately $2.3 million from preferred stock warrant liability to additional paid-in capital for the estimated fair value of the warrant on the date of conversion.
The change in the fair value of the convertible preferred stock warrants resulted in a charge of approximately $2.8 million, $0.9 million and $0.0 million during the years ended December 31, 2012, 2011 and 2010, which was included in other expense, net in the consolidated statements of operations. There were no preferred stock warrants outstanding as of December 31, 2012. The fair value of the preferred stock warrant liability was $1.1 million as of December 31, 2011.
Series C Redeemable Convertible Preferred Stock Warrants—In connection with a loan and security agreement with a financial institution in 2006, the Company issued warrants to purchase 160,868 shares of Series C redeemable convertible preferred stock with an exercise price of $1.15 per share. The fair value of these warrants was recorded as a debt discount and was amortized using the effective interest method over the term of the debt. Concurrent with the closing of the IPO on November 20, 2012, 160,868 shares of the Series C convertible preferred stock warrants converted to common stock warrants. In accordance with the warrant agreement, as of the effective date of the IPO, the contractual term of the warrants extended three years.
The Company determined the fair value of the Series C redeemable convertible preferred stock warrants using the Black-Scholes option pricing model as follows:
November 20, | December 31, | ||||||||||
2012 | 2011 | 2010 | |||||||||
Fair value per share | $ | 11.44 | $ | 3.13 | $ | 0.42 | |||||
Contractual term (years) | 0.21 | 1.1 | 2.1 | ||||||||
Volatility rate | 54.95 | % | 76.32 | % | 72.23 | % | |||||
Risk-free interest rate | 0.08 | % | 0.15 | % | 0.71 | % | |||||
Dividend yield | — | — | — | ||||||||
Series D Redeemable Convertible Preferred Stock Warrants—In September 2006, in connection with its Series D redeemable convertible preferred stock financing, the Company issued warrants to purchase 2,397,259 shares of Series D redeemable convertible preferred stock with an exercise price of $1.46 per share. Of the total Series D redeemable convertible preferred stock warrants, 856,165 shares of the Series D redeemable convertible preferred stock warrants vested immediately while the remaining 1,541,094 shares of the Series D redeemable convertible preferred stock warrants vested upon future performance criteria at various dates through September 2010. The performance criteria were not met and all 1,541,094 Series D redeemable convertible preferred stock warrants expired unvested.
In September 2010, the 856,165 shares of Series D redeemable convertible preferred stock warrants were exercised into 231,164 shares of Series D redeemable convertible preferred stock in accordance with the net cashless exercise feature as provided under the original warrant agreement. Accordingly, the Company recorded $0.3 million as an increase to Series D redeemable convertible preferred stock with an offset to additional paid-in capital. In connection with the net exercise, the Company also reclassified approximately $75,000 from preferred stock warrant liability to redeemable convertible preferred stock for the estimated fair value of the warrant on the date of exercise. As of the IPO date, none of the Series D redeemable convertible preferred stock warrants were outstanding and exercisable.
Series E Redeemable Convertible Preferred Stock Warrants—In connection with a September 2008 amendment to the October 2007 loan and security agreement with a financial institution, the Company issued a warrant to purchase 137,000 shares of Series E redeemable convertible preferred stock with an exercise price of $1.82 per share. The fair value of the warrant was recorded as a debt discount and was amortized using the effective interest method over the term of the debt.
Immediately prior to the IPO, 95,900 shares of Series E redeemable convertible preferred stock warrants were exercised into 84,264 shares of Series E redeemable convertible preferred stock in accordance with the net cashless exercise feature as provided under the original warrant agreement.
Concurrent with the closing of the IPO on November 20, 2012, the remaining 41,100 shares of the Series E redeemable convertible preferred stock warrants converted to common stock warrants.
68
The Company determined the fair value of the Series E redeemable convertible preferred stock warrants using the Black-Scholes option pricing model as follows:
November 20, | December 31, | ||||||||||
2012 | 2011 | 2010 | |||||||||
Fair value per share | $ | 11.25 | $ | 3.35 | $ | 0.68 | |||||
Contractual term (years) | 5.9 | 6.8 | 7.8 | ||||||||
Volatility rate | 70.96 | % | 70.83 | % | 70.62 | % | |||||
Risk-free interest rate | 0.88 | % | 1.27 | % | 2.79 | % | |||||
Dividend yield | — | — | — | ||||||||
Series F Redeemable Convertible Preferred Stock Warrants—In connection with a November 2010 amendment to the October 2007 loan and security agreement with a financial institution, the Company issued a warrant to purchase 25,000 shares of Series F redeemable convertible preferred stock with an exercise price of $1.98 per share. The fair value of the warrants was recorded as a debt discount and was amortized using the effective interest method over the term of the debt.
Immediately prior to the IPO, 25,000 shares of Series F redeemable convertible preferred stock warrants were exercised into 21,700 shares of Series F redeemable convertible preferred stock in accordance with the net cashless exercise feature as provided under the original warrant agreement.
The Company determined the fair value of the Series F redeemable convertible preferred stock warrants using the Black-Scholes option pricing model as follows:
December 31, | |||||||
2011 | 2010 | ||||||
Fair value per share | $ | 3.52 | $ | 0.81 | |||
Contractual term (years) | 8.9 | 9.9 | |||||
Volatility rate | 72.26 | % | 77.38 | % | |||
Risk-free interest rate | 1.72 | % | 3.37 | % | |||
Dividend yield | — | — | |||||
Common Stock Warrants—In connection with its September 2011 loan and security agreement with a financial institution, the Company issued a warrant to purchase 48,780 shares of common stock with an exercise price of $2.05 per share. The fair value of these warrants was recorded as a debt discount and was amortized using the effective interest method over the term of the debt.
In connection with its February 2012 Series G financing, the Company issued a warrant to purchase 160,000 shares of common stock with an exercise price of $4.63. The Company has determined that the performance required to vest this warrant will not be met prior to its expiration and therefore no expense was recorded in the financial statements relating to this warrant. At December 31, 2012, the performance criteria were not met and all 160,000 common stock warrants expired unvested.
Immediately prior to the IPO, warrants to purchase 105,000 shares of common stock were exercised into 101,989 shares of common stock in accordance with the net cashless exercise feature as provided under the original warrant agreement.
As of December 31, 2012, 295,748 common stock warrants remained outstanding and exercisable, respectively.
Summary of Common Stock Warrants—At December 31, 2012, the following warrants were issued and outstanding:
Issue Date | Shares Upon Exercise | Exercise Price per Share | Expiration | ||||
(1) | February 2006 | 160,868 | $1.15 | November 2016 | |||
(1) | September 2008 | 41,100 | 1.82 | September 2018 | |||
September 2008 | 45,000 | 0.43 | September 2018 | ||||
September 2011 | 48,780 | 2.05 | September 2021 | ||||
(1) Concurrent with the closing of the IPO, the outstanding convertible preferred stock warrants converted to an equal number of common stock warrants.
69
NOTE 11—EARNINGS PER SHARE
Basic and diluted net income (loss) per common share is presented in conformity with the two-class method required for participating securities. Concurrent with the closing of the IPO on November 20, 2012, all shares of outstanding Preferred Stock automatically converted into 47,981,335 shares of the Company’s common stock. Following the date of the IPO, the two-class method was no longer required as the Company had one class of securities.
Prior to the conversion of the Preferred Stock, holders of Series A-1, Series B, Series C, Series D, Series E, Series F and Series G redeemable convertible preferred stock were each entitled to receive non-cumulative dividends at the annual rate of $0.0136, $0.0294, $0.0690, $0.0876, $0.1092, $0.1188 and $0.3267 per share per annum, respectively, payable prior and in preference to any dividends on any shares of the Company’s common stock. In the event a dividend was paid on common stock, the holders of Preferred Stock were entitled to a proportionate share of any such dividend as if they were holders of common stock (on an as-if converted basis). The holders of the Company’s Preferred Stock did not have a contractual obligation to share in the losses of the Company. The Company considered its Preferred Stock to be participating securities and, in accordance with the two-class method, earnings allocated to Preferred Stock and the related number of outstanding shares of Preferred Stock have been excluded from the computation of basic and diluted net income (loss) per common share.
Under the two-class method, net income (loss) attributable to common stockholders is determined by allocating undistributed earnings, calculated as net income less current period Preferred Stock non-cumulative dividends, between common stock and Preferred Stock. In computing diluted net income (loss) attributable to common stockholders, undistributed earnings are re-allocated to reflect the potential impact of dilutive securities. Basic net income (loss) per common share is computed by dividing the net income (loss) attributable to common stockholders by the weighted-average number of common shares outstanding during the period. Shares of common stock subject to repurchase resulting from the early exercise of employee stock options are considered participating securities and are therefore included in the basic weighted-average common shares outstanding. Diluted net income per share attributable to common stockholders is computed by dividing the net income attributable to common stockholders by the weighted-average number of common shares outstanding, including potential dilutive common shares assuming the dilutive effect of outstanding stock options using the treasury stock method.
Basic net income per share is computed using the weighted-average number of common shares outstanding during the period. Diluted net income per share is computed using the weighted-average number of common shares and, if dilutive, potential common shares outstanding during the period. The Company’s potential common shares consist of the incremental common shares issuable upon the exercise of stock options. The dilutive effect of outstanding stock options is reflected in diluted earnings per share by application of the treasury stock method.
The Company performs an annual assessment for the realizability of excess tax benefits from share based payment awards used in the application of the treasury stock method. At the beginning of 2012, the Company had a full valuation allowance on its deferred tax assets and the excess tax benefits from share based payment awards were excluded from the assumed proceeds under the treasury stock method for the year-ended December 31, 2012.
70
The following table presents the calculation of basic and diluted net income (loss) per share:
Years Ended December 31, | |||||||||||
2012 | 2011 | 2010 | |||||||||
(in thousands, except per share data) | |||||||||||
Basic net income (loss) per share: | |||||||||||
Numerator: | |||||||||||
Net income (loss) | $ | 31,704 | $ | 4,186 | $ | (4,404 | ) | ||||
Less: Undistributed earnings allocated to participating securities | (22,668 | ) | (3,807 | ) | — | ||||||
Net income (loss) attributable to common stockholders, basic and diluted | $ | 9,036 | $ | 379 | $ | (4,404 | ) | ||||
Denominator: | |||||||||||
Weighted-average shares used in computing net income (loss) per share attributable to common stockholders: | |||||||||||
Basic | 24,847 | 15,584 | 14,498 | ||||||||
Weighted-average effect of potentially dilutive shares: | |||||||||||
Employee stock options | 12,788 | 7,451 | |||||||||
Warrants | 94 | 234 | |||||||||
ESPP | 46 | — | |||||||||
Diluted | 37,775 | 23,269 | 14,498 | ||||||||
Net income (loss) per share of common stock: | |||||||||||
Basic | $ | 0.36 | $ | 0.02 | $ | (0.30 | ) | ||||
Diluted | $ | 0.24 | $ | 0.02 | $ | (0.30 | ) | ||||
The following table summarizes the outstanding redeemable convertible preferred stock, employee stock options and warrants that were excluded from the diluted per share calculation because to include them would have been anti-dilutive for the period:
Years Ended December 31, | ||||||||
2012 | 2011 | 2010 | ||||||
(in thousands) | ||||||||
Redeemable convertible preferred stock | — | 43,285 | 43,285 | |||||
Employee stock options | 7,099 | 5,481 | 14,221 | |||||
Warrants | — | — | 473 | |||||
Total | 7,099 | 48,766 | 57,979 | |||||
NOTE 12—INCOME TAXES
The domestic and foreign components of income (loss) before the provision for income taxes for the years ended December 31, 2012, 2011 and 2010 were as follows:
Years Ended December 31, | |||||||||||
2012 | 2011 | 2010 | |||||||||
(in thousands) | |||||||||||
Domestic | $ | 13,235 | $ | 4,149 | $ | (4,440 | ) | ||||
Foreign | 1,231 | 352 | 212 | ||||||||
Total | $ | 14,466 | $ | 4,501 | $ | (4,228 | ) | ||||
71
During the years ended December 31, 2012, 2011 and 2010, the Company’s provision (benefit) for income taxes was as follows:
Years Ended December 31, | |||||||||||
2012 | 2011 | 2010 | |||||||||
(in thousands) | |||||||||||
Current expense: | |||||||||||
Federal | $ | — | $ | — | $ | — | |||||
State | 317 | 65 | 7 | ||||||||
Foreign | 762 | 213 | 169 | ||||||||
1,079 | 278 | 176 | |||||||||
Deferred (benefit) expense: | |||||||||||
Federal | (13,805 | ) | 36 | — | |||||||
State | (4,467 | ) | 1 | — | |||||||
Foreign | (45 | ) | — | — | |||||||
(18,317 | ) | 37 | — | ||||||||
Total tax (benefit) expense | $ | (17,238 | ) | $ | 315 | $ | 176 | ||||
The difference between the income tax provision and the amount computed by applying the statutory federal income tax rate to the income (loss) before income tax before the provision is as follows:
Years Ended December 31, | |||||||||||
2012 | 2011 | 2010 | |||||||||
(in thousands) | |||||||||||
Federal statutory rate | $ | 4,918 | $ | 1,530 | $ | (1,437 | ) | ||||
State taxes, net of federal income tax benefit | 417 | 43 | 5 | ||||||||
Non-deductible expenses | 134 | 74 | 54 | ||||||||
Stock compensation | 701 | 214 | 16 | ||||||||
Preferred stock warrant liability | 966 | 295 | 9 | ||||||||
Tax credits | (884 | ) | (589 | ) | (349 | ) | |||||
Foreign tax rate differential | 273 | 47 | 82 | ||||||||
Other items not individually material | 116 | 50 | 22 | ||||||||
Change in statutory rate | (262 | ) | — | — | |||||||
Change in valuation allowance | (23,617 | ) | (1,349 | ) | 1,774 | ||||||
$ | (17,238 | ) | $ | 315 | $ | 176 | |||||
The Company records deferred tax assets if the realization of such assets is more likely than not to occur in accordance with accounting standards that address income taxes. Significant management judgment is required in determining the period in which the reversal of a valuation allowance should occur. The Company has considered all available evidence, both positive and negative, such as historical levels of income and predictability of future forecasts of taxable income, in determining whether a release of the Company's valuation allowance is required. The Company is also required to forecast future taxable income in accordance with accounting standards that address income taxes to assess the appropriateness of a valuation allowance, which further requires the exercise of significant management judgment. Specifically, the Company evaluated the following criteria when considering the release of its valuation allowance and the related timing of such release:
• | cumulative losses in recent years (three year period ending December 31, 2011); |
• | the history of tax net operating losses in recent years; |
• | predictability of operating results; |
72
• | profitability for a sustained period of time; and |
• | level of profitability on a quarterly basis. |
As of December 31, 2012, the Company had cumulative net income before tax for the three years then ended. A sustained level of profitability for the most recent seven quarters was also achieved. Based on its historical operating performance, as well as the Company’s expectation that its operations will generate sufficient taxable income in future periods to realize the tax benefits associated with the deferred tax assets, the Company has concluded that it was more likely than not that the Company would be able to realize the benefit of the U.S. federal and state deferred tax assets in the future. As a result, the Company reduced the valuation allowance on its net deferred tax assets by $23.6 million during the year ended December 31, 2012.
The Company will continue to assess the need for a valuation allowance on the deferred tax assets by evaluating both positive and negative evidence that may exist on a quarterly basis. Any adjustment to the deferred tax asset valuation allowance would be recorded in the statement of operations for the period that the adjustment is determined to be required. The valuation allowance against deferred tax assets was zero and $23.7 million as of December 31, 2012 and 2011, respectively.
Significant components of the Company’s deferred tax assets are as follows:
As of December 31, | |||||||
2012 | 2011 | ||||||
(in thousands) | |||||||
Deferred tax assets: | |||||||
Accruals and reserves | $ | 4,840 | $ | 2,738 | |||
Tax credits | 4,700 | 3,852 | |||||
Fixed assets and intangibles, other than goodwill | 2,208 | 1,997 | |||||
Net operating losses | 3,490 | 14,023 | |||||
Stock compensation expense | 3,386 | 1,143 | |||||
Total deferred tax assets | 18,624 | 23,753 | |||||
Valuation allowance | — | (23,714 | ) | ||||
Available deferred tax assets | 18,624 | 39 | |||||
Deferred tax liabilities: | |||||||
Other | (355 | ) | (76 | ) | |||
Net deferred tax assets (liabilities) | $ | 18,269 | $ | (37 | ) | ||
As reported: | |||||||
Current deferred tax asset | 9,055 | 231 | |||||
Noncurrent deferred tax assets (liabilities) | 9,214 | (268 | ) | ||||
Net deferred tax assets (liabilities) | $ | 18,269 | $ | (37 | ) | ||
As of December 31, 2012, the Company had net operating loss carryforwards of approximately $11.2 million for federal purposes and $30.9 million for state purposes. If not utilized, these carryforwards will begin to expire in 2025 for federal purposes and 2019 for state purposes.
The Company has research credit carryforwards of approximately $2.4 million for federal purposes and $3.6 million for California purposes. Approximately $0.1 million of California research credits relate to stock option deductions in excess of book expense, the tax effect of which would be a credit to additional-paid-in-capital if realized. If not utilized, the federal carryforwards will begin to expire in 2024. The California credit carryforwards will not expire.
On January 2, 2013, President Obama signed into law the American Taxpayer Relief Act of 2012. Part of this law reinstated the research and development credit retroactively for 2012. As this law was signed after the year end of December 31, 2012, the associated tax benefit will not be recorded until the first quarter of 2013. The projected federal tax benefit associated with the 2012 credit is $0.9 million.
The Tax Reform Act of 1986 limits the use of net operating loss and tax credit carryforwards in certain situations where stock ownership changes occur. In the event the Company has had a change in ownership, the future utilization of the Company’s operating loss and tax credit carryforwards could be limited.
73
As a result of certain realization requirements of the accounting guidance for stock-based compensation, the table of deferred tax assets and liabilities shown above does not include certain deferred tax assets at December 31, 2012 and 2011 that arose directly from (or the use of which was postponed by) tax deductions related to equity compensation in excess of compensation recognized for financial reporting. Approximately $6.2 million of federal net operating losses and $1.0 million of state net operating losses relate to stock compensation deductions in excess of book expense, the tax effect of which would be to credit additional-paid-in-capital if realized. The Company uses the accounting guidance for ordering under ASC Topic 740 Income Taxes, for the purpose of determining when excess tax benefits have been realized.
The undistributed earnings from the Company’s foreign subsidiaries are not subject to a United States tax provision because it is management’s intention to permanently reinvest such undistributed earnings outside of the United States. The Company evaluates its circumstances and reassesses this determination on a periodic basis. As of December 31, 2012, the determination of the unrecorded deferred tax liability related to these earnings was immaterial. If circumstances change and it becomes apparent that some or all of the undistributed earnings of the Company’s foreign subsidiaries will be remitted in the foreseeable future, the Company will be required to recognize a deferred tax liability on those amounts.
The Company maintains liabilities for uncertain tax positions. These liabilities involve considerable judgment and estimation and are continuously monitored by management based on the best information available, including changes in tax regulations, the outcome of relevant court cases, and other information. The Company recognizes potential accrued interest and penalties related to unrecognized tax benefits as income tax expense. As of December 31, 2012, 2011 and 2010, the Company’s total amount of unrecognized tax benefit was approximately $0.8 million, $0.9 million and $0.7 million, respectively. These amounts are primarily related to the Company’s research and development tax credits and tax accruals.
As of December 31, 2012, the Company’s total amount of unrecognized tax benefit was approximately $0.8 million of which only $0.1 million impacted the effective tax rate. The Company does not expect its unrecognized tax benefits to change materially over the next 12 months. If reversed, the entire $0.8 million will impact the effective tax rate.
A reconciliation of the beginning and ending balances of the total amounts of unrecognized tax benefits for the year ended December 31, 2012, 2011 and 2010 is as follows:
As of December 31, | |||||||||||
2012 | 2011 | 2010 | |||||||||
(in thousands) | |||||||||||
Beginning balance | $ | 937 | $ | 675 | $ | 517 | |||||
Increases related to current year tax positions | 218 | 254 | 158 | ||||||||
Increases related to prior year tax positions | — | 8 | — | ||||||||
Reductions related to prior year tax positions | (319 | ) | — | — | |||||||
Ending balance | $ | 836 | $ | 937 | $ | 675 | |||||
During the year ended December 31, 2012 and cumulatively, the Company recognized an immaterial amount of interest and penalties associated with unrecognized tax benefits.
The Company files income tax returns with the United States federal government, various states and certain foreign jurisdictions. The Company’s tax years ended December 31, 2002 through December 31, 2012 remain open to audit for federal and California purposes. These years are open due to net operating losses and tax credits unutilized from such years. The Company’s tax years ended December 31, 2008 through December 31, 2012 remain open to audits for its foreign subsidiaries.
NOTE 13—EMPLOYEE SAVINGS AND RETIREMENT PLAN
The Company sponsors a defined contribution plan under Internal Revenue Service Code 401(k) (the “401(k) Plan”). Most United States employees are eligible to participate following the start of their employment, at the beginning of each calendar month. Employees may contribute up to the lesser of 100% of their current compensation to the 401(k) Plan or an amount up to a statutorily prescribed annual limit. The Company does not match employee contributions to the 401(k) Plan.
74
NOTE 14—SEGMENT INFORMATION
The Company operates in one industry segment selling access points and controllers along with related software and services.
Operating segments are defined as components of an enterprise about which separate financial information is available that is evaluated regularly by the chief operating decision maker, or decision making group, in deciding how to allocate resources and in assessing performance. The Company’s chief operating decision maker is its chief executive officer. The Company’s chief executive officer reviews financial information presented on a consolidated basis for purposes of allocating resources and evaluating financial performance. The Company has one business activity, and there are no segment managers who are held accountable for operations, operating results and plans for products or components below the consolidated unit level. Accordingly, the Company reports as a single operating segment. The Company and its chief executive officer evaluate performance based primarily on revenue in the geographic locations in which the Company operates. Revenue is attributed by geographic location based on the bill-to location of the Company’s customers.
The following presents total revenue by geographic region:
Years Ended December 31, | |||||||||||
2012 | 2011 | 2010 | |||||||||
(in thousands) | |||||||||||
Americas: | |||||||||||
United States | $ | 91,597 | $ | 42,551 | $ | 22,443 | |||||
Other Americas | 5,135 | 2,603 | 1,595 | ||||||||
Total Americas | 96,732 | 45,154 | 24,038 | ||||||||
APAC: | |||||||||||
India | 7,974 | 5,058 | 11,705 | ||||||||
Japan | 27,462 | 15,295 | 107 | ||||||||
Other APAC | 33,194 | 21,305 | 15,673 | ||||||||
Total APAC | 68,630 | 41,658 | 27,485 | ||||||||
EMEA | 49,291 | 33,211 | 23,966 | ||||||||
Total revenues | $ | 214,653 | $ | 120,023 | $ | 75,489 | |||||
As of December 31, 2012, the Company has property and equipment, net of $7.3 million, $1.5 million and $0.2 million located in the United States, APAC, and EMEA, respectively.
75
ITEM 9. CHANGES IN AND DISAGREEMENTS WITH ACCOUNTANTS ON ACCOUNTING AND FINANCIAL DISCLOSURE
None.
ITEM 9A. CONTROLS AND PROCEDURES
Evaluation of Disclosure Controls and Procedures
Our management is responsible for establishing and maintaining adequate internal control over financial reporting. Management, with the participation of our chief executive officer and our chief financial officer, evaluated the effectiveness of our disclosure controls and procedures as of December 31, 2012. The term “disclosure controls and procedures,” as defined in Rules 13a-15(e) and 15d-15(e) under the Exchange Act, means controls and other procedures of a company that are designed to ensure that information required to be disclosed by a company in the reports that it files or submits under the Exchange Act is recorded, processed, summarized and reported, within the time periods specified in the SEC's rules and forms. Disclosure controls and procedures include, without limitation, controls and procedures designed to ensure that information required to be disclosed by a company in the reports that it files or submits under the Exchange Act is accumulated and communicated to the company's management, including its principal executive and principal financial officers, as appropriate to allow timely decisions regarding required disclosure. Management recognizes that any controls and procedures, no matter how well designed and operated, can provide only reasonable assurance of achieving their objectives, and management necessarily applies its judgment in evaluating the cost-benefit relationship of possible controls and procedures. Based on the evaluation of our disclosure controls and procedures as of December 31, 2012, our chief executive officer and chief financial officer concluded that, as of such date, our disclosure controls and procedures were effective at the reasonable assurance level.
Management's Annual Report on Internal Control Over Financial Reporting
This annual report does not include a report of management's assessment regarding internal control over financial reporting or an attestation report of our registered public accounting firm due to a transition period established by rules of the SEC for newly public companies.
Changes in Internal Control over Financial Reporting
There were no changes in our internal control over financial reporting identified in connection with the evaluation required by Rule 13a-15(d) and 15d-15(d) of the Exchange Act that occurred during the quarter ended December 31, 2012 that have materially affected, or are reasonably likely to materially affect, our internal control over financial reporting.
ITEM 9B. OTHER INFORMATION
Executive Compensation
On February 28, 2013 and March 4, 2013, the Compensation Committee of the Board of Directors and the Board of Directors of Ruckus Wireless, Inc. (the “Company”), respectively, approved the payment of cash bonuses to certain of our employees, including our named executive officers (as defined in Item 402(a)(3) of Regulation S-K, promulgated by the Securities and Exchange Commission).
The Compensation Committee and, with respect to the Chief Executive Officer, the Board of Directors, annually evaluates the performance, and determines the compensation of the Company's executive officers based on an assessment of the individual's performance, corporate performance and relative compensation for competitive positions in similar companies. Each participant was eligible to receive a cash bonus up to an amount based on the level of achievement of certain corporate and individual objectives. The bonus payment amounts approved by the Compensation Committee and the Board of Directors were based on their determination of the degree to which such corporate and individual objectives were achieved, and were as follows for each of our named executive officers:
Named Executive Officer | Total Bonus Amount | ||
Selina Y. Lo President and Chief Executive Officer | $ | 240,000 | |
Seamus Hennessy Chief Financial Officer | 180,000 | ||
Barton Burstein Senior Vice President of Field Operations and Business Development | 120,000 | ||
The cash bonus payments are expected to be made on March 15, 2013.
76
2013 Bonus Program
On February 28, 2013, the Compensation Committee approved the Company's 2013 bonus program. The 2013 bonus program provides our executive officers and other eligible employees the opportunity to earn cash bonuses based on the level of achievement by us of certain corporate objectives (the “Corporate Objectives”) and by each participant other than our Chief Executive Officer, of certain individual objectives, from January 1, 2013 through December 31, 2013.
The Compensation Committee has approved Corporate Objectives, related to revenue and gross margin targets assigned a weighting to each objective, and expects to approve the individual objectives of the executive officers based on the recommendations of the Chief Executive Officer. The individual objectives of non-executive participants will be determined by each participant's supervisor.
Each eligible participant in the 2013 bonus program may receive a cash bonus in an amount up to a specified percentage of his or her eligible 2013 earnings (the “Bonus Targets”), if Corporate Objectives and individual objectives are achieved at the target level. If Corporate Objectives and individual objectives are achieved at greater than the target level, an eligible participant may receive a cash bonus of up to 125% of his or her Bonus Target. The Compensation Committee recommended a Bonus Target for our Chief Executive officer of 75%. Our Chief Executive Officer requested a reduced target for 2013 to be more aligned with the rest of the employee population. As a result, the Board of Directors approved a reduced Bonus Target for 2013 for the Chief Executive Officer of 50%. The Bonus Targets for each of our named executive officers are as follows:
Named Executive Officer | Bonus Target Percentage | |
Selina Y. Lo President and Chief Executive Officer | 50% | |
Seamus Hennessy Chief Financial Officer | 35% | |
Barton Burstein Senior Vice President of Field Operations and Business Development | 35% | |
Severance Benefit Plan
On March 4, 2013, upon the recommendation of the Compensation Committee, the Board of Directors adopted a Severance Benefit Plan (the “Plan”), pursuant to which selected current and future employees of the Company will be eligible for severance benefits under certain circumstances.
Severance Absent a Change in Control. Under the Plan, if a participating individual is involuntarily terminated without cause, as defined in the Plan, absent a qualifying change in control, then he or she will be entitled to receive (a) cash severance in a lump sum amount equal to his or her monthly base salary multiplied by the number of months in his or her participation notice under the Plan, and (b) continuation of his or her current health insurance coverage, or payment of the premiums for such coverage, for up to the number of months specified in his or her participation notice. Selina Lo, our Chief Executive Officer, will be entitled to receive 12 months of such benefits, and the other named executive officers will be entitled to receive 6 months, subject in all cases to their acceptance of the terms of the participation notice and execution of a release agreement.
Severance in Connection with a Change in Control. In the case of a change in control, as defined in the Plan, if a participating individual is terminated without cause or constructively terminated, as defined in the Plan, either during the three months before or in the year after a change in control, then he or she will be entitled to receive (a) cash severance in a lump sum amount equal to his or her monthly base salary multiplied by the number of months specified in his or her participation notice under the Plan, (b) if specified in his or her participation notice under the Plan, additional cash severance in a lump sum amount equal to his or her monthly bonus target multiplied by the number of months specified in his or her participation notice under the Plan, (c) continuation of his or her current health insurance coverage, or payment of the premiums for such coverage, for up to the number of months specified in his or her participation notice under the Plan, and (d) accelerated vesting of then outstanding compensatory equity awards as to the percentage of unvested shares per equity award specified in his or her participation notice. The named executive officers will be entitled to 12 months of such change in control benefits, and 100% vesting acceleration, subject in all cases to their acceptance of the terms of the participation notice and execution of a release agreement.
General. If accepted by a participating individual, the Plan supersedes any severance benefits that he or she would have been entitled to under any pre-existing agreement between the individual and Ruckus. Unless terminated sooner, the Plan will automatically terminate on the third annual anniversary of its adoption.
This description of the Severance Plan is qualified in its entirety by reference to the full text of the plan, filed as Exhibit 10.18 to this Annual Report on Form 10-K and incorporated herein by reference.
77
ITEM 10. DIRECTORS, EXECUTIVE OFFICERS, AND CORPORATE GOVERNANCE
The information required by this item is incorporated by reference to our Proxy Statement for our 2013 Annual Meeting of Stockholders to be filed with the SEC within 120 days after the end of the fiscal year ended December 31, 2012.
Code of Conduct
We have adopted a Code of Business Conduct which applies to all of our directors, officers and employees. A copy of our Code of Business Conduct & Ethics can be found on our website (www.ruckuswireless.com) under “Corporate Governance.” The contents of our website are not a part of this report.
In addition, we intend to promptly disclose the nature of any amendment to, or waiver from, our Code of Business Conduct that applies to our principal executive officer, principal financial officer, principal accounting officer or persons performing similar functions on our website in the future.
ITEM 11. EXECUTIVE COMPENSATION
The information required by this item is incorporated by reference to our Proxy Statement for our 2013 Annual Meeting of Stockholders to be filed with the SEC within 120 days after the end of the fiscal year ended December 31, 2012.
ITEM 12. SECURITY OWNERSHIP OF CERTAIN BENEFICIAL OWNERS AND MANAGEMENT AND RELATED STOCKHOLDER MATTERS
The information required by this item is incorporated by reference to our Proxy Statement for our 2013 Annual Meeting of Stockholders to be filed with the SEC within 120 days after the end of the fiscal year ended December 31, 2012.
ITEM 13. CERTAIN RELATIONSHIPS AND RELATED TRANSACTIONS, AND DIRECTOR INDEPENDENCE
The information required by this item is incorporated by reference to our Proxy Statement for our 2013 Annual Meeting of Stockholders to be filed with the SEC within 120 days after the end of the fiscal year ended December 31, 2012.
ITEM 14. PRINCIPAL ACCOUNTANT FEES AND SERVICES
The information required by this item is incorporated by reference to our Proxy Statement for our 2013 Annual Meeting of Stockholders to be filed with the SEC within 120 days after the end of the fiscal year ended December 31, 2012.
78
PART IV
ITEM 15. EXHIBITS AND FINANCIAL STATEMENT SCHEDULES
1. Consolidated Financial Statements:
Our Consolidated Financial Statements are listed in the “Index to Consolidated Financial Statements” Under Part II, Item 8 of this report.
2. Financial Statement Schedules:
All financial statement schedules have been omitted because they are not applicable or the required information is shown in the Consolidated Financial Statements or Notes thereto
3. Exhibits:
The documents listed in the Exhibit Index of this report are incorporated by reference or are filed with this report, in each case as indicated therein (numbered in accordance with Item 601 of Regulation S-K).
SIGNATURES
Pursuant to the requirements of Section 13 or 15(d) of the Securities Act of 1933, the Registrant has duly caused this report to be signed on its behalf by the undersigned, thereunto duly authorized, in the City of Sunnyvale, State of California on the 5th day of March, 2013.
RUCKUS WIRELESS, INC. | ||
By: | /s/ Selina Y. Lo | |
Selina Y. Lo | ||
President and Chief Executive Officer | ||
79
Power of Attorney
KNOW ALL PERSONS BY THESE PRESENTS, that each person whose signature appears below constitutes and appoints Selina Y. Lo and Seamus Hennessy, and each of them, as his true and lawful attorneys-in-fact and agents, each with the full power of substitution, for him and in his name, place or stead, in any and all capacities, to sign any and all amendments to this Annual Report on Form 10-K, and to file the same, with exhibits thereto and other documents in connection therewith, with the Securities and Exchange Commission, granting unto said attorneys-in-fact and agents, and each of them, full power and authority to do and perform each and every act and thing requisite and necessary to be done in and about the premises, as fully to all intents and purposes as he might or could do in person, hereby ratifying and confirming all that said attorneys-in-fact and agents, or their, his or her substitute or substitutes, may lawfully do or cause to be done by virtue hereof.
Pursuant to the requirements of the Securities Act of 1933, this report has been signed by the following persons in the capacities and on the dates indicated:
Signatures | Title | Date | ||
/s/ Selina Y. Lo Selina Y. Lo | President, Chief Executive Officer and Director (Principal Executive Officer) | March 5, 2013 | ||
/s/ Seamus Hennessy Seamus Hennessy | Chief Financial Officer (Principal Financial and Accounting Officer) | March 5, 2013 | ||
/s/ William Kish William Kish | Chief Technology Officer and Director | March 5, 2013 | ||
/s/ Georges Antoun Georges Antoun | Director | March 5, 2013 | ||
/s/ Gaurav Garg Gaurav Garg | Director | March 5, 2013 | ||
/s/ James J. Goetz James J. Goetz | Director | March 5, 2013 | ||
/s/ Stewart Grierson Stewart Grierson | Director | March 5, 2013 | ||
/s/ Mohan Gyani Mohan Gyani | Director | March 5, 2013 | ||
/s/ Richard Lynch Richard Lynch | Director | March 5, 2013 | ||
80
EXHIBIT INDEX
Exhibit Number | Description of Document | |
3.1 | (1) | Amended and Restated Certificate of Incorporation of the Company. |
3.2 | (2) | Bylaws of the Registrant. |
4.1 | (2) | Sixth Amended and Restated Investor Rights Agreement, dated February 3, 2012, between the Company and the investors named therein. |
10.1+ | (2) | Ruckus Wireless, Inc. 2002 Stock Plan, as amended. |
10.2+ | (2) | Form of Option Agreement and Option Grant Notice for Ruckus Wireless, Inc. 2002 Stock Plan. |
10.3+ | (2) | Ruckus Wireless, Inc. Amended & Restated 2012 Equity Incentive Plan, as amended. |
10.4+ | (2) | Form of Option Agreement and Option Grant Notice for Ruckus Wireless, Inc. Amended & Restated 2012 Equity Incentive Plan. |
10.5+ | (2) | Ruckus Wireless, Inc. 2012 Employee Stock Purchase Plan. |
10.6+ | (2) | Form of Indemnity Agreement entered into between the Company and each of its directors and its executive officers. |
10.7 | (2) | Lease Agreement, dated April 1, 2006, between the Company and John Arrillaga Survivor’s Trust and Richard T. Perry Separate Property Trust. |
10.8 | (2) | First Amendment to Lease Agreement, dated September 2, 2009, between the Company and Silicon Valley CA-I, LLC. |
10.9 | (2) | Second Amendment to Lease Agreement, dated April 8, 2011, between the Company and Silicon Valley CA-I, LLC. |
10.10 | (2) | Lease Agreement, dated December 17, 2010, between the Company and The Irvine Company LLC. |
10.11 | (2) | Lease Agreement, dated October 31, 2011, between the Company and Sequoia M&P, LLC. |
10.12 | (2) | First Amendment to Lease Agreement, dated November 1, 2011, between the Company and Sequoia M&P, LLC. |
10.13 | (2) | Lease Agreement, dated March 16, 2012, between the Company and RP/Presidio Java Owner, L.L.C. |
10.14+ | (2) | Amended and Restated Employment Agreement, dated December 21, 2009, between the Company and Selina Y. Lo. |
10.15+ | (2) | Amended and Restated Employment Agreement, dated December 21, 2009, between the Company and Seamus Hennessy. |
10.16+ | (2) | Amended and Restated Employment Agreement, dated December 21, 2009, between the Company and Bart Burstein. |
10.17+ | (2) | Hardware Access Layer Technology License Agreement, dated August 23, 2004, between the Company and Atheros Communications, Inc. |
10.18+ | Ruckus Wireless, Inc. Severance Benefit Plan. | |
21.1 | List of subsidiaries. | |
23.1 | Consent of Deloitte & Touche LLP, Independent Registered Public Accounting Firm. | |
24.1 | Power of Attorney (included in signature page). | |
81
31.1 | Certification of the Chief Executive Officer of the Company pursuant to rule 13a-14 under the Securities Exchange Act of 1934. | |
31.2 | Certification of the Chief Financial Officer of the Company pursuant to rule 13a-14 under the Securities Exchange Act of 1934. | |
32.1 | (3) | Certification of the Chief Executive Officer and Chief Financial Officer of the Company pursuant to18 U.S.C. Section 1350 as Adopted Pursuant to Section 906 of the Sarbanes-Oxley Act of 2002. |
+ | Indicates a management contract or compensatory plan. |
(1) | Previously filed as the same numbered exhibit to the Company's Current Report on Form 8-K, filed with the Commission on November 20, 2012, and incorporated herein by reference. |
(2) | Previously filed as an exhibit to the Company's Registration Statement on Form S-1, as amended (File No. 333-184309), filed with the Commission on October 5, 2012, and incorporated herein by reference. |
(3) | In accordance with Item 601(b)(32)(ii) of Regulation S-K and SEC Release Nos. 33-8238 and 34-47986, Final Rule; Management's Reports on Internal Control over Financial Reporting and Certification of Disclosure in Exchange Act Periodic Reports, the Certification furnished in Exhibit 32.1 hereto is deemed to accompany this Form 10-K and will not be filed for purposes of Section 18 of the Exchange Act. Such certification will not be deemed incorporated by reference into any filing under the Securities Act or the Exchange Act, except to the extent that the registrant specifically incorporates it by reference. |
82