Attached files
| file | filename |
|---|---|
| EX-10.12 - 2016 EXECUTIVE BONUS PROGRAM - RUCKUS WIRELESS INC | exhibit_10x12x2016xexecuti.htm |
| EX-23.1 - CONESENT OF DELOITTE & TOUCHE LLP - RUCKUS WIRELESS INC | exhibit23_1xconsentxofxdt1.htm |
| EX-31.1 - CERTIFICATION OF THE CEO - RUCKUS WIRELESS INC | exhibit31_1xceox2015.htm |
| EX-31.2 - CERTIFICATION OF THE CFO - RUCKUS WIRELESS INC | exhibit31_2xcfox2015.htm |
| EX-32.1 - CERTIFICATION OF THE CEO & CFO PURSUANT TO 18 U.S.C. SECTION 1350 - RUCKUS WIRELESS INC | exhibit32_1xceo-cfox2015.htm |
| EX-10.11 - 2015 EXECUTIVE BONUS PROGRAM - RUCKUS WIRELESS INC | exhibit_10x11x2015xexecuti.htm |
| EX-21.1 - LIST OF SUBSIDIARIES OF RUCKUS WIRELESS, INC. - RUCKUS WIRELESS INC | exhibit_21x1xlistxofxsubsi.htm |
UNITED STATES SECURITIES AND EXCHANGE COMMISSION Washington, D.C. 20549 | |
Form 10-K
x ANNUAL REPORT PURSUANT TO SECTION 13 OR 15(d) OF THE SECURITIES EXCHANGE ACT OF 1934
For the fiscal year ended December 31, 2015
o TRANSITION REPORT PURSUANT TO SECTION 13 OR 15(d) OF THE SECURITIES EXCHANGE ACT OF 1934
For the transition period from to
Commission file number: 001-35734
Ruckus Wireless, Inc. |
(Exact name of registrant as specified in its charter) |
Delaware | 54-2072041 | |||
(State or other jurisdiction of incorporation or organization) | (I.R.S. Employer Identification Number) | |||
350 West Java Drive
Sunnyvale, California 94089
(650) 265-4200
(Address, including zip code, and telephone number, including area code, of registrant's principal executive offices) |
Securities registered pursuant to Section 12(b) of the Act:
Title of Each Class | Name of Exchange on Which Registered | |
Common Stock, par value $0.001 per share | New York Stock Exchange | |
Securities registered pursuant to Section 12(g) of the Act:
None
Indicate by check mark if the registrant is a well-known seasoned issuer, as defined in Rule 405 of the Securities Act. Yes x No o
Indicate by check mark if the registrant is not required to file reports pursuant to Section 13 or Section 15(d) of the Securities Exchange Act of 1934 (the “Exchange Act”). Yes o No x
Indicate by check mark whether the registrant: (1) has filed all reports required to be filed by Section 13 or 15(d) of the Exchange Act during the preceding 12 months (or for such shorter period that the registrant was required to file such reports), and (2) has been subject to such filing requirements for the past 90 days. Yes x No ¨
Indicate by check mark whether the registrant has submitted electronically and posted on its corporate Web site, if any, every Interactive Data File required to be submitted and posted pursuant to Rule 405 of Regulation S-T (§232.405 of this chapter) during the preceding 12 months (or for such shorter period that the registrant was required to submit and post such files). Yes x No o
Indicate by a check mark if disclosure of delinquent filers pursuant to Item 405 of Regulation S-K (§229.405 of this chapter) is not contained herein, and will not be contained, to the best of registrant's knowledge, in definitive proxy or information statements incorporated by reference in Part III of this Form 10-K or any amendment to this Form 10-K. x
Indicate by check mark whether the registrant is a large accelerated filer, an accelerated filer, a non-accelerated filer, or a smaller reporting company. See the definitions of “large accelerated filer,” “accelerated filer” and “smaller reporting company” in Rule 12b-2 of the Exchange Act.
Large accelerated filer | x | Accelerated filer | ¨ |
Non-accelerated filer | ¨ (Do not check if a smaller reporting company) | Smaller reporting company | ¨ |
Indicate by check mark whether the registrant is a shell company (as defined in Rule 12b-2 of the Exchange Act). Yes o No x
The aggregate market value of the registrant's common stock held by non-affiliates of the registrant as of June 30, 2015 was approximately $860 million, based upon the closing sale price of such stock on the New York Stock Exchange. For purposes of this disclosure, shares of common stock held or controlled by executive officers and directors of the registrant and by persons who hold more than 5% of the outstanding shares of common stock have been treated as shares held by affiliates. However, such treatment should not be construed as an admission that any such person is an “affiliate” of the registrant. The registrant has no non-voting common equity.
On February 17, 2016, 89,722,741 shares of the registrant's common stock, $0.001 par value, were outstanding.
DOCUMENTS INCORPORATED BY REFERENCE |
Portions of the information called for by Part III of this Form 10-K, to the extent not set forth herein, are hereby incorporated by reference from the definitive proxy statement relating to our 2016 annual meeting of stockholders, which will be filed with the Securities and Exchange Commission not later than 120 days after December 31, 2015.
TABLE OF CONTENTS
PART I | Page | |
PART II | ||
PART III | ||
PART IV | ||
“Ruckus Wireless,” the Ruckus logos and other trademarks or service marks of Ruckus Wireless, Inc. appearing in this Annual Report on Form 10-K are the property of Ruckus Wireless, Inc. Trade names, trademarks and service marks of other companies appearing in this report are the property of their respective holders.
1
SPECIAL NOTE REGARDING FORWARD-LOOKING STATEMENTS
This Annual Report on Form 10-K, including the sections entitled “Business,” “Risk Factors,” and “Management's Discussion and Analysis of Financial Condition and Results of Operations,” contains forward-looking statements within the meaning of Section 27A of the Securities Act of 1933, as amended, and Section 21E of the Securities Exchange Act of 1934, as amended. The words “believe,” “will,” “may,” “estimate,” “continue,” “anticipate,” “intend,” “should,” “plan,” “expect,” “predict,” “could,” “potentially” and similar expressions that convey uncertainty of future events or outcomes are intended to identify forward-looking statements.
These forward-looking statements include, but are not limited to, statements concerning the following:
• | our ability to predict our revenue, operating results and gross margin accurately; |
• | our ability to maintain an adequate rate of revenue growth and remain profitable; |
• | the length and unpredictability of our sales cycles with service provider end customers; |
• | any potential loss of or reductions in orders from our larger customers; |
• | the effects of increased competition in our market; |
• | our ability to continue to enhance and broaden our product offering; |
• | our ability to maintain, protect and enhance our brand; |
• | our ability to effectively manage our growth; |
• | our ability to maintain effective internal controls; |
• | the quality of our products and services; |
• | our ability to continue to build and enhance relationships with channel partners; |
• | the attraction and retention of qualified employees and key personnel; |
• | our ability to sell our products and effectively expand internationally; |
• | our ability to protect our intellectual property; |
• | claims that we infringe intellectual property rights of others; and |
• | other risk factors included under the section titled “Risk Factors.” |
These forward-looking statements are subject to a number of risks, uncertainties, and assumptions, including those described in “Risk Factors” included in Part I, Item 1A and elsewhere in this report. Moreover, we operate in a very competitive and rapidly changing environment, and new risks emerge from time to time. It is not possible for our management to predict all risks, nor can we assess the impact of all factors on our business or the extent to which any factor, or a combination of factors, may cause actual results to differ materially from those contained in any forward-looking statements we may make. In light of these risks, uncertainties, and assumptions, the forward-looking events and circumstances discussed in this report may not occur, and actual results could differ materially and adversely from those anticipated or implied in the forward-looking statements. We undertake no obligation to revise or publicly release the results of any revision to these forward-looking statements, except as required by law. Given these risks and uncertainties, readers are cautioned not to place undue reliance on such forward-looking statements.
2
PART I
ITEM 1. BUSINESS
Overview
Ruckus Wireless, Inc. (“Ruckus” or “we” or “the Company”) is a global supplier of advanced Wi-Fi solutions. Our solutions, which we call Smart Wi-Fi, are used by service providers and enterprises to solve a range of network capacity, coverage and reliability challenges associated with increasing wireless traffic demands created by the growth in the number of users equipped with more powerful smart wireless devices using increasingly data rich applications and services. We market and sell our products and technology directly and indirectly through a vast network of channel partners to a variety of service providers and enterprises around the world. Our Smart Wi-Fi solutions offer features and functionality such as enhanced reliability, consistent performance, extended range and massive scalability. Our products include high capacity controllers, indoor and outdoor access points, wireless bridges, controller software platforms, software management solutions including reporting and analytics and unique Wi-Fi-related cloud services, such as location-based positioning, and certificate-based security and on-boarding of Wi-Fi devices. These hardware and software products and services incorporate various elements of our proprietary technologies, including Smart Radio, SmartCast, SmartMesh and Smart Scaling, to enable high performance in a variety of challenging operating environments.
Technology
Our core Smart Wi-Fi technologies include:
Smart Radio
Our Smart Radio is a set of advanced hardware and software capabilities that automatically adjust Wi-Fi signals to constantly changing environmental conditions. This adaptability results in greater wireless coverage, reliability and higher levels of system performance, all without any manual tuning. A primary component of Smart Radio technology is BeamFlex, a patented smart antenna system that makes Wi-Fi signals stronger by focusing radio frequency energy where it is needed while dynamically adjusting signals in directions that yield the highest possible throughput for each receiving device. An extension of BeamFlex, known as BeamFlex+, automatically adapts Wi-Fi signals to the changing orientation of handheld devices through the use of polarization diversity with maximal radio combining. This enables Ruckus Smart Wi-Fi access points with BeamFlex+ to provide better reception for hard to hear clients and more consistent performance as clients constantly change orientation. Another component to the Smart Radio technology is ChannelFly, a performance optimization capability that automatically determines which radio frequencies or channels will deliver the greatest network throughput based on actual observed capacity, a key benefit for high-density, noisy Wi-Fi environments. ChannelFly is a different approach to dynamic and predictive capacity management that optimizes radio frequency (“RF”) channel selection using capacity averages across all channels. Specialized algorithms select the best channel based on historical values. Traffic loads are assessed across all available channels to determine which RF channels will yield the highest throughput at any given time.
SmartCast
Our SmartCast, which we also call Smart QoS, is a sophisticated software quality of service technology that manages traffic load to enhance the user experience. SmartCast was developed to handle the increasing volumes of latency-sensitive multimedia traffic such as voice over IP and streaming IP-based video traffic. SmartCast automatically prioritizes different traffic types through intelligent heuristics that classify, prioritize and schedule traffic for transmission over our advanced antenna arrays. SmartCast employs advanced queuing techniques and dedicated software queues on a per device basis to ensure fairness and optimize overall system performance. SmartCast also includes advanced Wi-Fi techniques such as band steering, rate limiting, client load balancing and airtime fairness, all of which operate automatically and transparently to our end customers and their users.
SmartMesh
Our SmartMesh is software technology that uses advanced self-organizing network principles to create highly resilient, high-speed Wi-Fi backbone links between Ruckus Smart Wi-Fi access points. SmartMesh simplifies the deployment of both service provider and enterprise wireless networks by reducing cumbersome radio planning and costly cabling needed to reliably connect every Wi-Fi access point. SmartMesh automatically establishes wireless connections between individual access points using patented smart antenna technology and self-heals in the event of a failed link. SmartMesh gives service providers the ability to lower capital expenditures typically associated with traditional fixed-line backhaul, providing flexibility to deploy infrastructure assets where needed with the assurance that both cellular and Wi-Fi traffic can be reliably and cost effectively backhauled.
3
Smart Scaling
Our Smart Scaling uses advanced highly scalable database management techniques to enable the support of hundreds of thousands of client devices across the Wi-Fi network. Smart Scaling employs intelligent data distribution techniques to extend client information, statistics and other vital user information across any number of nodes within the system without a single point of failure and with linear scalability. Smart Scaling is incorporated in our purpose-built hardware and software, making it capable of supporting hundreds of thousands of access points and user session workloads at the scale required by service providers.
Products and Services
Ruckus Wi-Fi solutions are marketed under the SmartZone, ZoneDirector, ZoneFlex, Unleashed and Xclaim brands. Additionally, Ruckus’ software and service offerings are currently marketed under the virtual SmartZone ("vSZ"), Cloudpath, Smart Positioning Technology (“SPoT”) and SmartCell Insight (“SCI”) product names. Under these brand and product names, we offer a full range of indoor and outdoor access points (“APs”), wireless local area network (“WLAN”) controllers, network management software, Wi-Fi-related applications and cloud, or software-based, services.
SmartZone
SmartZone is a unique line of carrier-grade wireless access and management products that include specialized hardware products such as SmartZone (“SZ”) controllers, as well as software solutions such as vSZ and virtual SmartZone Data Plane.
The Ruckus SZ and vSZ are massively scalable WLAN controllers. SZ is a Ruckus hardware appliance, whereas vSZ is a Network Function Virtualization (“NFV”)-based software WLAN controller. Both provide robust management and configuration of Ruckus Smart Wi-Fi APs along with the ability to handle massive volumes of Wi-Fi traffic. As highly scalable wireless networking platforms, the SZ and vSZ are capable of managing tens of thousands of access points and hundreds of thousands of clients while serving as a service delivery platform for new value-added capabilities, such as user and location-based services and detailed user analytics. These platforms support standard-based interfaces into service provider networks that simplify the integration of Wi-Fi services into carrier networks. Because the vSZ is a virtualized WLAN controller platform, it can be deployed on standard, off-the-shelf server platforms available from many vendors and does not require specialized hardware or installation requirements. This allows for easier and more economical deployments enabling a greater variety of potential service provider customers beyond traditional mobile network operators and cable companies to have significant resources invested in network infrastructure deployment. The vSZ with its multi-tenancy capability provides value-added resellers, systems integrators, fixed line operators, public venues and even enterprises, with extensive but typically private, employee-focused, WLAN deployments with the ability to enable and manage Wi-Fi services for a multitude of clients and services. The virtual SmartZone Data Plane is a version of the vSZ designed specifically to meet the growing demand for data plane efficiency in virtualized environments.
ZoneDirector
ZoneDirector is our family of Smart Wi-Fi controllers that streamline the configuration and management of Ruckus Smart Wi-Fi access points. ZoneDirectors can be deployed onsite or remotely and include different models to serve small, medium and large-scale end customers requiring from six to 1,000 access points. ZoneDirectors are typically deployed in a distributed forwarding architecture, eliminating the need to send all wireless traffic through the system. This mitigates any potential bottlenecks or any single point of failure. If customer requirements dictate, all wireless traffic can also be tunneled directly to the ZoneDirector. ZoneFlex software on all of our ZoneDirector Smart WLAN controllers makes use of a highly intuitive web-based graphical user interface to simplify configuration and administration of WLAN deployments. This software includes a variety of advanced capabilities such as adaptive meshing, integrated client performance tools, extensive authentication support, simplified guest access and user policy, wireless intrusion prevention, automatic traffic redirection, integrated Wi-Fi client performance tools and robust network management.
ZoneFlex
The ZoneFlex brand includes a full range of indoor and outdoor access points and long range point-to-point and point-to-multipoint bridges. ZoneFlex APs work directly with our ZoneDirector, SZ, and vSZ management platforms.
ZoneFlex indoor and outdoor Smart Wi-Fi access points and bridges incorporate our patented BeamFlex adaptive antenna array technology to deliver robust Wi-Fi performance, reliability and capacity. These APs leverage our Smart Radio technology to extend signal range, automatically mitigate RF interference and intelligently route Wi-Fi transmissions over the fastest available signal paths. This can allow customers and end customers to deploy fewer APs for any particular coverage area. These devices support multiple virtual WLANs, Wi-Fi encryption and advanced traffic handling. ZoneFlex access points can be installed as stand-alone APs or centrally managed through our ZoneDirector, SZ and vSZ platforms. Within a centrally managed architecture, customers can extend their wireless networks through the use of our SmartMesh technology minimizing the traditional requirement to run Ethernet cabling to locations where running Ethernet cabling is not possible or is cost prohibitive.
4
Unleashed
Unleashed are controllerless indoor Smart Wi-Fi access points custom-designed to help small business owners use Wi-Fi networks to grow their business, deliver an excellent customer experience and manage costs while supporting a variety of mobile devices with minimal information technology ("IT") staff. Unleashed access points are similar to comparable standard Ruckus ZoneFlex access points but have built-in controller capabilities similar to Ruckus’ ZoneDirector controller software, including user access controls, guest networking functions, advanced Wi-Fi security and traffic management. Each access point delivers Smart Wi-Fi performance at extended ranges and for up to 512 simultaneously connected devices. Ruckus Unleashed access points can manage up to 25 access points as part of a single-site network. A self-service interface provides business owners with insight on Wi-Fi usage so that they can manage the Wi-Fi experience of employees and visitors without dedicated IT staff. Businesses can plug and play more Ruckus Unleashed Wi-Fi access points to boost capability without needing to re-configure the network. As businesses grow to multiple sites, Ruckus offers a migration path to controller-based Wi-Fi using the same Wi-Fi access points.
Cloudpath
Cloudpath Wi-Fi device on-boarding bridges the gap between enterprise-grade security and personal devices to create a Set-It-And-Forget-It Wi-Fi device on-boarding experience that allows "bring your own device" and IT-owned devices to be on-boarded in a scalable, secure, and user-friendly manner. The Cloudpath service is designed to enable encryption with similar ease as open connectivity. Cloudpath utilizes standards-based security, such as WPA2-Enterprise, 802.1X and X.509, to work with existing Wi-Fi infrastructure. Cloudpath services help customers with automated, self-service certificate-based Wi-Fi security for an ever-changing array of users and devices.
Smart Positioning Technology
SPoT is a cloud-based Smart Wi-Fi location-based services platform leveraging unique user positioning technology that gives both service providers and enterprises the ability to deliver a wide-range of value-added services that can help them increase profitability and customer appeal while enhancing customers’ mobile experiences.
SPoT combines unique advantages, including options for both public and private cloud-based services, and a choice of location metrics with either SPoT Point (drop-pin) or SPoT Presence (proximity). Enterprise and managed service providers can use the SPoT application program interfaces (“APIs”) to incorporate location data into their own and third party applications. Enabling an ecosystem of partners through SPoT APIs provides additional capabilities through the SPoT platform for applications in retail, transportation, entertainment and other vertical markets.
SmartCell Insight
SCI is a big data Wi-Fi analytics and reporting platform that helps enterprises and service providers greatly enhance, optimize and scale the performance of their wireless networks and services. The SCI platform transforms traditional network reporting into a vital business tool, collecting, analyzing, parsing, presenting and storing vast amounts of user, traffic, session and location information. Data from the largest networks can be stored and retrieved for five to seven years or more, depending on the storage capacity made available to the SCI platform. SCI gathers real-time data that is combined with historical data so it can be analyzed and graphically displayed in an easy to understand format with a wide variety of views and customized reports. The data gathered by Ruckus SCI details essential network statistics such as traffic usage, client and session measurement, network changes, network latency and inventory.
Xclaim
Xclaim is a line of low-cost, controllerless Wi-Fi products targeted for small businesses that have little to no IT expertise in-house. Xclaim eliminates the cost and complexity associated with conventional enterprise WLAN systems for smaller organizations that cannot justify high costs but still desire best-in-class Wi-Fi connectivity, coverage and performance, with simple and easy management. Xclaim products include indoor and outdoor Wi-Fi access points that are managed through an innovative mobile application called Harmony for Xclaim or an on-line application called CloudManager for Xclaim. Harmony is purpose-built for the iOS and Android operating systems and is designed to modernize installation, configuration and ongoing administration of a Wi-Fi network with little to no IT expertise required. Within minutes, small businesses can use Harmony to configure Xclaim access points to begin offering secure, robust and reliable Wi-Fi at a fraction of the cost and complexity of conventional enterprise alternatives. CloudManager allows Xclaim customers to configure, monitor and troubleshoot networks from anywhere, over a web browser.
5
Support and Maintenance
We offer technical support and maintenance programs for most of our hardware and software products. These programs include problem identification and resolution services, software hot fixes and software error corrections, as well as software updates on an “if and when available” basis. We offer Partner Support and Premium Support through our technical support engineers and through our network of certified value-added resellers and distributors, which we refer to as our channel partners. For Partner Support, our authorized channel partners typically deliver level-one and level-two support to end customers and we provide level-three support to our channel partners. For Premium Support, we provide all support directly to the end customers. For Partner Support and Premium Support, we offer expedited replacement for any defective controller. Expedited replacement can also be separately purchased for access points. We use a third-party logistics provider to manage our worldwide deployment of replacement products. Support and maintenance services are provided 24 hours a day, seven days a week through regional support centers that are located worldwide. These services are typically sold to channel partners and to end customers for one, three or five year terms at the time of the initial product sale and may be renewed for successive periods.
Segment Information
We operate in one industry segment selling controllers and access points along with related software and services. Financial information about our operating segment and geographic areas is presented in Note 14 of notes to consolidated financial statements.
Backlog
In our experience, the actual amount of backlog at any particular time is not a meaningful indication of our future business prospects as a result of a number of factors. For example, we may allow customers to cancel or change orders with limited advance notice prior to shipment or performance. Additionally, a significant percentage of revenue is derived from orders received and shipped in the same quarter and often product revenue from certain distributors does not coincide with shipments, as the arrangement fee may not be considered fixed and determinable until the products are sold to the distributors’ customer. Furthermore, our support and maintenance agreements are typically for terms of multiple years.
Diverse Customer Base
We sell our products to a broad range of service providers and enterprise end customers globally. Our products have been sold to over 65,300 end customers worldwide, including over 260 service providers. We generally sell to service providers and enterprises through a worldwide network of channel partners and systems integrators. Our enterprise end customers span a wide range of industries, including hospitality, education, warehousing and logistics, corporate enterprise, retail, state and local governments, healthcare and public venues, such as stadiums, convention centers, airports and major outdoor public areas. Our service provider end customers include mobile network operators, fixed line operators, cable companies and emerging “over the top” providers. These customers use our Smart Wi-Fi solutions in multiple ways to grow their businesses, including augmenting 3G/4G capacity, mobile data traffic offload to unlicensed spectrum, Wi-Fi access to increase network footprint, backhaul assets to provide mobility services to existing customers and providing managed Wi-Fi services to enterprise customers.
Each of our greater than 10% customers are third-party distributors. Our agreements with these distributors were made in the ordinary course of business and may be terminated with or without cause by either party with advance notice. Although we may experience a short-term disruption in the distribution of our products and a short-term decline in revenue if the agreement with any of these distributions was terminated, we believe that such termination would not have a material adverse effect on us and our subsidiaries, taken as a whole, because we have engaged or believe that we would be able to engage alternative distributors, resellers and other distribution channels to deliver our products to end customers within a quarter following the termination of any agreement with a distributor.
Sales Strategy
We sell our products globally through direct and indirect channels. We target both enterprises and service providers that require Wi-Fi solutions through our global force of sales personnel and systems engineers. They work with a vast network of value-added resellers and distributors, which we collectively refer to as channel partners, to reach and service our end customers. Our channel partners provide lead generation, pre-sales support, product fulfillment and, in certain circumstances, post-sales customer service and support. In some instances, service providers may also act as a channel partner for sales of our solutions to enterprises. Our sales personnel and systems engineers typically engage directly with selected large service providers and large enterprises whether or not product fulfillment involves our channel partners. In contrast, the majority of our enterprise sales are originated and completed by our channel partners with little or no direct engagement by us.
Service providers typically require long sales cycles, which generally range between one and three years, but can be longer. The sale to a large service provider usually begins with an evaluation, followed by one or more network trials, followed by vendor selection and finally deployment and testing. A large service provider will frequently issue a request for proposals to shortlist competitive suppliers prior to the network trials. Completion of several of these steps is substantially outside of our control, which causes our revenue patterns from large service providers to vary widely from period to period. After initial deployment, subsequent purchases of our products depend on the time frame of the service provider.
6
Customer Service and Support and Training
We employ a worldwide team of support engineers and other support personnel to provide customer service and technical support for our products. Our channel partners often provide customer support directly to end customers. We then provide support to those channel partners as required. In other situations, we provide end customers support directly to end customers. We also offer product training to our channel partners as well as to end customers.
Research and Development
Our engineering group is primarily located in research and design centers in California, Taiwan, China, India and Singapore. We have invested significant time and financial resources in the development of our product lines and believe that continued investment in research and development is critical to our ongoing success. We expect to continue to expand our product offerings and solutions capabilities in the future and to invest significantly in continued research and development efforts.
Manufacturing
We use a variety of components from many specialized suppliers. We have multiple sources for most of our components. However, we do depend on single source manufacturers for certain critical components. These critical components are technically unique and only available from these manufacturers. We maintain a close direct relationship with these manufacturers to ensure supply meets our requirements and ensure that we always have at least one month of supply on hand. If one of our single source suppliers suffers an interruption in their businesses, or experiences delays, disruptions or quality control problems in its manufacturing operations, or we otherwise have to change or add additional contract manufacturers or suppliers, our ability to ship products to our customers could be delayed, and our business adversely affected.
Warehousing, Logistics and Quality Assurance
We perform some warehousing and delivery of products sold within the United States from our headquarters in Sunnyvale, California. We also outsource the warehousing and delivery of our products to a third-party logistics provider for worldwide fulfillment. We perform quality assurance for our products at our facilities around the world.
Competition
We compete in the highly competitive worldwide market for wireless infrastructure products and services. Given the growth and technology evolution within this market, competition is varied and diverse. Fundamentally, our competitors fall into three primary categories:
1. | Large telecommunications and networking equipment vendors, such as Cisco Systems. |
2. | Specialized W-Fi companies that offer products and services that compete with some of our products and capabilities to both the high and low end of the market; and |
3. | Diversified technology companies, such as Hewlett Packard Enterprise, that offer wired and wireless enterprise equipment in addition to many other technology products and services to a wide range of organizations. |
The principal competitive factors in our market include:
• product features, reliability and performance;
• scalability of products;
• price and total cost of ownership;
• ability to integrate with other technology infrastructures;
• breadth of product offerings;
• brand awareness and reputation;
• incumbency of current provider, either for Wi-Fi products or other products; and
• strength and scale of sales and marketing efforts, professional services and customer support.
We compete primarily based on the advanced coverage, performance and scalability of our products.
7
Many of our competitors have substantially greater financial, technical and other resources, greater name recognition, larger sales and marketing budgets, broader distribution and larger and more mature intellectual property portfolios.
Intellectual Property
Our success depends in part upon our ability to protect our core technology and intellectual property. To accomplish this, we rely on federal, state, common law and international rights, including patents, trade secrets, copyrights and trademarks. We also rely on confidentiality and contractual restrictions, including entering into confidentiality and invention assignment agreements with our employees and contractors and confidentiality agreements with third parties.
We pursue registration of our patents, trademarks and domain names in the United States and certain locations outside the United States, focusing our patent, trademark, copyright and trade secret protection primarily in the United States, China, Taiwan and Europe. We actively seek patent protection covering inventions originating from the Company. As of December 31, 2015, we have a portfolio of over 140 patents awarded by the United States Patent and Trademark Office and other patent offices around the world, as well as a number of pending patent applications, which cover a wide range of Wi-Fi innovations. We currently have trademark applications and registrations in the United States and other countries, including the US Registered Trademark RUCKUS WIRELESS.
Circumstances outside our control could pose a threat to our intellectual property rights. For example, effective intellectual property protection may not be available in the United States or other countries in which we operate. The efforts we have taken to protect our proprietary rights may not be sufficient or effective. Any significant impairment of our intellectual property rights could harm our business or our ability to compete. Protecting our intellectual property rights is costly and time-consuming. Any unauthorized disclosure or use of our intellectual property could make it more expensive to do business and harm our operating results.
We operate in an industry with a significant level of intellectual property disputes, which may be between competitors or involve claims against operating companies brought by non-practicing entities. We currently face, and have faced in the past, allegations that we have infringed the patents of third parties, including our competitors and non-practicing entities. As we face increasing competition and as our business grows, we will likely face more claims of infringement of patents or other intellectual property rights.
Employees
As of December 31, 2015, we had 1,050 employees, 463 of whom were primarily engaged in research and development, 392 of whom were primarily engaged in sales and marketing and 195 of whom were primarily engaged in providing customer support, operations and administration and finance services. As of December 31, 2015, 570 of these employees were located outside the United States. None of our employees are represented by a labor union or covered by a collective bargaining agreement. We consider our relationship with our employees to be good.
Corporate Information
We were incorporated in Delaware in 2002. We completed our initial public offering in November 2012 and our common stock is listed on the New York Stock Exchange under the symbol “RKUS.” Our headquarters are located at 350 West Java Drive, Sunnyvale, California 94089 and our telephone number is (650) 265-4200.
Available Information
Our website is located at www.ruckuswireless.com, and our investor relations website is located at http://investors.ruckuswireless.com/. The contents of our website are not intended to be incorporated by reference into this Annual Report on Form 10-K or in any other report or document we file with the Securities and Exchange Commission, or SEC, and any references to our websites are intended to be inactive textual references only. The following filings are available through our investor relations website after we file them with the SEC: Annual Reports on Form 10-K, Quarterly Reports on Form 10-Q, Current Reports on Form 8-K, as well as any amendments to such reports and all other filings pursuant to Section 13(a) or 15(d) of the Securities Act. These filings are also available for download free of charge on our investor relations website. Additionally, copies of materials filed by us with the SEC may be accessed at the SEC's Public Reference Room at 100 F Street, N.E., Washington, D.C. 20549 or at www.sec.gov. For information about the SEC's Public Reference Room, contact 1-800-SEC-0330.
8
ITEM 1A. RISK FACTORS
In evaluating Ruckus and our business, you should carefully consider the risks and uncertainties described below, together with all of the other information in this report, including our consolidated financial statements and related notes. The risks and uncertainties described below are not the only ones we face. If any of the following risks occur, our business, financial condition, operating results, and prospects could be materially harmed. In that event, the price of our common stock could decline, and you could lose part or all of your investment.
Risks Related to Our Business and Industry
If the market for our products does not develop as we expect, demand for our products may not grow as we expect.
We develop and provide Wi-Fi products and services for service providers and enterprises. The success of our business depends on the continued growth and reliance on Wi-Fi in these markets. The recent growth of the market for Wi-Fi networks is being driven by the increased use of Wi-Fi-enabled mobile devices and the use of Wi-Fi as a preferred connectivity option to support video, voice and other higher-bandwidth uses. As a result, mobile service providers and enterprises are struggling to address the capacity gap, including increased demands on their networks and the significant investment required to upgrade network capacity and provide ubiquitous wireless connectivity.
A number of barriers may prevent service providers or their subscribers from adopting Wi-Fi technology to address the capacity gap in wireless networks. For example, Wi-Fi operates over an unlicensed radio spectrum, and if the Wi-Fi spectrum becomes crowded, Wi-Fi solutions will be a less attractive option for service providers. In addition, in order for Wi-Fi solutions to adequately address the potential future capacity gap, mobile devices should automatically switch from a cellular data network to the service provider’s Wi-Fi network, when available and appropriate. Generally, mobile devices do not switch to unauthenticated Wi-Fi networks without input from the device user, and often require the user to log in when a new Wi-Fi network is accessed, which may tend to limit a subscriber’s use of Wi-Fi. These and other factors could limit or slow the adoption of Wi-Fi technologies by service providers as a means to address this potential future capacity gap.
There is no guarantee that service providers and enterprises will continue to utilize Wi-Fi technology, that use of Wi-Fi-enabled mobile devices will continue to increase or that Wi-Fi will continue to be the preferred connectivity option for the uses described above. There is also no guarantee that service providers and enterprises will understand the benefits we believe that our Smart Wi-Fi solutions provide. If another technology were found to be superior to Wi-Fi by service providers or enterprises, it would have a material adverse effect on our business, operating results and financial condition. As a result, demand for our products and services may not continue to develop as we anticipate, or at all.
Our operating results may fluctuate significantly, which makes our future operating results difficult to predict and could cause our operating results to fall below expectations or our guidance.
Our quarterly and annual operating results have fluctuated in the past and may fluctuate significantly in the future, which makes it difficult for us to predict our future operating results. The timing and size of sales of our products are highly variable and difficult to predict and can result in significant fluctuations in our revenue from period to period. This is particularly true of our sales to service providers, whose purchases are generally larger than those of our enterprise customers, causing greater variation in our results based on when service providers take delivery of our products.
In general, our product revenue reflects orders shipped in the same quarter that orders are received. In addition, we receive a substantial portion of our orders for each quarter in the last month of that quarter, which is a trend we expect to continue. We face risks of both under-estimating and over-estimating the amount and timing of orders from our customers. On the one hand, even though we may have business indicators about customer demand during a quarter, if we are unable to ship enough product to fulfill the orders we receive in the last month of a quarter, we would be forced to delay recognition of the revenue associated with those orders. On the other hand, because our budgeted expense levels depend in part on our expectations of future revenue, if the orders we receive in the last month of each quarter do not meet our expectations, we may not be able to reduce our costs quickly enough to compensate for the unexpected revenue shortfall. A small shortfall in revenue could disproportionately and adversely affect our operating margin and operating results for a given quarter. In addition, we may incur unanticipated costs in connection with expediting orders which have exceeded our order forecasts. If any of these events were to occur, we would expect our results to be adversely affected, and we might fail to meet the expectations of analysts and investors, which could cause our stock price to decline.
Our operating results may also fluctuate due to a variety of other factors, many of which are outside of our control, including changing economic environments in the U.S., Europe, China and other regions, and any of which may cause our stock price to fluctuate. In addition to other risks listed in this “Risk Factors” section, factors that may affect our operating results include:
• | fluctuations in demand for our products and services, including seasonal variations in certain enterprise sectors such as hospitality and education, where end customers place orders most heavily in the second and third quarters; |
• | the inherent complexity, length and associated unpredictability of our sales cycles for our products and services, particularly with respect to sales to service providers; |
• | changes in customers’ budgets for technology purchases and delays in their purchasing cycles; |
9
• | technical challenges in service providers’ overall networks, unrelated to our products, which could delay adoption and installation of our products; |
• | changing market conditions, including current and potential service provider consolidation; |
• | any significant changes in the competitive dynamics of our markets, including new entrants, or further consolidation; |
• | variation in sales channels, product costs or mix of products sold; |
• | our contract manufacturers and component suppliers’ ability to meet our product demand forecasts at acceptable prices, or at all; |
• | the timing of product releases or upgrades by us or by our competitors; |
• | our ability to develop, introduce and ship in a timely manner new products and product enhancements and anticipate future market demands that meet our customers’ requirements; |
• | our ability to successfully expand the suite of products we sell to existing customers; |
• | the potential need to record incremental inventory reserves for products that may become obsolete due to our new product introductions; |
• | our ability to control costs, including our operating expenses and the costs of the components we purchase; |
• | any decision to increase or decrease operating expenses in response to changes in the marketplace or perceived marketplace opportunities; |
• | the timing of litigation matters or disputes and any resulting settlements or judgments; |
• | growth in our headcount and other related costs incurred in our customer support organization; |
• | volatility in our stock price, which may lead to higher stock compensation expenses; |
• | our ability to derive benefits from our investments in sales, marketing, engineering or other activities; and |
• | general economic or political conditions in our domestic and international markets, in particular the restricted credit environment impacting the credit of our customers. |
The cumulative effects of these factors could result in large fluctuations and unpredictability in our quarterly and annual operating results. As a result, comparing our operating results on a period-to-period basis may not be meaningful. You should not rely on our past results as an indication of our future performance. This variability and unpredictability could also result in our failing to meet the expectations of industry or financial analysts or investors for any period. If our revenue or operating results fall below the expectations of analysts or investors or below any forecasts we may provide to the market, or if the forecasts we provide to the market are below the expectations of analysts or investors, the price of our common stock could decline substantially. Such a stock price decline could occur even when we have met any previously publicly stated revenue and/or earnings forecasts we may provide.
Our sales may be impacted as a result of changes in public funding of educational institutions.
Our enterprise end customers include both public and private K-12 institutions in the United States. This education market typically operates on limited budgets and depends on the U.S. federal government to provide supplemental funding. For example, the Federal Communications Commission, or FCC, through its E-rate program (also known as the Schools and Libraries Program of the Universal Service Fund), provides supplemental funding to school districts to fund upgrades to technical infrastructure, including Wi-Fi infrastructure. The most recently announced order under the E-rate program provides for a significant increase to the annual E-rate funding cap, to $3.9 billion with inflation adjustments annually, and increases funding availability from a two-year period to five-year period. However, the E-rate program continues to be subject to uncertainty regarding eligibility criteria and specific timing of actual federal funding as well as subject to further federal program guidelines and funding appropriation. This uncertainty and potential further changes to the E-rate program may affect or delay purchasing decisions by our end customers in the education market and will continue to cause fluctuations in our overall revenue forecasts and financial results and create greater uncertainty regarding the level of customer orders in this market during the term of the E-rate program.
10
Our sales cycles can be long and unpredictable, particularly to service providers, and our sales efforts require considerable time and expense. As a result, our sales and revenue are difficult to predict and may vary substantially from period to period, which may cause our operating results to fluctuate significantly.
The timing of our revenues is difficult to predict. Our sales efforts involve educating our potential end customers and channel partners about the applications and benefits of our products and services, including the technical capabilities of our products. Service providers typically require long sales cycles, which generally range between one and three years, but can be longer. Sales to large service providers usually begins with an evaluation, followed by one or more network trials, followed by vendor selection and contract negotiation and finally followed by installation, testing and deployment. In contrast, our sales cycles are typically less than ninety days for small and medium enterprises and longer for large enterprises. For services providers, we spend substantial time and resources on our sales efforts without any assurance that our efforts will produce any sales. For all our sales efforts, purchases of our products are frequently subject to budget constraints, multiple approvals, and unplanned administrative, processing and other delays. Moreover, the evolving nature of the market may lead prospective end customers to postpone their purchasing decisions pending resolution of Wi-Fi or other standards or adoption of technology by others. Even if an end customer makes a decision to purchase our products, there may be circumstances or terms relating to the purchase that delay our ability to recognize revenue from that purchase, which makes our revenue difficult to forecast. As a result, it is difficult to predict whether a sale will be completed, the particular fiscal period in which a sale will be completed or the fiscal period in which revenue from a sale will be recognized. Our operating results may therefore vary significantly from quarter to quarter.
With respect to service providers, sales have been characterized by large and sporadic purchases, in addition to long sales cycles. Sales activity to service providers depends upon the stage of completion of expanding network infrastructures, the availability of funding, and the extent to which service providers are affected by regulatory, economic and business conditions in their country of operations. The nature of this sales activity to service providers can result in further fluctuations in our operating results from period to period. Orders from service providers could decline for many reasons unrelated to the competitiveness of our products and services within their respective markets, such as advances in competing technologies. Our service provider end customers typically have long implementation cycles, require a broader range of services, and often require acceptance terms that can lead to a delay in revenue recognition. Some of our current or prospective service provider end customers have canceled or delayed and may in the future cancel or delay spending on the development or roll-out of capital and technology projects with us due to continuing economic uncertainty and, consequently, our financial position, results of operations or cash flows may be adversely affected. Weakness in orders from service providers, including as a result of any slowdown in capital expenditures by service providers, which may be more prevalent during a global economic downturn or periods of economic uncertainty, could have a material adverse effect on our business, financial position, results of operations, cash flows and stock price.
The growth rate in recent periods of our revenue, net income and margin may not be indicative of our future performance.
You should not consider the growth rate in our revenue, net income or margin in recent periods as indicative of our future performance. We do not expect to achieve similar revenue, net income or margin growth rates in future periods. You should not rely on our revenue, net income or margin for any prior quarterly or annual periods as any indication of our future revenue, net income or margin, or their rate of growth. If we are unable to maintain consistent revenue, net income or margin, or growth of any of these financial measures, our stock price could be volatile.
Our large end customers, particularly service providers, have substantial negotiating leverage, which may require that we agree to terms and conditions that could result in lower revenues and gross margins from such end customers. The loss of a single large end customer could adversely affect our business.
Many of our end customers are service providers or larger enterprises that have substantial purchasing power and leverage in negotiating contractual arrangements with us. These end customers may require us to develop additional product features, may require penalties for non-performance of certain obligations, such as delivery, outages or response time, and may have multi-vendor strategies. The leverage held by these large end customers could result in lower revenues and gross margins. The loss of a single large end customer could materially harm our business and operating results.
11
We compete in highly competitive markets, and competitive pressures from existing and new companies may harm our business, revenues, growth rates and market share. In addition, many of our current or potential competitors have longer operating histories, greater brand recognition, larger customer bases and significantly greater resources than we do, and we may lack sufficient financial or other resources to maintain or improve our competitive position.
The markets in which we compete are intensely competitive, and we expect competition to increase in the future from established competitors and new market entrants. The markets are influenced by, among others, the following competitive factors:
• | brand awareness and reputation; |
• | price and total cost of ownership; |
• | strength and scale of sales and marketing efforts, professional services and customer support; |
• | product features, reliability and performance; |
• | incumbency of current provider, either for Wi-Fi products or other products; |
• | scalability of products; |
• | ability to integrate with other technology infrastructures; and |
• | breadth of product offerings. |
Our major competitors include Cisco Systems and Hewlett Packard Enterprises. We expect competition to continue to intensify in the future as other companies introduce new products into our markets. This competition could result in increased pricing pressure, reduced profit margins, increased sales and marketing expenses and failure to increase, or the loss of, market share, any of which would likely seriously harm our business, operating results or financial condition. If we do not keep pace with product and technology advances, there could be a material and adverse effect on our competitive position, revenues and prospects for growth.
A number of our current or potential competitors have longer operating histories, greater name recognition, larger customer bases and significantly greater financial, technical, sales, marketing and other resources than we do. Our competitors may be able to anticipate, influence or adapt more quickly to new or emerging technologies and changes in customer requirements, devote greater resources to the promotion and sale of their products and services, initiate or withstand substantial price competition, take advantage of acquisitions or other opportunities more readily and develop and expand their product and service offerings more quickly than we can. In addition, certain competitors may be able to leverage their relationships with customers based on other products or incorporate functionality into existing products to gain business in a manner that discourages customers from purchasing our products, including through selling at zero or negative margins, product bundling or closed technology platforms. Potential end customers may prefer to purchase all of their equipment from a single provider, or may prefer to purchase wireless networking products from an existing supplier rather than a new supplier, regardless of product performance or features.
We expect increased competition from our current competitors, as well as other established and emerging companies, to the extent our markets continue to develop and expand. Conditions in our markets could change rapidly and significantly as a result of technological advancements or other factors. This increased competition and changing conditions could materially adversely affect our business, operating results and financial condition.
12
Industry consolidation may lead to stronger competition and may harm our operating results.
There has been a trend toward industry consolidation in our markets for several years. We expect this trend to continue as companies attempt to strengthen or hold their market positions in an evolving industry and as companies are acquired or are unable to continue operations. For example, some of our current and potential competitors have made acquisitions, or announced new strategic alliances, designed to position them with the ability to better compete as sole-source vendors for customers, such as the acquisition of Aruba Networks by Hewlett Packard Enterprise. Companies that are strategic alliance partners in some areas of our business may acquire or form alliances with our competitors, thereby reducing their business with us. The companies resulting from industry consolidation may create more compelling product offerings and be able to offer greater pricing flexibility, making it more difficult for us to compete effectively, including on the basis of price, sales and marketing programs, technology or product functionality. We therefore believe that industry consolidation may result in stronger competitors that are better able to compete as sole-source vendors for customers. Continued industry consolidation may also adversely impact customers’ perceptions of the viability of smaller and even medium-sized technology companies such as us and, consequently, customers’ willingness to purchase from such companies. This could lead to more variability in our operating results and could have a material adverse effect on our business, operating results and financial condition. Furthermore, particularly in the service provider market, consolidation will lead to fewer customers, may delay purchasing decisions by existing customers, or may result in the loss of a major customer, with the effect that such consolidation could have a material impact on results not anticipated in a customer marketplace composed of more numerous participants.
We compete in rapidly evolving markets and depend upon the development of new products and enhancements to our existing products. If we fail to predict and respond to emerging technological trends and our customers’ changing needs, we may not be able to remain competitive.
The Wi-Fi and wireless networking market is generally characterized by rapidly changing technology, changing end customer needs, evolving industry standards and frequent introductions of new products and services. To succeed, we must effectively anticipate, and adapt in a timely manner to, end customer requirements and continue to develop or acquire new products and features that meet market demands, technology trends and regulatory requirements. Likewise, if our competitors introduce new products and services that compete with ours, we may be required to reposition our product and service offerings or introduce new products and services in response to such competitive pressure. If we fail to develop new products or product enhancements, or our end customers or potential end customers do not perceive our products to have compelling technical advantages, our business could be adversely affected, particularly if our competitors are able to introduce solutions with such increased functionality earlier than we do. Developing our products is expensive, complex and involves uncertainties. Each phase in the development of our products presents serious risks of failure, rework or delay, any one of which could impact the timing and cost-effective development of such product and could jeopardize end customer acceptance of the product. We have experienced in the past and may in the future experience design, manufacturing, marketing and other difficulties that could delay or prevent the development, introduction or marketing of new products and enhancements. In addition, the introduction of new or enhanced products requires that we carefully manage the transition from older products to minimize disruption in customer ordering practices and ensure that new products can be timely delivered to meet our customers’ demand. As a result, we may not be successful in modifying our current products or introducing new products in a timely or appropriately responsive manner, or at all. If we fail to address these changes successfully, our business and operating results could be materially harmed.
We base our inventory purchasing decisions on our forecasts of customers’ demand, and if our forecasts are inaccurate, our operating results could be materially harmed.
We place orders with our manufacturers based on our forecasts of our customers’ demand. Our forecasts are based on multiple assumptions, each of which may cause our estimates to be inaccurate, affecting our ability to provide products to our customers. When demand for our products increases significantly, we may not be able to meet demand on a timely basis, and we may need to expend a significant amount of time working with our customers to allocate limited supply and maintain positive customer relations, or we may incur additional costs in order to rush the manufacture and delivery of additional products. If we underestimate customers’ demand, we may forego revenue opportunities, lose market share and damage our customer relationships. Conversely, if we overestimate customer demand, we may purchase more inventory than we are able to sell at any given time or at all. In addition, we grant our distributors stock rotation rights, which require us to accept stock back from a distributor’s inventory, including obsolete inventory. As a result of our failure to estimate demand for our products, and our distributor’s stock rotation rights, we could have excess or obsolete inventory, resulting in a decline in the value of our inventory, which would increase our costs of revenues and reduce our liquidity. Our failure to accurately manage inventory relative to demand would adversely affect our operating results.
If we are unable to manage our growth and expand our operations successfully, our business and operating results will be harmed and our reputation may be damaged.
We have expanded our operations significantly since inception and anticipate that further significant expansion will be required to achieve our business objectives. The growth and expansion of our business and product offerings places a continuous and significant strain on our management, operational and financial resources. Any such future growth would also add complexity to and require effective coordination throughout our organization.
13
To manage any future growth effectively, we must continue to improve and expand our IT and financial infrastructure, our operating and administrative systems and controls, and our ability to manage headcount, capital and processes in an efficient manner. We are also increasing our reliance on third-party cloud computing services that offer storage capabilities, data processing and other services as we expand our service offerings. We may not be able to successfully implement improvements to these systems and processes in a timely or efficient manner or effectively manage our reliance on third-party providers, which could result in additional operating inefficiencies and could cause our costs to increase more than planned. If we do increase our operating expenses in anticipation of the growth of our business and this growth does not meet our expectations, our operating results may be negatively impacted. If we are unable to manage future expansion, our ability to provide high quality products and services could be harmed, which could damage our reputation and brand and may have a material adverse effect on our business, operating results and financial condition.
Some of the components and technologies used in our products are purchased from a single source or a limited number of sources. The loss of any of these suppliers may cause us to incur additional transition costs, result in delays in the manufacturing and delivery of our products, or cause us to carry excess or obsolete inventory and could cause us to redesign our products.
Although supplies of our components are generally available from a variety of sources, we currently depend on a single source or limited number of sources for several components for our products. We have also entered into license agreements with some of our suppliers for technologies that are used in our products, and the termination of these licenses, which can generally be done on relatively short notice, could have a material adverse effect on our business. For example, we purchase standard Wi-Fi chipsets only from Qualcomm and our products incorporate certain technology that we license from Qualcomm. If that license agreement were terminated, we would be required to redesign some of our products in order to incorporate technology from alternative sources, and any such termination of the license agreement and redesign of certain of our products could require additional licenses and materially and adversely affect our business and operating results.
Because there are no other sources identical to several of our components and technologies, if we lost any of these licenses or the ability to use any of these components from these suppliers, we could be required to transition to a new supplier or licensor, which could increase our costs, result in delays in the manufacturing and delivery of our products or cause us to carry excess or obsolete inventory. Additionally, poor quality in any of the sole-sourced components in our products could result in lost sales or lost sales opportunities. If the quality of the components does not meet our or our customers’ requirements, if we are unable to obtain components from our existing suppliers on commercially reasonable terms, or if any of our sole source providers cease to remain in business or continue to manufacture such components, we could be required to redesign our products in order to incorporate components or technologies from alternative sources. The resulting stoppage or delay in selling our products and the expense of redesigning our products could result in lost sales opportunities and damage to customer relationships, which would adversely affect our reputation, business and operating results.
In addition, for certain components for which there are multiple sources, we are subject to potential price increases and limited availability due to market demand for such components. In the past, unexpected demand for communication products caused worldwide shortages of certain electronic parts. If such shortages occur in the future and we are unable to pass component price increases along to our customers or maintain stable or competitive pricing, our gross margins and operating results could be negatively impacted.
Because we rely on third parties to manufacture our products, our ability to supply products to our customers may be disrupted.
We outsource the manufacturing of our products to third-party manufacturers. Our reliance on these third-party manufacturers reduces our control over the manufacturing process and exposes us to risks, including reduced control over quality assurance, product costs, and product supply and timing. Any manufacturing disruption by these third-party manufacturers could severely impair our ability to fulfill orders. Our reliance on outsourced manufacturers also yields the potential for infringement or misappropriation of our intellectual property. If we are unable to manage our relationships with these third-party manufacturers effectively, or if these third-party manufacturers suffer delays or disruptions for any reason, experience increased manufacturing lead-times, capacity constraints or quality control problems in their manufacturing operations, or fail to meet our future requirements for timely delivery, our ability to ship products to our customers would be severely impaired, and our business and operating results would be seriously harmed.
These manufacturers typically fulfill our supply requirements on the basis of individual orders. We do not have long term contracts with our third-party manufacturers that guarantee capacity, the continuation of particular pricing terms or the extension of credit limits. Accordingly, our third-party manufacturers are not obligated to continue to fulfill our supply requirements, which could result in supply shortages, and the prices we are charged for manufacturing services could be increased on short notice. In addition, as a result of fluctuating global financial market conditions, natural disasters or other causes, it is possible that any of our manufacturers could experience interruptions in production, cease operations or alter our current arrangements. If our manufacturers are unable or unwilling to continue manufacturing our products in required volumes, we will be required to identify one or more acceptable alternative manufacturers. It is time-consuming and costly and could be impractical to begin to use new manufacturers, and changes in our third-party manufacturers may cause significant interruptions in supply if the new manufacturers have difficulty manufacturing products to our specification. As a result, our ability to meet our scheduled product deliveries to our customers could be adversely affected, which could cause the loss of sales to existing or potential customers, delayed revenue or an increase in our costs. Any production interruptions for any reason, such as a natural disaster, epidemic, capacity shortages or quality problems, at one of our manufacturers would negatively affect sales of our product lines manufactured by that manufacturer and adversely affect our business and operating results.
14
New regulations related to “conflict minerals” may force us to incur additional expenses, may result in damage to our business reputation and may adversely impact our ability to conduct our business.
Pursuant to the Dodd-Frank Act, we adhere to certain reporting and other requirements regarding the use of certain minerals and derivative metals (referred to as “conflict minerals,” regardless of their actual country of origin) in our products. Some of these metals are commonly used in electronic equipment and devices, including our products. These requirements require that we investigate, disclose and report whether or not any such metals in our products originated from the Democratic Republic of Congo or adjoining countries. We have an extremely complex supply chain, with numerous suppliers, many of whom may not be obligated to investigate their own supply chains, for the components and parts used in each of our products. As a result, we may incur significant costs to comply with the diligence and disclosure requirements, including costs related to determining the source of any of the relevant metals used in our products and other potential changes to products or sources of supply as a consequence of such verification activities. Because these regulations are new, we and the companies comprising our supply chain, both have a limited history of investigating, disclosing and reporting use of these minerals, and there is a limited history of regulatory guidance regarding compliance with these requirements. In addition, because our supply chain is so complex, we may not be able to sufficiently verify the origin of all relevant metals used in our products through the due diligence procedures that we implement, which may harm our business reputation. We may incur reputational challenges if we determine that any of our products contain minerals or derivative metals that are not conflict free or if we are unable to sufficiently verify the source for all conflict minerals used in our products through the procedures we may implement. Furthermore, key components and parts that can be shown to be “conflict free” may not be available to us in sufficient quantity, or at all, or may only be available at significantly higher cost to us. If we are not able to meet customer requirements, customers may choose to disqualify us as a supplier. Any of these outcomes could adversely affect our business, financial condition or operating results.
We depend on cloud computing infrastructure operated by third-parties and any disruption in these operations could adversely affect our business.
For our service offerings, in particular our Wi-Fi-related cloud services, we rely on third-parties to provide cloud computing infrastructure that offers storage capabilities, data processing and other services. We currently operate our cloud-dependent services using Amazon Web Service (“AWS”) or Google Compute Engine (“GCE”). We cannot easily switch our AWS or GCE operations to another cloud provider. Any disruption of or interference with our use of these cloud services would impact our operations and our business could be adversely impacted.
Problems faced by our third-party cloud services, with the telecommunications network providers with whom we or they contract, or with the systems by which our telecommunications providers allocate capacity among their customers, including us, could adversely affect the experience of our end customers. If AWS and GCE are unable to keep up with our needs for capacity, this could have an adverse effect on our business. Any changes in third-party cloud services or any errors, defects, disruptions, or other performance problems with our applications could adversely affect our reputation and may damage our end customers’ stored files or result in lengthy interruptions in our services. Interruptions in our services might adversely affect our reputation and operating results, cause us to issue refunds or service credits, subject us to potential liabilities, or result in contract terminations.
15
We rely significantly on channel partners to sell and support our products, and the failure of this channel to be effective could materially reduce our revenue.
The majority of our sales are through channel partners. We believe that establishing and maintaining successful relationships with these channel partners is, and will continue to be, important to our financial success. Recruiting and retaining qualified channel partners and training them in our technology and product offerings require significant time and resources. To develop and expand our channel, we must continue to scale and improve our processes and procedures that support our channel partners, including investment in systems and training.
Existing and future channel partners will only work with us if we are able to provide them with competitive products on terms that are commercially reasonable to them. If we fail to maintain the quality of our products or to update and enhance them, existing and future channel partners may elect to work instead with one or more of our competitors. In addition, the terms of our arrangements with our channel partners must be commercially reasonable for both parties. If we are unable to reach agreements that are beneficial to both parties, then our channel partner relationships will not succeed.
We have no minimum purchase commitments with any of our channel partners, and our contracts with channel partners do not prohibit them from offering products or services that compete with ours, including products they currently offer or may develop in the future and incorporate into their own systems. Some of our competitors may have stronger relationships with our channel partners than we do and we have limited control, if any, as to whether those partners use our products, rather than our competitors’ products, or whether they devote resources to market and support our competitors’ products, rather than our offerings. We cannot be certain that any of our channel partners, including our major distributors, will continue to sell our products or services at the same volumes as they have in the past, or will not terminate their agreements with us, which are generally terminable with certain notice.
The reduction in or loss of sales by these channel partners could materially reduce our revenue. If we fail to maintain relationships with our channel partners, fail to develop new relationships with other channel partners in new markets, fail to manage, train or incentivize existing channel partners effectively, fail to provide channel partners with competitive products on terms acceptable to them, or if these channel partners are not successful in their sales efforts, our revenue may decrease and our operating results could suffer.
Our ability to sell our products is highly dependent on the quality of our support and services offerings, and our failure to offer high quality support and services would have a material adverse effect on our sales and results of operations.
Once our products are deployed, our channel partners and end customers depend on our support organization to resolve any issues relating to our products. A high level of support is important for the successful marketing and sale of our products. In many cases, our channel partners provide support directly to our end customers. We do not have complete control over the level or quality of support provided by our channel partners. These channel partners may also provide support for other third-party products, which may potentially distract resources from support for our products. If we and our channel partners do not effectively assist our end customers in deploying our products, succeed in helping our end customers quickly resolve post-deployment issues or provide effective ongoing support, it would adversely affect our ability to sell our products to existing end customers and could harm our reputation with potential end customers. In some cases, we guarantee a certain level of performance to our channel partners and end customers, which could prove to be resource-intensive and expensive for us to fulfill if unforeseen technical problems were to arise.
Many of our service provider and large enterprise end customers have more complex networks and require higher levels of support than our smaller end customers. We have recently expanded our support organization for service provider and large enterprise end customers, and continue to develop this organization. If we fail to build this organization quickly enough, or it fails to meet the requirements of our service provider or large enterprise end customers, it may be more difficult to execute on our strategy to increase our sales to large end customers. In addition, given the extent of our international operations, our support organization faces challenges, including those associated with delivering support, training and documentation in languages other than English. As a result of all of these factors, our failure to maintain high quality support and services would have a material adverse effect on our business, operating results and financial condition.
The loss of key personnel or an inability to attract, retain and motivate qualified personnel may impair our ability to expand our business.
Our success is substantially dependent upon the continued service and performance of our senior management team and key technical, marketing and production personnel, including Selina Lo, who is our President and Chief Executive Officer. Our employees, including our senior management team, are at-will employees, and therefore may terminate employment with us at any time with no advance notice. The replacement of any members of our senior management team or other key personnel likely would involve significant time and costs and may significantly delay or prevent the achievement of our business objectives.
Our future success also depends, in part, on our ability to continue to attract, integrate and retain highly skilled personnel. Competition for highly skilled personnel is frequently intense, especially in the San Francisco Bay Area, where we have a substantial presence and need for highly skilled personnel. Volatility or lack of performance in our stock price may also affect our ability to attract and retain our key employees. Our employees may be more likely to leave us if the shares they own or the shares underlying their vested options have significantly appreciated in value relative to the original purchase prices of the shares or the exercise prices of the options, or if the exercise prices of the options that they hold are significantly above the market price of our common stock. Any failure to successfully attract, integrate or retain qualified personnel to fulfill our current or future needs may negatively impact our growth. Also, to the extent we hire personnel from our competitors, we may be subject to allegations that these new hires have been improperly solicited, or that they have divulged proprietary or other confidential information, or that their former employers own their inventions or other work product.
16
Our products incorporate complex technology and may contain defects or errors. We may become subject to warranty claims, product returns, product liability and product recalls as a result, any of which could cause harm to our reputation and adversely affect our business.
Our products incorporate complex technology and must operate with cellular networks and a significant number and range of mobile devices using Wi-Fi, while supporting new and complex applications in a variety of environments that utilize different Wi-Fi communication industry standards. Our products have contained, and may contain in the future, undetected defects or errors. Some errors in our products have been and may in the future only be discovered after a product has been installed and used by end customers. These issues are most prevalent when new products are introduced into the market. Defects or errors have delayed and may in the future delay the introduction of our new products. Since our products contain components that we purchase from third parties, we also expect our products to contain latent defects and errors from time to time related to those third-party components.
Additionally, defects and errors may cause our products to be vulnerable to security attacks, cause them to fail to help secure networks or temporarily interrupt end customers’ networking traffic. Because the techniques used by computer hackers to access or sabotage networks are becoming increasingly sophisticated, change frequently and generally are not recognized until launched against a target, our products and third-party security products may be unable to anticipate these techniques and provide a solution in time to protect our end customers’ networks. In addition, defects or errors in the mechanism by which we provide software updates for our products could result in an inability to update end customers’ hardware products and thereby leave our end customers vulnerable to attacks.
Real or perceived defects or errors in our products could result in claims by channel partners and end customers for losses that they sustain, including potentially losses resulting from security breaches of our end customers’ networks and/or downtime of those networks. If channel partners or end customers make these types of claims, we may be required, or may choose, for customer relations or other reasons, to expend additional resources in order to help correct the problem, including warranty and repair costs, process management costs and costs associated with remanufacturing our inventory. Liability provisions in our standard terms and conditions of sale may not be enforceable under some circumstances or may not fully or effectively protect us from claims and related liabilities and costs. In addition, regardless of the party at fault, errors of these kinds divert the attention of our engineering personnel from our product development efforts, damage our reputation and the reputation of our products, cause significant customer relations problems and can result in product liability claims. We maintain insurance to protect against certain types of claims associated with the use of our products, but our insurance coverage may not adequately cover any such claims. In addition, even claims that ultimately are unsuccessful could result in expenditures of funds in connection with litigation and divert management’s time and other resources. We also may incur costs and expenses relating to a recall of one or more of our products. The process of identifying recalled products that have been widely distributed may be lengthy and require significant resources, and we may incur significant replacement costs, contract damage claims from our customers and significant harm to our reputation. The occurrence of these problems could result in the delay or loss of market acceptance of our products and could adversely impact our business, operating results and financial condition.
If our products do not interoperate with cellular networks and mobile devices, future sales of our products could be negatively affected.
Our products are designed to interoperate with cellular networks and mobile devices using Wi-Fi technology. These networks and devices have varied and complex specifications. As a result, we must attempt to ensure that our products interoperate effectively with these existing and planned networks and devices. To meet these requirements, we must continue to undertake development and testing efforts that require significant capital and employee resources. We may not accomplish these development efforts quickly or cost-effectively, or at all. If our products do not interoperate effectively, orders for our products could be delayed or cancelled, which would harm our revenue, operating results and our reputation, potentially resulting in the loss of existing and potential end customers. The failure of our products to interoperate effectively with cellular networks or mobile devices may result in significant warranty, support and repair costs, divert the attention of our engineering personnel from our product development efforts and cause significant customer relations problems. In addition, our end customers may require our products to comply with new and rapidly evolving security or other certifications and standards. If our products are late in achieving or fail to achieve compliance with these certifications and standards, or our competitors achieve compliance with these certifications and standards, such end customers may not purchase our products, which would harm our business, operating results and financial condition.
Although certain technical problems experienced by users may not be caused by our products, our business and reputation may be harmed if users perceive our solution as the cause of a slow or unreliable network connection, or a high profile network failure.
Our products have been deployed in many different locations and user environments and are capable of providing connectivity to many different types of Wi-Fi-enabled devices operating a variety of applications. The ability of our products to operate effectively can be negatively impacted by many different elements unrelated to our products. For example, a user’s experience may suffer from an incorrect setting in a Wi-Fi device. Although certain technical problems experienced by users may not be caused by our products, users often may perceive the underlying cause to be a result of poor performance of the wireless network. This perception, even if incorrect, could harm our business and reputation. Similarly, a high profile network failure may be caused by improper operation of the network or failure of a network component that we did not supply, but other service providers may perceive that our products were implicated, which, even if incorrect, could harm our business, operating results and financial condition.
17
Our corporate culture has contributed to our success, and if we cannot maintain this culture, especially as we grow, we could lose the innovation, creativity, and teamwork fostered by our culture, and our business may be harmed.
We believe that a critical contributor to our success has been our corporate culture, which we believe fosters innovation, teamwork, passion for customers, and focus on execution, as well as facilitating critical knowledge transfer and knowledge sharing. As we grow and change, we may find it difficult to maintain these important aspects of our corporate culture, which could limit our ability to innovate and operate effectively. Any failure to preserve our culture could also negatively affect our ability to retain and recruit personnel, continue to perform at current levels or execute on our business strategy.
Our business, operating results and growth rates may be adversely affected by current or future unfavorable economic and market conditions.
Our business depends on the overall demand for wireless network technology and on the economic health and general willingness of our current and prospective end customers to make those capital commitments necessary to purchase our products. If the conditions in the U.S. and global economies are uncertain or volatile, or if they deteriorate, our business, operating results and financial condition may be materially adversely affected. Economic weakness, end customer financial difficulties, limited availability of credit and constrained capital spending have resulted, and may in the future result, in challenging and delayed sales cycles, slower adoption of new technologies and increased price competition, and could negatively impact our ability to forecast future periods, which could result in an inability to satisfy demand for our products and a loss of market share.
In particular, we cannot be assured of the level of spending on wireless network technology, the deterioration of which would have a material adverse effect on our results of operations and growth rates. The purchase of our products or willingness to replace existing infrastructure is discretionary and highly dependent on a perception of continued rapid growth in consumer usage of mobile devices and in many cases involves a significant commitment of capital and other resources. Therefore, weak economic conditions or a reduction in capital spending would likely adversely impact our business, operating results and financial condition. A reduction in spending on wireless network technology could occur or persist even if economic conditions improve.
In addition, if interest rates rise or foreign exchange rates weaken for our international customers, overall demand for our products and services could decline and related capital spending may be reduced. Furthermore, any increase in worldwide commodity prices may result in higher component prices for us and increased shipping costs, both of which may negatively impact our financial results.
Our reported financial results may be adversely affected by changes in accounting principles applicable to us.
Generally accepted accounting principles in the United States, or U.S. GAAP, are subject to interpretation by the Financial Accounting Standards Board, or FASB, the SEC and other various bodies formed to promulgate and interpret appropriate accounting principles. For example, in May 2014, the FASB issued accounting standards update (“ASU”) No. 2014-09, Revenue from Contracts with Customers, which supersedes nearly all existing revenue recognition guidance under U.S. GAAP. A change in accounting principles or interpretations could have a significant effect on our financial results, and any difficulties in implementing these pronouncements could cause us to fail to meet our financial reporting obligations, which could result in regulatory discipline.
If our assumptions or judgments relating to our critical accounting policies change or prove to be incorrect, our operating results could fall below expectations of financial analysts and investors, resulting in a decline in our stock price.
The preparation of financial statements in conformity with U.S. GAAP requires our management to make estimates, assumptions and judgments that affect the amounts reported in the financial statements and accompanying notes. We base our estimates on historical experience and on various other assumptions that we believe to be reasonable under the circumstances, the results of which form the basis for making judgments about the carrying values of assets, liabilities, equity, revenue and expenses that are not readily apparent from other sources. Our operating results may be adversely affected if our assumptions change or if actual circumstances differ from those in our assumptions, which could cause our operating results to fall below the expectations of financial analysts and investors, resulting in a decline in our stock price. Significant assumptions and estimates used in preparing our financial statements include those related to revenue recognition, valuation of inventory, goodwill and intangible assets, accounting for income taxes and stock-based compensation.
Our exposure to the credit risks of our customers may make it difficult to collect accounts receivable and could adversely affect our operating results and financial condition.
In the course of our sales to customers, we may encounter difficulty collecting accounts receivable and could be exposed to risks associated with uncollectible accounts receivable. Economic conditions or other factors may impact some of our customers' ability to pay their accounts payables, including customers who are unable to collect or experience delays in payment from their own customers. We derive a significant portion of our revenue through distributors and in many cases sales in one or more countries or regions are via a single distributor, which can result in a concentrated credit risk if such country or region has experienced active sales. While we monitor these situations carefully and take appropriate measures to collect accounts receivable balances, we have written down accounts receivable and written off doubtful accounts in prior periods and may be unable to avoid accounts receivable write-downs or write-offs of doubtful accounts in the future. Such write-downs or write-offs could negatively affect our operating results.
18
U.S. and global political, credit and financial market conditions may negatively impact or impair the value of our current portfolio of cash, cash equivalents and short-term investments.
Our cash, cash equivalents and short-term investments are held in a variety of interest bearing instruments, including money market funds, corporate debt securities and U.S. government agency securities. As a result of the uncertain domestic and global political, credit and financial market conditions, investments in these types of financial instruments pose risks arising from liquidity and credit concerns. Given that future deterioration in the U.S. and global credit and financial markets is a possibility, no assurance can be made that losses or significant deterioration in the fair value of our cash, cash equivalents or short-term investments will not occur. These factors could impact the liquidity or valuation of our current portfolio of cash, cash equivalents and short-term investments. If any such losses or significant deteriorations occur, it may negatively impact or impair our current portfolio of cash, cash equivalents and short-term investments, which may affect our ability to fund future obligations. Further, if there is a U.S. and global political, credit and financial market crisis, it may be difficult for us to liquidate our investments prior to their maturity without incurring a loss, which would have a material adverse effect on our business, operating results and financial condition.
Our business is subject to the risks of earthquakes, fire, floods and other natural catastrophic events, and to interruption by manmade problems such as network security breaches, computer software or system errors or viruses, or terrorism.
Our corporate headquarters are located in the San Francisco Bay Area, and many of our development centers and contract manufacturers are located in eastern Asia, both regions known for seismic activity. A significant natural disaster, such as an earthquake, a fire or a flood, occurring near our headquarters, or near the facilities of our contract manufacturers, could have a material adverse impact on our business, operating results and financial condition. In addition, our support operations are largely concentrated in a single location in India. A natural disaster in this location could have a material adverse impact on our support operations. In addition, natural disasters, acts of terrorism or war could cause disruptions in our or our customers’ businesses, our suppliers’ or manufacturers’ operations or the economy as a whole. We also rely on IT systems to operate our business and to communicate among our workforce and with third parties. For example, we use business management and communication software products provided by third parties, such as Microsoft Online, SAP and salesforce.com, and security flaws or outages in such products would adversely affect our operations. Any disruption to these systems, whether caused by a natural disaster or by manmade problems, such as power disruptions, could adversely affect our business. To the extent that any such disruptions result in delays or cancellations of customer orders or impede our suppliers’ and/or our manufacturers’ ability to timely deliver our products and product components, or the deployment of our products, our business, operating results and financial condition would be adversely affected.
System security risks, data protection breaches, and cyber-attacks on our systems or solutions could compromise our proprietary information, or information of our customers, disrupt our internal operations and harm public perception of our solutions, which could cause our business and reputation to suffer, create additional liabilities and have a material adverse impact on our financial results and stock price.
In the ordinary course of business, we store sensitive data on our internal systems, networks and servers and also utilize third-party cloud services. This data includes intellectual property, proprietary business information and customer and user data, which may include personally identifiable information. Additionally, we design and sell solutions that allow our customers to wirelessly access sensitive data on their own systems and to remotely manage and operate networks and applications that contain, transmit and store a variety of information. Our solutions incorporate complex technology and must operate and support a wide range of mobile devices that use Wi-Fi as well as the complex applications that run on those devices, which use multiple communication industry standards. In addition, the amount of data we store for our users on our servers, including personal information, has been increasing.
The secure maintenance of sensitive information on our own networks and with our third-party cloud services, and the intrusion protection features of our solutions are both important to our operations and business strategy. We use data encryption and other security measures to protect our systems and data, and we include various security mechanisms in our products and services, but these security measures cannot provide absolute protection against breaches and attacks. For example, we use encryption and authentication technologies to secure the transmission and storage of data and prevent third party access to data or accounts, but these security measures are subject to third-party security breaches, employee error, malfeasance, faulty password management, or other irregularities. Third parties may fraudulently induce an employee or customer into disclosing user names, passwords or other sensitive information, or otherwise illicitly obtain that type of information, which may in turn be used to access our IT systems and the data located there.
Companies are facing a wide variety of attacks from computer “hackers” who develop and deploy destructive software programs, such as viruses and worms, to attack networks. We are likely to face similar threats that target both our internal systems, our solutions and third-party cloud services, which, in turn, may threaten our customers' networks and data. Because the techniques used by hackers to access or sabotage networks are becoming increasingly sophisticated, change frequently and generally are not recognized until launched against a target, it is virtually impossible for us to entirely eliminate this risk despite deploying security measures.
19
Any destructive or intrusive breach of our internal systems or third-party cloud services could compromise our networks, creating system disruptions or slowdowns, and the information stored on our networks could be accessed, publicly disclosed, lost or stolen. Additionally, an effective attack on our solutions could disrupt the proper functioning of our solutions, allow unauthorized access to sensitive, proprietary or confidential information of our customers, disrupt or temporarily interrupt customers' networking traffic, or cause other destructive outcomes, including the theft of information sufficient to engage in fraudulent financial transactions. If any of these types of security breaches were to occur, our relationships with our business partners and customers could be materially damaged, our reputation and brand could be materially harmed, use of our solutions could decrease, and we could be exposed to a risk of loss or litigation and possible liability. In addition, incidents involving unauthorized access to or improper use of user information could cause government authorities to initiate legal or regulatory actions against us in connection with such incidents, which could cause us to incur significant expense and liability or result in orders or consent decrees forcing us to modify our business practices. The risk that these types of events could seriously harm our business is likely to increase as we continue to expand the number of cloud-based solutions we offer.
If an actual or perceived breach of security occurs in our network or cloud-based offerings, or in the network of a customer using our solutions, regardless of whether the breach is attributable to our solutions, the market perception of the effectiveness of our solutions could be harmed and could impact our business, operating results and financial condition. Such breach or perceived breach could result in claims by channel partners and end customers for losses that they sustain, including potentially losses resulting from security breaches of our systems, our end customers' networks and/or downtime of those networks. If channel partners or end customers make these types of claims, we may expend significant additional resources in order to help correct the problem. The economic costs to us to eliminate or alleviate security vulnerabilities or breaches could be significant and may be difficult to anticipate or measure because the damage or resources may differ based on attacker, method of attack, network or solution that is or may be attacked.
Because of the nature of information that may pass through or be stored on our solutions or networks, we and our end customers may be subject to complex and evolving U.S. and foreign laws and regulations regarding privacy, data protection and other matters and violations of these complex and dynamic laws, rules and regulations may result in claims, changes to our business practices, monetary penalties, increased costs of operations, and/or other harms to our business.
There has been an increase in laws in Europe, the U.S. and elsewhere imposing requirements for the handling of personal data, including data of employees, consumers and business contacts as well as privacy-related matters. For example, several U.S. states have adopted legislation requiring companies to protect the security of personal information that they collect from consumers over the Internet, and more states may adopt similar legislation in the future. Foreign data protection, privacy, and other laws and regulations can be more restrictive than those in the U.S. The U.S. Department of Commerce and European Commission agreed to an updated framework to regulate transatlantic data flows, referred to as the EU-US Privacy Shield, in February 2016. The new Privacy Shield will provide stronger obligations on companies in the U.S. to protect the personal data of Europeans and stronger monitoring and enforcement by U.S. agencies. However, final decisions and rules to implement the Privacy Shield are not yet in place and there continues to be uncertainty regarding if and when such implementation would occur and the regulation of transatlantic data flows before such implementation. For example, the European Commission may continue its consideration, and potentially adopt data protection regulations that may include operational requirements for companies that receive personal data that are different than those currently in place in the European Union, and that may also include significant penalties for non-compliance.
In addition, some countries are considering legislation requiring local storage and processing of data that, if enacted, could increase the cost and complexity of offering our solutions or maintaining our business operations in those jurisdictions. The introduction of new solutions or expansion of our activities in certain jurisdictions may subject us to additional laws and regulations. Our channel partners and end customers also may be subject to such laws and regulations in the use of our products and services.
These U.S. federal and state and foreign laws and regulations, which often can be enforced by private parties or government entities, are constantly evolving. In addition, the application and interpretation of these laws and regulations are often uncertain, and may be interpreted and applied inconsistently from country to country and inconsistently with our current policies and practices and may be contradictory with each other. For example, a government entity in one jurisdiction may demand the transfer of information forbidden from transfer by a government entity in another jurisdiction. If our actions were determined to be in violation of any of these disparate laws and regulations, in addition to the possibility of fines, we could be ordered to change our data practices, which could have an adverse effect on our business and results of operations and financial condition. There is also a risk that we, directly or as the result of a third-party service provider we use, could be found to have failed to comply with the laws or regulations applicable in a jurisdiction regarding the collection, consent, handling, transfer, or disposal of personal data, which could subject us to fines or other sanctions, as well as adverse reputational impact.
Compliance with these existing and proposed laws and regulations can be costly, increase our operating costs and require significant management time and attention, and failure to comply can result in negative publicity and subject us to inquiries or investigations, claims or other remedies, including fines or demands that we modify or cease existing business practices. Channel partners and end customers may demand or request additional functionality in our products or services that they believe are necessary or appropriate to comply with such laws and regulations, which can cause us to incur significant additional costs and can delay or impede the development of new solutions. In addition, there is a risk that failures in systems designed to protect private, personal or proprietary data held by us or our channel partners and end customers using our solutions will allow such data to be disclosed to or seen by others, resulting in application of regulatory penalties, enforcement actions, remediation obligations, private litigation by parties whose data were improperly disclosed, or claims from our channel partners and end customers for costs or damages they incur.
20
New regulations or standards, or changes in existing regulations or standards, or newly issued interpretations or enforcement of such regulations or standards, in the United States or internationally related to our products may result in unanticipated costs or liabilities, which could have a material adverse effect on our business, results of operations and future sales, and could place additional burdens on the operations of our business.
Our products are subject to governmental regulations in a variety of jurisdictions. In order to achieve and maintain market acceptance, our products must continue to comply with these regulations as well as a significant number of industry standards. In the United States, our products must comply with various regulations defined by the FCC, Underwriters Laboratories and others. We must also comply with similar international regulations. For example, our wireless communication products operate through the transmission of radio signals, and radio emissions are subject to regulation in the United States and in other countries in which we do business. In the United States, various federal agencies including the Center for Devices and Radiological Health of the Food and Drug Administration, the FCC, the Occupational Safety and Health Administration and various state agencies have promulgated regulations that concern the use of radio/electromagnetic emissions standards. Member countries of the European Union have enacted similar standards concerning electrical safety and electromagnetic compatibility and emissions, and chemical substances and use standards.
As these regulations and standards evolve, and if new regulations or standards are implemented, we will be required to modify our products or develop and support new versions of our products, and our compliance with these regulations and standards may become more burdensome. The failure of our products to comply, or delays in compliance, with the various existing and evolving industry regulations and standards could prevent or delay introduction of our products, which could harm our business. End customer uncertainty regarding future policies may also affect demand for communications products, including our products. If existing laws or regulations regarding the use of our products or services are enforced in a manner not contemplated by our end customers, it could expose them or us to liability and could have a material adverse effect on our business, operating results and financial condition. Moreover, channel partners or end customers may require us, or we may otherwise deem it necessary or advisable, to alter our products to address actual or anticipated changes in the regulatory environment. Our inability to alter our products to address these requirements and any regulatory changes may have a material adverse effect on our business, operating results and financial condition.
We are evaluating and may adopt a corporate structure more closely aligned with the international nature of our business activities, which will require us to incur expenses but could fail to achieve the intended benefits.
We continue to consider reorganizing our corporate structure and intercompany relationships to more closely align with the international nature of our business activities. This proposed corporate structure may result in a reduction in our overall effective tax rate through changes in how we use our intellectual property, international procurement, and sales operations. This proposed corporate structure may also allow us to achieve financial and operational efficiencies. These efforts will require us to incur expenses in the near term for which we may not realize related benefits. If the intended structure is not accepted by the applicable taxing authorities or changes in domestic and international tax laws negatively impact the proposed structure, including proposed legislation to reform U.S. taxation of international business activities, or we do not operate our business consistent with the proposed structure and applicable tax provisions, we may fail to achieve the financial and operational efficiencies that we anticipate as a result of the proposed structure and our future financial condition and results of operations may be negatively impacted.
Risks Related to Our International Operations
Our international operations expose us to additional business risks and failure to manage these risks may adversely affect our international revenue.
We derive a significant portion of our revenues from customers outside the United States and we are, therefore, subject to risks associated with having worldwide operations. For the years ended December 31, 2015, 2014 and 2013, 52%, 51% and 55% of our revenue, respectively, was attributable to our international customers. As of December 31, 2015, approximately 54% of our full-time employees were located abroad. We expect that our international activities will be dynamic over the foreseeable future as we continue to pursue opportunities in international markets, which will require significant management attention and financial resources. In addition, fluctuations in international economic environments, including recent Asian market instability and slowing growth rates, may adversely affect our results of operations, cash flows and stock price.
As we expand the marketing, selling, and supporting of our products and services internationally, we must hire and train experienced personnel to staff and manage our foreign operations. To the extent that we experience difficulties in recruiting, training, managing, and retaining an international staff, and specifically staff related to sales management and sales personnel, we may experience difficulties in sales productivity in foreign markets. In addition, business practices in the international markets that we serve may differ from those in the United States and may require us to include non-standard terms in customer contracts, such as extended payment or warranty terms. To the extent that we may enter into contracts with our international customers in the future that include non-standard terms related to payment, warranties or performance obligations, our operating results may be adversely impacted. International operations are subject to other inherent risks and our future results could be adversely affected by a number of factors, including:
• | tariffs and trade barriers, export regulations and other regulatory or contractual limitations on our ability to sell or develop our products in certain foreign markets; |
• | requirements or preferences for domestic products, which could reduce demand for our products; |
• | differing technical standards, existing or future regulatory and certification requirements and required product features and functionality; |
21
• | management communication and integration problems related to entering new markets with different languages, cultures and political systems; |
• | difficulties in enforcing contracts and collecting accounts receivable, and longer payment cycles, especially in emerging markets; |
• | heightened risks of unfair or corrupt business practices in certain geographies and of improper or fraudulent sales arrangements that may impact financial results and result in restatements of, and irregularities in, financial statements; |
• | improper or illegal activities of third party agents or consultants purporting to act on our behalf; |
• | difficulties and costs of staffing and managing foreign operations; |
• | the uncertainty of protection for intellectual property rights in some countries; |
• | potentially adverse tax consequences, including regulatory requirements regarding our ability to repatriate profits to the United States; |
• | added legal compliance obligations and complexity; |
• | the increased cost of terminating employees in some countries; and |
• | political and economic instability and terrorism. |
To the extent we continue to expand our business globally, our success will depend, in large part, on our ability to anticipate and manage effectively these and other risks associated with our international operations. Our failure to manage any of these risks successfully could harm our international operations and reduce our international sales, adversely affecting our business, operating results and financial condition.
We may not successfully sell our products in certain geographic markets or develop and manage new sales channels in accordance with our business plan.
We expect to continue to sell our products to a broader end customer base, including certain geographic markets where we do not have significant current business. To succeed in certain of these markets, we believe we will need to develop and manage new sales channels and distribution arrangements. We may not be successful in developing and managing such channels, in further penetrating certain geographic regions, or reaching a broader customer base. Failure to develop or manage additional sales channels effectively would limit our ability to succeed in these markets and could adversely affect our ability to grow our customer base and revenue.
We are exposed to fluctuations in currency exchange rates, which could negatively affect our financial condition and operating results.
To date, substantially all of our international sales have been denominated in U.S. dollars; however, most of our expenses associated with our international operations are denominated in local currencies. As a result, a decline in the value of the U.S. dollar relative to the value of these local currencies could have a material adverse effect on the gross margins and profitability of our international operations. Conversely, an increase in the value of the U.S. dollar relative to the value of these local currencies results in our products being more expensive to potential customers and could have an adverse impact on our pricing or our ability to sell our products internationally. To date, we have not used risk management techniques to hedge the risks associated with these fluctuations. Even if we were to implement hedging strategies, not every exposure can be hedged and, where hedges are put in place based on expected foreign currency exchange exposure, they are based on forecasts that may vary or that may later prove to have been inaccurate. As a result, fluctuations in foreign currency exchange rates or our failure to successfully hedge against these fluctuations could have a material adverse effect on our operating results and financial condition.
Failure to comply with the U.S. Foreign Corrupt Practices Act and similar laws associated with our activities outside the United States could subject us to penalties and other adverse consequences.
A significant portion of our revenues are and will be from jurisdictions outside of the United States. As a result, we are subject to the U.S. Foreign Corrupt Practices Act, or the FCPA, which generally prohibits U.S. companies and their intermediaries from making corrupt payments to foreign officials for the purpose of directing, obtaining or keeping business, and requires companies to maintain reasonable books and records and a system of internal accounting controls. The FCPA applies to companies and individuals alike, including company directors, officers, employees and agents. Under the FCPA, U.S. companies may be held liable for the corrupt actions taken by employees, strategic or local partners or other representatives. In addition, the government may seek to rely on a theory of successor liability and hold us responsible for FCPA violations committed by companies or associated with assets which we acquire.
22
In many foreign countries where we operate, particularly in countries with developing economies, it may be a local custom for businesses to engage in practices that are prohibited by the FCPA or other similar laws and regulations. In contrast, we have implemented a company policy requiring our employees and consultants to comply with the FCPA and similar laws. We have conducted mandatory formal FCPA compliance training for all of our full time employees. Nevertheless, there can be no assurance that our employees, partners and agents, as well as those companies to which we outsource certain of our business operations, will not take actions in violation of the FCPA or our policies for which we may be ultimately held responsible. As a result of our rapid growth, our infrastructure to identify FCPA matters and monitor compliance is developing. If we or our intermediaries fail to comply with the requirements of the FCPA or similar legislation, governmental authorities in the U.S. and elsewhere could seek to impose civil and/or criminal fines and penalties which could have a material adverse effect on our business, operating results and financial conditions. We may also face collateral consequences such as debarment and the loss of our export privileges.
We are subject to governmental export and import controls that could impair our ability to compete in international markets due to licensing requirements and subject us to liability if we are not in compliance with applicable laws.
Our products and solutions are subject to export control and import laws and regulations, including the U.S. Export Administration Regulations, U.S. Customs regulations and various economic and trade sanctions regulations administered by the U.S. Treasury Department’s Office of Foreign Assets Controls. Exports of our products and solutions must be made in compliance with these laws and regulations. If we fail to comply with these laws and regulations, we and certain of our employees could be subject to substantial civil or criminal penalties, including the possible loss of export or import privileges, fines, which may be imposed on us and responsible employees or managers, and, in extreme cases, the incarceration of responsible employees or managers. In addition, if our channel partners, agents or consultants fail to obtain appropriate import, export or re-export licenses or authorizations, or make sales into restricted jurisdictions, we may also be adversely affected through reputational harm and penalties. Obtaining the necessary authorizations, including any required license, for a particular sale may be time-consuming, is not guaranteed and may result in the delay or loss of sales opportunities. Changes in our products or solutions or changes in applicable export or import laws and regulations may also create delays in the introduction and sale of our products and solutions in international markets, prevent our end customers with international operations from deploying our products and solutions or, in some cases, prevent the export or import of our products and solutions to certain countries, governments or persons altogether. Any change in export or import laws and regulations, shift in the enforcement or scope of existing laws and regulations, or change in the countries, governments, persons or technologies targeted by such laws and regulations, could also result in decreased use of our products and solutions, or in our decreased ability to export or sell our products and solutions to existing or potential end customers with international operations. Any decreased use of our products and solutions or limitation on our ability to export or sell our products and solutions would likely adversely affect our business, financial condition and results of operations.
Furthermore, we incorporate encryption technology into certain of our products and solutions. Various countries regulate the import of certain encryption technology, including through import permitting and licensing requirements, and have enacted laws that could limit our ability to distribute our products and solutions or could limit our customers’ ability to implement our products and solutions in those countries. Encryption products and solutions and the underlying technology may also be subject to export control restrictions. Governmental regulation of encryption technology and regulation of imports or exports of encryption products, or our failure to obtain required import or export approval for our products and solutions, when applicable, could harm our international sales and adversely affect our revenues. Compliance with applicable regulatory laws and regulations regarding the export of our products and solutions, including with respect to new releases of our solutions, may create delays in the introduction of our products and solutions in international markets, prevent our end customers with international operations from deploying our products and solutions throughout their globally-distributed systems or, in some cases, prevent the export of our products and solutions to some countries altogether. U.S. export control laws and economic sanctions programs also prohibit the shipment of certain products and services to countries, governments and persons that are subject to U.S. economic embargoes and trade sanctions. Even though we take precautions to prevent our products and solutions from being shipped or provided to U.S. sanctions targets, our products and solutions could be shipped to those targets or provided by third-parties despite such precautions. Any such shipment could have negative consequences, including government investigations, penalties and reputational harm. Furthermore, any new embargo or sanctions program, or any change in the countries, governments, persons or activities targeted by such programs, could result in decreased use of our products and solutions, or in our decreased ability to export or sell our products and solutions to existing or potential end customers, which would likely adversely affect our business and our financial condition.
Risks Related to Our Intellectual Property
Claims by others that we infringe their intellectual property rights could harm our business.
Our industry is characterized by vigorous protection and pursuit of intellectual property rights, which has resulted in protracted and expensive litigation for many companies. We are subject to claims and litigation by third parties that we infringe their intellectual property rights and we expect claims and litigation with respect to infringement to occur in the future. As our business expands and the number of products and competitors in our market increases and overlaps occur, we expect that infringement claims may increase in number and significance. Any claims or proceedings against us, whether meritorious or not, could be time-consuming, result in costly litigation, require significant amounts of management time or result in the diversion of significant operational resources, any of which could materially and adversely affect our business and operating results.
23
Intellectual property lawsuits are subject to inherent uncertainties due to the complexity of the technical issues involved, and we cannot be certain that we will be successful in defending ourselves against intellectual property claims. In addition, we currently have a limited portfolio of issued patents compared to our larger competitors, and therefore may not be able to effectively utilize our intellectual property portfolio to assert defenses or counterclaims in response to patent infringement claims or litigation brought against us by third parties. Further, we are subject to claims and litigation brought by patent assertion companies and other non-practicing entities who have no relevant products or revenues and against whom our patents provide no deterrence. Such claims distract resources and require us to incur significant litigation expenses to defend or to pay significant sums in settlement to avoid the costs of litigation even when such claims are not meritorious. Furthermore, many potential litigants have the capability to dedicate substantially greater resources to enforce their intellectual property rights and to defend claims that may be brought against them. In addition to incurring litigation and settlement costs, a successful claimant could secure a judgment that requires us to pay substantial damages or prevents us from distributing certain products or performing certain services. We might also be required to seek a license and pay royalties for the use of such intellectual property, which may not be available on commercially acceptable terms or at all. Alternatively, we may be required to develop non-infringing technology, which could require significant effort and expense and may ultimately not be successful.
If we are unable to protect our intellectual property rights, our competitive position could be harmed or we could be required to incur significant expenses to enforce our rights.
Our ability to compete effectively is dependent in part upon our ability to protect our proprietary technology. We protect our proprietary information and technology through licensing agreements, third-party nondisclosure agreements and other contractual provisions, as well as through patent, trademark, copyright and trade secret laws in the United States and similar laws in other countries. There can be no assurance that these protections will be available in all cases or will be adequate to prevent our competitors from copying, reverse engineering or otherwise obtaining and using our technology, proprietary rights or products. The laws of some foreign countries, including countries in which our products are sold or manufactured, are in many cases not as protective of intellectual property rights as those in the United States, and mechanisms for enforcement of intellectual property rights may be inadequate. In addition, third parties may seek to challenge, invalidate or circumvent our patents, trademarks, copyrights and trade secrets, or applications for any of the foregoing. There can be no assurance that our competitors will not independently develop technologies that are substantially equivalent or superior to our technology or design around our proprietary rights. We have focused patent, trademark, copyright and trade secret protection primarily in the United States, China, Taiwan and Europe. As a result, we may not have sufficient protection of our intellectual property in all countries where infringement may occur. In each case, our ability to compete could be significantly impaired.
To prevent substantial unauthorized use of our intellectual property rights, it may be necessary to prosecute actions for infringement and/or misappropriation of our proprietary rights against third parties, including previous employees that misappropriate our proprietary information upon departure from our company. Any such action could result in significant costs and diversion of our resources and management’s attention, and there can be no assurance that we will be successful in such action. Furthermore, many of our current and potential competitors have the ability to dedicate substantially greater resources to enforce their intellectual property rights than we do. Accordingly, despite our efforts, we may not be able to prevent third parties from infringing upon or misappropriating our intellectual property.
We are generally obligated to indemnify our channel partners and end customers for certain expenses and liabilities resulting from intellectual property infringement claims regarding our products and services, which could force us to incur substantial costs.
We have agreed, and expect to continue to agree, to indemnify our channel partners and end customers for certain intellectual property infringement claims regarding our products and services. As a result, in the case of infringement claims against these channel partners and end customers, we could be required to indemnify them for losses resulting from such claims or to refund amounts they have paid to us. Some of our channel partners and end customers have sought, and we expect that certain of our channel partners and end customers in the future may seek, indemnification from us in connection with infringement claims brought against them. In addition, some of our channel partners and end customers have tendered to us the defense of claims brought against them for infringement. We evaluate each such request on a case-by-case basis and we may not succeed in refuting all such claims. If a channel partner or end customer elects to invest resources in enforcing a claim for indemnification against us, we could incur significant costs disputing it. If we do not succeed in disputing it, we could face substantial liability.
We rely on the availability of third-party licenses. If these licenses are available to us only on less favorable terms or not at all in the future, our business and operating results would be harmed.
We have incorporated third-party licensed technology into our products. For example, our products incorporate certain technology that we license from Qualcomm. It may be necessary in the future to renew licenses relating to various aspects of these products or to seek additional licenses for existing or new products. There can be no assurance that the necessary licenses will be available on acceptable terms or at all. The inability to obtain certain licenses or other rights, or to obtain those licenses or rights on favorable terms, or the need to engage in litigation regarding these matters, could result in delays in product releases until such time, if ever, as equivalent technology could be identified, licensed or developed and integrated into our products and might have a material adverse effect on our business, operating results and financial condition. Moreover, the inclusion in our products of intellectual property licensed from third parties on a nonexclusive basis could limit our ability to protect our proprietary rights in our products.
24
Our use of open source software could impose limitations on our ability to commercialize our products.
Our products contain software modules licensed for use from third-party authors under open source licenses, such as Linux and Cassandra. Use and distribution of open source software may entail greater risks than use of third-party commercial software, as open source licensors generally do not provide warranties or other contractual protections regarding infringement claims or the quality of the code. Some open source licenses contain requirements that we make available source code for modifications or derivative works we create based upon the type of open source software we use. If we combine our proprietary software with open source software in a certain manner, we could, under certain of the open source licenses, be required to release the source code of our proprietary software to the public. This could allow our competitors to create similar products with lower development effort and time, and ultimately could result in a loss of product sales for us.
Although we monitor our use of open source software, the terms of many open source licenses have not been interpreted by U.S. courts, and there is a risk that such licenses could be construed in a manner that could impose unanticipated conditions or restrictions on our ability to commercialize our products. In such event, we could be required to seek licenses from third parties in order to continue offering our products, to re-engineer our products or to discontinue the sale of our products in the event re-engineering cannot be accomplished on a timely basis, any of which could materially and adversely affect our business and operating results.
Risks Related to Ownership of Our Common Stock
The price of our common stock has been and will likely continue to be volatile.
The trading price of our common stock has fluctuated, and is likely to continue to fluctuate, substantially. The trading price of our common stock depends on a number of factors, including those described in this “Risk Factors” section, many of which are beyond our control and may not be related to our operating performance.
Since shares of our common stock were sold at our initial public offering in November 2012 at a price of $15.00 per share, our stock price has ranged as low as $8.65 and as high as $26.50 through December 31, 2015. Factors that may have and could cause fluctuations in the trading price of our common stock include the following:
• | price and volume fluctuations in the overall stock market from time to time; |
• | volatility in the market prices and trading volumes of high technology stocks; |
• | changes in operating performance and stock market valuations of other technology companies generally, or those in our industry in particular; |
• | sales of shares of our common stock by us or our stockholders, including our officers, directors and other holders of a significant percentage of our shares; |
• | failure of financial analysts to maintain coverage of us, changes in ratings or reports regarding our company issued by such analysts, including changes in the financial estimates published by any analysts who follow our company, or our failure to meet these estimates or the expectations of investors; |
• | the financial projections we may provide to the public, any changes in those projections or our failure to meet those projections; |
• | announcements by us or our competitors of new products or new or terminated significant contracts, commercial relationships or capital commitments; |
• | the public’s reaction to our press releases, other public announcements and filings with the SEC; |
• | rumors and market speculation involving us or other companies in our industry; |
• | actual or anticipated changes in our results of operations or fluctuations in our operating results; |
• | actual or anticipated developments in our business or our competitors’ businesses or the competitive landscape generally; |
• | litigation involving us, our industry or both or investigations by regulators into our operations or those of our competitors; |
• | developments or disputes concerning our intellectual property or other proprietary rights; |
• | announced or completed acquisitions of businesses or technologies by us or our competitors; |
• | new laws or regulations or new interpretations of existing laws or regulations applicable to our business; |
• | changes in accounting standards, policies, guidelines, interpretations or principles; |
• | any major change in our management; |
25
• | general economic conditions and slow or negative growth of our markets; and |
• | other events or factors, including those resulting from war, incidents of terrorism or responses to these events. |
In addition, the stock market in general, and the market for technology companies in particular, have experienced extreme price and volume fluctuations that have often been unrelated or disproportionate to the operating performance of those companies. Broad market and industry factors may seriously affect the market price of our common stock, regardless of our actual operating performance. In addition, in the past, following periods of volatility in the overall market and the market prices of particular companies’ securities, securities class action litigations have often been instituted against these companies. Litigation of this type, if instituted against us, could result in substantial costs and a diversion of our management’s attention and resources.
Insiders continue to have substantial influence over us, which could limit a stockholder's ability to affect the outcome of key transactions, including a change of control.
As of December 31, 2015, our directors, executive officers and each of our stockholders who own greater than 5% of our outstanding common stock and their affiliates, in the aggregate, beneficially owned approximately 11.8% of the outstanding shares of our common stock. As a result, these stockholders, if acting together, will be able to influence matters requiring approval by our stockholders, including the election of directors and the approval of mergers, acquisitions or other extraordinary transactions. This concentration of ownership may have the effect of delaying, preventing or deterring a change of control of our company, could deprive our stockholders of an opportunity to receive a premium for their common stock as part of a sale of our company and might ultimately affect the market price of our common stock.
We do not intend to pay dividends for the foreseeable future.
We have never declared or paid any cash dividends on our common stock and do not intend to pay any cash dividends in the foreseeable future. We anticipate that we will retain all of our future earnings for use in the development of our business and for general corporate purposes. Any determination to pay dividends in the future will be at the discretion of our board of directors. Accordingly, investors must rely on sales of their common stock after price appreciation, which may never occur, as the only way to realize any future gains on their investments.
The requirements of being a public company may strain our resources, divert management’s attention and affect our ability to attract and retain qualified members of our board of directors.
We are subject to the reporting requirements of the Securities Exchange Act of 1934, as amended, or the Exchange Act, the Dodd-Frank Act, the listing requirements of the New York Stock Exchange and other applicable securities rules and regulations. Compliance with these rules and regulations may increase our legal and financial compliance costs, make some activities more difficult, time-consuming or costly, and increase demand on our systems and resources. The Sarbanes-Oxley Act requires, among other things, that we maintain effective disclosure controls and procedures and internal control over financial reporting. In order to maintain and, if required, improve our disclosure controls and procedures and internal control over financial reporting to meet this standard, significant resources and management oversight may be required. As a result, management’s attention may be diverted from other business concerns, which could harm our business and operating results. Although we have hired additional employees to comply with these requirements, we may need to hire more employees in the future, which will increase our costs and expenses.
In addition, changing laws, regulations and standards relating to corporate governance and public disclosure are creating uncertainty for public companies, increasing legal and financial compliance costs and making some activities more time consuming. These laws, regulations and standards are subject to varying interpretations, in many cases due to their lack of specificity, and, as a result, their application in practice may evolve over time as new guidance is provided by regulatory and governing bodies. This could result in continuing uncertainty regarding compliance matters and higher costs necessitated by ongoing revisions to disclosure and governance practices. We intend to invest resources to comply with evolving laws, regulations and standards, and this investment may result in increased general and administrative expenses and a diversion of management’s time and attention from revenue-generating activities to compliance activities. If our efforts to comply with new laws, regulations and standards differ from the activities intended by regulatory or governing bodies due to ambiguities related to practice, regulatory authorities may initiate legal proceedings against us and our business may be harmed.
These evolving laws, regulations and standards, and their interpretation, may cause increases in the cost of director and officer liability insurance, and we may be required to accept reduced coverage or incur substantially higher costs to obtain coverage. These factors could also make it more difficult for us to attract and retain qualified members of our board of directors and qualified executive officers.
26
We may acquire other businesses which could require significant management attention, disrupt our business, dilute stockholder value and adversely affect our operating results.
As part of our business strategy, we may continue to make investments in complementary companies, products or technologies. We may not be able to find suitable acquisition candidates, and we may not be able to complete such acquisitions on favorable terms, if at all. If we do complete significant acquisitions, we may not ultimately strengthen our competitive position or achieve our goals, and any acquisitions we complete could be viewed negatively by our end customers, investors and financial analysts. In addition, if we are unsuccessful at integrating such acquisitions, or the technologies associated with such acquisitions, into our company, the revenue and operating results of the combined company could be adversely affected. Any integration process may require significant time and resources, and we may not be able to manage the process successfully. We may not successfully evaluate or utilize the acquired technology or personnel, or accurately forecast the financial impact of an acquisition transaction, including accounting charges. We may have to pay cash, incur debt or issue equity securities to pay for any such acquisition, each of which could adversely affect our financial condition or the value of our common stock. The sale of equity or issuance of debt to finance any such acquisitions could result in dilution to our stockholders. The incurrence of indebtedness would result in increased fixed obligations and could also include covenants or other restrictions that would impede our ability to manage our operations.
Our future capital needs are uncertain, and we may need to raise additional funds in the future. If we require additional funds in the future, those funds may not be available on acceptable terms, or at all.
We believe that our existing cash, cash equivalents and short-term investments will be sufficient to meet our anticipated cash requirements for at least the next 12 months. We may, however, need to raise substantial additional capital to:
• | fund our operations; |
• | continue our research and development; |
• | develop and commercialize new products; |
• | acquire companies, in-licensed products or intellectual property; or |
• | expand sales and marketing activities. |
Our future funding requirements will depend on many factors, including:
• | market acceptance of our products and services; |
• | the cost of our research and development activities; |
• | the cost of defending, in litigation or otherwise, claims that we infringe third-party patents or violate other intellectual property rights; |
• | the cost and timing of establishing additional sales, marketing and distribution capabilities; |
• | the cost and timing of establishing additional technical support capabilities; |
• | the effect of competing technological and market developments; and |
• | the market for different types of funding and overall economic conditions. |
We may require additional funds in the future, and we may not be able to obtain those funds on acceptable terms, or at all. If we raise additional funds by issuing equity securities, our stockholders may experience dilution. Debt financing, if available, may involve covenants restricting our operations or our ability to incur additional debt. Any debt or additional equity financing that we raise may contain terms that are not favorable to us or our stockholders.
If we do not have, or are not able to obtain, sufficient funds, we may have to delay development or commercialization of our products or license to third parties the rights to commercialize products or technologies that we would otherwise seek to commercialize. If we raise additional funds through collaboration and licensing arrangements with third parties, it may be necessary to relinquish some rights to our technologies or our products, or to grant licenses on terms that are not favorable to us. If we are unable to raise adequate funds, we may have to liquidate some or all of our assets, or delay, reduce the scope of or eliminate some or all of our development programs. We also may have to reduce marketing, customer support or other resources devoted to our products or cease operations. Any of these actions could harm our operating results.
27
If we are unable to implement and maintain effective internal control over financial reporting in the future, investor confidence in our company may be adversely effected and, as a result, the value of our common stock may decline.
If we are unable to maintain adequate internal controls for financial reporting in the future, or if our auditors are unable to attest to management’s report on the effectiveness of our internal controls over financial reporting or determine we have a material weakness in our internal controls, as required by Section 404 of the Sarbanes-Oxley Act, we could lose investor confidence in the accuracy and completeness of our financial reports, which would cause the price of our common stock to decline.
If financial or industry analysts do not publish research or reports about our business, or if they issue an adverse or misleading opinion regarding our common stock, our stock price and trading volume could decline.
The trading market for our common stock may be influenced by the research and reports that industry or financial analysts publish about us or our business. We do not control these analysts or the content and opinions included in their reports. We may not attract sufficient research coverage or maintain coverage of analysts that currently publish reports regarding our business. Additionally, the analysts who publish information about our common stock have had relatively little experience with our company, which could affect their ability to accurately forecast our results and make it more likely that we fail to meet their estimates. In the event we obtain industry or financial analyst coverage, if any of the analysts who cover us issue an adverse or misleading opinion regarding our stock price, our stock price would likely decline. If one or more of these analysts cease coverage of our company or fail to publish reports on us regularly, we could lose visibility in the financial markets, which in turn could cause our stock price or trading volume to decline.
Certain provisions in our charter documents and under Delaware law could limit attempts by our stockholders to replace or remove members of our board of directors or current management and may adversely affect the market price of our common stock.
Our restated certificate of incorporation and our restated bylaws may have the effect of delaying or preventing a change of control or changes in our board or directors or management. These provisions include the following:
• | our board of directors has the right to elect directors to fill a vacancy created by the expansion of the board of directors or the resignation, death or removal of a director, which prevents stockholders from being able to fill vacancies on our board of directors; |
• | our stockholders may not act by written consent or call special stockholders’ meetings; as a result, a holder, or holders, controlling a majority of our capital stock would not be able to take certain actions other than at annual stockholders’ meetings or special stockholders’ meetings called by the board of directors, the chairman of the board, the chief executive officer or the president; |
• | our certificate of incorporation prohibits cumulative voting in the election of directors, which limits the ability of minority stockholders to elect director candidates; |
• | stockholders must provide advance notice and additional disclosures in order to nominate individuals for election to the board of directors or to propose matters that can be acted upon at a stockholders’ meeting, which may discourage or deter a potential acquirer from conducting a solicitation of proxies to elect the acquirer’s own slate of directors or otherwise attempting to obtain control of our company; and |
• | our board of directors may issue, without stockholder approval, shares of undesignated preferred stock; the ability to issue undesignated preferred stock makes it possible for our board of directors to issue preferred stock with voting or other rights or preferences that could impede the success of any attempt to acquire us. |
As a Delaware corporation, we are also subject to certain Delaware anti-takeover provisions. Under Delaware law, a corporation may not engage in a business combination with any holder of 15% or more of its capital stock unless the holder has held the stock for three years or, among other things, the board of directors has approved the transaction. Our board of directors could rely on Delaware law to prevent or delay an acquisition of us.
Certain of our executive officers or directors may be entitled to accelerated vesting of their stock options pursuant to the terms of their employment arrangements or option grants upon a change of control of the Company. In addition to the arrangements currently in place with some of our executive officers, we may enter into similar arrangements in the future with other officers. Such arrangements could delay or discourage a potential acquisition of the Company.
ITEM 1B. UNRESOLVED STAFF COMMENTS
None.
ITEM 2. PROPERTIES
Our headquarters currently occupy approximately 95,000 square feet of office space in Sunnyvale, California pursuant to a lease that expires in 2022. We also maintain one additional facility in Sunnyvale, California totaling approximately 12,000 square feet used for marketing purposes and for research and development testing. Our main international offices are in Taiwan, India, China, Singapore, the
28
United Kingdom and Hong Kong. We believe that these facilities are suitable and adequate to meet our current needs. We intend to add new facilities or expand existing facilities as we add employees and we believe that suitable additional or substitute space will be available as needed to accommodate any such expansion of our operations.
ITEM 3. LEGAL PROCEEDINGS
We are party to litigation and subject to claims arising in the ordinary course of business, including claims related to intellectual property infringement. Although the results of litigation and claims cannot be predicted with certainty, we currently believe that the final outcome of these matters will not have a material adverse effect on our business. Regardless of the outcome, litigation can have an adverse impact on us because of defense and settlement costs, diversion of management resources and other factors.
ITEM 4. MINE SAFETY DISCLOSURES
Not applicable.
29
PART II
ITEM 5. MARKET FOR REGISTRANT'S COMMON EQUITY, RELATED STOCKHOLDER MATTERS, AND ISSUER PURCHASES OF EQUITY SECURITIES
Market Information
Our common stock, $0.001 par value per share, has been trading on the New York Stock Exchange since November 16, 2012, under the symbol “RKUS.”
Holders of Record
As of December 31, 2015 there were approximately 200 holders of record of our common stock. Because many of our shares of common stock are held by brokers and other institutions on behalf of stockholders, we are unable to estimate the total number of stockholders represented by these record holders.
Price Range of Our Common Stock
The following table sets forth the reported high and low sales prices of our common stock, as quoted on the New York Stock Exchange:
Year Ended December 31, 2014 | High | Low | |||||
First Quarter | $ | 15.55 | $ | 11.17 | |||
Second Quarter | $ | 12.48 | $ | 8.65 | |||
Third Quarter | $ | 15.21 | $ | 10.30 | |||
Fourth Quarter | $ | 14.05 | $ | 10.82 | |||
Year Ended December 31, 2015 | |||||||
First Quarter | $ | 13.10 | $ | 9.11 | |||
Second Quarter | $ | 13.24 | $ | 10.07 | |||
Third Quarter | $ | 12.58 | $ | 9.62 | |||
Fourth Quarter | $ | 13.50 | $ | 10.11 | |||
Dividend Policy
We have never declared or paid, and do not anticipate declaring or paying in the foreseeable future, any cash dividends on our capital stock. Any future determination as to the declaration and payment of dividends, if any, will be at the discretion of our board of directors, subject to applicable laws and will depend on then existing conditions, including our financial condition, operating results, contractual restrictions, capital requirements, business prospects and other factors our board of directors may deem relevant.
30
Stock Price Performance Graph
This performance graph shall not be deemed “filed” for purposes of Section 18 of the Securities Exchange Act of 1934, as amended (the "Exchange Act"), or incorporated by reference into any filing of Ruckus Wireless, Inc. under the Securities Act of 1933, as amended, or the Exchange Act, except as shall be expressly set forth by specific reference in such filing.
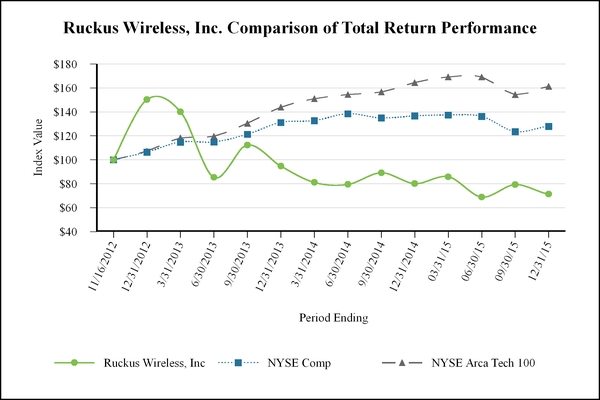
This graph compares, for the period ended December 31, 2015, the cumulative total return on our common stock, the NYSE Composite Index and the NYSE Arca Tech 100 Index. The graph assumes $100 was invested on November 16, 2012, in the common stock of Ruckus Wireless, Inc., the NYSE Composite Index and the NYSE Arca Tech 100 Index, and assumes the reinvestment of any dividends. The stock price performance on the following graph is not necessarily indicative of future stock price performance.
Company/Index | 11/16/2012 | 12/31/2012 | 12/31/2013 | 12/31/14 | 12/31/2015 | ||||||||||||||
Ruckus Wireless, Inc. | $ | 100.00 | $ | 150.20 | $ | 94.67 | $ | 80.13 | $ | 71.40 | |||||||||
NYSE Comp | $ | 100.00 | $ | 106.45 | $ | 131.13 | $ | 136.66 | $ | 127.89 | |||||||||
NYSE Arca Tech 100 | $ | 100.00 | $ | 107.25 | $ | 143.98 | $ | 164.45 | $ | 161.30 | |||||||||
31
ITEM 6. SELECTED CONSOLIDATED FINANCIAL DATA
The selected consolidated statement of operations data for the years ended December 31, 2015, 2014, and 2013 and the consolidated balance sheet data as of December 31, 2015 and 2014 are derived from our audited consolidated financial statements included elsewhere in this report. The selected consolidated statement of operations data for 2012 and 2011 and the consolidated balance sheet data as of December 31, 2013, 2012 and 2011 are derived from audited financial statements not included in this report.
Our historical results are not necessarily indicative of the results that may be expected in the future. The selected consolidated financial data below should be read in conjunction with the section entitled Item 7, “Management's Discussion and Analysis of Financial Condition and Results of Operations” and Item 8, “Consolidated Financial Statements and Supplementary Data.”
Years Ended December 31, | |||||||||||||||||||
2015 | 2014 | 2013 | 2012 | 2011 | |||||||||||||||
Consolidated Statements of Operations Data: | (in thousands, except per share data) | ||||||||||||||||||
Revenue: | |||||||||||||||||||
Product | $ | 343,659 | $ | 303,446 | $ | 245,935 | $ | 201,913 | $ | 114,684 | |||||||||
Service | 29,717 | 23,473 | 17,132 | 12,740 | 5,339 | ||||||||||||||
Total revenue | 373,376 | 326,919 | 263,067 | 214,653 | 120,023 | ||||||||||||||
Cost of revenue: | |||||||||||||||||||
Product | 105,314 | 90,651 | 78,344 | 70,478 | 44,705 | ||||||||||||||
Service | 14,741 | 12,454 | 9,844 | 5,306 | 2,502 | ||||||||||||||
Total cost of revenue | 120,055 | 103,105 | 88,188 | 75,784 | 47,207 | ||||||||||||||
Gross profit | 253,321 | 223,814 | 174,879 | 138,869 | 72,816 | ||||||||||||||
Operating expenses: | |||||||||||||||||||
Research and development | 94,234 | 77,164 | 61,783 | 43,821 | 24,892 | ||||||||||||||
Sales and marketing | 109,864 | 98,634 | 79,185 | 56,209 | 32,659 | ||||||||||||||
General and administrative | 41,799 | 33,622 | 33,752 | 20,237 | 8,524 | ||||||||||||||
Total operating expenses | 245,897 | 209,420 | 174,720 | 120,267 | 66,075 | ||||||||||||||
Operating income | 7,424 | 14,394 | 159 | 18,602 | 6,741 | ||||||||||||||
Interest income (expense) | 701 | 199 | 187 | (472 | ) | (1,025 | ) | ||||||||||||
Other expense, net | (524 | ) | (463 | ) | (456 | ) | (3,664 | ) | (1,215 | ) | |||||||||
Income (loss) before income taxes | 7,601 | 14,130 | (110 | ) | 14,466 | 4,501 | |||||||||||||
Income tax expense (benefit) | 2,911 | 5,940 | (1,899 | ) | (17,238 | ) | 315 | ||||||||||||
Net income | $ | 4,690 | $ | 8,190 | $ | 1,789 | $ | 31,704 | $ | 4,186 | |||||||||
Net income attributable to common stockholders | $ | 4,690 | $ | 8,190 | $ | 1,789 | $ | 9,036 | $ | 379 | |||||||||
Net income per share attributable to common stockholders: | |||||||||||||||||||
Basic | $ | 0.05 | $ | 0.10 | $ | 0.02 | $ | 0.36 | $ | 0.02 | |||||||||
Diluted | $ | 0.05 | $ | 0.09 | $ | 0.02 | $ | 0.24 | $ | 0.02 | |||||||||
Weighted average shares used in computing net income per share attributable to common stockholders: | |||||||||||||||||||
Basic | 87,418 | 82,908 | 76,744 | 24,847 | 15,584 | ||||||||||||||
Diluted | 95,851 | 93,668 | 93,361 | 37,775 | 23,269 | ||||||||||||||
32
Stock-based compensation expense included in the consolidated statements of operations data above was as follows:
Years Ended December 31, | |||||||||||||||||||
2015 | 2014 | 2013 | 2012 | 2011 | |||||||||||||||
(in thousands) | |||||||||||||||||||
Cost of revenue | $ | 1,097 | $ | 1,092 | $ | 818 | $ | 243 | $ | 148 | |||||||||
Research and development | 9,759 | 9,099 | 6,738 | 2,409 | 1,055 | ||||||||||||||
Sales and marketing | 7,252 | 7,180 | 4,922 | 1,787 | 471 | ||||||||||||||
General and administrative | 10,685 | 9,223 | 6,637 | 4,012 | 594 | ||||||||||||||
Total stock-based compensation expense | $ | 28,793 | $ | 26,594 | $ | 19,115 | $ | 8,451 | $ | 2,268 | |||||||||
As of December 31, | |||||||||||||||||||
2015 | 2014 | 2013 | 2012 | 2011 | |||||||||||||||
Consolidated Balance Sheet Data: | (in thousands) | ||||||||||||||||||
Cash and cash equivalents | $ | 69,687 | $ | 56,083 | $ | 91,282 | $ | 133,386 | $ | 11,200 | |||||||||
Short-term investments | 160,791 | 142,706 | 60,878 | — | — | ||||||||||||||
Working capital (deficit) | 252,943 | 213,576 | 160,435 | 141,093 | (2,927 | ) | |||||||||||||
Total assets | 418,821 | 353,994 | 283,222 | 243,839 | 65,690 | ||||||||||||||
Deferred revenue, current and non-current | 51,126 | 49,785 | 40,237 | 40,486 | 17,181 | ||||||||||||||
Redeemable convertible preferred stock(1) | — | — | — | — | 51,257 | ||||||||||||||
Total stockholders’ equity (deficit)(1) | $ | 311,533 | $ | 259,649 | $ | 203,849 | $ | 170,211 | $ | (44,743 | ) | ||||||||
(1) The outstanding redeemable convertible preferred stock converted to common shares following the close of the Company’s initial public offering in November 2012.
33
ITEM 7. MANAGEMENT’S DISCUSSION AND ANALYSIS OF FINANCIAL CONDITION AND RESULTS OF OPERATIONS
You should read the following discussion and analysis of our financial condition and results of operations together with the consolidated financial statements and related notes that are included elsewhere in this report. This discussion contains forward-looking statements based upon current expectations that involve risks and uncertainties. Our actual results may differ materially from those anticipated in these forward-looking statements as a result of various factors, including those set forth under Item 1A, “Risk Factors” and in other parts of this report.
Overview
Ruckus Wireless, Inc. (“Ruckus” or “we” or “the Company”) is a global supplier of advanced Wi-Fi solutions. Our solutions, which we call Smart Wi-Fi, are used by service providers and enterprises to solve a range of network capacity, coverage and reliability challenges associated with increasing wireless traffic demands created by the growth in the number of users equipped with more powerful smart wireless devices using increasingly data rich applications and services. We market and sell our products and technology directly and indirectly through a vast network of channel partners to a variety of service providers and enterprises around the world. Our Smart Wi-Fi solutions offer features and functionality such as enhanced reliability, consistent performance, extended range and massive scalability. Our products include high capacity controllers, indoor and outdoor access points, wireless bridges, controller software platforms, software management solutions including reporting and analytics and unique Wi-Fi-related cloud services, such as location-based positioning, and certificate-based security and on-boarding of Wi-Fi devices. These hardware and software products and services incorporate various elements of our proprietary technologies, including Smart Radio, SmartCast, SmartMesh and Smart Scaling, to enable high performance in a variety of challenging operating environments.
We sell our products to a broad range of service providers and enterprise end customers globally. Our products have been sold to over 65,300 end customers worldwide, including over 260 service providers. We generally sell to service providers and enterprises through a worldwide network of channel partners and systems integrators. Our enterprise end customers span a wide range of industries, including hospitality, education, warehousing and logistics, corporate enterprise, retail, state and local governments, healthcare and public venues, such as stadiums, convention centers, airports and major outdoor public areas. Our service provider end customers include mobile network operators, fixed line operators, cable companies and emerging “over the top” providers. These customers use our Smart Wi-Fi solutions in multiple ways to grow their businesses, including augmenting 3G/4G capacity, mobile data traffic offload to unlicensed spectrum, Wi-Fi access to increase network footprint, backhaul assets to provide mobility services to existing customers and providing managed Wi-Fi services to enterprise customers.
We sell our products globally through direct and indirect channels. We target both enterprises and service providers that require Wi-Fi solutions through our global force of sales personnel and systems engineers. They work with a vast network of value-added resellers and distributors, which we collectively refer to as channel partners, to reach and service our end customers. Our channel partners provide lead generation, pre-sales support, product fulfillment and, in certain circumstances, post-sales customer service and support. In some instances, service providers may also act as a channel partner for sales of our solutions to enterprises. Our sales personnel and systems engineers typically engage directly with selected large service providers and large enterprises whether or not product fulfillment involves our channel partners. In contrast, the majority of our enterprise sales are originated and completed by our channel partners with little or no direct engagement by us.
Each of our greater than 10% customers are third-party distributors. Our agreements with these distributors were made in the ordinary course of business and may be terminated with or without cause by either party with advance notice. Although we may experience a short-term disruption in the distribution of our products and a short-term decline in revenue if the agreement with any of these distributions was terminated, we believe that such termination would not have a material adverse effect on us and our subsidiaries, taken as a whole, because we have engaged or believe that we would be able to engage alternative distributors, resellers and other distribution channels to deliver our products to end customers within a quarter following the termination of any agreement with a distributor.
Service providers typically require long sales cycles, which generally range between one and three years, but can be longer. The sale to a large service provider usually begins with an evaluation, followed by one or more network trials, followed by vendor selection and finally deployment and testing. A large service provider will frequently issue a request for proposals to shortlist competitive suppliers prior to the network trials. Completion of several of these steps is substantially outside of our control, which causes our revenue patterns from large service providers to vary widely from period to period. After initial deployment, subsequent purchases of our products depend on the time frame of the service provider.
We perform some warehousing and delivery of products sold within the United States from our headquarters in Sunnyvale, California. We also outsource the warehousing and delivery of our products to a third-party logistics provider for worldwide fulfillment. We perform quality assurance for our products at our facilities around the world.
We believe the market for our Smart Wi-Fi solutions is growing rapidly and our intention is to continue to invest for long-term growth. We expect to continue to invest heavily in research and development to expand the capabilities of our solutions with respect to services providers and enterprises. We also plan to continue to make significant investments in our field sales and marketing activities, both by increasing our service provider focused direct sales force and by expanding our network of channel partners.
34
Industry Trends and Strategy
Enterprise Wi-Fi
The number of Wi-Fi enabled mobile devices is growing significantly. A multiplicity of new applications, devices, and vertical markets are all contributing to the growth of Wi-Fi across practically all regions.
The consumerization of IT and the resulting proliferation of smart devices and mobility have led to a rise in the adoption and expansion of Wi-Fi infrastructure and services. Mission-critical applications are now more easily available on smart mobile phones and tablets. Within the enterprise and across many industry sectors, users are increasingly bringing their own devices into the workplace, expecting the same level of access, security and service that they receive on corporate-issued devices. This “bring your own device” (“BYOD”) phenomenon is contributing to the requirement for added wireless capacity to support more concurrently connected devices. This increased reliance on the wireless infrastructure elevates its importance within the overall IT framework as network intelligence and reliable connectivity become strategic to the business rather than merely means to convenient internet access. In addition, the introduction of new standards, such as 802.11ac wave 1 and wave 2, have caused organizations to consider a refresh of Wi-Fi technology as part of their IT strategies.
Recent trends in mobility, consumerization, industry regulation and vertical-specific use cases have led to sharp growth in Wi-Fi network deployments in a vast array of public-facing environments, such as hospitality, education, healthcare, retail and public venues, such as stadiums, convention centers, airports and major metropolitan areas. Moreover, the emergence of Hotspot 2.0 compliant networks allow users to seamlessly connect to and roam between different Wi-Fi networks in a far simpler fashion. Consequently, the spread of smart mobile devices combined with an increasing appetite for wireless capacity anytime and anywhere with more sophisticated and latency-sensitive applications, such as streaming video and voice, is driving the market for more reliable Wi-Fi infrastructure products and services.
Organizations are also considering migrating to cloud-based managed Wi-Fi services as a way to further leverage investments in Wi-Fi infrastructure. Managed Wi-Fi services, such as the ability to use Wi-Fi to gather detailed user analytics, demographics and user location information, allow companies to better understand network traffic and user interactions. Armed with this knowledge, businesses look to enable value-added services leveraging their Wi-Fi networks to realize greater value from the cost and investment in Wi-Fi technology.
With the rising popularity and pervasive use of Wi-Fi, small businesses are beginning to desire better Wi-Fi to support the multitude of new media-rich applications, devices, and clients using their Wi-Fi networks. Like large enterprises, small businesses can benefit from greater usage of IT solutions in their business processes as well as to support growing customer demand. According to data published by the United States Small Business Administration, the United States alone had approximately 5.0 million small businesses (those with 100 employees or less) in 2012. These smaller organizations have traditionally relied on consumer-grade WLAN solutions that are available at a lower cost than traditional enterprise-class systems. However, these consumer-grade solutions, also known as small-office/home-office (“SOHO”) solutions, generally lack the reliability, security and functionality that small businesses require to support their growing needs. Enterprise-class, controller-based systems (either on premises or in the cloud) that deliver better performance and business-class reliability are available, however, these systems have been designed for larger enterprises with IT support and are often too costly or complex for small businesses.
Service Provider Wi-Fi
The growth in demand for Wi-Fi connectivity and services in the last several years has led to new and broadened deployments of Wi-Fi services by cable operators, mobile network operators and fixed-line service providers around the globe. This growth in demand for Wi-Fi by service providers has been driven by a number of factors, including:
• | the expansion in the market by fixed-line operators (including cable Multiple System Operators (“MSOs”)) expanding Wi-Fi coverage to give these operators a wireless broadband service extension beyond their wired networks; |
• | mobile operators seeking a platform for augmenting data services over their mobile networks and integrating Wi-Fi into their network to generate new services and offloading portions of their mobile data traffic from their 3G/4G networks to unlicensed spectrum; |
• | wireless Internet Service Providers (“ISPs”) deploying Wi-Fi hotspots in public areas; |
• | service providers beginning to offer voice services (Wi-Fi calling) over unlicensed spectrum; |
• | the development and deployment of Hotspot 2.0 technology as a means for achieving closer integration of Wi-Fi with broadband networks; and |
• | the introduction and growth in Wave 1 and Wave 2 802.11ac-capable client devices, which will drive network upgrade expenditure. |
35
The broadening of these service provider deployments has created a need for solutions capable of managing tens of thousands of indoor and outdoor Wi-Fi access points as a unified infrastructure system. Traditionally, many hardware-based controllers deployed in multiple locations would be necessary to support large scale deployments, making unified management expensive and unwieldy. Service providers are looking for solutions that give them the ability to control and manage their large-scale networks in an elegant and cost-efficient manner without reliance on cloud-based management outside their own networks.
Ruckus Approach
We are addressing and taking advantage of these market and industry trends by focusing our product development and go-to-market efforts in the following ways:
Provide reliable, high-capacity RF technology - Even with the introduction of new industry standards, the increase in the variety and density of devices in the enterprise and in public areas, coupled with the high capacity demands on wireless networks, will drive customer demand for mobile access solutions that function with a wide variety of devices and provide high throughput and optimal performance in interference-rich, highly congested and user/device-dense environments.
Enable self-service models to support customer migration to the all-wireless workplace - IT organizations are typically staffed to support a traditional model in which a user is assigned a single PC that is owned and managed by the enterprise, with a defined set of enterprise applications. The BYOD phenomenon has disrupted this support model, but enterprises generally cannot afford to dramatically increase IT staff to support the unprecedented number and variety of mobile devices and user-selected applications. As a result, IT departments need network access solutions that address the challenges presented by these mobile devices and applications by enabling data analytics and remote network management, while allowing for self-support work flows to relieve the burden on IT organizations and empower users to securely provision and support themselves.
Deliver applications reliably in a mobile environment - As enterprise users evolve to an "all-wireless" access model, latency-sensitive applications (like voice and video) that were previously delivered over a fixed wired network must perform optimally in a wireless environment. New Smart Wi-Fi access solutions must be “application aware” so they can identify, secure and prioritize traffic from these applications to ensure optimal performance.
Engage the public and public-facing enterprises - Municipalities, hotels, large public venues and service providers with a diverse base of subscribers are increasingly looking to mobile devices and applications as critical touch points to improve overall customer engagement and loyalty. Platforms and applications that leverage advanced network infrastructure capabilities (with context on user, device, application and location) will become attractive to these public-facing enterprises.
Address the increasing Wi-Fi needs of small business - Smaller organizations often cannot justify the high cost of enterprise-class Wi-Fi systems but still desire best-in-class Wi-Fi connectivity, coverage and performance and need simple and easy management that does not require sophisticated IT support. This market needs a simple way for IT-challenged small businesses to quickly install, configure and monitor a Wi-Fi network through the use of innovative and intuitive management applications. While these organizations do not require all of the features and management capabilities of traditional enterprise-class systems, Wi-Fi products for this market must be cost-effective while addressing common enterprise wireless environments supporting a diversity of smart mobile devices, BYOD and multimedia intensive business and customer applications, each clamoring for bandwidth.
Scale network management and deployment options to meet the growing demands of large carrier and enterprise Wi-Fi networks - As service providers broaden Wi-Fi access service, rapid service innovation, improved operational efficiencies, greater flexibility and improved capital efficiencies become paramount. By providing options of in-network, cost-effective hardware and virtualized network WLAN functions through flexible software that runs on standard commercial services within a virtual machine, operators can streamline the delivery of customer-specific managed Wi-Fi services. Additionally, should they desire greater control and management of their wireless networks, carriers and large, distributed enterprises can use such systems to elegantly self-manage their growing networks.
Components of Our Results of Operations and Financial Condition
Revenue
We generate revenue from sales of our products and services. Revenue is recognized when persuasive evidence of an arrangement exists, delivery has occurred, the fee is fixed or determinable and collectability is reasonably assured.
Our revenue is comprised of the following:
36
Product Revenue. The majority of our product revenue is generated from sales of our access points and controllers as well as corresponding controller licenses, which are sold in conjunction with one another. Our product revenue also includes revenue from the sale of stand-alone software products. We recognize revenue when all the revenue recognition criteria have been met. For hardware products, we generally recognize revenue following the sale of products to our distributors’ customers and at the time of shipment for all other customers. For software products, we generally recognize revenue when licenses are delivered to our customers.
Service Revenue. Service revenue is generated primarily from post-contract support, or PCS, including software updates on an “if and when available” basis, expedited replacement for defective access points and controllers, telephone and internet access to technical support personnel and hardware support. Our service revenue also includes software as a service, or SaaS, such as SPoT and Cloudpath. PCS and SaaS are typically sold in one, three or five year terms and we recognize service revenue ratably over the contractual service period.
Cost of Revenue
Our cost of revenue is comprised of the following:
Cost of Product Revenue. Cost of product revenue includes manufacturing costs of our products payable to third-party contract manufacturers. Our cost of product revenue also includes shipping costs, third-party logistics costs, provisions for excess and obsolete inventory, warranty, amortization of intangible assets, personnel costs, including stock-based compensation, certain allocated costs for facilities and other expenses associated with logistics and quality control.
Cost of Service Revenue. Cost of service revenue primarily includes personnel costs, including stock-based compensation, costs associated with fulfilling support obligations, amortization of intangible assets, third-party cloud computing infrastructure costs and certain allocated costs for facilities and other expenses associated with service revenue.
Gross Margin
Gross margin, or gross profit as a percentage of revenue, has been and will continue to be affected by a variety of factors, including the average selling price of our products, manufacturing costs, the mix of products sold, the mix of revenue by region, the mix of revenue between products and services, the size of orders from customers, as well as inventory obsolescence. These factors will cause gross margin to fluctuate over time, but we believe gross margin has stabilized and expect it to remain stable in the near term, as margin benefits derived from further economies of scale from manufacturing and operations are expected to be less significant.
Operating Expenses
Research and Development. Research and development expenses consist primarily of personnel costs, including stock-based compensation, for employees and contractors engaged in research, design and development activities, as well as costs for prototype-related expenses, product certification, travel, depreciation, recruiting and certain facilities and benefits costs allocated based on headcount. We believe that continued investment in research and development of our products is important to attaining our strategic objectives. We expect research and development expenses to increase in absolute dollars in the near term from planned investments in future products and services but decline as a percentage of total revenue in the long term.
Sales and Marketing. Sales and marketing expenses consist primarily of personnel costs, commission costs and stock-based compensation for employees and contractors engaged in sales and marketing activities. Commission costs are calculated on sale and expensed in the same period. Sales and marketing expenses also include the costs of trade shows, marketing programs, promotional materials, demonstration equipment, travel, depreciation, recruiting and certain facilities and benefits costs allocated based on headcount. We expect sales and marketing expenses to increase in absolute dollars, as we increase the size of our sales and marketing organizations to support continuing growth, but we expect sales and marketing expenses to remain consistent as a percentage of total revenue in the near term.
General and Administrative. General and administrative expenses consist primarily of personnel costs, including stock-based compensation for our executive, finance, legal, human resources and other administrative employees. In addition, general and administrative expenses include outside consulting, legal, audit and accounting services, depreciation and facilities and other supporting overhead costs not allocated to other departments. We expect that our general and administrative expenses will fluctuate in the near term in absolute dollars and as a percentage of total revenue, as we continue to incur expenses associated with being a publicly traded company and incur legal fees associated with patent litigation matters, which may vary over time depending on patent activities.
Interest Income
Interest income consists of interest from our cash, cash equivalents and short-term investments and accretion of the discount or amortization of the premium related to our short-term investments.
37
Other Expense, net
Other expense, net consists primarily of losses from fluctuations in foreign currency exchange rates.
Income Tax Expense (Benefit)
Income tax expense (benefit) consists primarily of federal and state income taxes in the United States and income taxes in foreign jurisdictions in which we conduct business. We are required to consider all available evidence, both positive and negative, such as historical levels of income and future forecasts of taxable income amongst other items, in determining whether a full or partial release of our valuation allowance is required. We are also required to schedule future taxable income in accordance with accounting standards that address income taxes to assess the appropriateness of a valuation allowance, which further requires the exercise of significant management judgment. As a result, there can be no assurance that an increase in our valuation allowance may not be required in the future. As of December 31, 2015 and December 31, 2014, no valuation allowance has been provided against the Company’s deferred tax assets.
Results of Operations
The following table sets forth our results of operations for the periods presented as a percentage of total revenue for those periods. The period-to-period comparison of financial results is not necessarily indicative of future results.
Consolidated Statements of Operations
Years Ended December 31, | ||||||||
2015 | 2014 | 2013 | ||||||
Revenue: | ||||||||
Product | 92.0 | % | 92.8 | % | 93.5 | % | ||
Service | 8.0 | 7.2 | 6.5 | |||||
Total revenue | 100.0 | 100.0 | 100.0 | |||||
Cost of revenue: | ||||||||
Product | 28.2 | 27.7 | 29.8 | |||||
Service | 4.0 | 3.8 | 3.7 | |||||
Total cost of revenue | 32.2 | 31.5 | 33.5 | |||||
Gross profit | 67.8 | 68.5 | 66.5 | |||||
Operating expenses: | ||||||||
Research and development | 25.2 | 23.6 | 23.5 | |||||
Sales and marketing | 29.4 | 30.2 | 30.1 | |||||
General and administrative | 11.2 | 10.3 | 12.8 | |||||
Total operating expenses | 65.8 | 64.1 | 66.4 | |||||
Operating income | 2.0 | 4.4 | 0.1 | |||||
Interest income | 0.2 | — | 0.1 | |||||
Other expense, net | (0.1 | ) | (0.1 | ) | (0.2 | ) | ||
Income (loss) before income taxes | 2.1 | 4.3 | — | |||||
Income tax expense (benefit) | 0.8 | 1.8 | (0.7 | ) | ||||
Net income | 1.3 | % | 2.5 | % | 0.7 | % | ||
38
Revenues
Years Ended December 31, | Change | ||||||||||||||||||||||
2015 | 2014 | 2013 | 2015 to 2014 | 2014 to 2013 | |||||||||||||||||||
Amount | Amount | Amount | Dollars | Percent | Dollars | Percent | |||||||||||||||||
(dollars in thousands) | |||||||||||||||||||||||
Revenue: | |||||||||||||||||||||||
Product | $ | 343,659 | $ | 303,446 | $ | 245,935 | $ | 40,213 | 13.3% | $ | 57,511 | 23.4% | |||||||||||
Service | 29,717 | 23,473 | 17,132 | 6,244 | 26.6% | 6,341 | 37.0% | ||||||||||||||||
Total revenue | $ | 373,376 | $ | 326,919 | $ | 263,067 | $ | 46,457 | 14.2% | $ | 63,852 | 24.3% | |||||||||||
Years Ended December 31, | Change | ||||||||||||||||||||||
2015 | 2014 | 2013 | 2015 to 2014 | 2014 to 2013 | |||||||||||||||||||
Amount | Amount | Amount | Dollars | Percent | Dollars | Percent | |||||||||||||||||
(dollars in thousands) | |||||||||||||||||||||||
Revenue by geographic region: | |||||||||||||||||||||||
Americas | $ | 195,020 | $ | 169,218 | $ | 130,937 | $ | 25,802 | 15.2% | $ | 38,281 | 29.2% | |||||||||||
EMEA | 97,456 | 84,066 | 72,013 | 13,390 | 15.9% | 12,053 | 16.7% | ||||||||||||||||
APAC | 80,900 | 73,635 | 60,117 | 7,265 | 9.9% | 13,518 | 22.5% | ||||||||||||||||
Total revenue | $ | 373,376 | $ | 326,919 | $ | 263,067 | $ | 46,457 | 14.2% | $ | 63,852 | 24.3% | |||||||||||
2015 compared to 2014
Product revenue increased by $40.2 million, or 13.3%, for the year ended December 31, 2015, compared to the year ended December 31, 2014. The growth was driven by the expansion of our customer base, combined with incremental purchases from our existing customers, with total end customers exceeding 65,300 at December 31, 2015, as compared to 48,000 at December 31, 2014.
Service revenue increased by $6.2 million, or 26.6%, for the year ended December 31, 2015, compared to the year ended December 31, 2014. The increase was primarily related to the increase in PCS sales in connection with the increased sales of our products and PCS renewals from our existing customers. Service revenue is recognized over the contractual service period.
Revenue from Americas, EMEA and APAC increased during the year ended December 31, 2015. However, the year-over-year growth rate in the Americas slowed, primarily due to delays in U.S. education spending in the first half of the year, prior to the release of E-Rate funding, and in APAC primarily due to elongated purchase cycles resulting from the stronger U.S. Dollar against APAC currencies in the second half of the year.
2014 compared to 2013
Product revenue increased by $57.5 million, or 23.4%, for the year ended December 31, 2014, compared to the year ended December 31, 2013. The growth was driven by the expansion of our customer base, combined with incremental purchases from our existing customers, with total end customers exceeding 48,000 at December 31, 2014, as compared to 33,000 at December 31, 2013.
Service revenue increased by $6.3 million, or 37.0%, for the year ended December 31, 2014, compared to the year ended December 31, 2013. The increase was primarily related to PCS sales in connection with the increased sales of our products and PCS renewals from our existing customers. Service revenue is recognized over the contractual service period.
Revenue from Americas, EMEA and APAC increased during the year ended December 31, 2014, primarily due to the increased number of channel partners in each region focused on selling our products and the growth of our sales teams in new and existing industries and territories.
For the year ended December 31, 2013, we recognized $5.2 million of non-recurring product revenue in APAC following the expiration of future product rights related to a service provider.
39
Cost of Revenues and Gross Margin
Years Ended December 31, | Change | ||||||||||||||||||||||
2015 | 2014 | 2013 | 2015 to 2014 | 2014 to 2013 | |||||||||||||||||||
Amount | Amount | Amount | Dollars | Percent | Dollars | Percent | |||||||||||||||||
(dollars in thousands) | |||||||||||||||||||||||
Cost of revenue | |||||||||||||||||||||||
Product | $ | 105,314 | $ | 90,651 | $ | 78,344 | $ | 14,663 | 16.2% | $ | 12,307 | 15.7% | |||||||||||
Service | 14,741 | 12,454 | 9,844 | 2,287 | 18.4% | 2,610 | 26.5% | ||||||||||||||||
Total cost of revenue | $ | 120,055 | $ | 103,105 | $ | 88,188 | $ | 16,950 | 16.4% | $ | 14,917 | 16.9% | |||||||||||
Years Ended December 31, | Change | |||||||||||||||||||||||||||||
2015 | 2014 | 2013 | 2015 to 2014 | 2014 to 2013 | ||||||||||||||||||||||||||
Amount | Amount | Amount | Dollars | Percent | Margin | Dollars | Percent | Margin | ||||||||||||||||||||||
(dollars in thousands) | ||||||||||||||||||||||||||||||
Gross profit | ||||||||||||||||||||||||||||||
Product | $ | 238,345 | $ | 212,795 | $ | 167,591 | $ | 25,550 | 12.0 | % | $ | 45,204 | 27.0 | % | ||||||||||||||||
Service | 14,976 | 11,019 | 7,288 | 3,957 | 35.9 | % | 3,731 | 51.2 | % | |||||||||||||||||||||
Total gross profit | $ | 253,321 | $ | 223,814 | $ | 174,879 | $ | 29,507 | 13.2 | % | $ | 48,935 | 28.0 | % | ||||||||||||||||
Product gross margin | 69.4 | % | 70.1 | % | 68.1 | % | (0.7 | ) | 2.0 | |||||||||||||||||||||
Service gross margin | 50.4 | % | 46.9 | % | 42.5 | % | 3.5 | 4.4 | ||||||||||||||||||||||
Total gross margin | 67.8 | % | 68.5 | % | 66.5 | % | (0.7 | ) | 2.0 | |||||||||||||||||||||
2015 compared to 2014
Total gross margin for the year ended December 31, 2015 compared to the year ended December 31, 2014 decreased 0.7 percentage point.
For the year ended December 31, 2015, product gross margin decreased by 0.7 percentage point, compared to the year ended December 31, 2014. The decrease in product gross margin was primarily due to a 0.5 percentage point increase in product costs mainly associated with our newer generation 802.11ac products and a 0.2 percentage point increase in inventory write-downs related to our older generation 802.11n products.
For the year ended December 31, 2015, service gross margin increased by 3.5 percentage points, compared to the year ended December 31, 2014. The increase was the result of 26.6% growth in service revenue offset, in part, by an increase in service costs of 18.4%, arising from the expansion of our service operations to manage growth. We expect service costs to increase in the future at a slower rate due to economies of scale.
2014 compared to 2013
Total gross margin for the year ended December 31, 2014 compared to the year ended December 31, 2013 increased 2.0 percentage points.
For the year ended December 31, 2014, product gross margin increased by 2.0 percentage points, compared to the year ended December 31, 2013. The increase in product gross margin was primarily driven by economies of scale from manufacturing and operations of 2.6 percentage points, a 0.4 percentage point increase from decreased warranty claims and a 0.1 percentage point increase from lower freight and logistics costs, offset in part by a 0.6 percentage point decrease due to increased inventory write downs from product end of life. For the year ended December 31, 2013, we benefited from a non-recurring 0.6 percentage point increase in gross margin related to $5.2 million of product revenue recognized following the expiration of future product rights with no related cost of product.
For the year ended December 31, 2014, service gross margin increased by 4.4 percentage points, compared to the year ended December 31, 2013. The increase was the result of 37.0% growth in service revenue offset, in part, by an increase in service costs of 26.5%, arising from the expansion of our service operations to manage growth.
40
Research and Development
Years Ended December 31, | Change | ||||||||||||||||||||||
2015 | 2014 | 2013 | 2015 to 2014 | 2014 to 2013 | |||||||||||||||||||
Amount | Amount | Amount | Dollars | Percent | Dollars | Percent | |||||||||||||||||
(dollars in thousands) | |||||||||||||||||||||||
Research and development | $ | 94,234 | $ | 77,164 | $ | 61,783 | $ | 17,070 | 22.1% | $ | 15,381 | 24.9% | |||||||||||
% of revenue | 25.2 | % | 23.6 | % | 23.5 | % | |||||||||||||||||
2015 compared to 2014
The $17.1 million increase in research and development expenses for the year ended December 31, 2015 compared to the year ended December 31, 2014 was primarily attributable to an increase in personnel and related costs of $7.7 million, which primarily included an increase in salary expense of $4.8 million, bonuses of $1.7 million, stock-based compensation of $0.7 million and employee benefits of $0.6 million. We incurred higher consulting and contractor costs of $5.1 million primarily related to outsourced development work, post-acquisition expenses of $1.2 million and workforce reorganization costs of $1.1 million. We also incurred increased depreciation expense of $1.0 million and increased allocated overhead and facilities of $1.0 million due to growth in headcount.
2014 compared to 2013
The $15.4 million increase in research and development expenses for the year ended December 31, 2014 compared to the year ended December 31, 2013 was primarily attributable to an increase in personnel and related costs of $8.3 million, which included an increase in salary expense of $3.4 million, bonuses of $2.2 million and stock-based compensation of $2.4 million. We incurred higher consulting and contractor costs of $3.4 million, primarily related to outsourced development work. We also had higher product design, prototype and certification costs of $2.3 million, increased depreciation expense of $1.4 million and increased allocated overhead and facilities of $0.5 million due to growth in headcount, offset in part by a decrease in consumed supplies and materials and travel expenses of $0.5 million.
Sales and Marketing
Years Ended December 31, | Change | ||||||||||||||||||||||
2015 | 2014 | 2013 | 2015 to 2014 | 2014 to 2013 | |||||||||||||||||||
Amount | Amount | Amount | Dollars | Percent | Dollars | Percent | |||||||||||||||||
(dollars in thousands) | |||||||||||||||||||||||
Sales and marketing | $ | 109,864 | $ | 98,634 | $ | 79,185 | $ | 11,230 | 11.4% | $ | 19,449 | 24.6% | |||||||||||
% of revenue | 29.4 | % | 30.2 | % | 30.1 | % | |||||||||||||||||
2015 compared to 2014
The increase of $11.2 million in sales and marketing expenses for the year ended December 31, 2015 compared to the year ended December 31, 2014 was primarily attributable to an increase in personnel and related costs as we increased our sales organization as part of our strategy to expand our reach to new service providers, channel partners and large end customers. Personnel and related costs increased $7.8 million, which primarily included increases in salary expense of $4.2 million and bonus and commission expenses of $3.5 million. Sales and marketing program expenses increased by $1.4 million, primarily due to digital marketing expenses. In addition, travel expenses increased $0.4 million and allocated overhead and facilities increased $0.4 million, due to growth in headcount. We also incurred higher consulting and contractor costs of $0.5 million, primarily related to training and business development activities.
2014 compared to 2013
The increase of $19.4 million in sales and marketing expenses for the year ended December 31, 2014 compared to the year ended December 31, 2013 was primarily attributable to an increase in personnel and related costs as we increased our sales organization as part of our strategy to expand our reach to new service providers and channel partners. Personnel and related costs increased $16.6 million, which included increases in salary expense of $7.5 million, bonus and commission expenses of $4.7 million, stock-based compensation of $2.3 million and payroll taxes of $2.1 million. Sales and marketing program expenses increased by $1.5 million, primarily due to trade shows and lead generation expenses. In addition, travel expenses increased $1.2 million and allocated overhead increased $1.1 million due to growth in headcount. These increases were offset by a decrease of $0.5 million in consumed supplies and materials.
41
General and Administrative
Years Ended December 31, | Change | ||||||||||||||||||||||
2015 | 2014 | 2013 | 2015 to 2014 | 2014 to 2013 | |||||||||||||||||||
Amount | Amount | Amount | Dollars | Percent | Dollars | Percent | |||||||||||||||||
(dollars in thousands) | |||||||||||||||||||||||
General and administrative | $ | 41,799 | $ | 33,622 | $ | 33,752 | $ | 8,177 | 24.3% | $ | (130 | ) | (0.4)% | ||||||||||
% of revenue | 11.2 | % | 10.3 | % | 12.8 | % | |||||||||||||||||
2015 compared to 2014
The $8.2 million increase in general and administrative expenses for the year ended December 31, 2015 compared to the year ended December 31, 2014 was primarily attributable to an increase in personnel and related costs of $4.9 million, which included increases in salary expense of $2.0 million, stock-based compensation of $1.5 million, employee benefits of $0.8 million and bonuses of $0.6 million, an increase in net patent litigation settlements of $2.3 million and an increase of $0.7 million in legal fees associated with patent litigation.
2014 compared to 2013
The $0.1 million decrease in general and administrative expenses for the year ended December 31, 2014 compared to the year ended December 31, 2013 was primarily attributable to a decrease of $5.2 million in legal fees associated with patent litigation, net settlement gains of $0.8 million related to patent litigation matters and decrease of $0.5 million in bad debt expense, offset by an increase in personnel and related expenses of $6.3 million, which included increases in salary expense of $1.8 million, bonuses of $1.2 million, stock-based compensation of $2.6 million and payroll taxes of $0.7 million.
Interest Income
Years Ended December 31, | Change | ||||||||||||||||||||||||
2015 | 2014 | 2013 | 2015 to 2014 | 2014 to 2013 | |||||||||||||||||||||
Amount | Amount | Amount | Dollars | Percent | Dollars | Percent | |||||||||||||||||||
(dollars in thousands) | |||||||||||||||||||||||||
Interest income | $ | 701 | $ | 199 | $ | 187 | $ | 502 | 252.3 | % | $ | 12 | 6.4 | % | |||||||||||
For the years ended December 31, 2015, 2014 and 2013, interest income consists of interest earned from our cash, cash equivalents and short-term investments. The $0.5 million increase in interest income for the year ended December 31, 2015 compared to the year ended December 31, 2014 is primarily due to increased short-term investments.
Other Expense, net
Years Ended December 31, | Change | ||||||||||||||||||||||||
2015 | 2014 | 2013 | 2015 to 2014 | 2014 to 2013 | |||||||||||||||||||||
Amount | Amount | Amount | Dollars | Percent | Dollars | Percent | |||||||||||||||||||
(dollars in thousands) | |||||||||||||||||||||||||
Other expense, net | $ | 524 | $ | 463 | $ | 456 | $ | 61 | 13.2 | % | $ | 7 | 1.5 | % | |||||||||||
For the years ended December 31, 2015, 2014 and 2013, other expense, net consists primarily of losses from fluctuations in foreign currency exchange rates.
Income Tax Expense (Benefit)
Years Ended December 31, | Change | ||||||||||||||||||||||
2015 | 2014 | 2013 | 2015 to 2014 | 2014 to 2013 | |||||||||||||||||||
Amount | Amount | Amount | Dollars | Percent | Dollars | Percent | |||||||||||||||||
(dollars in thousands) | |||||||||||||||||||||||
Income tax expense (benefit) | $ | 2,911 | $ | 5,940 | $ | (1,899 | ) | $ | (3,029 | ) | $ | 7,839 | |||||||||||
Income tax expense was $2.9 million for the year ended December 31, 2015. The effective tax rate exceeded the statutory rate for the period primarily due to non-deductible stock-based compensation expense, state and foreign taxes and other non-deductible expenses, offset by federal and state research and development credits.
42
Income tax expense was $5.9 million for the year ended December 31, 2014. The effective tax rate exceeded the statutory rate for the period primarily due to non-deductible stock-based compensation expense, state and foreign taxes, and other non-deductible expenses, offset by federal and state research and development credits.
The income tax benefit of $1.9 million for the year ended December 31, 2013 primarily relates to federal and state research and development credits, offset by certain non-deducible stock-based compensation expense.
43
Selected Quarterly Financial Data
The following tables set forth our unaudited quarterly consolidated statements of operations data for each of the eight quarters ended December 31, 2015. In management's opinion, the data has been prepared on the same basis as the audited consolidated financial statements included in this report, and reflects all necessary adjustments, consisting only of normal recurring adjustments, necessary for a fair statement of this data.
For the three months ended | |||||||||||||||
March 31, 2015 | June 30, 2015 | September 30, 2015 | December 31, 2015 | ||||||||||||
Consolidated Statement of Operations Data: | (in thousands, except per share amounts) | ||||||||||||||
Revenue: | |||||||||||||||
Product | $ | 75,297 | $ | 85,040 | $ | 91,426 | $ | 91,896 | |||||||
Service | 6,781 | 7,190 | 7,526 | 8,220 | |||||||||||
Total revenue | 82,078 | 92,230 | 98,952 | 100,116 | |||||||||||
Cost of revenue: | |||||||||||||||
Product | 23,231 | 26,720 | 27,491 | 27,872 | |||||||||||
Service | 3,542 | 3,683 | 3,558 | 3,958 | |||||||||||
Total cost of revenue | 26,773 | 30,403 | 31,049 | 31,830 | |||||||||||
Gross profit | 55,305 | 61,827 | 67,903 | 68,286 | |||||||||||
Operating expenses: | |||||||||||||||
Research and development | 21,296 | 22,843 | 24,244 | 25,851 | |||||||||||
Sales and marketing | 26,078 | 27,696 | 27,433 | 28,657 | |||||||||||
General and administrative | 9,434 | 9,921 | 12,212 | 10,232 | |||||||||||
Total operating expenses | 56,808 | 60,460 | 63,889 | 64,740 | |||||||||||
Operating income (loss) | (1,503 | ) | 1,367 | 4,014 | 3,546 | ||||||||||
Interest income | 141 | 156 | 181 | 223 | |||||||||||
Other expense, net | (78 | ) | (94 | ) | (172 | ) | (180 | ) | |||||||
Income (loss) before income taxes | (1,440 | ) | 1,429 | 4,023 | 3,589 | ||||||||||
Income tax expense (benefit) | (867 | ) | 670 | 2,339 | 769 | ||||||||||
Net income (loss) | $ | (573 | ) | $ | 759 | $ | 1,684 | $ | 2,820 | ||||||
Net income (loss) per share: | |||||||||||||||
Basic | $ | (0.01 | ) | $ | 0.01 | $ | 0.02 | $ | 0.03 | ||||||
Diluted | $ | (0.01 | ) | $ | 0.01 | $ | 0.02 | $ | 0.03 | ||||||
Weighted average shares used in computing net income (loss) per share: | |||||||||||||||
Basic | 85,637 | 87,017 | 88,002 | 88,974 | |||||||||||
Diluted | 85,637 | 95,465 | 95,886 | 96,878 | |||||||||||
44
For the three months ended | |||||||||||||||
March 31, 2014 | June 30, 2014 | September 30, 2014 | December 31, 2014 | ||||||||||||
Consolidated Statement of Operations Data: | (in thousands, except per share amounts) | ||||||||||||||
Revenue: | |||||||||||||||
Product | $ | 70,075 | $ | 75,352 | $ | 78,810 | $ | 79,209 | |||||||
Service | 4,977 | 5,648 | 6,191 | 6,657 | |||||||||||
Total revenue | 75,052 | 81,000 | 85,001 | 85,866 | |||||||||||
Cost of revenue: | |||||||||||||||
Product | 21,496 | 22,209 | 23,193 | 23,753 | |||||||||||
Service | 2,759 | 2,932 | 3,379 | 3,384 | |||||||||||
Total cost of revenue | 24,255 | 25,141 | 26,572 | 27,137 | |||||||||||
Gross profit | 50,797 | 55,859 | 58,429 | 58,729 | |||||||||||
Operating expenses: | |||||||||||||||
Research and development | 18,139 | 18,954 | 19,614 | 20,457 | |||||||||||
Sales and marketing | 23,270 | 24,412 | 24,720 | 26,232 | |||||||||||
General and administrative | 8,437 | 8,358 | 8,017 | 8,810 | |||||||||||
Total operating expenses | 49,846 | 51,724 | 52,351 | 55,499 | |||||||||||
Operating income | 951 | 4,135 | 6,078 | 3,230 | |||||||||||
Interest income | 46 | 46 | 41 | 66 | |||||||||||
Other expense, net | (26 | ) | (84 | ) | (200 | ) | (153 | ) | |||||||
Income before income taxes | 971 | 4,097 | 5,919 | 3,143 | |||||||||||
Income tax expense | 698 | 2,658 | 2,365 | 219 | |||||||||||
Net income | $ | 273 | $ | 1,439 | $ | 3,554 | $ | 2,924 | |||||||
Net income per share: | |||||||||||||||
Basic | $ | 0.00 | $ | 0.02 | $ | 0.04 | $ | 0.03 | |||||||
Diluted | $ | 0.00 | $ | 0.02 | $ | 0.04 | $ | 0.03 | |||||||
Weighted average shares used in computing net income per share: | |||||||||||||||
Basic | 81,277 | 82,315 | 83,388 | 84,611 | |||||||||||
Diluted | 93,311 | 92,358 | 94,142 | 94,316 | |||||||||||
45
Liquidity and Capital Resources
December 31, | |||||||
2015 | 2014 | ||||||
(in thousands) | |||||||
Cash and cash equivalents | $ | 69,687 | $ | 56,083 | |||
Short-term investments | 160,791 | 142,706 | |||||
Total cash, cash equivalents and short-term investments | $ | 230,478 | $ | 198,789 | |||
Years Ended December 31, | |||||||||||
2015 | 2014 | 2013 | |||||||||
(in thousands) | |||||||||||
Net cash provided by operating activities | $ | 35,864 | $ | 36,726 | $ | 28,568 | |||||
Net cash used in investing activities | (40,725 | ) | (93,036 | ) | (82,948 | ) | |||||
Net cash provided by financing activities | 18,465 | 21,111 | 12,276 | ||||||||
Net increase (decrease) in cash and cash equivalents | $ | 13,604 | $ | (35,199 | ) | $ | (42,104 | ) | |||
We had cash, cash equivalents and short-term investments of $230.5 million at December 31, 2015. Our cash equivalents and short-term investments are comprised primarily of money market funds, corporate debt securities, U.S. government agency securities and U.S. treasury bills. As of December 31, 2015, $2.6 million of cash and cash equivalents were held outside of the United States and is not presently available to fund domestic operations and obligations. If we were to repatriate cash held outside the United States, it could be subject to U.S. income taxes, less any previously paid foreign income taxes.
We plan to continue to invest in long-term growth and we anticipate that these investments will continue to increase in absolute dollars. We believe that our existing cash, cash equivalents, short-term investments and cash provided by operations will be sufficient to meet our working capital requirements for at least the next 12 months. Our future capital requirements will depend on many factors including our growth rate, the timing and extent of spending to support development efforts, the expansion of sales and marketing activities, the introduction of new and enhanced products and services offerings, the costs to ensure access to adequate manufacturing capacity and the continuing market acceptance of our products.
Operating Activities
We generated $35.9 million of cash from operating activities during the year ended December 31, 2015 resulting from our net income of $4.7 million, adjusted for non-cash net charges of $37.9 million and offset by changes in our net operating assets and liabilities of $6.7 million. The non-cash net charges consisted mainly of stock-based compensation of $28.8 million, depreciation and amortization of $11.6 million, accretion of discount or amortization of premium on short-term investments of $2.4 million and deferred income taxes of $1.1 million, offset by excess tax benefit from employee stock incentive plans of $6.2 million. Changes in our operating assets and liabilities were primarily due to the increase in our accounts receivable, net of $11.0 million and inventory of $5.5 million due to timing of shipments. These changes were offset by increased deferred revenue of $0.8 million, primarily related to PCS renewals, increased accounts payable and accrued liabilities of $7.7 million due to timing of payments and increased accrued compensation of $1.2 million primarily due to increased headcount.
We generated $36.7 million of cash from operating activities during the year ended December 31, 2014 resulting from our net income of $8.2 million, adjusted for non-cash net charges of $33.3 million and offset by changes in our net operating assets and liabilities of $4.8 million. The non-cash net charges consisted mainly of stock-based compensation of $26.6 million, depreciation and amortization of $9.6 million, accretion of discount or amortization of premium on short-term investments of $1.3 million and deferred income taxes of $4.6 million, offset by excess tax benefit from employee stock incentive plans of $9.2 million. Changes in our operating assets and liabilities were primarily due to the increase in our accounts receivable, net of $15.3 million and inventory of $4.3 million due to timing of shipments. These changes were offset by increased deferred revenue of $9.5 million, related to support renewals and increases in inventory held by distributors when the arrangement fee is not considered fixed and determinable, increased accounts payable of $4.4 million due to timing of payments and increased accrued compensation of $2.0 million primarily due to increased headcount.
We generated $28.6 million of cash from operating activities during the year ended December 31, 2013 resulting from our net income of $1.8 million, adjusted for non-cash net charges of $22.5 million and changes in our net operating assets and liabilities of $4.3 million. The non-cash net charges consisted mainly of stock-based compensation of $18.7 million, depreciation and amortization of $6.6 million, partially offset by the change in deferred income taxes of $2.9 million and the change in excess tax benefit from employee stock incentive plans of $2.0 million.
46
Investing Activities
Our primary investing activities consist of purchases, maturities, and sales of short-term investments, purchases of property, equipment and internal use software and payments for acquisitions. Purchases of property, equipment and internal use software may vary from period to period due to the timing of the expansion of our operations.
Cash used in investing activities during the year ended December 31, 2015 was $40.7 million, as a result of $153.6 million related to the purchase of investments, $12.8 million related to purchase of property, equipment and internal use software and $7.2 million related to Cloudpath acquisition, net of cash acquired, offset by $133.1 million in proceeds from the sale and maturity of short-term investments.
Cash used in investing activities during the year ended December 31, 2014 was $93.0 million, as a result of $174.7 million related to the purchase of investments and $9.5 million related to purchase of property and equipment, offset by $91.2 million in proceeds from the maturity and sale of short-term investments.
Cash used in investing activities during the year ended December 31, 2013 was $82.9 million, as a result of $83.4 million related to the purchase of investments, $7.8 million related to purchase of property and equipment, $5.9 million related to our acquisition of YFind Technologies Private Limited, net of cash acquired, $5.0 million related to an increase in restricted cash and $2.0 million related to final payment related to a previous acquisition, offset by $21.5 million in proceeds from maturity and sale of investments.
Financing Activities
Our primary financing activities consist of proceeds from sales of shares through employee equity award plans.
Cash generated from financing activities during the year ended December 31, 2015 was $18.5 million, of which $7.9 million related to the exercise of stock options, $4.4 million related to proceeds from the employee stock purchase plan, or ESPP, and $6.2 million related to excess tax benefit from employee stock incentive plans.
Cash generated from financing activities during the year ended December 31, 2014 was $21.1 million, of which $7.6 million related to the exercise of stock options, $4.3 million related to proceeds from the ESPP, and $9.2 million related to excess tax benefit from employee stock incentive plans.
Cash generated from financing activities during the year ended December 31, 2013 was $12.3 million, of which $7.2 million was from the exercise of stock options, $3.9 million was proceeds from the ESPP and $2.0 million was due to excess tax benefit from employee stock incentive plans, partially offset by $0.8 million in offering costs from our IPO.
Contractual Obligations & Commitments
We lease our headquarters in Sunnyvale, California and office space in other locations worldwide under non-cancelable operating leases that expire at various dates through 2022. The following table summarizes our contractual obligations at December 31, 2015, including leases (in thousands):
Payment Due by Period | |||||||||||||||||||
Total | Less than 1 Year | 1-3 Years | 3-5 Years | More than 5 Years | |||||||||||||||
Operating leases | $ | 22,895 | $ | 4,942 | $ | 7,894 | $ | 5,066 | $ | 4,993 | |||||||||
Purchase commitments (1) | 10,286 | 9,734 | 552 | — | — | ||||||||||||||
Total | $ | 33,181 | $ | 14,676 | $ | 8,446 | $ | 5,066 | $ | 4,993 | |||||||||
(1) | Consists of minimum purchase commitments with our contract manufacturers for inventory and specific contracted services. |
The table above excludes liabilities for uncertain tax positions and related interest and penalties. We have not provided a detailed estimate of the payment timing of uncertain tax positions due to the uncertainty of when the related tax settlements will become due.
Off-Balance Sheet Arrangements
Through December 31, 2015, we did not have any relationships with unconsolidated organizations or financial partnerships, such as structured finance or special purpose entities that would have been established for the purpose of facilitating off-balance sheet arrangements or other contractually narrow or limited purposes.
47
Critical Accounting Policies and Estimates
Our consolidated financial statements are prepared in accordance with generally accepted accounting principles. The preparation of these consolidated financial statements requires us to make estimates and assumptions that affect the reported amounts of assets, liabilities, revenue, expenses and related disclosures. We evaluate our estimates and assumptions on an ongoing basis. Our estimates are based on historical experience and various other assumptions that we believe to be reasonable under the circumstances. Our actual results could differ from these estimates.
We believe that the assumptions and estimates associated with revenue recognition, valuation of inventory, goodwill and intangible assets, accounting for income taxes and stock-based compensation have the greatest potential impact on our consolidated financial statements. Therefore, we consider these to be our critical accounting policies and estimates. For further information on all of our significant accounting policies, please see Note 1 of the accompanying notes to our consolidated financial statements.
Revenue Recognition
We generate revenue from sales of our products and services through a direct sales force and indirect relationships with our channel partners. Revenue is recognized when all of the following criteria are met:
• | Persuasive evidence of an arrangement exists. We rely upon sales contracts and purchase orders to determine the existence of an arrangement. |
• | Delivery has occurred. Delivery is deemed to have occurred when title has transferred. We use shipping documents to verify transfer of title. |
• | The fee is fixed or determinable. We assess whether the fee is fixed or determinable based on the terms associated with the transaction. |
• | Collectability is reasonably assured. We assess collectability as sales occur, based on an analysis of the customer's credit and payment history. |
Certain of our arrangements are multiple-element arrangements and may include hardware, PCS, stand-alone software and SaaS. All of our products and services qualify as separate units of accounting. For multiple-element arrangements, we allocate revenue to each unit of accounting based on an estimated selling price at the inception of the arrangement. The total arrangement consideration is allocated to each separate unit of accounting using the relative estimated selling prices of each unit. We limit the amount of revenue recognized for delivered elements to an amount that is not contingent upon future delivery of additional products or services.
To determine the estimated selling price in multiple-element arrangements, we first look to establish vendor specific objective evidence (“VSOE”) of the selling price using the prices charged for a deliverable when sold separately. If VSOE of the selling price cannot be established for a deliverable, we look to establish third-party evidence (“TPE”) of the selling price by evaluating the pricing of similar and interchangeable competitor products or services in stand-alone arrangements. However, as our products contain a significant element of proprietary technology and offer substantially different features and functionality from our competitors, we have been unable to obtain comparable pricing information with respect to our competitors’ products. Therefore, we have not been able to obtain reliable evidence of TPE of the selling price. If neither VSOE nor TPE of the selling price can be established for a deliverable, we establish best estimate selling price (“BESP”) by reviewing historical transaction information and considering several other internal factors, including discounting and margin objectives.
We regularly review estimated selling price of the product offerings and maintain internal controls over the establishment and updates of these estimates. We currently do not expect a material impact in the near term from changes in estimated selling prices, including VSOE of selling price.
Product Revenue. Our product revenue consists of revenue from sales of our hardware and stand-alone software licenses and is net of allowances for estimated sales returns, product rebates, stock rotations and other programs based on historical experience.
Our hardware deliverables typically include proprietary operating system software, which together deliver the essential functionality of our products. Therefore, our hardware appliances are considered non-software elements and are not subject to the industry-specific software revenue recognition guidance. We generate revenue through a direct sales force and indirect relationships with our channel partners. For sales to direct end customers and certain channel partners, we recognize product revenue at the time of the title transfer, assuming all other revenue recognition criteria are met. Certain of our distributors that stock our products are granted significant rebates for sales of our products. Therefore, the arrangement fee for this group of distributors is not fixed and determinable when products are shipped to these distributors and revenue is deferred until our products are shipped to the distributors’ customer.
Our product revenue also includes revenue from the sale of stand-alone software products. Sales of stand-alone software generally include a perpetual license to our software. Stand-alone software products may operate in conjunction with our hardware products but are not considered essential to the functionality of the hardware.
48
For sales of stand-alone software, we recognize revenue based on software revenue recognition guidance. Under the software revenue recognition guidance, we use the residual method to recognize revenue when a product agreement includes one or more elements to be delivered at a future date and VSOE of the fair value of all undelivered elements exists. In the majority of our contracts, the only element that remains undelivered at the time of delivery of the product is PCS. Under the residual method, the fair value of the undelivered elements is deferred and the remaining portion of the contract fee is recognized as product revenue. If evidence of the fair value of one or more undelivered elements does not exist, all revenue is generally deferred and recognized when delivery of those elements occurs or when fair value can be established. When the only undelivered element for which we do not have VSOE of selling price is PCS, revenue for the entire arrangement is bundled and recognized ratably over the support period.
Service Revenue. Our service revenue consists of revenue from PCS and SaaS. PCS includes software updates on an “if and when available” basis, expedited replacement for defective access points and controllers, telephone and internet access to technical support personnel and hardware support. PCS and SaaS typically are sold in one, three or five year terms and we recognize service revenue ratably over the contractual service period.
Sales Tax and Shipping. Revenue is reported net of sales taxes. Shipping charges billed to channel partners are included in revenue and related costs are included in cost of revenue. To date, shipping charges have not been significant.
Inventories
Inventories are carried at the lower of cost or market, on a first-in, first-out basis. We evaluate inventory for excess and obsolete products based on management’s assessment of future demand, market conditions and technical obsolescence. We subcontract manufacturing of substantially all of our products. At December 31, 2015 and 2014, inventories were predominately comprised of finished goods.
Goodwill
Goodwill represents the excess of the purchase price of an acquired business over the fair value of the underlying net tangible and intangible assets. We evaluate goodwill for impairment annually in the fourth quarter or whenever events or changes in circumstances indicate the carrying value of goodwill may not be recoverable. Triggering events that may indicate impairment include, but are not limited to, a significant adverse change in customer demand or business climate that could affect the value of goodwill or a significant decrease in expected cash flows. We perform the impairment testing by first assessing qualitative factors to determine whether the existence of events or circumstances leads to a determination that it is more likely than not that the fair value of our reporting unit is less than our carrying amount. If, after assessing the totality of events or circumstances, we determine it is more likely than not that the fair value of a reporting unit is less than our carrying amount, we perform a two-step impairment test. The first step requires the identification of the reporting units and comparison of the fair value of a reporting unit with our carrying amount, including goodwill. If the fair value of the reporting unit is less than our carrying value, an indication of goodwill impairment exists for the reporting unit and the second step of the impairment test is performed to compute the amount of the impairment. Under the second step, an impairment loss is recognized for any excess of the carrying amount of the reporting unit's goodwill over the implied fair value of that goodwill. We have determined that we have only one reporting unit and no impairment has been recognized related to the goodwill balance as of December 31, 2015 and 2014.
Intangible Assets
Intangible assets consist primarily of purchased technology and acquired customer relationships resulting from acquisitions. Intangible assets are recorded at fair value and are amortized on a straight-line basis over their estimated useful lives, which ranges from four to five years.
Long-lived assets, including intangible assets, are reviewed for impairment whenever events or changes in circumstances indicate that the carrying amount of such assets may not be recoverable. Triggering events that may indicate impairment include, but are not limited to, significant underperformance relative to estimated results, significant changes in the manner of our use of the acquired assets or the strategy for our overall business and significant negative industry or economic trends. Determination of recoverability of intangible assets is based on an estimate of undiscounted future cash flows resulting from the use of the asset and its eventual disposition. If intangible assets are considered to be impaired, the impairment to be recognized equals the amount by which the carrying value of the asset exceeds the assets fair market value. We did not record any impairment charges in the periods presented.
Income Taxes
We utilize the asset and liability method of accounting for income taxes. Under this method, deferred tax assets and liabilities are determined based on differences between financial reporting and tax reporting bases of assets and liabilities and are measured using enacted tax rates and laws that are expected to be in effect when the differences are expected to reverse. We record a valuation allowance when necessary to reduce our deferred tax assets to the amount that is more likely than not to be realized. In order for us to realize our deferred tax assets, we must be able to generate sufficient taxable income in those jurisdictions where the deferred tax assets are located. In determining the need for a valuation allowance, we consider future growth, forecasted earnings, future taxable income, the mix of earnings in the jurisdictions in which we operate, historical earnings, taxable income in prior years, if carryback is permitted under the law, carry-forward periods and prudent and feasible tax planning strategies. In the event we were to determine that not all or part of our net deferred tax assets are not more likely than not to be realized in the future, an adjustment to the deferred tax assets valuation allowance would be charged to earnings in the period in which we make such a determination, or goodwill would be adjusted if the valuation allowance related to deferred tax assets acquired in a business combination and the adjustment is within the measurement period. If we later determine that it is more likely than not that the deferred tax assets would be realized, we would reverse the previously provided valuation allowance as an adjustment to earnings at such time.
49
The amount of income tax we pay is subject to ongoing audits by federal, state and foreign tax authorities, which may result in proposed assessments. We record uncertain tax positions in accordance with accounting standards on the basis of a two-step process whereby (1) a determination is made as to whether it is more likely than not that the tax positions will be sustained based on the technical merits of the position and (2) for those tax positions that meet the more-likely-than-not recognition threshold we recognize the largest amount of tax benefit that is more likely than not to be realized upon ultimate settlement with the related tax authority. We recognize interest and penalties related to uncertain tax positions in our provision for income taxes line in the accompanying consolidated statements of operations.
Stock-Based Compensation
Our stock-based payment awards include stock options, restricted stock units, performance awards and stock purchase rights under our ESPP.
Stock-based compensation is measured at the grant date based on the fair value of the award and is recognized as expense, net of estimated forfeitures, on a straight-line basis over the requisite service period, which is generally the vesting period of the award.
The fair value of stock-based payment awards at the grant date represents management’s best estimate, but the estimate involves inherent uncertainties and the application of management’s judgment. We use the Black-Scholes option pricing model to determine the fair value of stock options and stock purchase rights under our ESPP.
The determination of the grant date fair value of options using the Black-Scholes option pricing model is affected by the following assumptions.
• | Expected Term. Our expected term represents the period that our stock-based awards are expected to be outstanding and was calculated as the average of the option vesting and contractual terms, based on the simplified method provided by the Securities and Exchange Commission’s Staff Accounting Bulletin No. 110. The simplified method is used due to the lack of a sufficient amount of historical exercise data. The expected term for the ESPP is based on the duration of the purchase period, typically six to twelve months. |
• | Volatility. Given the limited trading history for our common stock, the expected stock price volatility for our common stock was estimated by taking a combination of our historical common stock price volatility and an average historic price volatility for industry peers based on daily price observations over a period equivalent to the expected term of the stock option grants. Industry peers consist of several public companies within our industry and are similar in size, stage of life cycle and financial leverage. We did not rely on implied volatilities of traded options in our common stock or these industry peers’ common stock because the volume of activity was relatively low. We intend to continue to consistently apply this process until a sufficient amount of historical information regarding the volatility of our own common stock share price over a period equivalent to the expected term of the stock option grants becomes available, or until circumstances change such that the identified companies are no longer similar to us, in which case more suitable companies whose share prices are publicly available would be utilized in the calculation. |
• | Risk-free Rate. The risk-free interest rate is based on the U.S. Treasury zero coupon issues with remaining terms similar to the expected term of the stock option grants. |
• | Dividend Yield. We have never declared or paid any cash dividends and do not presently plan to pay cash dividends in the foreseeable future. Consequently, we used an expected dividend yield of zero. |
In addition to assumptions used in the Black-Scholes option pricing model, we must also estimate a forfeiture rate to calculate the stock-based compensation for our awards. Our forfeiture rate is based on an analysis of our actual historical forfeitures. Changes in the estimated forfeiture rate can have a significant impact on our stock-based compensation expense as the cumulative effect of adjusting the rate is recognized in the period the forfeiture estimate is changed. If a revised forfeiture rate is higher than the previously estimated forfeiture rate, an adjustment is made that will result in a decrease to the stock-based compensation expense recognized in the financial statements. If a revised forfeiture rate is lower than the previously estimated forfeiture rate, an adjustment is made that will result in an increase to the stock-based compensation expense recognized in the financial statements.
We will continue to use judgment and estimates in evaluating the assumptions related to our stock based compensation on a prospective basis. As we continue to accumulate additional data, we may have refinements to our estimates, which could materially impact our future stock based compensation expense.
Recent Accounting Pronouncements
Refer to “Recent Accounting Pronouncements” in Note 1 to consolidated financial statements included in Part II, Item 8 of this Annual Report on Form 10-K.
50
ITEM 7A. QUANTITATIVE AND QUALITATIVE DISCLOSURES ABOUT MARKET RISK
Interest Rate Sensitivity
We had cash, cash equivalents and short-term investments of $230.5 million and $198.8 million as of December 31, 2015 and 2014, respectively. The amounts are invested primarily in money market funds and highly liquid investment grade fixed income securities. The cash, cash equivalents and short-term investments are held for working capital purposes. Our investment policy and strategy is focused on the preservation of capital and supporting our liquidity requirements. We do not invest for trading or speculative purposes. At December 31, 2015, the weighted-average duration of our investment portfolio was less than one year.
Based on a sensitivity analysis, we determined that a hypothetical 100 basis point increase in interest rates would have resulted in a decrease in the fair value of our cash equivalents and short-term investments of approximately $1.2 million as of December 31, 2015. If overall interest rates had fallen by 10% during the year ended December 31, 2015, our interest income on cash equivalents and short-term investments would have not resulted in a material decrease assuming consistent investment levels. Such losses would only be realized if we sold the investments prior to maturity.
Foreign Currency Risk
As of December 31, 2015, foreign currency cash accounts totaled $2.6 million, primarily in the Euro, British Pounds, Chinese Yuan, Taiwan Dollar, Singapore Dollar and Indian Rupee.
Most of our sales are denominated in U.S. dollars, and therefore, our revenues are not currently subject to significant foreign currency risk. Our operating expenses are denominated in the currencies of the countries in which our operations are located and may be subject to fluctuations due to changes in foreign currency exchange rates, particularly changes in the Chinese Yuan, British Pound, Taiwan Dollar and Indian Rupee. Fluctuation in foreign currency exchange rates may cause us to recognize transaction gains and losses in our statement of operations. To date, foreign currency transaction gains and losses have not been material to our financial statements, and we have not engaged in any foreign currency hedging transactions.
51
ITEM 8. CONSOLIDATED FINANCIAL STATEMENTS AND SUPPLEMENTARY DATA
INDEX TO CONSOLIDATED FINANCIAL STATEMENTS
52
REPORT OF INDEPENDENT REGISTERED PUBLIC ACCOUNTING FIRM
To the Board of Directors and Stockholders of
Ruckus Wireless, Inc.
Sunnyvale, California
We have audited the accompanying consolidated balance sheets of Ruckus Wireless, Inc. and subsidiaries (the "Company") as of December 31, 2015 and 2014, and the related consolidated statements of operations, comprehensive income, stockholders' equity, and cash flows for each of the three years in the period ended December 31, 2015. These financial statements are the responsibility of the Company's management. Our responsibility is to express an opinion on these financial statements based on our audits.
We conducted our audits in accordance with the standards of the Public Company Accounting Oversight Board (United States). Those standards require that we plan and perform the audit to obtain reasonable assurance about whether the financial statements are free of material misstatement. An audit includes examining, on a test basis, evidence supporting the amounts and disclosures in the financial statements. An audit also includes assessing the accounting principles used and significant estimates made by management, as well as evaluating the overall financial statement presentation. We believe that our audits provide a reasonable basis for our opinion.
In our opinion, such consolidated financial statements present fairly, in all material respects, the financial position of Ruckus Wireless, Inc. and subsidiaries as of December 31, 2015 and 2014, and the results of their operations and their cash flows for each of the three years in the period ended December 31, 2015, in conformity with accounting principles generally accepted in the United States of America.
We have also audited, in accordance with the standards of the Public Company Accounting Oversight Board (United States), the Company's internal control over financial reporting as of December 31, 2015, based on the criteria established in Internal Control - Integrated Framework (2013) issued by the Committee of Sponsoring Organizations of the Treadway Commission and our report dated February 23, 2016 expressed an unqualified opinion on the Company's internal control over financial reporting.
/s/ Deloitte & Touche LLP
San Jose, California
February 23, 2016
53
REPORT OF INDEPENDENT REGISTERED PUBLIC ACCOUNTING FIRM
To the Board of Directors and Stockholders of
Ruckus Wireless, Inc.
Sunnyvale, California
We have audited the internal control over financial reporting of Ruckus Wireless, Inc. and subsidiaries (the "Company") as of December 31, 2015, based on criteria established in Internal Control - Integrated Framework (2013) issued by the Committee of Sponsoring Organizations of the Treadway Commission. The Company's management is responsible for maintaining effective internal control over financial reporting and for its assessment of the effectiveness of internal control over financial reporting, included in the accompanying Management’s Report on Internal Control over Financial Reporting. Our responsibility is to express an opinion on the Company's internal control over financial reporting based on our audit.
We conducted our audit in accordance with the standards of the Public Company Accounting Oversight Board (United States). Those standards require that we plan and perform the audit to obtain reasonable assurance about whether effective internal control over financial reporting was maintained in all material respects. Our audit included obtaining an understanding of internal control over financial reporting, assessing the risk that a material weakness exists, testing and evaluating the design and operating effectiveness of internal control based on the assessed risk, and performing such other procedures as we considered necessary in the circumstances. We believe that our audit provides a reasonable basis for our opinion.
A company's internal control over financial reporting is a process designed by, or under the supervision of, the company's principal executive and principal financial officers, or persons performing similar functions, and effected by the company's board of directors, management, and other personnel to provide reasonable assurance regarding the reliability of financial reporting and the preparation of financial statements for external purposes in accordance with generally accepted accounting principles. A company's internal control over financial reporting includes those policies and procedures that (1) pertain to the maintenance of records that, in reasonable detail, accurately and fairly reflect the transactions and dispositions of the assets of the company; (2) provide reasonable assurance that transactions are recorded as necessary to permit preparation of financial statements in accordance with generally accepted accounting principles, and that receipts and expenditures of the company are being made only in accordance with authorizations of management and directors of the company; and (3) provide reasonable assurance regarding prevention or timely detection of unauthorized acquisition, use, or disposition of the company's assets that could have a material effect on the financial statements.
Because of the inherent limitations of internal control over financial reporting, including the possibility of collusion or improper management override of controls, material misstatements due to error or fraud may not be prevented or detected on a timely basis. Also, projections of any evaluation of the effectiveness of the internal control over financial reporting to future periods are subject to the risk that the controls may become inadequate because of changes in conditions, or that the degree of compliance with the policies or procedures may deteriorate.
In our opinion, the Company maintained, in all material respects, effective internal control over financial reporting as of December 31, 2015, based on the criteria established in Internal Control - Integrated Framework (2013) issued by the Committee of Sponsoring Organizations of the Treadway Commission.
We have also audited, in accordance with the standards of the Public Company Accounting Oversight Board (United States), the consolidated financial statements as of and for the year ended December 31, 2015 of the Company and our report dated February 23, 2016 expressed an unqualified opinion on those financial statements.
/s/ Deloitte & Touche LLP
San Jose, California
February 23, 2016
54
RUCKUS WIRELESS, INC.
Consolidated Balance Sheets
(in thousands, except par value)
December 31, | |||||||
2015 | 2014 | ||||||
ASSETS | |||||||
Current assets: | |||||||
Cash and cash equivalents | $ | 69,687 | $ | 56,083 | |||
Short-term investments | 160,791 | 142,706 | |||||
Accounts receivable, net of allowance for doubtful accounts of $800 as of December 31, 2015 and 2014 | 70,649 | 59,553 | |||||
Inventories | 26,591 | 21,064 | |||||
Deferred costs | 3,669 | 4,414 | |||||
Deferred tax assets | — | 6,205 | |||||
Restricted cash | 5,000 | — | |||||
Prepaid expenses and other current assets | 6,168 | 5,367 | |||||
Total current assets | 342,555 | 295,392 | |||||
Property and equipment, net | 19,411 | 13,636 | |||||
Goodwill | 16,390 | 9,945 | |||||
Intangible assets, net | 8,625 | 7,351 | |||||
Non-current deferred tax asset | 30,217 | 21,166 | |||||
Restricted cash | — | 5,000 | |||||
Other assets | 1,623 | 1,504 | |||||
Total assets | $ | 418,821 | $ | 353,994 | |||
LIABILITIES AND STOCKHOLDERS’ EQUITY | |||||||
Current liabilities: | |||||||
Accounts payable | $ | 30,360 | $ | 23,538 | |||
Accrued liabilities | 7,748 | 5,282 | |||||
Accrued compensation | 14,902 | 13,765 | |||||
Deferred revenue | 36,602 | 39,231 | |||||
Total current liabilities | 89,612 | 81,816 | |||||
Non-current deferred revenue | 14,524 | 10,554 | |||||
Non-current deferred tax liabilities | 111 | 596 | |||||
Other non-current liabilities | 3,041 | 1,379 | |||||
Total liabilities | 107,288 | 94,345 | |||||
Commitments and contingencies (Note 8) | |||||||
Stockholders’ equity: | |||||||
Common stock, $0.001 par value; 250,000 shares authorized as of December 31, 2015 and 2014; 89,345 and 85,110 shares issued and outstanding at December 31, 2015 and 2014, respectively | 89 | 85 | |||||
Additional paid-in capital | 320,561 | 273,276 | |||||
Accumulated other comprehensive loss | (192 | ) | (97 | ) | |||
Accumulated deficit | (8,925 | ) | (13,615 | ) | |||
Total stockholders’ equity | 311,533 | 259,649 | |||||
Total liabilities and stockholders’ equity | $ | 418,821 | $ | 353,994 | |||
See notes to consolidated financial statements.
55
RUCKUS WIRELESS, INC.
Consolidated Statements of Operations
(in thousands, except per share amounts)
Years Ended December 31, | |||||||||||
2015 | 2014 | 2013 | |||||||||
Revenue: | |||||||||||
Product | $ | 343,659 | $ | 303,446 | $ | 245,935 | |||||
Service | 29,717 | 23,473 | 17,132 | ||||||||
Total revenue | 373,376 | 326,919 | 263,067 | ||||||||
Cost of revenue: | |||||||||||
Product | 105,314 | 90,651 | 78,344 | ||||||||
Service | 14,741 | 12,454 | 9,844 | ||||||||
Total cost of revenue | 120,055 | 103,105 | 88,188 | ||||||||
Gross profit | 253,321 | 223,814 | 174,879 | ||||||||
Operating expenses: | |||||||||||
Research and development | 94,234 | 77,164 | 61,783 | ||||||||
Sales and marketing | 109,864 | 98,634 | 79,185 | ||||||||
General and administrative | 41,799 | 33,622 | 33,752 | ||||||||
Total operating expenses | 245,897 | 209,420 | 174,720 | ||||||||
Operating income | 7,424 | 14,394 | 159 | ||||||||
Interest income | 701 | 199 | 187 | ||||||||
Other expense, net | (524 | ) | (463 | ) | (456 | ) | |||||
Income (loss) before income taxes | 7,601 | 14,130 | (110 | ) | |||||||
Income tax expense (benefit) | 2,911 | 5,940 | (1,899 | ) | |||||||
Net income | $ | 4,690 | $ | 8,190 | $ | 1,789 | |||||
Net income per share: | |||||||||||
Basic | $ | 0.05 | $ | 0.10 | $ | 0.02 | |||||
Diluted | $ | 0.05 | $ | 0.09 | $ | 0.02 | |||||
Weighted average shares used in computing net income per share: | |||||||||||
Basic | 87,418 | 82,908 | 76,744 | ||||||||
Diluted | 95,851 | 93,668 | 93,361 | ||||||||
See notes to consolidated financial statements.
56
RUCKUS WIRELESS, INC.
Consolidated Statements of Comprehensive Income
(in thousands)
Years Ended December 31, | |||||||||||
2015 | 2014 | 2013 | |||||||||
Net income | $ | 4,690 | $ | 8,190 | $ | 1,789 | |||||
Other comprehensive loss, net of tax: | |||||||||||
Unrealized loss on short-term investments | (95 | ) | (95 | ) | (2 | ) | |||||
Comprehensive income | $ | 4,595 | $ | 8,095 | $ | 1,787 | |||||
See notes to consolidated financial statements.
57
RUCKUS WIRELESS, INC.
Consolidated Statements of Stockholders’ Equity
(in thousands)
Common Stock | Additional paid-in capital | Accumulated other comprehensive loss | Accumulated deficit | Total stockholders’ equity | |||||||||||||||||||
Shares | Amount | ||||||||||||||||||||||
Balances at December 31, 2012 | 74,166 | $ | 74 | $ | 193,731 | $ | — | $ | (23,594 | ) | $ | 170,211 | |||||||||||
Stock-based compensation expense | — | — | 18,701 | — | — | 18,701 | |||||||||||||||||
Issuance of common stock upon exercise of common stock options | 5,903 | 6 | 7,230 | — | — | 7,236 | |||||||||||||||||
Vesting of early exercised common stock options | — | — | 35 | — | — | 35 | |||||||||||||||||
Repurchase of unvested early exercised common stock options | (1 | ) | — | — | — | — | — | ||||||||||||||||
Cashless exercise of common stock warrant | 278 | — | — | — | — | — | |||||||||||||||||
Shares issued under employee stock purchase plan | 345 | 1 | 3,859 | — | — | 3,860 | |||||||||||||||||
Excess tax benefit from employee stock incentive plans | — | — | 2,019 | — | — | 2,019 | |||||||||||||||||
Other comprehensive loss | — | — | — | (2 | ) | — | (2 | ) | |||||||||||||||
Net income | — | — | — | — | 1,789 | 1,789 | |||||||||||||||||
Balances at December 31, 2013 | 80,691 | $ | 81 | $ | 225,575 | $ | (2 | ) | $ | (21,805 | ) | $ | 203,849 | ||||||||||
Stock-based compensation expense | — | — | 26,594 | — | — | 26,594 | |||||||||||||||||
Issuance of common stock upon exercise of common stock options | 3,618 | 4 | 7,628 | — | — | 7,632 | |||||||||||||||||
Issuance of common stock upon vesting of restricted stock units | 319 | — | — | — | — | — | |||||||||||||||||
Shares issued under employee stock purchase plan | 482 | — | 4,296 | — | — | 4,296 | |||||||||||||||||
Excess tax benefit from employee stock incentive plans | — | — | 9,183 | — | — | 9,183 | |||||||||||||||||
Other comprehensive loss | — | — | — | (95 | ) | — | (95 | ) | |||||||||||||||
Net income | — | — | — | — | 8,190 | 8,190 | |||||||||||||||||
Balances at December 31, 2014 | 85,110 | $ | 85 | $ | 273,276 | $ | (97 | ) | $ | (13,615 | ) | $ | 259,649 | ||||||||||
Stock-based compensation expense | — | — | 28,824 | — | — | 28,824 | |||||||||||||||||
Issuance of common stock upon exercise of common stock options | 2,888 | 3 | 7,878 | — | — | 7,881 | |||||||||||||||||
Issuance of common stock upon vesting of restricted stock units | 874 | 1 | (1 | ) | — | — | — | ||||||||||||||||
Shares issued under employee stock purchase plan | 473 | — | 4,414 | — | — | 4,414 | |||||||||||||||||
Excess tax benefit from employee stock incentive plans | — | — | 6,170 | — | — | 6,170 | |||||||||||||||||
Other comprehensive loss | — | — | — | (95 | ) | — | (95 | ) | |||||||||||||||
Net income | — | — | — | — | 4,690 | 4,690 | |||||||||||||||||
Balances at December 31, 2015 | 89,345 | $ | 89 | $ | 320,561 | $ | (192 | ) | $ | (8,925 | ) | $ | 311,533 | ||||||||||
See notes to consolidated financial statements.
58
RUCKUS WIRELESS, INC.
Consolidated Statements of Cash Flows
(in thousands)
Years Ended December 31, | |||||||||||
2015 | 2014 | 2013 | |||||||||
Cash flows from operating activities | |||||||||||
Net income | $ | 4,690 | $ | 8,190 | $ | 1,789 | |||||
Adjustments to reconcile net income to cash provided by operating activities: | |||||||||||
Depreciation and amortization | 11,550 | 9,616 | 6,591 | ||||||||
Stock-based compensation | 28,793 | 26,594 | 18,701 | ||||||||
Amortization of investment premiums, net of accretion of purchase discounts | 2,376 | 1,278 | 1,071 | ||||||||
Deferred income taxes | 1,075 | 4,644 | (2,909 | ) | |||||||
Excess tax benefit from employee stock incentive plans | (6,170 | ) | (9,183 | ) | (2,019 | ) | |||||
Other | 294 | 400 | 1,086 | ||||||||
Changes in operating assets and liabilities, net of assets acquired and liabilities assumed from acquisitions: | |||||||||||
Accounts receivable | (10,959 | ) | (15,315 | ) | (4,253 | ) | |||||
Inventories | (5,527 | ) | (4,316 | ) | 2,293 | ||||||
Deferred costs | 745 | (207 | ) | 981 | |||||||
Prepaid expenses and other current assets | (866 | ) | 62 | (2,459 | ) | ||||||
Other assets | 86 | (286 | ) | 134 | |||||||
Accounts payable | 5,187 | 4,426 | 2,792 | ||||||||
Accrued compensation | 1,203 | 2,006 | 2,304 | ||||||||
Accrued liabilities | 2,556 | (731 | ) | 2,715 | |||||||
Deferred revenue | 831 | 9,548 | (249 | ) | |||||||
Net cash provided by operating activities | 35,864 | 36,726 | 28,568 | ||||||||
Cash flows from investing activities | |||||||||||
Purchase of investments | (153,556 | ) | (174,710 | ) | (83,442 | ) | |||||
Proceeds from the maturity of investments | 128,014 | 88,237 | 8,324 | ||||||||
Proceeds from the sale of investments | 5,048 | 3,012 | 13,128 | ||||||||
Cash used in acquisition, net of cash acquired | (7,218 | ) | — | (7,882 | ) | ||||||
Purchase of property, equipment and internal use software | (12,814 | ) | (9,479 | ) | (7,776 | ) | |||||
Increase in facility lease deposits | (199 | ) | (96 | ) | (300 | ) | |||||
Increase in restricted cash | — | — | (5,000 | ) | |||||||
Net cash used in investing activities | (40,725 | ) | (93,036 | ) | (82,948 | ) | |||||
Cash flows from financing activities: | |||||||||||
Proceeds from exercise of stock options | 7,881 | 7,632 | 7,236 | ||||||||
Proceeds from employee stock purchase plan | 4,414 | 4,296 | 3,860 | ||||||||
Excess tax benefit from employee stock incentive plans | 6,170 | 9,183 | 2,019 | ||||||||
Initial public offering costs | — | — | (839 | ) | |||||||
Net cash provided by financing activities | 18,465 | 21,111 | 12,276 | ||||||||
Net increase (decrease) in cash and cash equivalents | 13,604 | (35,199 | ) | (42,104 | ) | ||||||
Cash and cash equivalents at beginning of year | 56,083 | 91,282 | 133,386 | ||||||||
Cash and cash equivalents at end of year | $ | 69,687 | $ | 56,083 | $ | 91,282 | |||||
59
RUCKUS WIRELESS, INC.
Consolidated Statements of Cash Flows
(in thousands)
Years Ended December 31, | |||||||||||
2015 | 2014 | 2013 | |||||||||
Supplemental disclosure of cash flow information | |||||||||||
Income taxes paid | $ | 1,612 | $ | 740 | $ | 915 | |||||
Non-cash investing and financing activities | |||||||||||
Purchases of property and equipment recorded in accounts payable | $ | 2,652 | $ | 1,091 | $ | 1,111 | |||||
See notes to consolidated financial statements.
60
NOTES TO CONSOLIDATED FINANCIAL STATEMENTS
NOTE 1—DESCRIPTION OF BUSINESS AND SUMMARY OF SIGNIFICANT ACCOUNTING POLICIES
Description of Business— Ruckus Wireless, Inc. (“Ruckus”) is a global supplier of advanced Wi-Fi solutions. Ruckus' solutions, which are called Smart Wi-Fi, are used by service providers and enterprises to solve a range of network capacity, coverage and reliability challenges associated with increasing wireless traffic demands created by the growth in the number of users equipped with more powerful smart wireless devices using increasingly data rich applications and services. Ruckus markets and sells its products and technology directly and indirectly through a vast network of channel partners to a variety of service providers and enterprises around the world. Its Smart Wi-Fi solutions offer features and functionality such as enhanced reliability, consistent performance, extended range and massive scalability. Ruckus' products include high capacity, controllers, indoor and outdoor access points, wireless bridges, controller software platforms, software management solutions including reporting and analytics and unique Wi-Fi-related cloud services, such as location-based positioning, and certificate-based security and on-boarding of Wi-Fi devices. These hardware and software products and services incorporate various elements of the Company's proprietary technologies, including Smart Radio, SmartCast, SmartMesh, and Smart Scaling, to enable high performance in a variety of challenging operating environments.
Principles of Consolidation—The consolidated financial statements include the accounts of Ruckus and its wholly owned subsidiaries (collectively, the “Company”). All intercompany balances and transactions have been eliminated in consolidation.
Use of Estimates—The preparation of financial statements in conformity with generally accepted accounting principles (“GAAP”) in the United States of America requires management to make estimates and assumptions that affect the amounts reported in the consolidated financial statements and accompanying notes. Significant estimates and assumptions made by management include the determination of revenue recognition, valuation of inventory, goodwill and intangible assets, accounting for income taxes and stock-based compensation. Management bases its estimates on historical experience and also on assumptions that it believes are reasonable. Actual results could materially differ from those estimates.
Concentrations of Credit Risk and Significant Customers—Financial instruments that subject the Company to significant concentrations of credit risk primarily consist of cash, cash equivalents, short-term investments and accounts receivable. The Company invests only in high credit quality instruments and maintains its cash equivalents and short-term investments in fixed income securities. Management believes that the financial institutions that hold the Company’s investments are financially sound and, accordingly, are subject to minimal credit risk. Deposits held with banks may exceed the amount of insurance provided on such deposits. The Company’s accounts receivable are primarily derived from distributors and service providers located in the Americas, Europe, and Asia Pacific. The Company generally does not require its customers to provide collateral to support accounts receivable. To reduce credit risk, management performs ongoing credit evaluations of its customers’ financial condition. The Company has recorded an allowance for doubtful accounts for those receivables management has determined not to be collectible.
The percentages of revenue from individual customers totaling greater than 10% of total consolidated Company revenue were as follows:
Years Ended December 31, | ||||||||
2015 | 2014 | 2013 | ||||||
Distributor A | 14.4 | % | 14.8 | % | 15.2 | % | ||
Distributor B | 12.3 | % | 12.5 | % | 12.4 | % | ||
Distributor C | * | 10.9 | % | * | ||||
* Less than 10% | ||||||||
Each of the Company’s greater than 10% customers are third-party distributors, and in 2015, 2014 and 2013, no single value added reseller or end customer accounted for more than 10% of the Company's total consolidated revenue.
The percentage of receivables from individual customers totaling greater than 10% of total consolidated Company accounts receivable, net, were as follows:
December 31, | |||||
2015 | 2014 | ||||
Distributor C | 20.3 | % | 12.5 | % | |
Cash and Cash Equivalents—The Company considers all highly liquid financial instruments with original maturities of 90 days or less from date of purchase to be cash equivalents. Cash and cash equivalents are stated at cost, which approximates fair value. The Company’s cash equivalents included interest-bearing bank accounts, money market funds and corporate debt securities.
61
Restricted Cash—As of December 31, 2015, the Company held $5.0 million in escrow to secure an indemnification agreement. If triggered, the Company will indemnify a channel partner for reimbursement of penalties assessed under the Information Technology Act of India (“IT Act”). In the second quarter of 2016, the escrow will expire, but the indemnification agreement will continue. Refer to “Reimbursement of Penalties” in Note 8.
Fair Value of Financial Instruments—The Company defines fair value as the price that would be received from selling an asset or paid to transfer a liability in an orderly transaction between market participants at the measurement date. When determining the fair value measurements for assets and liabilities which are required to be recorded at fair value, the Company considers the principal or most advantageous market in which to transact and the market-based risk. The Company applies fair value accounting for all financial assets and liabilities that are recognized or disclosed at fair value in the financial statements on a recurring basis. The carrying amounts reported in the consolidated financial statements approximate the fair value for cash and cash equivalents, accounts receivable, accounts payable and accrued liabilities, due to their short-term nature.
Short-Term Investments—The Company’s short-term investments consist primarily of corporate debt securities, U.S. government agency securities and U.S. government treasury bills. The Company classifies investments as available-for-sale at the time of purchase. As the Company views these securities as available to support current operations, the Company classifies securities with maturities beyond 12 months as current assets. The Company's policy is to protect the value of its investment portfolio and minimize principal risk by earning returns based on current interest rates.
Available-for-sale investments are initially recorded at cost and periodically adjusted to fair value in the consolidated balance sheets. Unrealized gains and losses on these investments are reported as a separate component of accumulated other comprehensive income (loss). Realized gains and losses are reported in the consolidated statements of operations. A specific identification method is used to determine the cost basis of the short-term investments sold. The effects of reclassifications from accumulated other comprehensive income (loss) to the income statement were insignificant for all periods presented. The investments are adjusted for the amortization of premiums and discounts until maturity and such amortization is included in interest income.
Investments are considered impaired when a decline in fair value is judged to be other-than-temporary. The Company consults with its investment managers and considers available quantitative and qualitative evidence in evaluating potential impairment of the investments on a quarterly basis. If the cost of an individual investment exceeds its fair value, the Company evaluates, among other factors, general market conditions, the duration and extent to which the fair value is less than cost, and the Company’s intent and ability to hold the investment. Once a decline in fair value is determined to be other-than-temporary, the Company will record an impairment charge and establish a new cost basis in the investment. During the year ended December 31, 2015 and 2014, the Company did not consider any of its investments to be other-than-temporarily impaired.
Allowance for Doubtful Accounts—The Company records an allowance for doubtful accounts based on historical experience and a detailed assessment of the collectability of its accounts receivable. In estimating the allowance for doubtful accounts, management considers, among other factors, the aging of the accounts receivable, historical write-offs and the credit-worthiness of each customer. If circumstances change, such as higher-than-expected defaults or an unexpected material adverse change in a major customer’s ability to meet its financial obligations, the Company’s estimate of the recoverability of the accounts receivable could be reduced by a material amount.
Activity in the allowance for doubtful accounts was as follows (in thousands):
Years Ended December 31, | |||||||||||
2015 | 2014 | 2013 | |||||||||
Balance at beginning of year | $ | 800 | $ | 400 | $ | 140 | |||||
Charged to expense | 227 | 400 | 911 | ||||||||
Write-offs | (227 | ) | — | (651 | ) | ||||||
Balance at end of year | $ | 800 | $ | 800 | $ | 400 | |||||
Inventories—Inventories are carried at the lower of cost or market, on a first-in, first-out basis. The Company evaluates inventory for excess and obsolete products, based on management’s assessment of future demand, market conditions and technical obsolescence. The Company subcontracts manufacturing of substantially all of its products. At December 31, 2015 and 2014, inventories were predominately comprised of finished goods.
Deferred Costs—When the Company’s products have been delivered, but the product revenue associated with the arrangement has been deferred as a result of not meeting the revenue recognition criteria (see “Revenue Recognition” below), the related product costs are also deferred if the inventory is deemed recoverable. The deferred costs are recognized in cost of revenues when the related deferred revenue is recognized or when the inventory is deemed unrecoverable.
Property and Equipment—Property and equipment are stated at cost, less accumulated depreciation and amortization. Depreciation is calculated using the straight-line method over the estimated useful lives of the respective assets. Leasehold improvements are amortized using the straight-line method over the shorter of the estimated useful lives of the leasehold improvements or the term of the related lease.
62
Goodwill—Goodwill represents the excess of the purchase price of an acquired business over the fair value of the underlying net tangible and intangible assets. The Company evaluates goodwill for impairment annually in the fourth quarter or whenever events or changes in circumstances indicate the carrying value of goodwill may not be recoverable. Triggering events that may indicate impairment include, but are not limited to, a significant adverse change in customer demand or business climate that could affect the value of goodwill or a significant decrease in expected cash flows. The Company performs the impairment testing by first assessing qualitative factors to determine whether the existence of events or circumstances leads to a determination that it is more likely than not that the fair value of its reporting unit is less than its carrying amount. If, after assessing the totality of events or circumstances, the Company determines it is more likely than not that the fair value of a reporting unit is less than its carrying amount, the Company performs a two-step impairment test. The first step requires the identification of the reporting units and comparison of the fair value of a reporting unit with its carrying amount, including goodwill. If the fair value of the reporting unit is less than its carrying value, an indication of goodwill impairment exists for the reporting unit and the second step of the impairment test is performed to compute the amount of the impairment. Under the second step, an impairment loss is recognized for any excess of the carrying amount of the reporting unit's goodwill over the implied fair value of that goodwill. The Company has determined that it has only one reporting unit. For the years ended December 31, 2015 and 2014, no impairment has been recognized related to the goodwill balance.
Intangible Assets—Intangible assets consist primarily of purchased technology and acquired customer relationships resulting from acquisitions. Intangible assets are recorded at fair value and are amortized on a straight-line basis over their estimated useful lives, which ranges from four to five years.
Software Development Costs—Capitalization of software development costs for software to be sold, leased, or otherwise marketed begins upon the establishment of technological feasibility. To date, software development costs incurred between completion of a working model and general release of the related product have not been material. Accordingly, the Company has charged all such costs to research and development expense in the period incurred.
Internal Use Software—The Company capitalizes development costs associated with customized internal-use software systems that have reached the application development stage. Such capitalized costs include internal and external costs associated with the development of the applications. Capitalization of such costs begins when the preliminary project stage is complete and ceases at the point in which the project is substantially complete and is ready for its intended purpose. The Company amortizes the capitalized costs on a straight-line basis over the estimated useful life, generally five years. For the year ended December 31, 2015, $3.9 million of software development costs were capitalized. The Company has not amortized the capitalized costs for the periods presented.
Impairment of Long-Lived Assets—Long-lived assets, including intangible assets, are reviewed for impairment whenever events or changes in circumstances indicate that the carrying amount of such assets may not be recoverable. Triggering events that may indicate impairment include, but are not limited to, significant underperformance relative to estimated results, significant changes in the manner of the Company's use of the acquired assets or the strategy for its overall business and significant negative industry or economic trends. Determination of recoverability of long-lived assets is based on an estimate of undiscounted future cash flows resulting from the use of the asset and its eventual disposition. If intangible assets are considered to be impaired, the impairment to be recognized equals the amount by which the carrying value of the asset exceeds the assets fair market value. The Company did not record any impairment charges in the periods presented.
Revenue Recognition—The Company generates revenue from sales of its products and services through a direct sales force and indirect relationships with its channel partners. Revenue is recognized when all of the following criteria are met:
• | Persuasive evidence of an arrangement exists. The Company relies upon sales contracts and purchase orders to determine the existence of an arrangement. |
• | Delivery has occurred. Delivery is deemed to have occurred when title has transferred. The Company uses shipping documents to verify transfer of title. |
• | The fee is fixed or determinable. The Company assesses whether the fee is fixed or determinable based on the terms associated with the transaction. |
• | Collectability is reasonably assured. The Company assesses collectability as sales occur, based on an analysis of the customer's credit and payment history. |
Certain of the Company's arrangements are multiple-element arrangements and may include hardware, post-contract support (“PCS”), stand-alone software and software as a service. All of its products and services qualify as separate units of accounting. For multiple-element arrangements, the Company allocates revenue to each unit of accounting based on an estimated selling price at the inception of the arrangement. The total arrangement consideration is allocated to each separate unit of accounting using the relative estimated selling prices of each unit. The Company limits the amount of revenue recognized for delivered elements to an amount that is not contingent upon future delivery of additional products or services.
To determine the estimated selling price in multiple-element arrangements, the Company first looks to establish vendor specific objective evidence (“VSOE”) of the selling price using the prices charged for a deliverable when sold separately. If VSOE of the selling price cannot be established for a deliverable, the Company looks to establish third-party evidence (“TPE”) of the selling price by evaluating the pricing of similar and interchangeable competitor products or services in stand-alone arrangements. However, as the Company's products contain a significant element of proprietary technology and offer substantially different features and functionality from its competitors, the Company has been unable to obtain comparable pricing information with respect to its competitors’ products. Therefore, the Company has not been able to obtain reliable evidence of TPE of the selling price. If neither VSOE nor TPE of the selling price can be established for a deliverable, the Company establishes
63
best estimate selling price (“BESP”) by reviewing historical transaction information and considering several other internal factors, including discounting and margin objectives.
The Company regularly reviews estimated selling price of the product offerings and maintain internal controls over the establishment and updates of these estimates. The Company currently does not expect a material impact in the near term from changes in estimated selling prices, including VSOE of selling price.
Product Revenue. The Company's product revenue consists of revenue from sales of its hardware and stand-alone software licenses and is net of allowances for estimated sales returns, product rebates, stock rotations, and other programs based on historical experience.
The Company's hardware deliverables typically include proprietary operating system software, which together deliver the essential functionality of its products. Therefore, the Company's hardware appliances are considered non-software elements and are not subject to the industry-specific software revenue recognition guidance. The Company generates revenue through a direct sales force and indirect relationships with its channel partners. For sales to direct end customers and certain channel partners, the Company recognizes product revenue at the time of the title transfer, assuming all other revenue recognition criteria are met. Certain of the Company's distributors that stock its products are granted significant rebates for sales of the Company's products. Therefore, the arrangement fee for this group of distributors is not fixed and determinable when products are shipped to these distributors and revenue is deferred until the Company's products are shipped to the distributors’ customer.
The Company's product revenue also includes revenue from the sale of stand-alone software products. Sales of stand-alone software generally include a perpetual license. Stand-alone software products may operate in conjunction with the Company's hardware products but are not considered essential to the functionality of the hardware.
For sales of stand-alone software, the Company recognizes revenue based on software revenue recognition guidance. Under the software revenue recognition guidance, the Company uses the residual method to recognize revenue when a product agreement includes one or more elements to be delivered at a future date and VSOE of the fair value of all undelivered elements exists. In the majority of the Company's contracts, the only element that remains undelivered at the time of delivery of the product is PCS. Under the residual method, the fair value of the undelivered elements is deferred and the remaining portion of the contract fee is recognized as product revenue. If evidence of the fair value of one or more undelivered elements does not exist, all revenue is generally deferred and recognized when delivery of those elements occurs or when fair value can be established. When the only undelivered element for which the Company does not have VSOE of selling price is PCS, revenue for the entire arrangement is bundled and recognized ratably over the support period.
Service Revenue. The Company's service revenue consists of revenue from PCS and software as a service. PCS includes software updates on an “if and when available” basis, expedited replacement for defective access points and controllers, telephone and internet access to technical support personnel and hardware support. PCS and software as a service are typically sold in one, three or five year terms and the Company recognizes the revenue ratably over the contractual service period.
Sales Tax and Shipping. Revenue is reported net of sales taxes. Shipping charges billed to channel partners are included in revenue and related costs are included in cost of revenue. To date, shipping charges have not been significant.
Stock-Based Compensation—The Company measures compensation expense for all stock-based payment awards granted to employees, including stock options, restricted stock units (“RSUs”), performance awards and stock purchase rights under the Company's Employee Stock Purchase Plan (“ESPP”), based on the estimated fair value on the date of the grant. The fair value of each stock option granted is estimated using the Black-Scholes option pricing model. The fair value of each RSU granted represents the closing price of the Company's common stock on the date of grant. The fair value of stock purchase rights under the Company’s ESPP is calculated based on the closing price of the Company's common stock on the date of grant and the value of put and call options estimated using the Black-Scholes option pricing model. Stock-based compensation is recognized on a straight-line basis over the requisite service period, net of estimated forfeitures. The forfeiture rate is based on an analysis of the Company’s actual historical forfeitures.
Foreign Currency—The functional currency of the Company’s foreign subsidiaries is the U.S. dollar. Monetary assets and liabilities at the foreign subsidiary are re-measured using the current exchange rate at the balance sheet date. Non-monetary assets and liabilities and capital accounts are presented using historical exchange rates. Revenues and expenses are presented using the average exchange rates in effect during the period. Foreign currency re-measurement gains and losses and foreign currency transaction gains and losses have not been material for any periods presented.
64
Income Taxes—The Company utilizes the asset and liability method of accounting for income taxes. Under this method, deferred tax assets and liabilities are determined based on differences between financial reporting and tax reporting bases of assets and liabilities, and are measured using enacted tax rates and laws that are expected to be in effect when the differences are expected to reverse. The Company records a valuation allowance when necessary to reduce its deferred tax assets to the amount that is more likely than not to be realized. In order for the Company to realize its deferred tax assets, the Company must be able to generate sufficient taxable income in those jurisdictions where the deferred tax assets are located. In determining the need for a valuation allowance, the Company considers future growth, forecasted earnings, future taxable income, the mix of earnings in the jurisdictions in which it operates, historical earnings, taxable income in prior years, if carryback is permitted under the law, carry-forward periods, and prudent and feasible tax planning strategies. In the event the Company were to determine that not all or part of its net deferred tax assets are not more likely than not to be realized in the future, an adjustment to the deferred tax assets valuation allowance would be charged to earnings in the period in which it makes such a determination, or goodwill would be adjusted if the valuation allowance related to deferred tax assets acquired in a business combination and the adjustment is within the measurement period. If the Company later determines that it is more likely than not that the deferred tax assets would be realized, it would reverse the previously provided valuation allowance as an adjustment to earnings at such time.
The amount of income tax the Company pays is subject to ongoing audits by federal, state and foreign tax authorities, which often result in proposed assessments. The Company records uncertain tax positions in accordance with accounting standards on the basis of a two-step process whereby (1) a determination is made as to whether it is more likely than not that the tax positions will be sustained based on the technical merits of the position and (2) for those tax positions that meet the more likely than not recognition threshold the Company recognizes the largest amount of tax benefit that is more likely than not to be realized upon ultimate settlement with the related tax authority. The Company recognizes interest and penalties related to uncertain tax positions in its provision for income taxes line in the accompanying consolidated statements of operations.
Loss Contingencies—The Company is subject to the possibility of various loss contingencies arising in the ordinary course of business. The Company considers the likelihood of loss or impairment of an asset, or the incurrence of a liability, as well as the Company's ability to reasonably estimate the amount of loss, in determining loss contingencies. An estimated loss contingency is accrued when it is probable that an asset has been impaired or a liability has been incurred and the amount of loss can be reasonably estimated. If the Company determines that a loss is possible and the range of the loss can be reasonably determined, then the Company discloses the range of the possible loss. The Company regularly evaluates available current information to determine whether an accrual is required, an accrual should be adjusted or a range of possible loss should be disclosed.
Recent Accounting Pronouncements—In November 2015, the Financial Accounting Standard Board ("FASB") issued accounting standards update (“ASU”) 2015-17, Balance Sheet Classification of Deferred Taxes, which simplifies the presentation of deferred income taxes. This ASU requires that deferred tax assets and liabilities be classified as non-current in a statement of financial position. The Company early adopted ASU 2015-17 effective December 31, 2015 on a prospective basis. Adoption of this ASU resulted in a reclassification of $6.3 million net current deferred tax asset to the net non-current deferred tax asset in the consolidated balance sheet as of December 31, 2015. No prior periods were retrospectively adjusted.
In September 2015, the FASB issued ASU 2015-16, Business Combinations (Topic 805) – Simplifying the Accounting for Measurement-Period Adjustments. The guidance eliminates the requirement for an acquirer in a business combination to retrospectively account for measurement-period adjustments. Instead, acquirers must recognize measurement-period adjustments during the reporting period in which the adjustment amounts are determined, and the effect of the adjustments on the income statement must be calculated as if the accounting had been completed at the acquisition date. In addition, the update requires an entity to present separately on the face of the income statement or in the notes to the financial statements the portion of the amount recorded in current-period earnings by line item that would have been recorded in previous reporting periods if the adjustment to the provisional amounts had been recognized as of the acquisition date. For public entities, the guidance is effective for fiscal years beginning after December 15, 2015, including interim periods within those fiscal years. The guidance should be applied prospectively to adjustments to provisional amounts that occur after the effective date, with earlier application permitted for financial statements that have not been issued. The Company is currently evaluating the impact of this accounting standard update on its consolidated financial position, results of operations and cash flows and does not expect the impact to be material.
In July 2015, the FASB issued ASU 2015-11, Simplifying the Measurement of Inventory. The update replaces the concept of "lower of cost or market" with that of "lower of cost and net realizable value", which requires companies to measure certain inventory at the lower of cost and net realizable value. This accounting guidance is effective for fiscal years beginning after December 15, 2016, and interim periods within those years on a prospective basis. Early application is permitted. The Company is currently evaluating the impact of this accounting standard update on its consolidated financial position, results of operations and cash flows and does not expect the impact to be material.
In April 2015, the FASB issued ASU 2015-05, Customer’s Accounting for Fees Paid in a Cloud Computing Arrangement. The new standard provides guidance to customers about whether a cloud computing arrangement includes a software license. If a cloud computing arrangement includes a software license, then the customer should account for the software license element of the arrangement consistent with the acquisition of other software licenses. If a cloud computing arrangement does not include a software license, the customer should account for the arrangement as a service contract. The new standard is effective for fiscal years, and interim periods within those fiscal years, beginning after December 15, 2015. Early adoption is permitted. The Company is evaluating the impact, if any, of this accounting standard update on its consolidated financial position, results of operations and cash flows.
65
In May 2014, the FASB issued ASU 2014-09, Revenue from Contracts with Customers, a converged standard on revenue recognition. Some of the main areas of transition to the new standard include, among others, transfer of control (revenue is recognized when a customer obtains control of a good or service), allocation of transaction price based on relative stand-alone selling price (entities that sell multiple goods or services in a single arrangement must allocate the consideration to each of those goods or services), contract costs (entities sometimes incur costs, such as sales commissions or mobilization activities, to obtain or fulfill a contract), and disclosures (extensive disclosures are required to provide greater insight into both revenue that has been recognized, and revenue that is expected to be recognized in the future from existing contracts). In July 2015, the FASB issued ASU 2015-14 to affirm a one-year deferral of the effective date of the new revenue standard. The accounting standard will be effective for the Company beginning in its first quarter of 2018, with early adoption permitted, but not before the original effective date of annual periods beginning after December 15, 2016, using one of two methods of adoption: (i) retrospective to each prior reporting period presented, with the option to elect certain practical expedients as defined within the standard; or (ii) retrospective with the cumulative effect of initially applying the standard recognized at the date of initial application inclusive of certain additional disclosures. The Company is currently evaluating the impact of this accounting standard update on its consolidated financial position, results of operations and cash flows.
NOTE 2—FAIR VALUE DISCLOSURE
Assets and liabilities recorded at fair value in the consolidated financial statements are categorized based upon the level of judgment associated with the inputs used to measure their fair value. The Company categorizes its financial instruments into a fair value hierarchy that prioritizes the inputs to valuation techniques used to measure fair value. The hierarchy gives the highest priority to unadjusted quoted prices in active markets for identical assets or liabilities (Level 1 measurements) and the lowest priority to unobservable inputs (Level 3 measurements).
A financial instrument’s level within the fair value hierarchy is based on the lowest level of any input that is significant to the fair value measurement. There were no transfers between levels during the years ended December 31, 2015 and 2014. Hierarchical levels that are directly related to the amount of subjectivity associated with the inputs to the valuation of these assets or liabilities are as follows:
Level 1 | Quoted prices (unadjusted) in active markets that are accessible at the measurement date for identical assets or liabilities. | |
Level 2 | Observable prices that are based on inputs not quoted on active markets, but corroborated by market data. | |
Level 3 | Unobservable inputs are used when little or no market data is available. | |
66
The Company’s assets that were measured at fair value by level within the fair value hierarchy were as follows (in thousands):
December 31, 2015 | |||||||||||||||
Fair Value | Level 1 | Level 2 | Level 3 | ||||||||||||
Assets | |||||||||||||||
Cash equivalents: | |||||||||||||||
Money market funds | $ | 13,073 | $ | 13,073 | $ | — | $ | — | |||||||
Short-term investments: | |||||||||||||||
Corporate debt securities | 99,747 | — | 99,747 | — | |||||||||||
U.S. government agency securities | 22,055 | — | 22,055 | — | |||||||||||
U.S. government treasury bills | 38,989 | 38,989 | — | — | |||||||||||
Total assets measured and recorded at fair value | $ | 173,864 | $ | 52,062 | $ | 121,802 | $ | — | |||||||
December 31, 2014 | |||||||||||||||
Fair Value | Level 1 | Level 2 | Level 3 | ||||||||||||
Assets: | |||||||||||||||
Cash equivalents: | |||||||||||||||
Money market funds | $ | 2,771 | $ | 2,771 | $ | — | $ | — | |||||||
Corporate debt securities | 3,000 | — | 3,000 | — | |||||||||||
Short-term investments: | |||||||||||||||
Corporate debt securities | 118,323 | — | 118,323 | — | |||||||||||
U.S. government agency securities | 24,383 | — | 24,383 | — | |||||||||||
Total assets measured and recorded at fair value | $ | 148,477 | $ | 2,771 | $ | 145,706 | $ | — | |||||||
NOTE 3—SHORT-TERM INVESTMENTS
Short-term investments consisted of the following (in thousands):
December 31, 2015 | |||||||||||||||
Amortized Cost | Unrealized Gains | Unrealized Losses | Fair Value | ||||||||||||
Corporate debt securities | $ | 99,916 | $ | 2 | $ | (171 | ) | $ | 99,747 | ||||||
U.S. government agency securities | 22,100 | — | (45 | ) | 22,055 | ||||||||||
U.S. government treasury bills | 39,075 | — | (86 | ) | 38,989 | ||||||||||
Total short-term investments | $ | 161,091 | $ | 2 | $ | (302 | ) | $ | 160,791 | ||||||
December 31, 2014 | |||||||||||||||
Amortized Cost | Unrealized Gains | Unrealized Losses | Fair Value | ||||||||||||
Corporate debt securities | $ | 118,470 | $ | — | $ | (147 | ) | $ | 118,323 | ||||||
U.S. government agency securities | 24,392 | 4 | (13 | ) | 24,383 | ||||||||||
Total short-term investments | $ | 142,862 | $ | 4 | $ | (160 | ) | $ | 142,706 | ||||||
67
The gross realized gains and gross realized losses related to the Company’s short-term investments were not material for the years ended December 31, 2015, 2014, and 2013.
The cost basis and fair value of the short-term investments by contractual maturity consist of the following (in thousands):
December 31, 2015 | |||||||
Amortized Cost | Fair Value | ||||||
One year or less | $ | 105,266 | $ | 105,150 | |||
Over one year and less than two years | 55,825 | 55,641 | |||||
Total short-term investments | $ | 161,091 | $ | 160,791 | |||
December 31, 2014 | |||||||
Amortized Cost | Fair Value | ||||||
One year or less | $ | 114,231 | $ | 114,113 | |||
Over one year and less than two years | 28,631 | 28,593 | |||||
Total short-term investments | $ | 142,862 | $ | 142,706 | |||
Investments in an unrealized loss position consisted of the following (in thousands):
December 31, 2015 | December 31, 2014 | ||||||||||||||
Less Than 12 Months | |||||||||||||||
Fair Value | Unrealized Loss | Fair Value | Unrealized Loss | ||||||||||||
Corporate debt securities | $ | 80,369 | $ | (171 | ) | $ | 105,187 | $ | (147 | ) | |||||
U.S. government agency securities | 22,055 | (45 | ) | 15,773 | (13 | ) | |||||||||
U.S. government treasury bills | 38,989 | (86 | ) | — | — | ||||||||||
Total short-term investments | $ | 141,413 | $ | (302 | ) | $ | 120,960 | $ | (160 | ) | |||||
The Company reviews the individual securities in its portfolio to determine whether a decline in a security’s fair value below the amortized cost basis is other-than-temporary. The Company determined that as of December 31, 2015 and 2014 there were no investments in its portfolio that were other-than-temporarily impaired. The Company does not intend to sell any of these investments, and it is not more likely than not that the Company would be required to sell these investments before recovery of their amortized cost basis, which may be at maturity.
NOTE 4—BUSINESS COMBINATION
On October 21, 2015, the Company completed the acquisition of Cloudpath Networks, Inc. (“Cloudpath”), a privately-held company providing secure device onboarding software and certificate-based Wi-Fi security. The Company acquired all of the outstanding capital stock of Cloudpath for $9.0 million in cash, of which $1.4 million, subject to certain adjustments, will be paid following the second anniversary of the acquisition date. As a result of the acquisition, the Company offers Cloudpath's secure device onboarding software or software as a service to onboard all new devices simply and securely.
The Company allocated the total purchase price consideration to the net assets acquired, including identifiable intangible assets, based on their respective fair values at the acquisition date. The excess purchase price over the fair value of the net assets acquired was recorded as goodwill. There are a number of factors contributing to the amount of goodwill, including Cloudpath's workforce and the expectation that the acquisition will create synergies, which will provide future value to the Company. The goodwill is not expected to be deductible for income tax purposes.
The purchase allocation for Cloudpath is summarized as follows (in thousands):
68
Fair Value | |||
Cash and cash equivalents | $ | 431 | |
Other tangible assets | 416 | ||
Purchased technology | 2,300 | ||
Customer relationships | 1,600 | ||
Trade name | 360 | ||
Goodwill | 6,445 | ||
Non-current deferred tax liabilities | (1,813 | ) | |
Deferred revenue | (510 | ) | |
Other liabilities assumed | (229 | ) | |
Total purchase consideration | $ | 9,000 | |
In connection with the acquisition, the Company may pay additional cash compensation of up to $9.0 million. The cash compensation is contingent upon the continued employment of a founder with the Company. $7.5 million of this cash compensation will vest and be paid in installments every six months over a period of two years from the date of acquisition. Up to $1.5 million is contingent upon certain billing targets of Cloudpath products and services as well as the founder providing continuous service and is expected to be paid in the first quarter of 2018.
To retain the services of former Cloudpath employees who became employees of the Company, the Company agreed to $0.9 million in cash incentives, which vest and are paid over a two-year period, and granted 195,705 RSUs under the Company’s Amended and Restated 2012 Equity Incentive Plan. The fair value of the equity awards of $2.3 million will be recognized over a four-year requisite service period. As the cash incentives are subject to continued employment, they will be recorded as post-acquisition compensation expense.
The Company recorded post-acquisition compensation expense of $1.3 million related to Cloudpath founders and former employees for the year ended December 31, 2015. Acquisition related costs were not material for the year ended December 31, 2015.
Pro forma results of operations for the Cloudpath acquisition have not been presented because they are not material to the consolidated statements of operations.
NOTE 5—GOODWILL AND INTANGIBLE ASSETS
Goodwill consisted of the following (in thousands):
Amount | |||
December 31, 2014 and 2013 | $ | 9,945 | |
Goodwill from the acquisition of Cloudpath | 6,445 | ||
December 31, 2015 | $ | 16,390 | |
69
Intangible assets consisted of the following (in thousands, except years):
Gross Carrying Amount | Accumulated Amortization | Net Carrying Amount | Weighted Average Remaining Life (Years) | ||||||||||
December 31, 2015 | |||||||||||||
Purchased technology | $ | 14,900 | $ | (8,159 | ) | $ | 6,741 | 2.9 | |||||
Customer relationships | 1,600 | (62 | ) | 1,538 | 4.8 | ||||||||
Trade name | 360 | (14 | ) | 346 | 4.8 | ||||||||
Total | $ | 16,860 | $ | (8,235 | ) | $ | 8,625 | ||||||
December 31, 2014 | |||||||||||||
Purchased technology | $ | 12,600 | $ | (5,249 | ) | $ | 7,351 | 2.8 | |||||
On October 21, 2015, the Company recorded the fair value of intangible assets of $4.3 million related to acquisition of Cloudpath, including purchased technology of $2.3 million, customer relationships of $1.6 million and trade name of $0.4 million.
Amortization expense related to intangible assets were $3.0 million, $2.3 million and $1.3 million for the years ended December 31, 2015, 2014 and 2013, respectively. Amortization expense is primarily included as a component of cost of revenue in the accompanying consolidated statements of operations.
The following table presents the estimated future amortization expense of intangible assets as of December 31, 2015 (in thousands):
Year ending December 31, | Amount | ||
2016 | $ | 3,383 | |
2017 | 2,352 | ||
2018 | 1,352 | ||
2019 | 852 | ||
2020 | 686 | ||
Total amortization | $ | 8,625 | |
70
NOTE 6—PROPERTY AND EQUIPMENT
Property and equipment consisted of the following (in thousands, except estimated useful lives):
December 31, | |||||||||
Estimated Useful Lives | 2015 | 2014 | |||||||
Computer hardware | 3 years | $ | 15,310 | $ | 11,167 | ||||
Computer software | 3 years | 7,839 | 4,070 | ||||||
Machinery, equipment and tooling | 2 to 3 years | 13,661 | 10,800 | ||||||
Furniture and fixtures | 7 years | 1,934 | 1,584 | ||||||
Leasehold improvements | 3 to 10 years | 5,201 | 3,911 | ||||||
Total property and equipment | 43,945 | 31,532 | |||||||
Less: accumulated depreciation and amortization | (24,534 | ) | (17,896 | ) | |||||
Total property and equipment, net | $ | 19,411 | $ | 13,636 | |||||
Computer software includes capitalized development costs for internal use software of $4.1 million as of December 31, 2015.
For the years ended December 31, 2015, 2014 and 2013, expense related to depreciation and amortization of property and equipment was $8.6 million, $7.3 million and $5.3 million, respectively.
NOTE 7—DEFERRED REVENUE
Deferred revenue consisted of the following (in thousands):
December 31, | |||||||
2015 | 2014 | ||||||
Product | $ | 15,170 | $ | 22,900 | |||
Service | 35,956 | 26,885 | |||||
Total deferred revenue | $ | 51,126 | $ | 49,785 | |||
Reported as: | |||||||
Current | $ | 36,602 | $ | 39,231 | |||
Non-current | 14,524 | 10,554 | |||||
Total deferred revenue | $ | 51,126 | $ | 49,785 | |||
Deferred product revenue relates to arrangements where not all revenue recognition criteria have been met. Deferred service revenue represents support contracts and software as a service contracts billed in advance and revenue is recognized ratably over the service period, typically one to five years.
71
NOTE 8—COMMITMENTS AND CONTINGENCIES
Operating Leases—The Company’s primary facilities are located in Sunnyvale, California, Taipei, Taiwan, Bangalore, India, Shenzhen, China, Singapore and Wooburn Green, United Kingdom, and are leased under non-cancelable operating lease arrangements. Rent expense was $4.9 million, $4.7 million and $4.4 million for the years ended December 31, 2015, 2014 and 2013, respectively.
Future minimum lease payments under non-cancelable operating leases are as follows (in thousands):
Years ending December 31, | Amount | ||
2016 | $ | 4,942 | |
2017 | 4,418 | ||
2018 | 3,476 | ||
2019 | 2,570 | ||
2020 | 2,496 | ||
Thereafter | 4,993 | ||
Operating lease obligations | $ | 22,895 | |
Litigation—The Company is involved in legal proceedings, claims and litigation arising in the ordinary course of business. Management is not currently aware of any matters that it expects will have a material adverse effect on the consolidated financial position, results of operations, or cash flows of the Company.
For the year ended December 31, 2015, the Company paid a total of $1.6 million in settlement of patent litigation. For the year ended December 31, 2014, the Company settled several patent litigation claims for a net gain of $0.8 million. Gains or losses from litigation settlements are included in general and administrative expense in the consolidated statements of operations.
Purchase Commitments— As of December 31, 2015, the Company had current purchase commitments of $10.3 million for inventory and specific contractual services.
Indemnification Agreements— The Company indemnifies its directors for certain events or occurrences, subject to certain limits, while the director is or was serving at the Company’s request in such capacity. The term of the indemnification period is for the director’s term of service. The Company may terminate the indemnification agreements with its directors upon the termination of their services as directors of the Company, but termination will not affect claims for indemnification related to events occurring prior to the effective date of termination. The maximum amount of potential future indemnification is unlimited; however, the Company has a director insurance liability policy that limits its exposure. The Company believes the fair value of these indemnification agreements is minimal. The Company has also entered into customary indemnification agreements with each of its officers.
The Company indemnifies its channel partners against certain claims alleging that the Company’s products (excluding custom products and/or custom support) infringe a patent, copyright, trade secret, or trademark, provided that a channel partner promptly notifies the Company in writing of the claim and such channel partner cooperates with the Company and grants the Company the authority to control the defense and any related settlement.
The Company has not recorded any liabilities for these agreements as of December 31, 2015 and 2014.
Reimbursement of Penalties— As of December 30, 2015 and 2014, the Company held $5.0 million in escrow to secure an indemnification agreement. If triggered, the Company will indemnify a channel partner for reimbursement of penalties assessed under the IT Act. The IT Act specifies penalties for network service providers in the event of illegal or unauthorized use of computers, computer systems and data stored therein. In the event that Ruckus equipment is the cause of a network service provider breach, the Company is required to indemnify the channel partner, without limitation to the amount, for penalties reimbursed by the channel partner to the network service provider under the IT Act. In the second quarter of 2016, the escrow will expire, but the indemnification agreement will continue. To date no claims have been made under the IT Act, for which the Company would be potentially liable.
Warranties— The Company generally offers a limited lifetime hardware warranty on its indoor WLAN products and a limited warranty for all other hardware products for a period of up to one year. The Company estimates the costs that may be incurred under its warranties and records a liability for products sold as a charge to cost of revenue. Estimates of future warranty costs are largely based on historical experience of product failure rates and material usage incurred in correcting product failures. The Company periodically assesses the adequacy of its recorded warranty liability and adjusts the amounts as necessary.
72
The warranty liability is included as a component of accrued liabilities in the accompanying consolidated balance sheets. Changes in the warranty liability were as follows (in thousands):
Years Ended December 31, | |||||||||||
2015 | 2014 | 2013 | |||||||||
Balance at beginning of year | $ | 803 | $ | 1,038 | $ | 725 | |||||
Changes in existing warranty | 80 | (216 | ) | (41 | ) | ||||||
Warranty expense | 892 | 955 | 1,528 | ||||||||
Obligations fulfilled | (691 | ) | (974 | ) | (1,174 | ) | |||||
Balance at end of year | $ | 1,084 | $ | 803 | $ | 1,038 | |||||
73
NOTE 9—EQUITY AWARD PLAN
Stock Incentive Plan—The Company's 2012 Stock Incentive Plan ("2012 Plan") provides for the granting of stock options, restricted stock awards ("RSUs"), stock appreciation rights and performance awards to employees, directors and consultants. Awards granted under the 2012 Plan vest over the periods determined by the board of directors, generally one to four years, beginning from the vesting commencement date, and expire no more than 10 years from the date of grant.
The maximum number of shares of common stock that may be issued under the Company’s 2012 Plan is 32.0 million. Each year on January 1, starting in January 2013, the maximum number of shares that may be issued increases by the lesser of, 5% of the total number of shares of the Company's capital stock outstanding on December 31 of the preceding year, or a lesser number of shares as determined by the board of directors. As of December 31, 2015 and 2014, 29.8 million and 29.3 million shares were authorized for issuance under this plan, respectively.
Employee Stock Purchase Plan—Under the Company's ESPP, the Company can grant stock purchase rights to all eligible employees during a one year offering period with purchase dates at the end of each six-month purchase period. Each six month purchase period will begin on the first trading date on or after May 16 and November 16 of each year. Shares are purchased through the accumulation of employees' payroll deductions, up to a maximum of 15% of employees' compensation for each purchase period, at purchase prices equal to 85% of the lesser of the closing price of the Company’s common stock on the first trading day of the applicable offering period or the purchase date. No participant may purchase more than $25,000 worth of common stock or 2,000 shares of common stock in any one year offering period. The ESPP is compensatory and results in compensation expense.
The number of shares of common stock reserved for issuance under the ESPP increases automatically each year on January 1, starting in January 2013, continuing through and including January 1, 2022, by the lesser of (i) 2% of the total number of shares of the common stock outstanding on December 31 of the preceding calendar year; (ii) 3,000,000 shares of common stock; or (iii) such lesser number of shares as determined by the board of directors. Shares subject to purchase rights granted under the ESPP that terminate without having been exercised in full will not reduce the number of shares available. As of December 31, 2015 and 2014, approximately 5.0 million and 3.8 million shares were authorized for issuance under the ESPP. Employees purchased approximately 0.5 million shares of common stock at an average exercise price of $9.34 and 0.5 million shares of common stock at an average exercise price of $8.91, during the years ended December 31, 2015 and 2014, respectively.
74
Stock Option Activity
The following table summarizes the outstanding stock option activity (in thousands, except per share amounts and years):
Options Outstanding | |||||||||||
Number of Shares | Weighted Average Exercise Price Per Share | Weighted Average Remaining Contractual Life (Years) | Aggregate Intrinsic Value | ||||||||
Balance, December 31, 2014 | 17,042 | $ | 5.60 | 6.7 | $ | 119,782 | |||||
Options granted | 340 | 11.17 | |||||||||
Options exercised | (2,888) | 2.73 | |||||||||
Options forfeited | (747) | 10.50 | |||||||||
Balance, December 31, 2015 | 13,747 | $ | 6.08 | 5.7 | $ | 76,742 | |||||
Options exercisable as of December 31, 2015 | 11,467 | $ | 4.87 | 5.2 | $ | 74,238 | |||||
Options vested and expected to vest as of December 31, 2015 | 13,679 | $ | 6.04 | 5.7 | $ | 76,715 | |||||
The weighted average fair value of stock options granted was $5.73, $7.42 and $10.33 for the years ended December 31, 2015, 2014 and 2013, respectively.
The total intrinsic value of options exercised was approximately $25.3 million, $39.0 million and $74.1 million for the years ended December 31, 2015, 2014 and 2013, respectively.
RSU Activity
The following table summarizes the outstanding activity of RSUs (in thousands, except per share amounts and years):
RSUs Outstanding | ||||||||||||
Number of Shares | Weighted Average Grant Date Fair Value Per Share | Weighted Average Remaining Vesting Period (Years) | Aggregate Intrinsic Value | |||||||||
Balance, December 31, 2014 | 2,825 | $ | 13.65 | 1.7 | $ | 33,955 | ||||||
RSUs granted | 2,749 | 11.41 | ||||||||||
RSUs vested | (874 | ) | 13.94 | |||||||||
RSUs forfeited | (423 | ) | 13.37 | |||||||||
Balance, December 31, 2015 | 4,277 | $ | 12.17 | 1.7 | $ | 45,794 | ||||||
The weighted average fair value of RSUs granted was $11.41, $12.70 and $17.10 for the years ended December 31, 2015, 2014 and 2013, respectively.
The aggregate fair value of RSUs vested as of the respective vesting dates, was approximately $12.2 million and $4.2 million for the year ended December 31, 2015 and December 31, 2014, respectively. No RSUs vested during the year ended December 31, 2013.
75
Shares Available for Grant
The following table summarizes the stock activity and the total number of shares available for grant under the 2012 Plan as of December 31, 2015 (in thousands):
Number of Shares | ||
Balance, December 31, 2014 | 9,398 | |
Additional shares reserved for issuance | 4,256 | |
Options granted | (340 | ) |
Options forfeited | 747 | |
RSUs granted | (2,749 | ) |
RSUs forfeited | 423 | |
Balance, December 31, 2015 | 11,735 | |
Fair Value Disclosures
The stock-based payment awards include stock options, RSUs, performance awards and stock purchase rights under the Company's ESPP.
Stock-based compensation is measured at the grant date based on the fair value of the award and is recognized as expense, net of estimated forfeitures, on a straight-line basis over the requisite service period, which is generally the vesting period of the award.
The fair value of each stock option granted is estimated using the Black-Scholes option pricing model. The fair value of each RSU and performance award granted represents the closing price of the Company’s common stock on the date of grant. The fair value of stock purchase rights under the Company’s ESPP is calculated based on the closing price of the Company’s stock on the date of grant and the value of put and call options estimated using the Black-Scholes option pricing model. The forfeiture rate is based on an analysis of the Company’s actual historical forfeitures.
The determination of the grant date fair value of options using the Black-Scholes option pricing model is affected by the following assumptions:
• | Expected Term. The Company's expected term represents the period that its stock-based awards are expected to be outstanding and was calculated as the average of the option vesting and contractual terms, based on the simplified method provided by the Securities and Exchange Commission’s Staff Accounting Bulletin No. 110. The simplified method is used due to the lack of a sufficient amount of historical exercise data. The expected term for the ESPP is based on the duration of the purchase period, typically six to twelve months. |
• | Volatility. Given the limited trading history for the Company's common stock, the expected stock price volatility for the Company's common stock was estimated by taking a combination of its historical common stock price volatility and an average historic price volatility for industry peers based on daily price observations over a period equivalent to the expected term of the stock option grants. Industry peers consist of several public companies within the Company's industry and are similar in size, stage of life cycle and financial leverage. The Company did not rely on implied volatilities of traded options in its common stock or these industry peers’ common stock because the volume of activity was relatively low. The Company intends to continue to consistently apply this process until a sufficient amount of historical information regarding the volatility of its own common stock share price over a period equivalent to the expected term of the stock option grants becomes available, or until circumstances change such that the identified companies are no longer similar to the Company, in which case more suitable companies whose share prices are publicly available would be utilized in the calculation. |
• | Risk-free Rate. The risk-free interest rate is based on the U.S. Treasury zero coupon issues with remaining terms similar to the expected term of the stock option grants. |
• | Dividend Yield. The Company has never declared or paid any cash dividends and do not presently plan to pay cash dividends in the foreseeable future. Consequently, the Company used an expected dividend yield of zero. |
76
Employee Stock Options
The following table summarizes the weighted average assumptions relating to the Company’s stock options:
Years Ended December 31, | ||||||||
2015 | 2014 | 2013 | ||||||
Volatility | 54.9 | % | 60.7 | % | 67.4 | % | ||
Expected term (years) | 5.7 | 6.1 | 6.1 | |||||
Risk-free interest rate | 1.8 | % | 1.9 | % | 1.9 | % | ||
Dividend yield | — | — | — | |||||
Employee Stock Purchase Plan
The following table summarizes the weighted average assumptions relating to the Company’s ESPP:
Years Ended December 31, | |||||
2015 | 2014 | ||||
Volatility | 45.3 | % | 40.2 | % | |
Expected term (years) | 0.7 | 0.7 | |||
Risk-free interest rate | 0.4 | % | 0.1 | % | |
Dividend yield | — | — | |||
Stock-based Compensation Expense
The following table summarizes the stock-based compensation expense recorded in the consolidated statements of operations (in thousands):
Years Ended December 31, | |||||||||||
2015 | 2014 | 2013 | |||||||||
Cost of revenue | $ | 1,097 | $ | 1,092 | $ | 818 | |||||
Research and development | 9,759 | 9,099 | 6,738 | ||||||||
Sales and marketing | 7,252 | 7,180 | 4,922 | ||||||||
General and administrative | 10,685 | 9,223 | 6,637 | ||||||||
Total stock-based compensation expense | 28,793 | 26,594 | 19,115 | ||||||||
Tax benefit from stock-based compensation | (618 | ) | (688 | ) | (1,535 | ) | |||||
Total stock-based compensation expense, net of tax effect | $ | 28,175 | $ | 25,906 | $ | 17,580 | |||||
At December 31, 2015 the total unrecognized stock-based compensation expense under the Company’s stock plans was $60.9 million, net of estimated forfeitures. The unamortized expense will be recognized over a weighted-average period of 2.7 years.
77
NOTE 10—EARNINGS PER SHARE
Basic net income per share is computed by dividing net income by the weighted-average number of common shares outstanding during the period. Diluted net income per share is computed by dividing net income by the weighted-average number of common shares outstanding, including potential dilutive common shares assuming the dilutive effect of outstanding stock awards using the treasury stock method. Under the treasury stock method, the amount the employee must pay for exercising stock awards, the amount of compensation cost for future service that the Company has not yet recognized, and the amount of tax benefits that would be recorded in additional paid-in capital when the award becomes deductible, are collectively assumed to be used to repurchase shares.
The following table presents the calculation of basic and diluted net income per share (in thousands, except per share data):
Years Ended December 31, | |||||||||||
2015 | 2014 | 2013 | |||||||||
Numerator: | |||||||||||
Net income | $ | 4,690 | $ | 8,190 | $ | 1,789 | |||||
Denominator: | |||||||||||
Weighted-average shares used in computing basic net income per share | 87,418 | 82,908 | 76,744 | ||||||||
Weighted-average effect of potentially dilutive shares: | |||||||||||
Stock options | 7,944 | 10,538 | 16,442 | ||||||||
RSUs and ESPP | 489 | 222 | 175 | ||||||||
Diluted | 95,851 | 93,668 | 93,361 | ||||||||
Net income per share: | |||||||||||
Basic | $ | 0.05 | $ | 0.10 | $ | 0.02 | |||||
Diluted | $ | 0.05 | $ | 0.09 | $ | 0.02 | |||||
The following table summarizes the weighted average outstanding stock awards that were excluded from the diluted per share calculation because to include them would have been anti-dilutive for the period (in thousands):
Years Ended December 31, | ||||||||
2015 | 2014 | 2013 | ||||||
Stock options | 3,505 | 2,649 | 1,134 | |||||
RSUs and ESPP | 993 | 977 | 233 | |||||
Total | 4,498 | 3,626 | 1,367 | |||||
NOTE 11—INCOME TAXES
The domestic and foreign components of income (loss) before the provision for income taxes for the years ended December 31, 2015, 2014 and 2013 were as follows (in thousands):
Years Ended December 31, | |||||||||||
2015 | 2014 | 2013 | |||||||||
Domestic | $ | 5,900 | $ | 13,107 | $ | (1,015 | ) | ||||
Foreign | 1,701 | 1,023 | 905 | ||||||||
Total | $ | 7,601 | $ | 14,130 | $ | (110 | ) | ||||
78
During the years ended December 31, 2015, 2014 and 2013, the Company’s income tax expense (benefit) was as follows (in thousands):
Years Ended December 31, | |||||||||||
2015 | 2014 | 2013 | |||||||||
Current expense: | |||||||||||
Federal | $ | 6,994 | $ | 8,224 | $ | 1,880 | |||||
State | 58 | 999 | 143 | ||||||||
Foreign | 1,341 | 1,257 | 1,006 | ||||||||
Total current expense | 8,393 | 10,480 | 3,029 | ||||||||
Deferred benefit: | |||||||||||
Federal | (4,527 | ) | (2,936 | ) | (3,445 | ) | |||||
State | (734 | ) | (1,259 | ) | (1,172 | ) | |||||
Foreign | (221 | ) | (345 | ) | (311 | ) | |||||
Total deferred benefit | (5,482 | ) | (4,540 | ) | (4,928 | ) | |||||
Total income tax expense (benefit) | $ | 2,911 | $ | 5,940 | $ | (1,899 | ) | ||||
The difference between the income tax expense (benefit) and the amount computed by applying the statutory federal income tax rate to the income (loss) before income taxes is as follows (in thousands):
Years Ended December 31, | |||||||||||
2015 | 2014 | 2013 | |||||||||
Federal statutory rate | $ | 2,660 | $ | 4,945 | $ | (38 | ) | ||||
State taxes, net of federal income tax benefit | 378 | 602 | 86 | ||||||||
Non-deductible expenses | 363 | 246 | 209 | ||||||||
Stock-based compensation | 1,498 | 2,209 | 1,535 | ||||||||
Acquisition cost | 104 | — | 110 | ||||||||
Foreign tax deduction | (142 | ) | (153 | ) | (101 | ) | |||||
Tax credits | (2,246 | ) | (2,502 | ) | (4,020 | ) | |||||
Foreign tax rate differential | 407 | 393 | 324 | ||||||||
Deferred rent | (219 | ) | — | — | |||||||
Other items not individually material | 108 | 200 | (4 | ) | |||||||
Total income tax expense (benefit) | $ | 2,911 | $ | 5,940 | $ | (1,899 | ) | ||||
On December 18, 2015, the President signed into law the Protecting Americans from Tax Hikes (“PATH”) Act, which retroactively extended the expired research and development credit and made it permanent going forward. As a result of the retroactive extension, the Company recognized a tax benefit of $1.2 million for the year ended December 31, 2015.
The Company records deferred tax assets if the realization of such assets is more likely than not. Significant management judgment is required in determining whether a valuation allowance against the Company’s deferred tax assets is required. The Company has considered all available evidence, both positive and negative, such as historical levels of income and predictability of future forecasts of taxable income, in determining whether a valuation allowance is required. The Company is also required to forecast future taxable income in accordance with accounting standards that address income taxes to assess the appropriateness of a valuation allowance, which further requires the exercise of significant management judgment.
79
As of December 31, 2015, the Company had cumulative net income before tax for the three years then ended. Based on its historical operating performance, as well as the Company’s expectation that its operations will generate sufficient taxable income in future periods to realize the tax benefits associated with the deferred tax assets, the Company has concluded that it was more likely than not that the Company would be able to realize the benefit of the U.S. federal and state deferred tax assets in the future. As a result, the Company did not record a valuation allowance against its net deferred tax assets during the year ended December 31, 2015.
The Company will continue to assess the need for a valuation allowance on the deferred tax assets by evaluating both positive and negative evidence that may exist on a quarterly basis. Any adjustment to the deferred tax asset valuation allowance would be recorded in the statement of operations for the period that the adjustment is determined to be required.
Significant components of the Company’s deferred tax assets and liabilities are as follows (in thousands):
As of December 31, | |||||||
2015 | 2014 | ||||||
Deferred tax assets: | |||||||
Accruals and reserves | $ | 4,056 | $ | 2,645 | |||
Tax credits | 5,455 | 4,416 | |||||
Fixed assets and intangibles, other than goodwill | 851 | 3,913 | |||||
Net operating losses | 1,246 | 1,426 | |||||
Stock-based compensation | 13,850 | 11,023 | |||||
Deferred revenue | 3,606 | 2,560 | |||||
Other | 2,392 | 2,177 | |||||
Total deferred tax assets | 31,456 | 28,160 | |||||
Deferred tax liabilities | |||||||
Intangible assets | (595 | ) | (850 | ) | |||
Goodwill | (755 | ) | (535 | ) | |||
Net deferred tax assets | $ | 30,106 | $ | 26,775 | |||
As reported: | |||||||
Current deferred tax asset | $ | — | $ | 6,205 | |||
Non-current deferred tax assets | 30,217 | 21,166 | |||||
Non-current deferred tax liabilities | (111 | ) | (596 | ) | |||
Net deferred tax assets | $ | 30,106 | $ | 26,775 | |||
In November 2015, the Financial Accounting Standard Board ("FASB") issued accounting standards update (“ASU”) 2015-17, Balance Sheet Classification of Deferred Taxes, which simplifies the presentation of deferred income taxes. This ASU requires that deferred tax assets and liabilities be classified as non-current in a statement of financial position. The Company early adopted ASU 2015-17 effective December 31, 2015 on a prospective basis. Adoption of this ASU resulted in a reclassification of $6.3 million net current deferred tax asset to the net non-current deferred tax asset in the consolidated balance sheet as of December 31, 2015. No prior periods were retrospectively adjusted.
As of December 31, 2015, the Company had net operating loss carryforwards of approximately $30.7 million for federal purposes, $52.2 million for state purposes and $3.2 million for foreign purposes. If not utilized, these carryforwards will begin to expire in 2033 for federal purposes and 2019 for state purposes. Foreign carryforwards will not expire. In addition, the Company has research credit carryforwards of approximately $5.5 million for federal purposes and $10.5 million for California purposes. If not utilized, the federal carryforward will begin to expire in 2024. The California credit carryforward will not expire.
80
As a result of certain realization requirements of the accounting guidance for stock-based compensation, the table of deferred tax assets and liabilities shown above does not include certain deferred tax assets at December 31, 2015 and 2014 that arose directly from (or the use of which was postponed by) tax deductions related to equity compensation in excess of compensation recognized for financial reporting. Approximately $30.7 million of federal net operating losses, $34.2 million of state net operating losses, and $1.9 million of foreign net operating losses relate to stock compensation deductions in excess of book expense, the tax effect of which would be to credit additional paid-in capital if realized. The Company uses the accounting guidance on a with and without approach under ASC Topic 740 Income Taxes, for the purpose of determining when excess tax benefits have been realized. In addition, approximately $5.5 million of the federal research credits and $0.1 million of the California research credits, when realized, will result in a credit to additional paid-in capital. The Company has foreign tax credit carryforwards of approximately $0.5 million for federal purposes. If not utilized, the foreign tax credit carryforward will begin to expire in 2019.
The Tax Reform Act of 1986 limits the use of net operating loss and tax credit carryforwards in certain situations where stock ownership changes occur. In the event the Company has had a change in ownership, the future utilization of the Company’s net operating loss and tax credit carryforwards could be limited.
The undistributed earnings from the Company’s foreign subsidiaries are not subject to a United States tax provision because it is management’s intention to permanently reinvest such undistributed earnings outside of the United States. The Company evaluates its circumstances and reassesses this determination on a periodic basis. As of December 31, 2015, the determination of the unrecorded deferred tax liability related to these earnings was immaterial. If circumstances change and it becomes apparent that some or all of the undistributed earnings of the Company’s foreign subsidiaries will be remitted in the foreseeable future, the Company will be required to recognize a deferred tax liability on those amounts.
The Company maintains liabilities for uncertain tax positions. These liabilities involve considerable judgment and estimation and are continuously monitored by management based on the best information available, including changes in tax regulations, the outcome of relevant court cases and other information. As of December 31, 2015, 2014 and 2013, the Company’s total amount of unrecognized tax benefit was approximately $4.5 million, $3.3 million and $2.4 million, respectively. These amounts are primarily related to the Company’s research and development tax credits and tax accruals.
If the unrecognized tax benefit of $4.5 million as of December 31, 2015 were recognized, approximately $3.7 million would impact the effective tax rate. The Company does not expect its unrecognized tax benefits to change materially over the next twelve months.
A reconciliation of the beginning and ending balances of the total amounts of unrecognized tax benefits for the years ended December 31, 2015, 2014 and 2013 is as follows (in thousands):
As of December 31, | |||||||||||
2015 | 2014 | 2013 | |||||||||
Balance at beginning of year | $ | 3,252 | $ | 2,397 | $ | 836 | |||||
Additions related to current year tax positions | 1,270 | 858 | 1,394 | ||||||||
Additions related to prior year tax positions | — | — | 167 | ||||||||
Reductions related to prior year tax positions | — | (3 | ) | — | |||||||
Balance at end of year | $ | 4,522 | $ | 3,252 | $ | 2,397 | |||||
During the year ended December 31, 2015 and cumulatively, the Company recognized an immaterial amount of interest and penalties associated with unrecognized tax benefits.
The Company files income tax returns with the United States federal government, various states and certain foreign jurisdictions. The Company’s tax years ended December 31, 2003 through December 31, 2015 remain open to audit for federal and California purposes. These years are open due to net operating losses and tax credits unutilized from such years. The Company’s tax years ended December 31, 2009 through December 31, 2015 remain open to audits for its foreign subsidiaries.
NOTE 12—EMPLOYEE BENEFIT PLAN
The Company sponsors a defined contribution plan under Internal Revenue Service Code 401(k) (the “401(k) Plan”). Most United States employees are eligible to participate following the start of their employment, at the beginning of each calendar month. Employees may contribute up to the lesser of 100% of their current compensation to the 401(k) Plan or an amount up to a statutorily prescribed annual limit. The Company matched one-time employee contributions to the 401(k) Plan for the year ended December 31, 2015.
NOTE 13—WORKFORCE REORGANIZATION
In the third quarter of 2015, the Company initiated a workforce reorganization plan designed to increase the efficiency of engineering efforts by reallocating research and development projects and related resources geographically. As part of this plan, the Company reduced engineering personnel at certain research and development facilities and terminated an outsourced research and development service contract. To compensate for the loss of engineering resource, the Company continues to increase engineering personnel in conjunction with the reorganization plan at other research and development sites. The Company incurred workforce reorganization charges of $1.1 million during the year ended December 31, 2015, including $0.6 million of personnel reduction costs and $0.5 million related to contract termination. The Company expects to complete the workforce reorganization plan in the second quarter of 2016.
81
NOTE 14—SEGMENT INFORMATION
The Company operates as one reportable and operating segment, selling controllers and access points along with related software and services.
Operating segments are defined as components of an enterprise, about which separate financial information is available that is evaluated regularly by the chief operating decision maker, or decision making group, in deciding how to allocate resources and in assessing performance. The Company’s chief operating decision maker is its chief executive officer. The Company’s chief executive officer reviews financial information presented on a consolidated basis for purposes of allocating resources and evaluating financial performance. The Company has one business activity, and there are no segment manager who are held accountable for operations, operating results and plans for products or components below the consolidated unit level. Accordingly, the Company reports as a single operating segment. The Company's chief executive officer evaluates performance based primarily on revenue in the geographic locations, in which the Company operates. Revenue is attributed by geographic location based on the bill-to location of the Company’s customers.
The following presents total revenue by geographic region (in thousands):
Years Ended December 31, | |||||||||||
2015 | 2014 | 2013 | |||||||||
Americas: | |||||||||||
United States | $ | 180,067 | $ | 159,548 | $ | 118,333 | |||||
Other Americas | 14,953 | 9,670 | 12,604 | ||||||||
Total Americas | 195,020 | 169,218 | 130,937 | ||||||||
EMEA: | |||||||||||
United Kingdom | 29,891 | 24,715 | 28,129 | ||||||||
Other EMEA | 67,565 | 59,351 | 43,884 | ||||||||
Total EMEA | 97,456 | 84,066 | 72,013 | ||||||||
APAC: | |||||||||||
Total APAC | 80,900 | 73,635 | 60,117 | ||||||||
Total revenue | $ | 373,376 | $ | 326,919 | $ | 263,067 | |||||
As of December 31, 2015, the Company had property and equipment, net, of $14.0 million, $4.8 million and $0.5 million located in the Americas, APAC and EMEA, respectively.
82
ITEM 9. CHANGES IN AND DISAGREEMENTS WITH ACCOUNTANTS ON ACCOUNTING AND FINANCIAL DISCLOSURE
None.
ITEM 9A. CONTROLS AND PROCEDURES
Evaluation of Disclosure Controls and Procedures
Our management is responsible for establishing and maintaining adequate internal control over financial reporting. Management, with the participation of our Chief Executive Officer and our Chief Financial Officer, evaluated the effectiveness of our disclosure controls and procedures as of December 31, 2015. The term “disclosure controls and procedures,” as defined in Rules 13a-15(e) and 15d-15(e) under the Exchange Act, means controls and other procedures of a company that are designed to ensure that information required to be disclosed by a company in the reports that it files or submits under the Exchange Act is recorded, processed, summarized and reported, within the time periods specified in the SEC's rules and forms. Disclosure controls and procedures include, without limitation, controls and procedures designed to ensure that information required to be disclosed by a company in the reports that it files or submits under the Exchange Act is accumulated and communicated to the Company’s management, including its principal executive and principal financial officers, as appropriate to allow timely decisions regarding required disclosure. Management recognizes that any controls and procedures, no matter how well designed and operated, can provide only reasonable assurance of achieving their objectives, and management necessarily applies its judgment in evaluating the cost-benefit relationship of possible controls and procedures. Based on the evaluation of our disclosure controls and procedures as of December 31, 2015, our Chief Executive Officer and Chief Financial Officer concluded that, as of such date, our disclosure controls and procedures were effective at the reasonable assurance level.
Management's Report on Internal Control over Financial Reporting
The management of Ruckus Wireless, Inc. is responsible for establishing and maintaining adequate internal control over financial reporting, as such term is defined in Rule 13a-15(f) of the Exchange Act. Under the supervision and with the participation of our Chief Executive Officer and Chief Financial Officer, our management conducted an evaluation of the effectiveness of our internal control over financial reporting based upon the framework in “Internal Control - Integrated Framework (2013)” issued by the Committee of Sponsoring Organizations of the Treadway Commission. Based on that evaluation, management concluded that our internal control over financial reporting was effective as of December 31, 2015.
Our internal control over financial reporting as of December 31, 2015 has been audited by Deloitte & Touche LLP, an independent registered public accounting firm, as stated in their report which is included in Part II, Item 8 of this Annual Report on Form 10-K.
Changes in Internal Control over Financial Reporting
There were no changes in our internal control over financial reporting identified in connection with the evaluation required by Rule 13a-15(d) and 15d-15(d) of the Exchange Act that occurred during the year ended December 31, 2015 that have materially affected, or are reasonably likely to materially affect, our internal control over financial reporting.
ITEM 9B. OTHER INFORMATION
None.
83
ITEM 10. DIRECTORS, EXECUTIVE OFFICERS, AND CORPORATE GOVERNANCE
The information required by this item is incorporated by reference to our Proxy Statement for our 2016 Annual Meeting of Stockholders to be filed with the SEC within 120 days after the end of the fiscal year ended December 31, 2015.
Code of Conduct
We have adopted a Code of Business Conduct which applies to all of our directors, officers and employees. A copy of our Code of Business Conduct can be found on our website (www.ruckuswireless.com) under “Corporate Governance.” The contents of our website are not a part of this report.
In addition, we intend to promptly disclose the nature of any amendment to, or waiver from, our Code of Business Conduct that applies to our principal executive officer, principal financial officer, principal accounting officer or persons performing similar functions on our website in the future.
ITEM 11. EXECUTIVE COMPENSATION
The information required by this item is incorporated by reference to our Proxy Statement for our 2016 Annual Meeting of Stockholders to be filed with the SEC within 120 days after the end of the fiscal year ended December 31, 2015.
ITEM 12. SECURITY OWNERSHIP OF CERTAIN BENEFICIAL OWNERS AND MANAGEMENT AND RELATED STOCKHOLDER MATTERS
The information required by this item is incorporated by reference to our Proxy Statement for our 2016 Annual Meeting of Stockholders to be filed with the SEC within 120 days after the end of the fiscal year ended December 31, 2015.
ITEM 13. CERTAIN RELATIONSHIPS AND RELATED TRANSACTIONS, AND DIRECTOR INDEPENDENCE
The information required by this item is incorporated by reference to our Proxy Statement for our 2016 Annual Meeting of Stockholders to be filed with the SEC within 120 days after the end of the fiscal year ended December 31, 2015.
ITEM 14. PRINCIPAL ACCOUNTANT FEES AND SERVICES
The information required by this item is incorporated by reference to our Proxy Statement for our 2016 Annual Meeting of Stockholders to be filed with the SEC within 120 days after the end of the fiscal year ended December 31, 2015.
84
PART IV
ITEM 15. EXHIBITS AND FINANCIAL STATEMENT SCHEDULES
1. Consolidated Financial Statements:
Our Consolidated Financial Statements are listed in the “Index to Consolidated Financial Statements” Under Part II, Item 8 of this report.
2. Financial Statement Schedules:
All financial statement schedules have been omitted because they are not applicable or the required information is shown in the Consolidated Financial Statements or Notes thereto.
3. Exhibits:
The documents listed in the Exhibit Index of this report are incorporated by reference or are filed with this report, in each case as indicated therein (numbered in accordance with Item 601 of Regulation S-K).
85
SIGNATURES
Pursuant to the requirements of Section 13 or 15(d) of the Securities Act of 1933, the Registrant has duly caused this report to be signed on its behalf by the undersigned, thereunto duly authorized, in the City of Sunnyvale, State of California on the 23rd day of February 2016.
RUCKUS WIRELESS, INC. | ||
By: | /s/ Selina Y. Lo | |
Selina Y. Lo | ||
President and Chief Executive Officer | ||
86
Power of Attorney
KNOW ALL PERSONS BY THESE PRESENTS, that each person whose signature appears below constitutes and appoints Selina Y. Lo and Seamus Hennessy, and each of them, as his true and lawful attorneys-in-fact and agents, each with the full power of substitution, for him and in his name, place or stead, in any and all capacities, to sign any and all amendments to this Annual Report on Form 10-K, and to file the same, with exhibits thereto and other documents in connection therewith, with the Securities and Exchange Commission, granting unto said attorneys-in-fact and agents, and each of them, full power and authority to do and perform each and every act and thing requisite and necessary to be done in and about the premises, as fully to all intents and purposes as he might or could do in person, hereby ratifying and confirming all that said attorneys-in-fact and agents, or their, his or her substitute or substitutes, may lawfully do or cause to be done by virtue hereof.
Pursuant to the requirements of the Securities Act of 1933, this report has been signed by the following persons in the capacities and on the dates indicated:
Signatures | Title | Date | ||
/s/ Selina Y. Lo | President, Chief Executive Officer and Director (Principal Executive Officer) | February 23, 2016 | ||
Selina Y. Lo | ||||
s/ Seamus Hennessy | Chief Financial Officer (Principal Financial and Accounting Officer) | February 23, 2016 | ||
Seamus Hennessy | ||||
/s/ Georges Antoun | Director | February 23, 2016 | ||
Georges Antoun | ||||
/s/ Barton Burstein | Director | February 23, 2016 | ||
Barton Burstein | ||||
/s/ Gaurav Garg | Director | February 23, 2016 | ||
Gaurav Garg | ||||
/s/ Stewart Grierson | Director | February 23, 2016 | ||
Stewart Grierson | ||||
/s/ Mohan Gyani | Director | February 23, 2016 | ||
Mohan Gyani | ||||
/s/ Richard Lynch | Director | February 23, 2016 | ||
Richard Lynch | ||||
87
EXHIBIT INDEX
Incorporated By Reference | |||||
Exhibit Number | Description of Document | Form | File Number | Exhibit | Filing Date |
3.1 | Amended and Restated Certificate of Incorporation of the Company. | 8-K | 001-35734 | 3.1 | 11/20/2012 |
3.2 | Bylaws of the Registrant. | S-1 | 333-184309 | 3.2 | 10/5/2012 |
4.1 | Sixth Amended and Restated Investor Rights Agreement, dated February 3, 2012, between the Company and the investors named therein. | S-1 | 333-184309 | 4.8 | 10/5/2012 |
10.1+ | Ruckus Wireless, Inc. 2002 Stock Plan, as amended. | S-1 | 333-184309 | 10.1 | 10/5/2012 |
10.2+ | Form of Option Agreement and Option Grant Notice for Ruckus Wireless, Inc. 2002 Stock Plan. | S-1 | 333-184309 | 10.2 | 10/5/2012 |
10.3+ | Ruckus Wireless, Inc. Amended & Restated 2012 Equity Incentive Plan, as amended. | S-1 | 333-184309 | 10.3 | 10/5/2012 |
10.4+ | Form of Option Agreement and Option Grant Notice for Ruckus Wireless, Inc. Amended & Restated 2012 Equity Incentive Plan. | S-1 | 333-184309 | 10.4 | 10/5/2012 |
10.5+ | Form of Restricted Stock Unit Agreement and Grant Notice Agreement for Ruckus Wireless, Inc. Amended & Restated 2012 Equity Incentive Plan, as amended. | S-8 | 333-187054 | 4.5 | 3/5/2013 |
10.6+ | Ruckus Wireless, Inc. 2012 Employee Stock Purchase Plan. | S-1 | 333-184309 | 10.5 | 10/5/2012 |
10.7+ | Form of Indemnity Agreement entered into between the Company and each of its directors and its executive officers. | S-1 | 333-184309 | 10.6 | 10/5/2012 |
10.8 | Lease Agreement, dated March 16, 2012, between the Company and RP/Presidio Java Owner, L.L.C. | S-1 | 333-184309 | 10.13 | 10/5/2012 |
10.9 | Hardware Access Layer Technology License Agreement, dated August 23, 2004, between the Company and Atheros Communications, Inc. | S-1 | 333-184309 | 10.17 | 10/5/2012 |
10.10+ | Ruckus Wireless, Inc. Severance Benefit Plan. | 10-K | 001-35734 | 10.8 | 3/5/2013 |
10.11+* | Ruckus Wireless, Inc. 2015 Executive Bonus Program. | ||||
10.12+* | Ruckus Wireless, Inc. 2016 Executive Bonus Program. | ||||
10.13+ | Offer Letter to Daniel A. Rabinovitsj, dated August 20, 2014. | 8-K | 001-35734 | 10.1 | 9/23/2014 |
10.14+ | Offer Letter to Ian Whiting, dated April 2, 2015. | 10-Q | 001-35734 | 10.1 | 7/30/2015 |
21.1* | List of subsidiaries. | ||||
23.1* | Consent of Deloitte & Touche LLP, Independent Registered Public Accounting Firm. | ||||
24.1* | Power of Attorney (included in signature page). | ||||
31.1* | Certification of the Chief Executive Officer of the Company pursuant to rule 13a-14 under the Securities Exchange Act of 1934. | ||||
31.2* | Certification of the Chief Financial Officer of the Company pursuant to rule 13a-14 under the Securities Exchange Act of 1934. | ||||
32.1* (1) | Certification of the Chief Executive Officer and Chief Financial Officer of the Company pursuant to18 U.S.C. Section 1350 as Adopted Pursuant to Section 906 of the Sarbanes-Oxley Act of 2002. | ||||
88
101.INS* | XBRL Instance Document | ||||
101.SCH* | XBRL Taxonomy Extension Schema Document | ||||
101.CAL* | XBRL Taxonomy Extension Calculation Linkbase Document | ||||
101.DEF* | XBRL Taxonomy Extension Definition Linkbase Document | ||||
101.LAB* | XBRL Taxonomy Extension Labels Linkbase Document | ||||
101.PRE* | XBRL Taxonomy Extension Presentation Linkbase Document | ||||
+ | Indicates a management contract or compensatory plan. |
* | Filed herewith. |
(1) | In accordance with Item 601(b)(32)(ii) of Regulation S-K and SEC Release Nos. 33-8238 and 34-47986, Final Rule; Management's Reports on Internal Control over Financial Reporting and Certification of Disclosure in Exchange Act Periodic Reports, the Certification furnished in Exhibit 32.1 hereto is deemed to accompany this Form 10-K and will not be filed for purposes of Section 18 of the Exchange Act. Such certification will not be deemed incorporated by reference into any filing under the Securities Act or the Exchange Act, except to the extent that the registrant specifically incorporates it by reference. |
89