Attached files
| file | filename |
|---|---|
| 8-K - 8-K - BROADWIND, INC. | a13-6113_18k.htm |
| EX-99.1 - EX-99.1 - BROADWIND, INC. | a13-6113_1ex99d1.htm |
Exhibit 99.2
|
|
February 27, 2013 Investor Teleconference Q4 2012 Results © 2013 Broadwind Energy, Inc. All Rights Reserved. |

|
|
Industry Data Disclaimer and Forward-Looking Statements Broadwind obtained the industry and market data used throughout this presentation from our own research, internal surveys and studies conducted by third parties, independent industry associations or general publications and other publicly available information. Independent industry publications and surveys generally state that they have obtained information from sources believed to be reliable, but do not guarantee the accuracy and completeness of such information. Forecasts are particularly likely to be inaccurate, especially over long periods of time. We are not aware of any misstatements in the industry data we have presented herein, but estimates involve risks and uncertainties and are subject to change based on various factors beyond our control. This presentation includes various forward-looking statements related to future, not past, events. Statements in this release that are not historical are forward-looking statements. These statements are based on current expectations and we undertake no obligation to update these statements to reflect events or circumstances occurring after this presentation. Such statements are subject to various risks and uncertainties that could cause actual results to vary materially from those stated. Such risks and uncertainties include, but are not limited to: expectations regarding our business, end-markets, relationships with customers and management’s ability to diversify our customer base; the impact of competition and economic volatility on many of the industries in which we compete; our ability to realize revenue from customer orders and backlog; the impact of regulation on end-markets, including the wind energy industry in particular; the sufficiency of our liquidity and working capital; our restructuring plans and the associated cost savings; the ability to preserve and utilize our tax net operating loss carry-forwards; and other risks and uncertainties described in our filings with the Securities and Exchange Commission. This document contains non-GAAP financial information. We believes that certain non-GAAP financial measures may provide users of this financial information meaningful comparisons between current results and results in prior operating periods. We believe that these non-GAAP financial measures can provide additional meaningful reflection of underlying trends of the business because they provide a comparison of historical information that excludes certain infrequently occurring or non-operational items that impact the overall comparability. Non-GAAP financial measures should be viewed in addition to, and not as an alternative for, our reported results prepared in accordance with GAAP. Please see our earnings release dated as of February 27, 2013 for a reconciliation of certain non-GAAP measures presented in this document. 2 |
|
|
Q4 2012 Overview 3 Business Highlights Strong towers and services order intake of $69M Adjusted EBITDA of $.7M reversed Q4 2011 loss Adjusted EBITDA margin up 3.2 points from Q4 2011 SG&A declined 24% from Q4 2011 Line of credit paid down by $16.6M; balance < $1M at YE Continued EBITDA improvement trend into 2013 Market Highlights Wind Production Tax Credit (PTC) passed requiring construction start by 12/31/2013 Favorable ruling by International Trade Commission on the importation of Chinese and Vietnamese wind towers Closure or repurposing of 45% of industry tower capacity, which brings supply and demand into better balance Oil & Gas Demand for upstream components for oil production is strong, making up for weak demand in natural gas |

|
|
Orders and Backlog Q4 Orders ($ in millions) Order Backlog Won $27M in Tower orders after 12/31/12 – plants fully booked into Q3 2013 Industrial Weldments orders of $3.8M in Q4 Services won significant drivetrain assembly order from industrial customer Lead times shortened in gearing impacting Q4 order intake 65% of backlog is new wind 46% of total 2013 estimated revenue is currently booked Backlog Recast Excluding Tower Deliveries Beyond 6 Months Traditionally Reported Backlog 4 Q4 2012 2011 % Chg. Towers/Weldments Gearing Services Total Orders $ 49.2 $ 49.6 (1%) 7.0 14.0 (50%) 12.9 4.6 182% $ 69.1 $ 68.2 1.3% |
|
|
Business Transformation 5 Revenue Diversification |
|
|
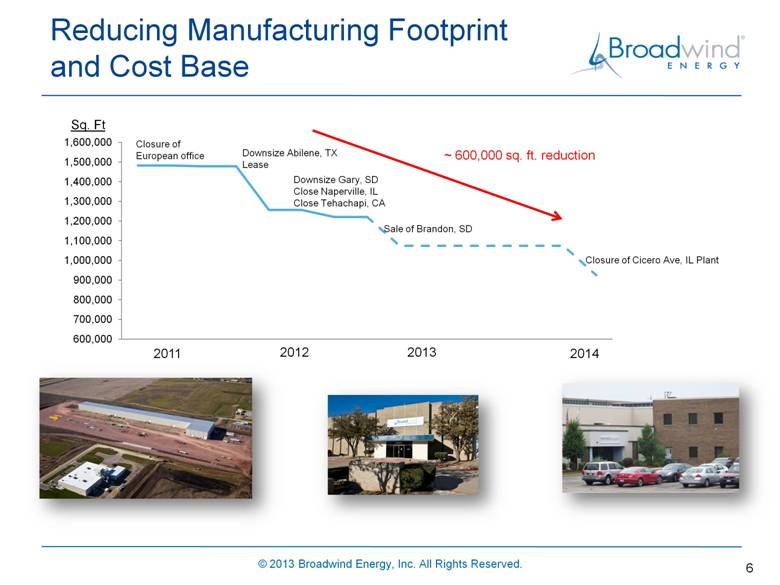
Reducing Manufacturing Footprint and Cost Base 6 Sq. Ft 2011 2012 2013 2014 Closure of European office Downsize Abilene, TX Lease Downsize Gary, SD Close Naperville, IL Close Tehachapi, CA Sale of Brandon, SD Closure of Cicero Ave, IL Plant ~ 600,000 sq. ft. reduction |
|
|
Wind Market Forecast 7 PTC passage is likely to have little impact on 2013 PTC passage requires projects to start construction by year-end 2013 ... benefits 2014 and beyond Treasury and IRS still need to clarify start of construction rules and project completion requirements Source: Make Consulting Preliminary Assessment of the PTC Extension’s Impact on the 2013-2016 Forecast |
|
|
Towers Supply / Demand Balance 8 Industry Capacity Reductions 30% 25% ~ 5 competitors have exited tower manufacturing Multi-purpose facilities are being repurposed to other industries (railcar and fabrication) China & Vietnam towers imports significantly reduced due to Department of Commerce tariffs 15% Total: 70% |
|
|
9 2013 Priorities Building Operating Leverage; Progressing Toward Profitability Continue customer and industry diversification Improve operational execution. . . translates to improved margins Complete restructuring initiative Execute on continuous improvement initiatives Leverage use of systems Enhance company-wide safety culture Enhance customer satisfaction Offer more product solutions Introduce additional proprietary service offerings Launch broad product management initiatives |

|
|
Consolidated Financial Results 10 Q4 2012 sales down 18% from Q4 2011, as expected due to PTC expiration impact on Towers Q4 2012 gross margin flat compared to Q4 2011 through improved Towers and Services execution Continued stringent operating expense management; down 3.5 ppt in 2012 from 2011 Q4 2012 operating loss includes $.8M restructuring expense Adj. EBITDA of $.7M, improved $1.6M from Q4 2011; 2012 Adj. EBITDA improved $7.6M from 2011 Zero effective tax rate — $154M tax loss carry forward at 12/31/2012 2012 2011 2012 2011 Revenue-$M 44.9 55.1 210.7 185.9 Gross Profit-$M 0.2 1.0 6.8 7.2 -% (ex. Restructuring) 1.8% 1.8% 4.0% 3.9% Operating Expense-$M 5.9 6.9 24.1 27.6 -% (ex. Restructuring) 12.6% 12.2% 11.1% 14.6% Operating Loss-$M (5.7) (5.9) (17.3) (20.4) Adj. EBITDA-$M 0.7 (1.0) 5.5 (2.1) EPS Continuing- $ (0.41) (0.41) (1.27) (1.79) Q4 Full Year |
|
|
Towers and Weldments Fourth Quarter 2012 11 Strategic Focus Tower volume decreased 17% from Q4 2011 — transitioned to 2013 projects Q4 2012 production more uniform in terms of tower types Adjusted EBITDA margin flat despite revenue decrease Industrial weldments revenue nearly tripled to $3.6 M from Q4 2011 Use continuous improvement tools to drive increased throughput and efficiency Drive safety metrics Capacity shift to higher-margin weldments Stringent cost management Towers and Industrial Weldments Revenue Mix 2012 2011 2012 2011 Towers 69 83 307 346 Revenue-$M 25.6 34.6 135.2 116.9 Op Income-$M (0.5) 0.0 2.8 5.2 Adj. EBITDA-$M 1.2 1.6 8.3 10.4 -% 4.5% 4.5% 6.1% 8.9% Q4 Full Year Q4 12 Q4 11 2012 2011 Full-content towers 79% 96% 91% 85% Fabrication-only towers 7% 0% 1% 12% Weldments 14% 4% 8% 3% |
|
|
Gearing Fourth Quarter 2012 Revenue entirely independent of new wind turbine sales Adj. EBITDA margin improved 4 ppt through shift in customer mix and lower operating expenses Adj. EBITDA margin sequentially lower due to lower production and cost absorption Plant consolidation spending > 40% complete — large machine moves underway 12 Improve capacity utilization — plant consolidation underway Diversify industrial customers Strategic shift from loose gearing to enclosed drives – growth in 2013 orders Streamline order to shipment process Strategic Focus 2012 2011 2012 2011 Revenue-$M 14.3 15.6 55.7 54.3 Op Income-$M (2.2) (2.2) (7.6) (10.7) Adj. EBITDA-$M 1.0 0.4 5.0 (0.5) -% 7.1% 2.8% 9.1% -0.9% Q4 Full Year |

|
|
Services Fourth Quarter 2012 Revenue up 11% — growth in drivetrain service center business, adding industrial customers Adj. EBITDA ~breakeven — reflects lower fixed overhead and improved expense management Q4 2012 operating loss also includes $119K restructuring expense 13 Continued focus on non-routine drivetrain and blade maintenance services Develop opportunities with industrial customers Develop proprietary product offerings Continue drive toward profitability Strategic Focus Services – EBITDA Evolution ($ thousands) 2012 2011 2012 2011 Revenue-$M 6.1 5.5 22.1 16.3 Op Income-$M (0.9) (1.4) (4.2) (5.2) Adj. EBITDA-$M (0.0) (1.1) (1.4) (4.0) -% -0.8% -19.3% -6.6% -24.7% Q4 Full Year |
|
|
Operating Working Capital 14 12/31/12 operating working capital reversed prior-quarter increase as customer payments for towers shipped were received and inventories reduced – recovered to 12% of revenue; down $18 million to $22 million at year end 2013 working capital should range from 12-15% of revenue, reflecting some growth in inventories, and lower customer deposits |
|
|
Debt and Liquidity – $ Thousands 15 Net debt reduced to $10M – benefitting from sharp working capital reduction Year-end debt balance lower than forecast – AloStar line < $1M at 12/31/12 Net debt balance includes $2.9M which is either forgivable economic development grants or new markets tax credit financing Line of credit sufficient to support 2013 growth 12/31/2012 9/30/2012 12/31/2011 Lines of credit, notes payable 955 17,585 1,566 Long-term debt 368 190 2,353 Brandon Mortgage 3,860 4,083 4,833 Capital leases 2,858 3,358 1,940 Subtotal: debt ex. grants 8,041 25,216 10,692 Grants/tax credits 2,940 2,940 3,080 Total Debt 10,981 28,156 13,772 Less: Cash and related assets (846) (3,051) (14,216) Net Debt 10,135 25,105 (444) |
|
|
2013 Financial Outlook 16 Towers: Greater revenue visibility given improved supply/demand balance Level-loading, fewer tower types increasing throughput, efficiencies and margins Gearing: Revenue and end-market demand comparable to 2012, with some uncertainty in gas Margin stable – restructuring benefits not material until late 2013/2014 Services: Continued growth from drivetrain services, increased demand from industrial customers Further EBITDA progress Q1 2013 outlook lowest due to rebuilding tower shipments following PTC expiration and renewal FY 2010 FY 2011 FY 2012 2013 E Q1 2012 Q1 2013 Revenue-$M 136.9 185.9 210.7 215-225 54.4 47-48 Gross Profit-$M 1.9 7.2 6.8 2.2 -% (ex. Restructuring) 1.4% 3.9% 4.0% 4.8% Operating Expense-$M 30.4 27.6 24.1 6.2 -% (ex. Restructuring) 22.2% 14.6% 11.1% 11.2% Impairment Exp. -$M 40.8 - - - Operating Income-$M (69.2) (20.4) (17.3) (3.9) Adj. EBITDA-$M (9.2) (2.1) 5.5 9-12 1.4 1 |
|
|
Other Updates Mediated Settlement of Securities Litigation $3.9 million to be paid by insurer NOL Shareholders Rights Plan Adopted by BOD, will be voted on at annual shareholders meeting Protects $154 million NOL carry-forward assets Triggered upon beneficial ownership change; change in ownership to >4.9% as defined by Internal Revenue Code Section 382 17 |
|
|
18 Broadwind Energy is committed to helping customers maximize performance of their energy and infrastructure investments — quicker, easier and smarter. |