Attached files
| file | filename |
|---|---|
| 8-K - FORM 8-K - MARRIOTT VACATIONS WORLDWIDE Corp | d492913d8k.htm |
 Marriott
Vacations Worldwide Corporation
February 25, 2013
Exhibit 99.1 |
 Forward-Looking Statements
This presentation contains “forward-looking statements”
within the meaning of federal securities
laws,
including
statements
about
earnings
trends,
estimates,
and
assumptions,
and
similar
statements
concerning
anticipated
future
events
and
expectations
that
are
not
historical
facts.
We caution you that these statements are not guarantees of future performance and are
subject to
numerous
risks
and
uncertainties,
including
volatility
in
the
economy
and
the
credit
markets,
supply
and
demand
changes
for
vacation
ownership
and
residential
products,
competitive
conditions, the availability of capital to finance growth, and other matters referred to
under the heading “Risk Factors”
contained in our most recent annual report on Form 10-K filed with the
U.S Securities and Exchange Commission (the “SEC”) and in subsequent SEC filings,
any of which
could
cause
actual
results
to
differ
materially
from
those
expressed
in
or
implied
in
this
presentation.
These
statements
are
made
as
of
February
25,
2013
and
we
undertake
no
obligation to publicly update or revise any forward-looking statement, whether as a
result of new information, future events, or otherwise.
Throughout this presentation we report certain financial measures, each identified with a
double asterisk (“**”), that are not prescribed or authorized by United
States generally accepted accounting principles (“GAAP”). We discuss our
reasons for reporting these non-GAAP measures and reconcile each to the most
directly comparable GAAP measure at the end of this
presentation.
1 |
 Introduction
2
Stephen P. Weisz
President and
Chief Executive Officer
John E. Geller, Jr.
Executive Vice President and
Chief Financial Officer
Jeff Hansen
Vice President, Investor Relations |
 3
Who we are:
–
Marriott Vacations Worldwide Corporation (“VAC”) is an
industry leader in the upscale and luxury vacation
ownership segments
–
More than 420,000 owners
–
Over 60 global vacation and resort destinations
What we do:
–
Sell vacation ownership products
–
Rent vacation ownership inventory
–
Finance consumer purchases of vacation ownership
products
–
Manage resorts and provide services for owners and
members
–
Revenues are derived from diverse sources and nearly
half is recurring and stable
Who
We
Are
and
What
We
Do
Mission Statement:
Deliver Unforgettable Experiences
That Make Vacation Dreams Come True! |
 Strategic Initiatives
4
Improve Development Margin:
•
Marketing and Sales
•
Cost of Vacation Ownership Products
Rationalize Organizational Structure and Costs
Growth:
•
New Timeshare Properties / Sales Distributions
•
New Timeshare Business Opportunities
Sell Excess Land and Luxury Inventory |
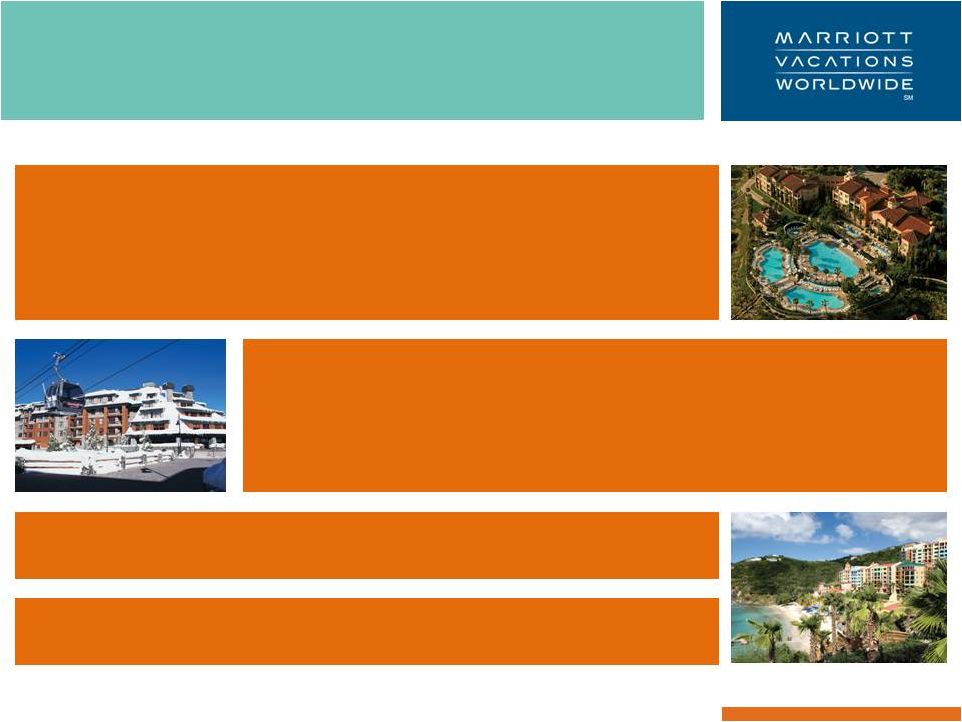
 Segment
Strategies Asia Pacific
$68
Europe
$63
NORTH AMERICA
Improve development margins
Leverage
fixed
marketing
and
sales
costs
through
increased
sales
efficiency
Lower cost of vacation ownership products sold
Improve rental margins
Continue
to
enhance
Marriott
Vacation
Club
Destinations™
offerings.
Add new resort inventory with new sales distributions and vacation experiences
ASIA PACIFIC
Add new resort locations with on-site sales distribution
Improve development margins
Continue to enhance Asia points product offerings
5 |
 Segment
Strategies Asia Pacific
$68
Europe
$63
EUROPE
Sell remaining developed inventory over next 2 years
Enhanced value proposition through access to the North America points program
LUXURY
Sell excess Luxury inventory through the North America points program over the next 2
to 3 years
Reduce Luxury unsold maintenance fees
Enhance offerings to existing Luxury fractional owners
6 |
 Diversified Revenue Sources
2012 Revenues**
7
** 2012 revenues excludes cost reimbursements of $362 million. See non-GAAP financial
measures. $1,286 Million**
Rental
17%
Financing
12%
Resort
Management and
Other Services
20%
Sale of
Vacation
Ownership
Products
49%
Other
2% |
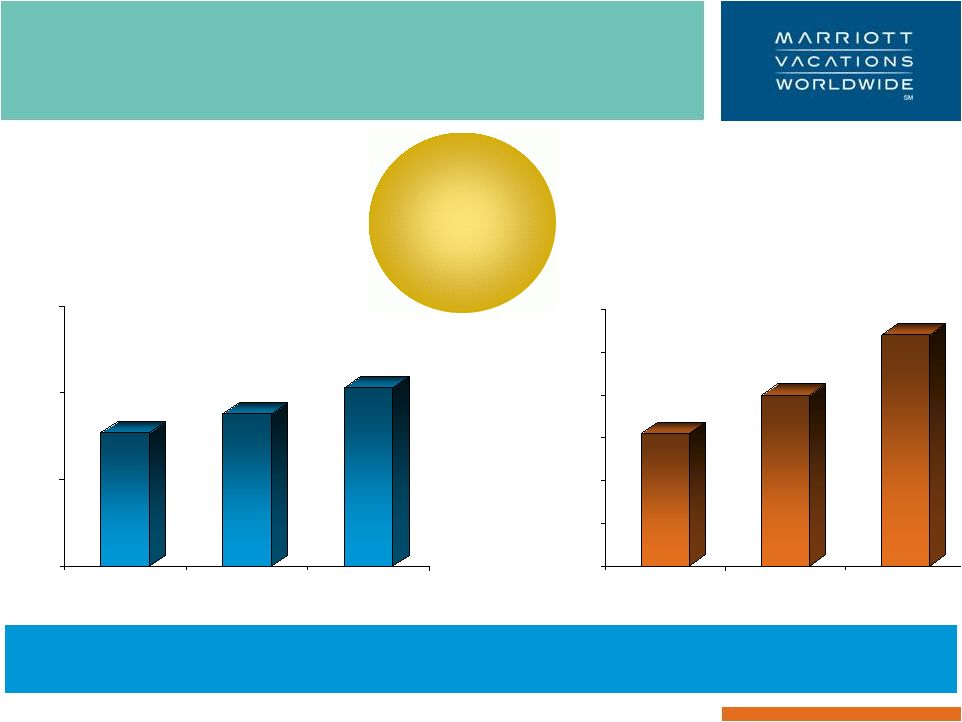
 Gross
Contract Sales Performance 8
($ in millions)
Total gross contract sales for 2013 are
projected to be flat to 5% higher than 2012
North America gross contract sales are
projected to increase 5% to 10% from 2012
North America 2013 Contract Sales projected to increase by $29 million to
$58 million from 2012, driven by volume per guest increases.
$676
$514
$578
$688
$688 -
$722
$607 -
$636
$300
$450
$600
$750
2011
2012
2013 |
 9
Adjusted development margin
1, **
1
Development margin represents sale of vacation ownership products revenues, net of expenses
(sale of vacation ownership products revenues less the cost of vacation ownership
products expenses and marketing and sales expenses) divided by sale of vacation ownership products revenues.
**
See Non-GAAP Financial Measures for adjustments to Development margin.
1% pt margin
improvement =
~$7M in
Adj. EBITDA
Improving Development Margins
54.7%
51.3%
49%
52.6%
47.7%
37.9%
32.6%
33.5%
to
34.5%
39.1%
32.7%
7.4%
16.1%
16.5%
to
17.5%
8.3%
19.6%
0%
20%
40%
60%
80%
100%
2011
2012
2013
North America
2011
North America
2012
Adjusted marketing and sales expenses**
Adjusted cost of vacation ownership products expenses**
Adjusted Development margin ** |
 Resort Management and Other
Services revenues net of expenses
10
$227
$238
$253
$150
$200
$250
$300
2010
2011
2012
($ in millions)
Increasing
management
fees and club
dues; improving
margins
$31
$40
$54
$0
$10
$20
$30
$40
$50
$60
2010
2011
2012
($ in millions)
Management fees increase from $60 million in 2010 to $67 million
in 2012.
Club dues increase from $7
million in 2010 to $22 million in 2012.
Resort Management and Other
Services revenues
Resort Management and Other
Services revenues net of expenses |
 11
Rental revenues net of expenses
($12)
($8)
($4)
$0
$4
$8
$12
$16
$20
2010
2011
2012
$(7)
$17
$12
$(8)
All segments
North America segment
($ in millions)
Maintenance fees from unsold inventory totaled $68 million in
2010, $65 million in 2011 and $60 million in 2012.
$0
$15
Improving
rental margins
$100
$150
$200
$250
2010
2011
2012
($ in millions)
$187
$152
$195
$212
$225
$180
Rental revenues
Rental revenues net of expenses |
 Financing revenues net of financing
expenses and consumer financing
interest expense
12
Financing revenue
$169
$188
$99
$91
($ in millions)
$151
$84
Profits should
stabilize as of
2012
Consumer financing interest expense decreases from $63 million on a
pro forma basis in 2010 down to $41 million in 2012.
$40
$80
$120
$160
$200
2010
2011
2012
Financing
revenue,
net
of
financing
expenses
and
consumer
financing
interest
expense**
-
see
Non-GAAP
Financial
Measures. |
 13
2013 Guidance
$ 688
16.1%
$ 50
$ 138
2012
$ 688
16.5%
$ 66
$ 150
2013 Outlook (ranges)
$ 722
17.5%
$ 74
$ 165
Gross Contract Sales
Adjusted Development
Margin**
Adjusted Net Income**
Adjusted EBITDA, as
adjusted
**
($ in millions)
** See Non-GAAP Financial Measures.
$ 676
7.4%
$ 20
$ 96
2011 |
 Normalized Adjusted Free Cash Flow **
-
2013
14
** See Non-GAAP Financial Measures.
($ in millions)
2013 Outlook
2013
Low
High
Mid-Point
Adjustments
Normalized **
Adjusted net income
**
66
$
74
$
70
$
70
$
Adjustments to reconcile Adjusted net income to net cash
provided by operating
activities:
Adjustments for non-cash items ¹
84
86
85
85
Deferred income taxes
(10)
(14)
(12)
12
$
2
-
Net change in assets and liabilities:
Notes receivable originations
(275)
(285)
(280)
(280)
Notes receivable collections
275
280
278
278
Inventory
-
10
5
5
Liability for Marriott Rewards customer loyalty program
(40)
(45)
(43)
43
3
-
Organizational and separation related and litigation charges
(33)
(30)
(32)
32
4
-
Other working capital changes
(30)
(23)
(27)
10
5
(17)
Net cash provided by operating
activities
37
53
45
96
141
Capital expenditures for property and equipment:
Organizational and separation related capital expenditures
(7)
(10)
(9)
9
4
-
Other
(25)
(18)
(22)
(22)
Increase in restricted cash
(4)
(2)
(3)
(3)
Free cash flow
**
1
23
12
105
117
Borrowings from securitization
transactions
307
298
303
303
Repayment of debt related to
securitizations
(318)
(311)
(315)
(315)
Subtotal
(11)
(13)
(12)
-
(12)
Adjusted free cash flow
**
(10)
$
10
$
-
$
105
$
105
$
1
Includes depreciation, amortization of debt issuance costs, provision for loan losses,
gain/loss on disposals, and share-based compensation. 2
Represents higher cash taxes resulting from the tax benefits remaining with Marriott
International as part of the Spin-off. 3
Represents payment for Marriott Rewards Points issued prior to the Spin-off.
Liability to be fully paid in 2016. 4
Represents costs associated with MVW's organizational and separation related efforts (efforts
projected to be completed in 2014) as well as litigation cash settlements to be paid in
2013. 5
Represents elimination of one-time cash outflows. |
 Inventory Calculation -
Example
15
Example assumes revenue from the sale of vacation ownership products grows annually
at 5%.
With
those
growth
levels,
MVW
would
target
inventory
of
$514M
on
hand
at
the
end
of
2016 which represents 2 years of inventory on hand (considered stabilized level).
As such, with inventory of $604M on hand at the beginning of 2013, MVW’s inventory
would need to be reduced by $90M by the end of 2016.
($ in millions)
2013
2014
2015
2016
Sale of vacation ownership products revenue
663
$
696
$
731
$
768
$
Cost of vacation ownership products
220
$
233
$
245
$
257
$
Product cost percentage
33%
33%
33%
33%
Inventory on-hand:
-
Assume stablized inventory on-hand of 2 years
Inventory Requirement:
514
$
2013 -
2016
Balance at beginning of 2013
1
604
$
Spending less than product cost
(90)
Balance desired at end of 2016
514
$
1
Includes finished goods of $484M and work-in-progress of $120M at the beginning of
2013 (excludes land and infrastructure) |
 Strategic Initiatives
16
Improve Development Margin:
Rationalize Organizational Structure and Costs
Growth:
•
New Timeshare Properties / Sales Distributions
•
New Timeshare Business Opportunities
Sell Excess Land and Luxury Inventory
•
Marketing and Sales
•
Cost of Vacation Ownership Products |
 17
Appendix |
 Normalized Adjusted Free Cash Flow **
-
2012
** See Non-GAAP Financial Measures.
18
($ in millions)
2012
2012
Actual
Adjustments
Normalized **
Adjusted net income
**
50
$
50
$
Adjustments to reconcile Adjusted net income to net cash
provided by operating
activities:
Adjustments for non-cash items ¹
77
77
Deferred income taxes
(50)
50
$
4
-
Net change in assets and liabilities:
Notes receivable originations
(262)
(262)
Notes receivable collections
311
311
Inventory
68
(68)
5
-
Liability for Marriott Rewards customer loyalty program
(64)
64
6
-
Organizational and separation related and litigation charges
(57)
57
7
-
Other working capital changes
90
(105)
8
(15)
Net cash provided by operating
activities
163
(2)
161
Capital expenditures for property and equipment:
Organizational and separation related capital expenditures
(2)
2
7
-
Other
(15)
(15)
Increase in restricted cash
12
12
Free cash flow
**
158
-
158
Borrowings from securitization
transactions
238
238
Repayment of debt related to
securitizations
(411)
(411)
Subtotal
(173)
-
(173)
Adjusted free cash flow
**
(15)
-
(15)
Borrowings available from the securitization of sellable vacation
109
109
ownership notes receivable through the Warehouse Credit Facility
² Litigation settlement
³ 38
(38)
-
Adjusted free cash flow, as adjusted ** (excluding Litigation settlement)
132
$
(38)
$
94
$
1
Includes depreciation, amortization of debt issuance costs, provision for loan losses, excess
tax benefit on share-based compensation, share-based compensation, gain/loss on
disposals, equity method loss, and impairment reversals on equity investment. 2
Represents cash available to Marriott Vacations Worldwide to the extent the company securitized
sellable vacation ownership notes receivable through the Warehouse Credit Facility at year end.
3
Represents cash outflow not reflected in previous guidance.
4
Represents higher cash taxes resulting from the tax benefits remaining with Marriott
International as part of the Spin-off. 5
Represents adjustment to align real estate inventory spending with real estate inventory costs
(i.e., product costs). 6
Represents payment for Marriott Rewards Points issued prior to the Spin-off.
Liability to be fully paid in 2016. 7
Represents costs associated with MVW's organizational and separation related efforts (efforts
projected to be completed in 2014) as well as a litigation cash settlement paid in 2012.
8
Represents elimination of one-time cash inflows mainly associated with the Spin-off
(e.g., health and welfare plans, 401k plan, timing of other payments, etc.). |
 MARRIOTT VACATIONS WORLDWIDE CONFIDENTIAL AND PROPRIETARY INFORMATION
19
In this presentation we report certain financial measures that are not prescribed or
authorized by United States generally accepted accounting principles
(“GAAP”). We discuss management’s reasons for reporting these non-GAAP financial measures below, and reconcile
the most directly comparable GAAP financial measure to each non-GAAP financial measure
that we refer to (identified by a double asterisk ("**")
in
this
presentation).
Although
management
evaluates
and
presents
these
non-GAAP
financial
measures
for
the
reasons
described
below, please be aware that these non-GAAP financial measures have limitations and
should not be considered in isolation or as a substitute for revenues, net income,
earnings per share or any other comparable operating measure prescribed by GAAP. In addition, these
non-GAAP financial measures may be calculated and / or presented differently than
measures with the same or similar names that are reported
by
other
companies,
and
as
a
result,
the
non-GAAP
financial
measures
we
report
may
not
be
comparable
to
those
reported
by
others.
Adjusted
Net
Income
and
Adjusted
Pro
Forma
Net
Income.
Management
evaluates
non-GAAP
financial
measures
that
(1)
exclude
charges
incurred
in
the
16
weeks
and
52
weeks
ended
December
28,
2012
and
December
30,
2011,
including
non-cash
impairment
charges and other charges, (2) exclude the gain on the disposition of a Luxury segment golf
course and related assets in the 16 weeks and 52 weeks ended December 28, 2012, and
(3) include pro forma adjustments for the 16 weeks and 52 weeks ended December 30, 2011 to
reflect results as if the company were a stand alone public company in such period, because
those non-GAAP financial measures allow for period-over-period
comparisons of our on-going core operations before the impact of material charges and the gain on the disposition of
Luxury segment assets. These adjustments are itemized below and
on the following pages. These non-GAAP financial measures also
facilitate management’s comparison of results from our on-going operations before
material charges and the gain on the disposition of Luxury
segment
assets
with
results
from
other
vacation
ownership
companies.
Other
Charges
-
16
weeks
and
52
weeks
ended
December
28,
2012.
In
our
16
weeks
ended
December
28,
2012
Statements
of
Operations, we recorded $52 million of pre-tax charges comprised of $39 million for a
legal settlement related to a project in our Luxury segment
under
the
"Litigation
settlement"
caption,
$7
million
of
organizational
and
separation
related
costs
under
the
"Organizational
and
separation related" caption, $4 million related to closing off-site sales locations
in our Asia Pacific segment under the "Marketing and sales" caption,
$1
million
of
severance
in
our
Europe
segment
under
the
"Marketing
and
sales"
caption,
and
$1
million
of
costs
associated
with
removing the Ritz-Carlton brand from one of our properties in the Luxury segment under
the "Resort management and other services" caption. In our 52 weeks
ended December 28, 2012 Statements of Operations, we recorded $64 million of pre-tax charges comprised of
$41 million for a legal settlement related to a project in our Luxury segment under the
"Litigation settlement" caption, $16 million of organizational and separation
related costs under the "Organizational and separation related" caption, $4 million related to closing off-site
sales
locations
in
our
Asia
Pacific
segment
under
the
"Marketing
and
sales"
caption,
$1
million
of
severance
in
our
Luxury
segment
under
the
"Marketing
and
sales"
caption,
$1
million
of
severance
in
our
Europe
segment
under
the
"Marketing
and
sales"
caption,
and
$1
million
of
costs associated with removing the Ritz-Carlton brand from one of our properties in the
Luxury segment under the "Resort management and other services"
caption. Non-GAAP Financial Measures |
 MARRIOTT VACATIONS WORLDWIDE CONFIDENTIAL AND PROPRIETARY INFORMATION
20
Non-GAAP Financial Measures
Adjusted Net Income and Adjusted Pro Forma Net Income (continued)
Operations, we recorded $10 million of pre-tax charges comprised of $4 million of
spin-off related charges under the "General and administrative" caption,
$3 million of severance costs ($1 million under the "Marketing and sales" caption and $2 million under the
"General and administrative" caption), and $3 million of legal related charges under
the "Marketing and sales" caption. In our 52 weeks ended December 30,
2011 Statements of Operations, we recorded $18 million of pre-tax charges comprised of $5 million of severance
costs ($3 million under the "Marketing and sales" caption and $2 million under the
"General and administrative" caption), $4 million of spin-off related
charges under the "General and administrative" caption, $3 million of costs related to ADA compliance and Hurricane
Irene damage at a resort in the Bahamas under the "Cost of vacation ownership
products" caption, $3 million for a legal settlement related to a project in our
Luxury segment under the "Litigation settlement" caption, and $3 million of legal related charges under the
"Marketing and sales" caption.
2012 Statements of Operations, we did not record any non-cash impairment charges.
In our 52 weeks ended December 28, 2012 Statements of Operations, we reversed
$2 million related to our previously recorded impairment of an equity investment in a Luxury
segment vacation ownership joint venture project, because the actual costs incurred to
suspend the marketing and sales operations were lower than previously estimated,
under the "Impairment reversals on equity investment" caption. 2011 Statements of Operations, we did not record any non-cash impairment charges.
In preparation for the spin-off from Marriott International, management assessed
the intended use of excess undeveloped land and built inventory and the current market conditions
for those assets. During 2011, management approved a plan to accelerate cash flow through
the monetization of certain excess undeveloped land in the United States, Mexico, and
the Bahamas and to accelerate sales of excess built Luxury fractional and residential
inventory. As a result, in accordance with the guidance for accounting for the impairment or disposal of long-lived assets,
because the nominal cash flows from the planned land sales and the estimated fair values of
the land and excess built Luxury inventory were less than their respective carrying
values, we recorded a pre-tax non-cash impairment charge of $324 million in our 36 weeks
ended September 9, 2011 Statements of Operations under the “Impairment”
caption. Additionally, in our 36 weeks ended September 9, 2011 Statements of
Operations, under the "Impairment reversals on equity investment" caption, we reversed nearly $4 million of a more
than $16 million funding liability we originally recorded in 2009 related to a Luxury
segment vacation ownership joint venture project, based on facts and circumstances
surrounding the project, including favorable resolution of certain construction related claims and
contingent obligations to refund certain deposits relating to sales that have subsequently
closed. Other
Charges
-
16
weeks
and
52
weeks
ended
December
30,
2011.
In
our
16
weeks
ended
December
30,
2011
Statements
of
Non-cash
Impairment
Charges
-
16
weeks
and
52
weeks
ended
December
28,
2012.
In
our
16
weeks
ended
December
28,
Non-cash
Impairment
Charges
-
16
weeks
and
52
weeks
ended
December
30,
2011.
In
our
16
weeks
ended
December
30, |
 MARRIOTT VACATIONS WORLDWIDE CONFIDENTIAL AND PROPRIETARY INFORMATION
21
Non-GAAP Financial Measures
Adjusted Net Income and Adjusted Pro Forma Net Income (continued)
associated with the sale of the golf course, clubhouse and spa formally known as The
Ritz-Carlton Golf Club and Spa, Jupiter in our Luxury segment under the
"Gains and other income" caption. Statements of Operations, we included $18 million of pre-tax pro forma adjustments
comprised of $15 million of royalty fees, $2 million of interest expense and $1
million of dividends on mandatorily redeemable preferred stock of a consolidated subsidiary. In our 52 weeks
ended December 30, 2011 Statements of Operations, we included $71 million of pre-tax pro
forma adjustments comprised of $58 million of royalty fees, $9 million of interest
expense and $4 million of dividends on mandatorily redeemable preferred stock of a consolidated
subsidiary.
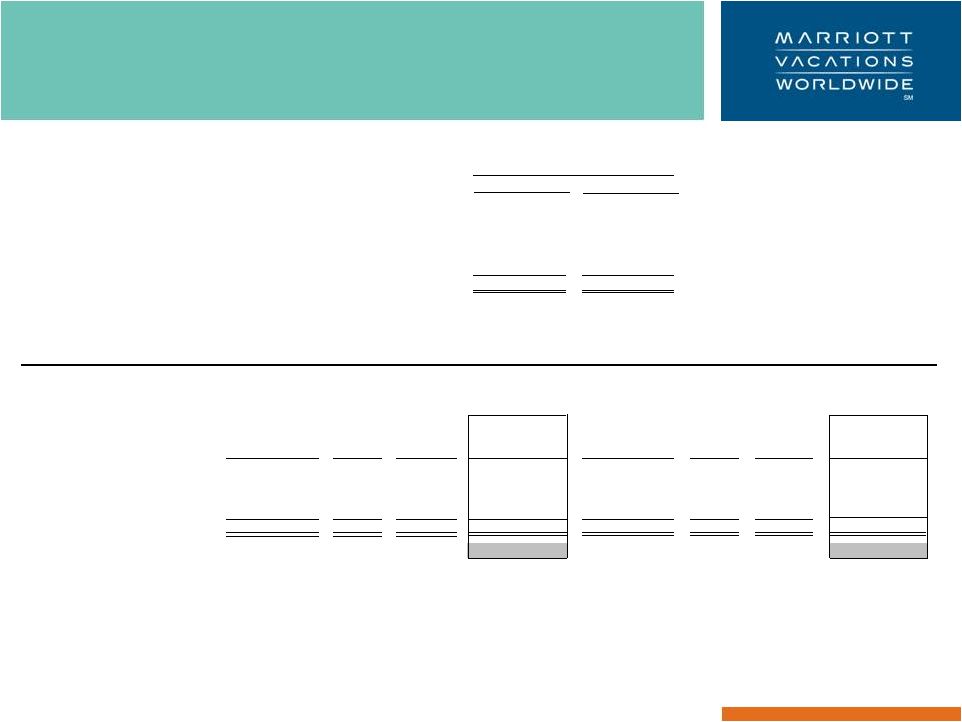
Adjusted Development Margin (Adjusted Sale of Vacation Ownership Products Net of Expenses)
as an indicator of operating performance. Our Adjusted Development Margin
adjusts Sale of vacation ownership products revenues for the impact of revenue
reportability, includes corresponding adjustments to both the Cost of vacation ownership
products expense and the Marketing and sales expense associated with the change in
revenues from the Sale of vacation ownership products, and includes adjustments for other
charges itemized in our Adjusted Net Income and Adjusted Pro Forma Net Income non-GAAP
financial measures explanation above. We evaluate Adjusted Development Margin
because it allows for period-over-period comparisons of our ongoing core operations before
the impact of revenue reportability and other charges on our Development margin.
or authorized by GAAP, reflects earnings excluding the impact of interest expense, provision
for income taxes, depreciation and amortization. We consider EBITDA to be an
indicator of operating performance, and we use it to measure our ability to service debt, fund
capital expenditures and expand our business. We also use EBITDA, as do analysts, lenders,
investors and others, because it excludes certain items that can vary widely across
different industries or among companies within the same industry. For example, interest
expense can be dependent on a company’s capital structure, debt levels and credit
ratings. Accordingly, the impact of interest expense on earnings can vary
significantly among companies. The tax positions of companies can also vary because of their differing abilities to
take advantage of tax benefits and because of the tax policies of the jurisdictions in which
they operate. As a result, effective tax rates and provision for income taxes can
vary considerably among companies. EBITDA also excludes depreciation and amortization because
companies utilize productive assets of different ages and use different methods of both
acquiring and depreciating productive assets. These differences can result in
considerable variability in the relative costs of productive assets and the depreciation and amortization
expense among companies.
Gain
on
the
disposition
of
a
Luxury
segment
golf
course
and
related
assets
-
16
weeks
and
52
weeks
ended
December
28,
2012.
In our 16 weeks and 52 weeks ended December 28, 2012 Statements of Operations, we recorded a
net $8 million gain Pro
Forma
Adjustments
-
16
weeks
and
52
weeks
ended
December
30,
2011.
In
our
16
weeks
ended
December
30,
2011
Adjusted
Development
Margin
(Adjusted
Sale
of
Vacation
Ownership
Products
Net
of
Expenses).
Management
also
evaluates
Earnings
Before
Interest,
Taxes,
Depreciation
and
Amortization
("EBITDA").
EBITDA,
a
financial
measure
which
is
not
prescribed |
 MARRIOTT VACATIONS WORLDWIDE CONFIDENTIAL AND PROPRIETARY INFORMATION
22
Adjusted
EBITDA.
We
also
evaluate
Adjusted
EBITDA,
another
non-GAAP
financial
measure,
as
an
indicator
of
performance.
Our
Adjusted
EBITDA excludes the impact of non-cash impairment charges or reversals and restructuring
charges and includes the impact of interest expense associated with the debt from the
Warehouse Credit Facility and from the securitization of our vacation ownership notes receivable in the term
ABS market, which together we refer to as consumer financing interest expense. We deduct
consumer financing interest expense in determining Adjusted EBITDA since the debt is
secured by vacation ownership notes receivable that have been sold to bankruptcy remote special purpose
entities and is generally non-recourse to us. We evaluate Adjusted EBITDA, which adjusts
for these items, to allow for period-over-period comparisons of our ongoing
core operations before material charges. Adjusted EBITDA is also useful in measuring our ability to service our non-
securitized debt. Together, EBITDA and Adjusted EBITDA facilitate our comparison of results
from our ongoing operations with results from other vacation ownership companies.
Adjusted
EBITDA
as
adjusted
and
Adjusted
Pro
Forma
EBITDA
as
adjusted.
Management
also
evaluates
Adjusted
EBITDA
as
adjusted
and Adjusted Pro Forma EBITDA as adjusted, which reflect adjustments for other charges
incurred in the 16 weeks and 52 weeks ended December 28, 2012 and December 30, 2011,
as well as the gain on the disposition of a Luxury segment golf course and related assets in the 16
weeks and 52 weeks ended December 28, 2012, and include pro forma adjustments for the 16
weeks and 52 weeks ended December 30, 2011, as itemized in our Adjusted Net Income
and Adjusted Pro Forma Net Income non-GAAP financial measures explanation. We evaluate Adjusted
EBITDA as adjusted and Adjusted Pro Forma EBITDA as adjusted as indicators of operating
performance because they allow for period-over- period comparisons of our
ongoing core operations before the impact of material charges and the gain on the disposition of Luxury segment
assets, and reflect results as if we were a stand alone public company in each period.
Non-GAAP Financial Measures |
 MARRIOTT VACATIONS WORLDWIDE CONFIDENTIAL AND PROPRIETARY INFORMATION
23
Non-GAAP Financial Measures
Free Cash Flow.
Adjusted Free Cash Flow.
Normalized Adjusted Free Cash Flow.
Management also evaluates Free Cash Flow as a liquidity measure that provides useful information to
management and investors about the amount of cash provided by operating activities after
capital expenditures for property and equipment and changes in restricted cash.
Management considers Free Cash Flow to be a liquidity measure that provides useful
information to management and investors about the amount of cash generated by the business
that can be used for strategic opportunities, including making acquisitions and
strengthening the balance sheet. Analysis of Free Cash Flow also facilitates
management's comparison of the Company's results to its competitors' results.
Management also evaluates Adjusted Free Cash Flow as a
liquidity measure that provides useful information to management and investors about
the amount of cash provided by operating activities after capital expenditures for
property and equipment, changes in restricted cash, and the borrowing and repayment activity
related to our securitizations. Management considers Adjusted Free Cash Flow to
be a liquidity measure that provides useful information to management and investors
about the amount of cash generated by the business that can be used for strategic opportunities, including making
acquisitions and strengthening the balance sheet. Analysis of Adjusted Free Cash Flow
also facilitates management's comparison of the Company's results to its competitors'
results.
Management also evaluates Normalized Adjusted Free Cash Flow as a liquidity measure
that provides useful information to management and investors about the amount of cash
provided by operating activities after capital expenditures for property and
equipment, changes in restricted cash, the borrowing and repayment activity related to our
securitizations, and adjustments to remove the impact of cash flow items not expected to
occur on a regular basis. Adjustments in 2012 and 2013 eliminate the impact of
excess cash taxes, payments of Marriott Rewards Points issued prior to the Spin-off,
payments for organizational and separation related efforts, litigation cash settlements and
other working capital changes. Adjustments in 2012 also eliminate the benefit of
lower real estate inventory spending. Management considers Normalized Adjusted Free
Cash Flow to be a liquidity measure that provides useful information to management and investors about the amount of cash
generated by the business that can be used for strategic opportunities, including making
acquisitions and strengthening the balance sheet. Analysis of Normalized
Adjusted Free Cash Flow also facilitates management's comparison of the Company's results to its
competitors' results. |
 Financing
Revenue,
Net
of
Financing
Expenses
and
Consumer
Financing
Interest
Expense.
Financing
revenue,
net
of
financing
expenses and consumer financing interest expense includes interest income earned on vacation
ownership notes receivable as well as fees earned
from
servicing
the
existing
loan
portfolio,
net
of
direct
costs
to
support
the
financing,
servicing
and
securitization
processes,
as
well
as
consumer financing interest expense. We believe it is a meaningful measure as it
highlights the overall profitability of our financing business. Total
Revenues
Excluding
Cost
Reimbursements.
Cost
reimbursements
revenue
includes
direct
and
indirect
costs
that
property
owners'
associations
and
joint
ventures
we
participate
in
reimburse
to
us,
and
relates,
predominantly,
to
payroll
costs
where
we
are
the
employer.
As
we
record
cost
reimbursements
based
upon
costs
incurred
with
no
added
markup,
this
revenue
and
related
expense
has
no
impact
on
net
income attributable to us because cost reimbursements revenue net of reimbursed costs
expense is zero. We consider total revenues excluding cost reimbursements to be
a meaningful metric as it represents that portion of revenue that impacts net income attributable to us.
24
Non-GAAP Financial Measures
($ in millions)
2010
2011
2012
Financing revenue
188
$
169
$
151
$
Less: financing expenses
(26)
(28)
(26)
Less: consumer financing interest expense ¹ (63)
(50)
(41)
Financing revenue, net of financing expenses
and consumer financing interest
expense** 99
$
91
$
84
$
**
Denotes non-GAAP financial measures.
1
Consumer financing interest expense includes pro forma adjustments of
$7 million and $3 million for 2010 and 2011,
respectively. ($ in millions)
2012
Total revenues
1,648
$
Less: cost reimbursements
(362)
Total revenues excluding cost reimbursements**
1,286
$
**
Denotes non-GAAP financial measures.
|
 Non-GAAP
Financial
Measures
–
Consolidated
Adjusted
Development
Margin
(Adjusted
Sale
of
Vacation
Ownership Products Net of Expenses)
25
52 Weeks Ended
($ in millions)
December 28, 2012
December 30, 2011
Gross company-owned contract sales
1
688
$
658
$
Revenue recognition adjustments:
Reportability
2
(6)
25
Sales
Reserve
3
(42)
(36)
Other
(13)
(13)
Sale of vacation ownership products
627
$
634
$
1
Gross company-owned contract sales excludes sales generated under a
marketing sales arrangement with a joint venture and cancellation reversals.
2
Adjustment
for
lack
of
required
downpayment,
contract
sales
in
rescission
period,
or
percentage
completion
accounting
on
company-owned
contract
sales.
3
Represents additional reserve for current year financed vacation
ownership product sales, which we also refer to as sales reserve.
4
Adjustment for sales incentives that will not be recognized as Sale of
vacation ownership products revenues. CONSOLIDATED ADJUSTED
DEVELOPMENT MARGIN (ADJUSTED SALE OF VACATION OWNERSHIP PRODUCTS NET OF EXPENSES)**
Revenue
Revenue
($ in millions)
As Reported
Recognition
As Adjusted
As Reported
Recognition
As Adjusted
52 Weeks Ended
Other
Reportability
52 Weeks Ended
52 Weeks Ended
Other
Reportability
52 Weeks Ended
December 28, 2012
Charges
Adjustment
December 28, 2012
**
December 30, 2011
Charges
Adjustment
December 30, 2011
**
Sale of vacation ownership products
627
$
-
$
6
$
633
$
634
$
-
$
(25)
$
609
$
Less:
Cost of vacation ownership products
205
-
2
207
242
(3)
(9)
230
Marketing and sales
330
(6)
-
324
342
(6)
(3)
333
Development margin
92
$
6
$
4
$
102
$
50
$
9
$
(13)
$
46
$
Development margin percentage
1
14.8%
16.1%
8.0%
7.4%
** Denotes non-GAAP financial measures.
Note: We have reclassified certain prior year amounts to conform
to our 2012 presentation.
1
Development margin percentage represents Development margin divided by
Sale of vacation ownership products. Development margin percentage is calculated using whole dollars.
CONSOLIDATED GROSS COMPANY-OWNED CONTRACT SALES TO SALE OF
VACATION OWNERSHIP PRODUCTS |
 26
Non-GAAP Financial Measures —
North America
Adjusted Development Margin (Adjusted Sale of Vacation
Ownership Products Net of Expenses)
($ in millions)
52 Weeks Ended
December 28, 2012
December 30, 2011
Gross company-owned contract sales
578
$
514
$
Revenue recognition adjustments:
Reportability ¹
(4)
20
Sales Reserve ²
(32)
(37)
Other ³
(13)
(13)
Sale of vacation ownership products
529
$
484
$
1
Adjustment for lack of required downpayment, contract sales in
rescission period, or percentage completion accounting on company-owned contract sales.
2
Represents additional reserve for current year financed vacation
ownership product sales, which we also refer to as sales reserve.
3
Adjustment for sales incentives that will not be recognized as Sale of
vacation ownership products revenues. NORTH AMERICA ADJUSTED
DEVELOPMENT MARGIN (ADJUSTED SALE OF VACATION OWNERSHIP PRODUCTS NET OF EXPENSES)
Revenue
Revenue
($ in millions)
As Reported
Recognition
As Adjusted
As Reported
Recognition
As Adjusted
52 Weeks Ended
Reportability
52 Weeks Ended
52 Weeks Ended
Other
Reportability
52 Weeks Ended
December 28, 2012
Adjustment
December 28, 2012
**
December 30, 2011
Charges
Adjustment
December 30, 2011
**
Sale of vacation ownership products
529
$
4
$
533
$
484
$
-
$
(20)
$
464
$
Less:
Cost of vacation ownership products
173
2
175
190
(1)
(8)
181
Marketing and sales
254
-
254
248
(2)
(2)
244
Development margin
102
$
2
$
104
$
46
$
3
$
(10)
$
39
$
Development
margin
percentage
1
19.3%
19.6%
9.5%
8.3%
** Denotes non-GAAP financial measures.
1
Development margin percentage represents Development margin divided by
Sale of vacation ownership products. Development margin percentage is calculated using whole dollars.
NORTH AMERICA GROSS COMPANY-OWNED CONTRACT SALES TO SALE OF
VACATION OWNERSHIP PRODUCTS |
 27
Non-GAAP Financial Measures –
2012
Adjusted Net Income and 2011 Adjusted Pro Forma Net
Income
As Adjusted
As Reported
As Adjusted
As Reported
Pro-Forma
($ in millions)
52 Weeks Ended
Other
52 Weeks Ended
52 Weeks Ended
Other
52 Weeks Ended
December 28, 2012
Charges
December 28, 2012
**
December 30, 2011
Charges
Pro-Forma
December 30, 2011
**
Revenues
Sale of vacation ownership
products
627
$
-
$
627
$
634
$
-
$
-
$
634
$
Resort management and other
services
253
-
253
238
-
-
238
Financing
151
-
151
169
-
-
169
Rental
225
-
225
212
-
-
212
Other
30
-
30
29
-
-
29
Cost
reimbursements
362
-
362
331
-
-
331
Total
revenues
1,648
-
1,648
1,613
-
-
1,613
Expenses
Cost of vacation ownership
products
205
-
205
242
(3)
-
239
Marketing and
sales
330
(6)
324
342
(6)
-
336
Resort management and other
services
199
(1)
198
198
-
-
198
Financing
26
-
26
28
-
-
28
Rental
225
-
225
220
-
-
220
Other
14
-
14
13
-
-
13
General and
administrative
86
-
86
81
(6)
-
75
Organizational and separation related
16
(16)
-
-
-
-
-
Litigation settlement
41
(41)
-
3
(3)
-
-
Interest
58
-
58
47
-
13
60
Royalty
fee
61
-
61
4
-
58
62
Impairment
-
-
-
324
(324)
-
-
Cost
reimbursements
362
-
362
331
-
-
331
Total
expenses
1,623
(64)
1,559
1,833
(342)
71
1,562
Gains and other
income
9
(8)
1
2
-
-
2
Equity in earnings
1
-
1
-
-
-
-
Impairment reversals on equity
investment
2
(2)
-
4
(4)
-
-
Income (loss) before income taxes
37
54
91
(214)
338
(71)
53
(Provision) benefit for income
taxes
(21)
(20)
(41)
36
(96)
27
(33)
Net income
(loss)
16
$
34
$
50
$
(178)
$
242
$
(44)
$
20
$
Total Contract Sales
Total Contract Sales
Gross Contract Sales
52 Weeks Ended
52 Weeks Ended
Cancellation
52 Weeks Ended
December 28, 2012
December 30, 2011
Reversal
December 30, 2011
Contract
sales
688
$
680
$
(4)
$
676
$
** Denotes non-GAAP financial measures.
|
 28
Non-GAAP
Financial
Measures
–
2012
and
2011
EBITDA, Adjusted EBITDA, and Adjusted Pro
Forma EBITDA as adjusted
As Adjusted
As Reported
As Adjusted
As Reported
Pro-Forma
($'s in millions)
52 Weeks Ended
Other
52 Weeks Ended
52 Weeks Ended
Other
52 Weeks Ended
December 28, 2012
Charges
December 28, 2012
**
December 30, 2011
Charges
Pro-Forma
December 30, 2011
**
Net
income
16
$
34
$
50
$
(178)
$
242
$
(44)
$
20
$
Interest
expense
58
-
58
47
-
13
60
Tax
provision
21
20
41
(36)
96
(27)
33
Depreciation and
amortization
30
-
30
33
-
-
33
EBITDA
**
125
54
179
(134)
338
(58)
146
Impairment charges:
Impairments
-
-
-
324
(324)
-
-
Impairment reversals on equity investment
(2)
2
-
(4)
4
-
-
Consumer financing interest
expense
(41)
-
(41)
(47)
-
(3)
(50)
Adjusted
EBITDA**
82
$
56
$
138
$
139
$
18
$
(61)
$
96
$
** Denotes non-GAAP financial measures.
|
 29
Non-GAAP Financial Measures –
2013 Outlook
(EBITDA and Adjusted EBITDA)
($ in millions)
Fiscal Year 2013
(low)
Fiscal Year 2013
(high)
Adjusted net
income
66
$
74
$
Interest
expense
43
45
Tax
provision
51
58
Depreciation and
amortization
23
23
EBITDA, as
adjusted**
183
$
200
$
Consumer financing interest
expense
(33)
(35)
Adjusted EBITDA, as
adjusted**
150
$
165
$
** Denotes non-GAAP financial measures.
2013 EBITDA and ADJUSTED EBITDA OUTLOOK |