Attached files
| file | filename |
|---|---|
| 8-K - 8-K - LegacyTexas Financial Group, Inc. | a8kcoverq42012investorconf.htm |

1 NASDAQ: VPFG 2012 Earnings Kevin Hanigan – President and Chief Executive Officer Patti McKee – Executive Vice President and Chief Financial Officer EXHIBIT 99.1
2 Safe Harbor Statement Certain matters discussed on this call may contain forward‐looking statements, which are subject to risks and uncertainties. A number of factors, many of which are beyond ViewPoint Financial Group, Inc.’s control, could cause actual results to differ materially from future results expressed or implied by such forward‐looking statements. These risks and uncertainties include the risk of adverse impacts from general economic conditions, competition, interest rate sensitivity and exposure to regulatory and legislative changes. These and other factors that could cause results to differ materially from those described in the forward‐looking statements can be found in our annual report on Form 10‐K for the year ended December 31, 2012, and in other filings made by ViewPoint Financial Group, Inc. with the Securities and Exchange Commission.

3 Corporate & Geographic Overview Total Assets: $3.66 billion1 Total Net Loans: $2.73 billion1 Total Deposits: $2.18 billion1 31 Community Bank Locations 60 years in Texas market #1 in deposit market share in the affluent Collin County market of those banks based in Texas 2 Ranked #4 in deposit market share among Texas-based community banks in DFW Metroplex2 Source: VPFG 10-K for 2012, Company documents 1 As of December 31, 2012 2 FDIC market share data as of June 2012

4 Attractive Demographics: Strengthening Dallas Franchise Source: SNL Financial and the FDIC ViewPoint Bank has a wealthy depositor base and compares favorably to Texas peers. Rank Institution Branches June 30, 2012 Deposits In Market ($mm) June 30, 2012 Market share (%) 1 ViewPoint Bank, National Association 12 1,243 8.5 2 LegacyTexas Bank 9 1,049 7.1 3 Independent Bank 10 467 3.2 4 The American National Bank of Texas 4 324 2.2 5 Comerica Bank 8 274 1.9 6 North Dallas Bank and Trust Co. 2 268 1.8 7 Benchmark Bank 1 219 1.5 8 Texas Capital Bank, National Association 1 212 1.4 1 Includes only banks and thrifts headquartered in Texas Deposit Market share: Collin County 1 ViewPoint Bank is ranked #1 in deposit market share in Collin County of banks based in Texas. Company (ranked by 2011 HH) Ticker City Median household income of depositor base - 2011* Median household income of depositor base - projected 2016* ViewPoint Financial Group Inc VPFG Plano $69,671 $75,783 MetroCorp Bancshares Inc. MCBI Houston $56,602 $64,629 Comerica Inc. CMA Dallas $55,245 $63,747 OmniAmerican Bancorp Inc. OABC Fort Worth $55,027 $62,087 Texas Capital Bancshares Inc. TCBI Dallas $51,840 $59,051 Cullen/Frost Bankers Inc. CFR San Antonio $49,981 $57,822 Prosperity Bancshares Inc. PB Houston $46,719 $54,295 First Financial Bankshares FFIN Abilene $41,671 $49,143 Southside Bancshares Inc. SBSI Tyler $41,555 $51,269 Guaranty Bancshares Inc. GNTY Mount Pleasant $37,502 $43,911 International Bancshares Corp. IBOC Laredo $35,7 0 $42,159 Texas Banks Ranked by Projected Income of Depositor Base

5 Capitalize on a position of balance sheet strength Improve and diversify earning asset mix Migrate from low yielding securities to higher yielding loans Transition to a balanced loan book, leveraging C&I expertise Grow organically, leveraging a strong local economy Achieve greater community banking market share through high-touch service and strategic redeployment of key products Deploy capital opportunistically Continued organic loan growth and selective branching Consistent growth of dividends and opportunistic share repurchase Disciplined M&A Business Strategy

6 Capitalize on a Position of Balance Sheet Strength Source: SNL Financial – Morgan Stanley – Peers are KRX index of 50 regional banks as of most recent reported quarter.

7 Improved Earning Asset Mix Source: Company Documents Loans held for investment, 38% Loans held for sale, 24% Securities and Overnight Funds, 38% Average Earning Assets and Related Yields December 31, 2011 December 31, 2012 Quarterly yield on earning assets: 4.06% Quarterly yield on earning assets: 4.37% Loans held for investment, 49% Loans held for sale, 27% Securities and Overnight Funds, 24%

8 The Highlands acquisition accelerated ViewPoint’s transition to a commercial banking model Commercial banking CEO Team of commercial lenders Shift loan portfolio away from real estate centric lending Emphasis on C&I lending with a goal to transition to balanced loan book Continued emphasis on low-cost, core deposits Commercial Bank Transformation
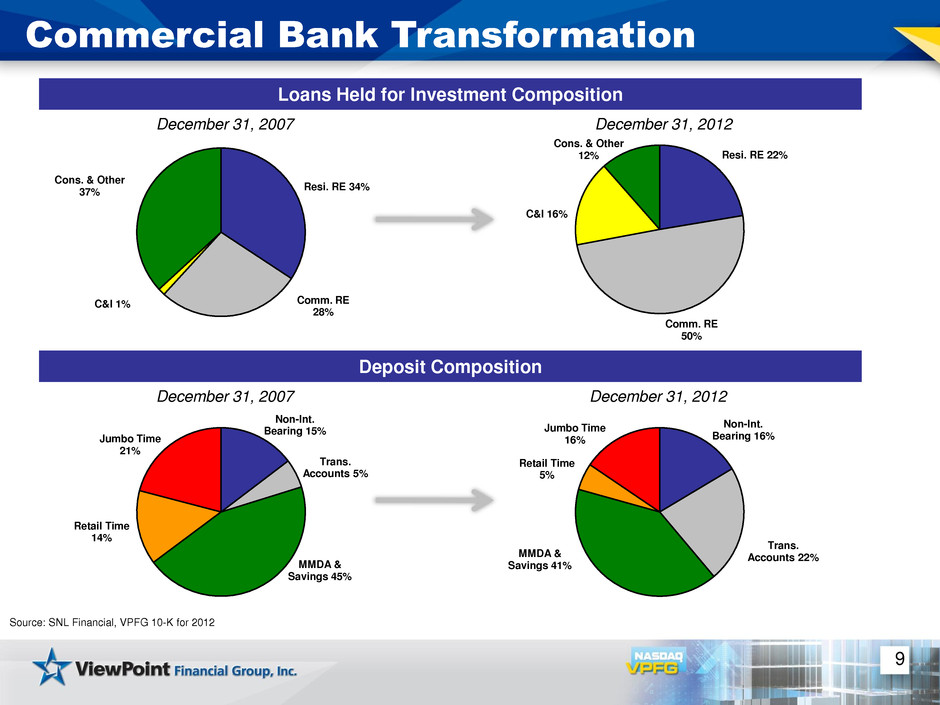
9 Commercial Bank Transformation Loans Held for Investment Composition Source: SNL Financial, VPFG 10-K for 2012 Resi. RE 22% Comm. RE 50% C&I 16% Cons. & Other 12% December 31, 2007 Resi. RE 34% Comm. RE 28% C&I 1% Cons. & Other 37% Deposit Composition Non-Int. Bearing 16% Trans. Accounts 22% MMDA & Savings 41% Retail Time 5% Jumbo Time 16% Non-Int. Bearing 15% Trans. Accounts 5% MMDA & Savings 45% Retail Time 14% Jumbo Time 21% December 31, 2012 December 31, 2012 December 31, 2007

10 Financial Highlights Net income totaled $35.2 million, up 34% over prior year Annual core EPS totaled $1.04, up 51% vs. prior year Q4 core EPS of $0.27 versus $0.26 same Q last year Strong Earnings Continued Loan Growth Total loans increased $689.1 million annually, or 33.4% Organic growth of $466.2 million, or 23%, fueled by strong C&I and CRE growth ($112.0 million and $181.8 million, respectively) LHI linked quarter growth of $39.1 million, or 2.4% LHS linked quarter growth of $46.3 million, or 4.6% Increase in Net Interest Margin YTD NIM of 3.61%, up 70 bps over 2.91% for same time last year QTD NIM of 3.77%, up 7 bps vs. Q3 2012 and up 64 bps vs. Q4 2011 Driven by reduced deposit cost and improvement in earning asset mix Strong Capitalization & Stable Credit Quality Annual dividend of $0.30 per share, prepaid Q1 2013 dividend of $0.10 Tangible common equity of $490 million, or 13.48% of tangible assets Asset quality – NPLs/Loans of 1.61% See Appendix for reconciliation of core (non-GAAP) to GAAP net income. Source: VPFG 2012 10-K, Company Documents

2008 2009 2010 2011 2012 Q4 2011 Q4 2012 Core Earnings per Share $0.20 $0.35 $0.60 $0.69 $1.04 $0.26 $0.27 $0.10 $0.20 $0.30 $0.40 $0.50 $0.60 $0.70 $0.80 $0.90 $1.00 $1.10 11 Core Earnings Per Share Growth CAGR: 51% See Appendix for reconciliation of core (non-GAAP) to GAAP net income Source: VPFG 2012 10-K, Company Documents Share and per share information for periods prior to July 6, 2010, have been revised to reflect the 1.4:1 conversion ratio on publicly traded shares Core Net Income ($ in millions): $5.7 $9.7 $17.9 $22.2 $37.3 $8.1 $10.1 Annual Quarterly
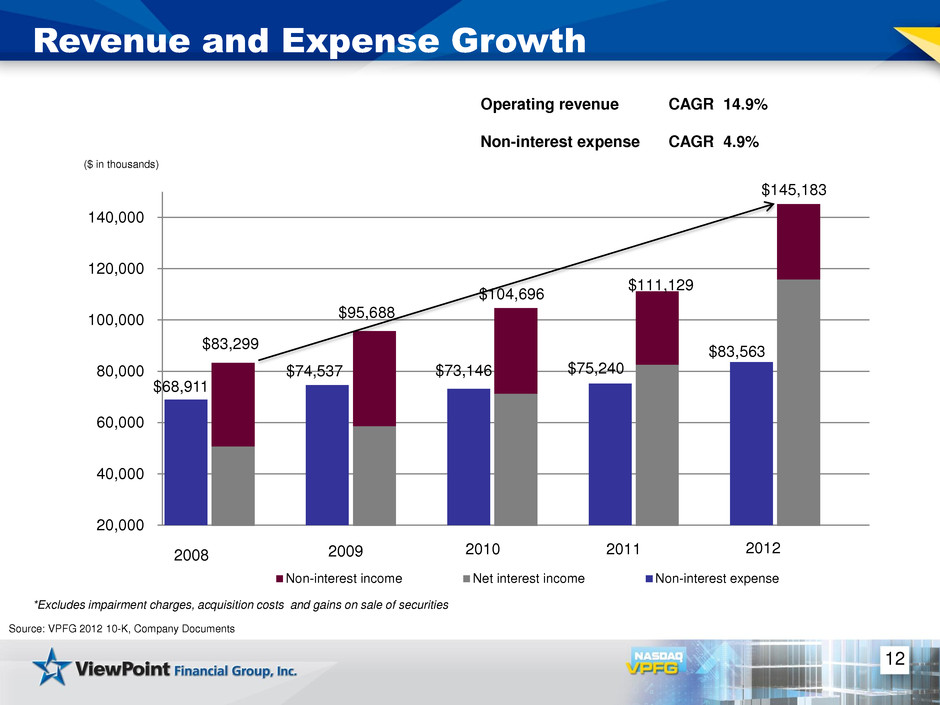
$68,911 $74,537 $73,146 $75,240 20,000 40,000 60,000 80,000 100,000 120,000 140,000 Non-interest income Net interest income Non-interest expense 2009 2010 2011 2012 $83,299 $95,688 $104,696 $111,129 $83,563 $145,183 12 Revenue and Expense Growth ($ in thousands) *Excludes impairment charges, acquisition costs and gains on sale of securities Operating revenue CAGR 14.9% Non-interest expense CAGR 4.9% 2008 Source: VPFG 2012 10-K, Company Documents
13 Q4 Financial Review Source: VPFG 2012 10-K, Company Documents Operating expense increase in Q4 due to continuation of growth strategy Growth Added high level revenue producers in lending and treasury management Retain Increased performance-based compensation Awarded restricted stock and options Improve and build franchise Marketing branding awareness Technology

14 Profitability Net Interest Margin Source: VPFG 2012 10-K, Company Documents 1 Calculated by dividing total non-interest expense by net interest income plus non-interest income, excluding gain (loss) on foreclosed assets, impairment of goodwill, gains from securities transactions and other non-recurring items. 2 See Appendix for reconciliation of core (non-GAAP) to GAAP net income Efficiency Ratio 1 Core ROAA2 Core ROAE2 2.85% 2.72% 2.80% 2.91% 3.61% 3.77% 2.50% 2.75% 3.00% 3.25% 3.50% 3.75% 4.00% 2008 2009 2010 2011 2012 Q4 2012 82.8% 78.4% 69.6% 67.8% 61.3% 57.3% 30.0% 45.0% 60.0% 75.0% 90.0% 2008 2009 2010 2011 2012 Q4 2012 0.30% 0.42% 0.66% 0.75% 1.10% 1.15% 0.00% 0.25% 0.50% 0.75% 1.00% 1.25% 1.50% 2008 2009 2010 2011 2012 Q4 2012 2.8% 4.9% 5.7% 5.5% 7.7% 7.8% 0.0% 2.0% 4.0% 6.0% 8.0% 2008 2009 2010 2011 2012 Q4 2012

15 Strong Loan Growth C&I Lending Growth (1) ($ in millions) Source: VPFG 2012 10-K; Company Documents (1) The 2Q’12 balance includes $117 million in purchased C&I loans related to the Highlands acquisition (2) The 2Q’12 balance includes $83 million in purchased CRE loans related to the Highlands acquisition $51.2 $180.7 $226.4 $245.8 $19.1 $17.0 $25.9 $32.7 0 50 100 150 200 250 300 1Q'12 2Q'12 3Q'12 4Q'12 C&I WHLOC $197.7 $252.3 $70.3 $278.5 $624.1 $760.6 $794.6 $839.9 500 550 600 650 700 750 800 850 1Q'12 2Q'12 3Q'12 4Q'12 CRE Lending Growth (2) ($ in millions) C&I and CRE increased a combined 7% linked quarter

0 5 10 15 20 25 30 35 40 45 50 $0 $100,000 $200,000 $300,000 $400,000 $500,000 $600,000 $700,000 $800,000 $900,000 $1,000,000 4Q'09 2Q'10 4Q'10 2Q'11 4Q'11 2Q'12 4Q'12 # C u s to m e rs Bal an ce Warehouse Purchase Program - Average Portfolio Balances in Thousands and Number of Customers Average Balance Number of Customers 16 National Mortgage Warehouse Purchase Program Source: VPFG 2012 10-K; Company Documents Average balance increased $33 million for Q4 2012 vs. Q3 2012 Gross average yield of 4.05% for Q4 2012 Increased number of customers to 43 at Dec 2012, up from 41 at Sept 2012 and 36 at Dec 2011 53% purchase vs. 47% refinance volume Approved maximum facility amounts ranging from $10.0 million to $45.0 million with an average utilization rate of 65%
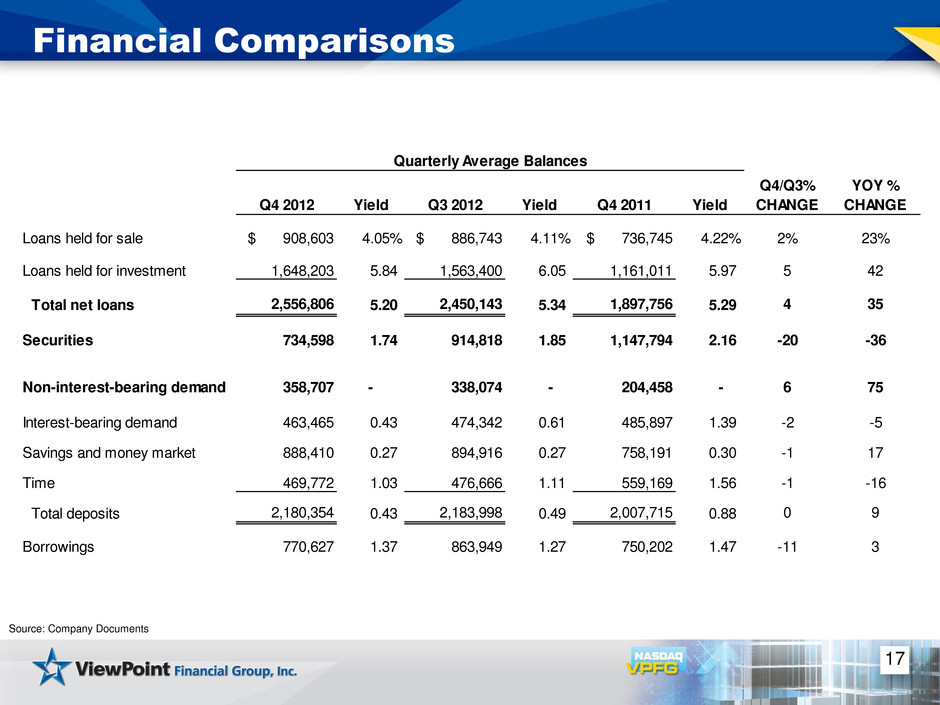
17 Financial Comparisons Source: Company Documents Q4 2012 Yield Q3 2012 Yield Q4 2011 Yield Q4/Q3% CHANGE YOY % CHANGE Loans held for sale $ 908,603 4.05% $ 886,743 4.11% $ 736,745 4.22% 2% 23% Loans held for investment 1,648,203 5.84 1,563,400 6.05 1,161,011 5.97 5 42 Total net loans 2,556,806 5.20 2,450,143 5.34 1,897,756 5.29 4 35 Securities 734,598 1.74 914,818 1.85 1,147,794 2.16 -20 -36 Non-interest-bearing demand 358,707 - 338,074 - 204,458 - 6 75 Interest-bearing demand 463,465 0.43 474,342 0.61 485,897 1.39 -2 -5 Savings and money market 888,410 0.27 894,916 0.27 758,191 0.30 -1 17 Time 469,772 1.03 476,666 1.11 559,169 1.56 -1 -16 Total deposits 2,180,354 0.43 2,183,998 0.49 2,007,715 0.88 0 9 Borrowings 770,627 1.37 863,949 1.27 750,202 1.47 -11 3 Quarterly Average Balances

1.42% 1.22% 1.22% 1.10% 0.88% 0.67% 0.58% 0.49% 0.43% 0.25% 0.50% 0.75% 1.00% 1.25% 1.50% 4Q'10 1Q'11 2Q'11 3Q'11 4Q'11 1Q'12 2Q'12 3Q'12 4Q'12 Quarterly Cost of Deposits Non-interest- bearing demand 16% Interest-bearing demand 21% Savings 9% Money Market 32% Time 22% 18 Significant Improvement in Deposit Cost Source: VPFG 2012 10-K and Company Documents at December 31, 2012 Continued improvement in deposit cost Average non-interest-bearing deposits increased to $359M from $338M linked quarter 78%, or $353M, of time deposits to mature within 12 months with WAR of 1.15% Quarterly Avg. Deposits

19 Credit Quality 1.88% 1.79% 1.41% 1.70% 1.61% 0.5% 1.0% 1.5% 2.0% 4Q'11 1Q'12 2Q'12 3Q'12 4Q'12 Total NPLs as a % of Total Loans (2) 0.80% 0.80% 0.70% 0.88% 0.79% 0.00% 0.20% 0.40% 0.60% 0.80% 1.00% 4Q'11 1Q'12 2Q'12 3Q'12 4Q'12 Total NPA/Assets Source: Company Documents (1) Beginning 2Q’12, total loans includes loans acquired from Highlands (2) Total loans does not include loans held for sale (1) (1) Q4 2012 Q3 2012 Non-accrual loans Commercial real estate 13,609$ 16,572$ Commercial and industrial 5,401 4,597 One- to four- family real estate 6,854 5,142 Home equity/home improvement 1,077 1,519 Other consumer 262 251 Total non-accrual loans 27,203 28,081 Foreclosed assets 1,901 3,850 Total non-performing assets 29,104$ 31,931

12.2% 8.7% 8.6% 13.5% 12.7% 13.5% 5% 10% 15% 20% 2007 2008 2009 2010 2011 2012 15.8% 10.6% 14.4% 17.6% 24.4% 21.7% 5% 10% 15% 20% 25% 30% 2007 2008 2009 2010 2011 2012 20 Robust Capital Tier 1 Capital Tang. Common Equity / Tang. Assets ViewPoint remains among the strongest capitalized institutions in the industry 21.7% Tier 1 Capital at Q4 2012 13.5% Tangible Common Equity to Tangible Assets Deploying capital Organic Growth Dividends Share Repurchase Authorized Disciplined M&A Source: Company Documents at December 31, 2012
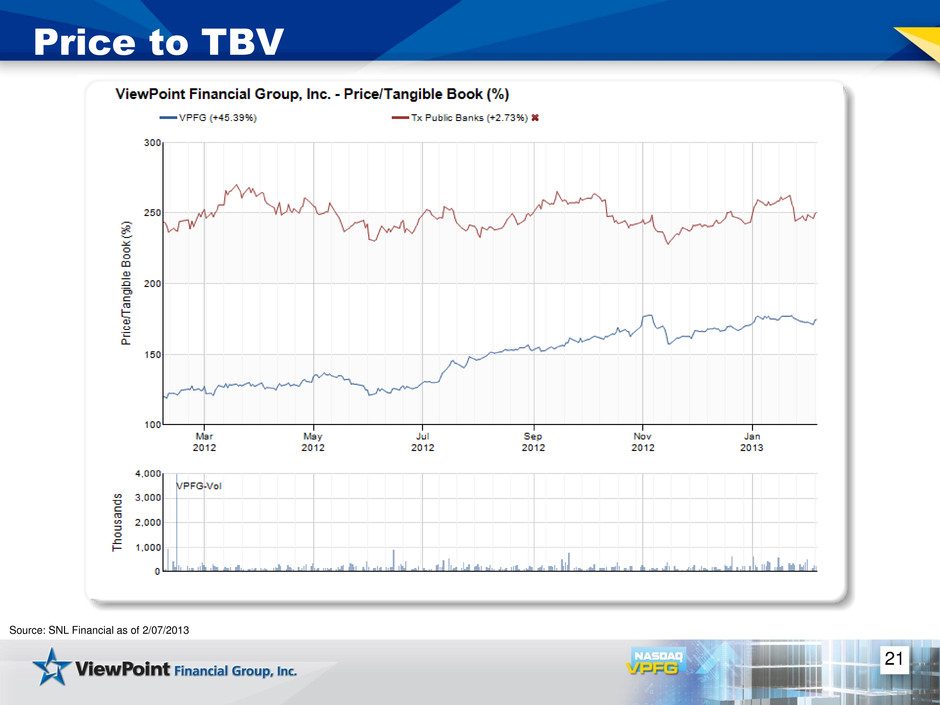
21 Price to TBV Source: SNL Financial as of 2/07/2013

22 Change in Index Value (%) Source: SNL Financial as of 2/07/2013

23 Investment Highlights Positive earnings growth trends One of the largest independent community banking franchises in the highly attractive Texas market Strong balance sheet, and well positioned to execute long term strategy Well-capitalized and able to deploy capital Price to TBV favorable compared to Texas peers

24 Questions?

25 Appendix The subsequent tables present non-GAAP reconciliations of the following calculations: TCE (Tangible Common Equity) to TCA (Tangible Common Assets) ratio TCE per share Price to TBV Core (non-GAAP) net income and earnings per share

26 Appendix TCE to TA, TCE per Share and Price to TBV at December 31, 2012 (Dollar amounts in thousands) Total GAAP equity $520,871 Less: goodwill (29,650) Less: identifiable intangible assets, net (1,653) Total tangible equity $489,568 Total GAAP assets $3,663,058 Less: goodwill (29,650) Less: identifiable intangible assets, net (1,653) Total tangible assets $3,631,755 GAAP Equity to Total Assets 14.22% TCE to TA 13.48% Shares outstanding at December 31, 2012 39,612,911 TCE per Share $12.36
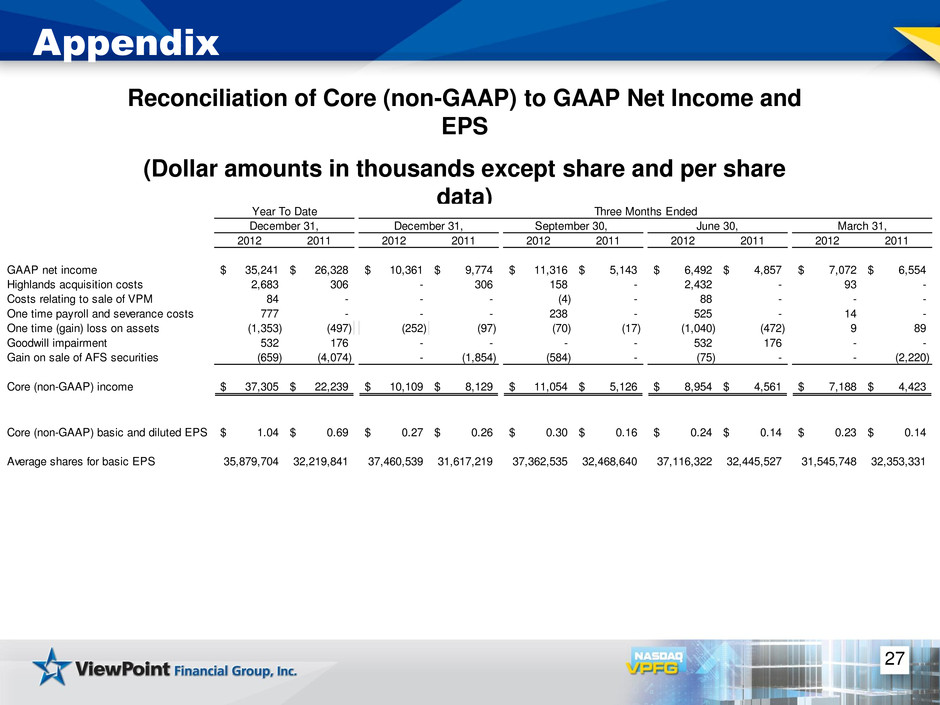
27 Appendix Reconciliation of Core (non-GAAP) to GAAP Net Income and EPS (Dollar amounts in thousands except share and per share data) 2012 2011 2012 2011 2012 2011 2012 2011 2012 2011 GAAP net income 35,241$ 26,328$ 10,361$ 9,774$ 11,316$ 5,143$ 6,492$ 4,857$ 7,072$ 6,554$ Highlands acquisition costs 2,683 306 - 306 158 - 2,432 - 93 - Costs relating to sale of VPM 84 - - - (4) - 88 - - - One time payroll and severance costs 777 - - - 238 - 525 - 14 - One time (gain) loss on assets (1,353) (497) (252) (97) (70) (17) (1,040) (472) 9 89 Goodwill impairment 532 176 - - - - 532 176 - - Gain o sale of AFS securities (659) (4,074) - (1,854) (584) - (75) - - (2,220) Core (non-GAAP) income 37,305$ 22,239$ 10,109$ 8,129$ 11,054$ 5,126$ 8,954$ 4,561$ 7,188$ 4,423$ Core (non-GAAP) basic and diluted EPS 1.04$ 0.69$ 0.27$ 0.26$ 0.30$ 0.16$ 0.24$ 0.14$ 0.23$ 0.14$ Average shares for basic EPS 35,879,704 32,219,841 37,460,539 31,617,219 37,362,535 32,468,640 37,116,322 32,445,527 31,545,748 32,353,331 December 31, June 30, March 31, Year To Date December 31, September 30, Three Months Ended

28 Appendix Reconciliation of Core (non-GAAP) to GAAP Net Income and EPS (Dollar amounts in thousands except share and per share data) 2012 2011 2010 2009 2008 GAAP net income (loss) 35,241$ 26,328$ 17,799$ 2,670$ (3,315)$ Highlands acquisition costs 2,683 306 - - - Costs relating to sale of VPM 84 - - - - One time payroll and severance costs 777 - - - - One time (gain) loss on assets (1,353) (497) 135 526 (120) Goodwill impairment 532 176 - - - Gain on sale of AFS securities, net of tax (659) (4,074) - (1,569) - Impairment of collateralized debt obligations ( ll credit) - - - 8,082 9,114 Core (non-GAAP) income 37,305$ 22,239$ 17,934$ 9,709$ 5,679$ Core (non-GAAP) basic and diluted EPS 1.04$ 0.69$ 0.60$ 0.35$ 0.20$ Average shares for basic EPS 35,879,704 32,219,841 30,128,985 27,881,941 27,768,645 Year Ended December 31,
