Attached files
| file | filename |
|---|---|
| 8-K - 8-K - AAR CORP | a13-4650_18k.htm |
Exhibit 99.1
|
|
AAR CORP. Investor Presentation Cowen & Company 34th Annual Aerospace/Defense Conference February 7, 2013 |
|
|
Forward-Looking Statements This presentation includes certain statements relating to future results, which are forward-looking statements as that term is defined in the Private Securities Litigation Reform Act of 1995. These forward-looking statements are based on beliefs of Company management, as well as assumptions and estimates based on information currently available to the Company, and are subject to certain risks and uncertainties that could cause actual results to differ materially from historical results or those anticipated, including those factors discussed under Item 1A, entitled “Risk Factors,” included in the Company’s Form 10-K for the fiscal year ended May 31, 2012. Should one or more of these risks or uncertainties materialize adversely, or should underlying assumptions or estimates prove incorrect, actual results may vary materially from those described. These events and uncertainties are difficult or impossible to predict accurately and many are beyond the Company’s control. The Company assumes no obligation to update any forward-looking statements to reflect events or circumstances after the date of such statements or to reflect the occurrence of anticipated or unanticipated events. For additional information, see the comments included in AAR’s filings with the Securities and Exchange Commission. |
|
|
Key Investment Highlights Balanced portfolio of businesses Independent leader in aftermarket solutions: commercial and defense MRO Supply Chain Proven track record of reducing costs and improving productivity Market leader in cargo products: commercial and defense Design, engineer and manufacture Steady organic growth supplemented by accretive strategic acquisitions Proven management team focused on driving growth |
|
|
Company Overview & Strategy |
|
|
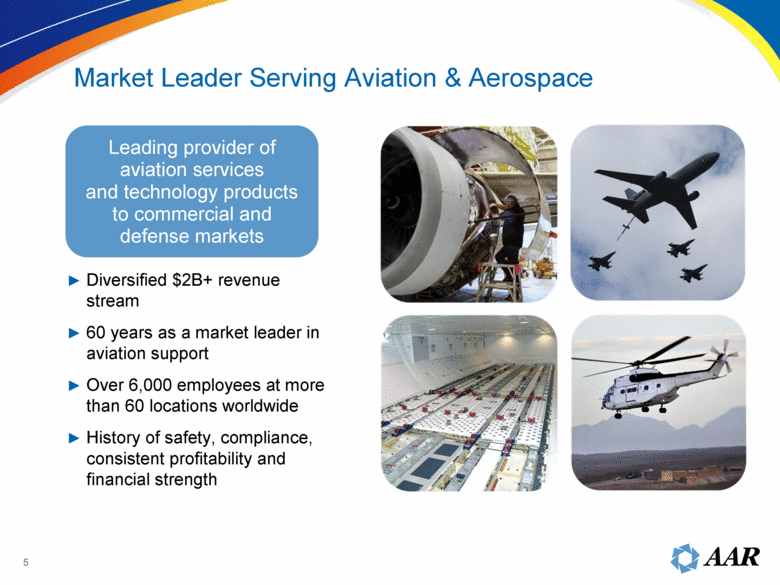
Diversified $2B+ revenue stream 60 years as a market leader in aviation support Over 6,000 employees at more than 60 locations worldwide History of safety, compliance, consistent profitability and financial strength Leading provider of aviation services and technology products to commercial and defense markets Market Leader Serving Aviation & Aerospace |
|
|
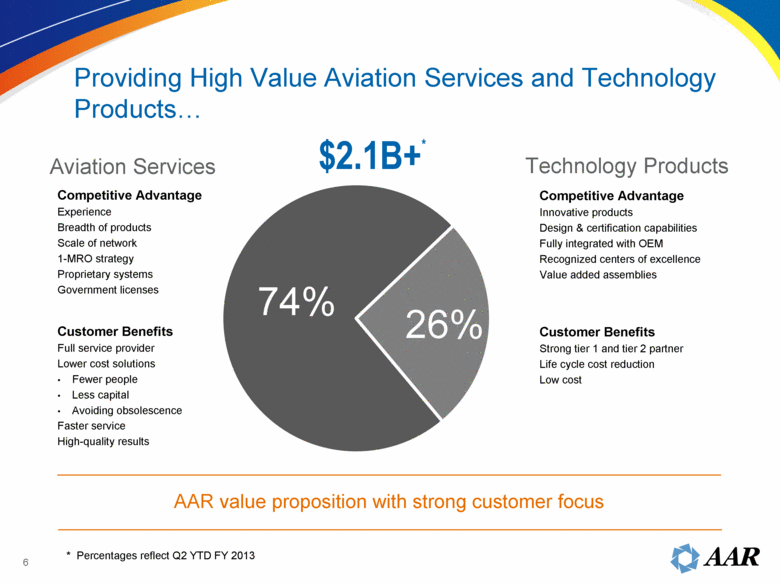
Aviation Services Technology Products Competitive Advantage Innovative products Design & certification capabilities Fully integrated with OEM Recognized centers of excellence Value added assemblies Customer Benefits Full service provider Lower cost solutions Fewer people Less capital Avoiding obsolescence Faster service High-quality results Competitive Advantage Experience Breadth of products Scale of network 1-MRO strategy Proprietary systems Government licenses $2.1B+* AAR value proposition with strong customer focus Providing High Value Aviation Services and Technology Products... Customer Benefits Strong tier 1 and tier 2 partner Life cycle cost reduction Low cost * Percentages reflect Q2 YTD FY 2013 74% 26% |
|
|
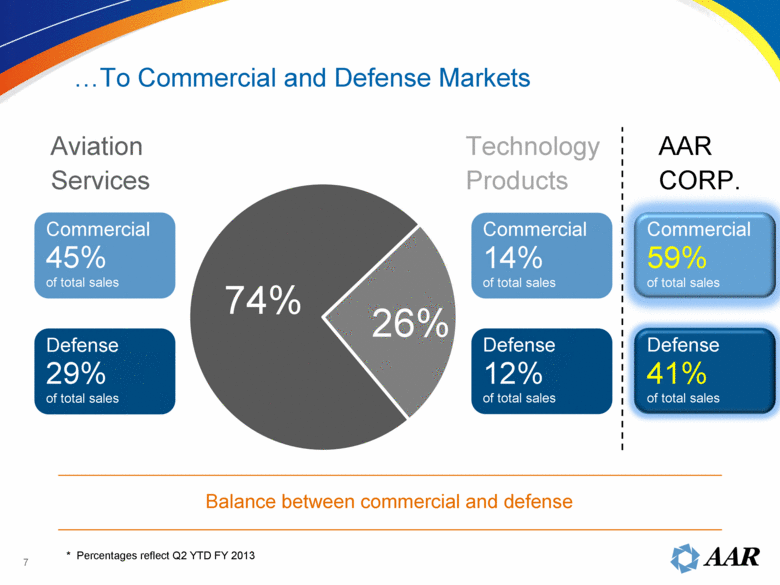
Commercial 45% of total sales Defense 29% of total sales Commercial 14% of total sales Defense 12% of total sales Aviation Services Technology Products Balance between commercial and defense Commercial 59% of total sales Defense 41% of total sales AAR CORP. ...To Commercial and Defense Markets * Percentages reflect Q2 YTD FY 2013 74% 26% |
|
|
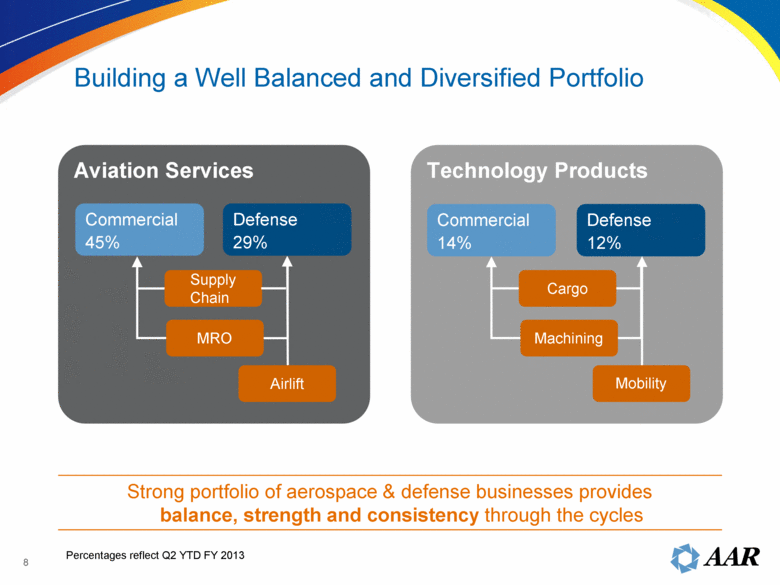
Aviation Services Technology Products Commercial 45% Defense 29% Commercial 14% Defense 12% Machining Cargo MRO Supply Chain Strong portfolio of aerospace & defense businesses provides balance, strength and consistency through the cycles Mobility Airlift Percentages reflect Q2 YTD FY 2013 Building a Well Balanced and Diversified Portfolio |
|
|
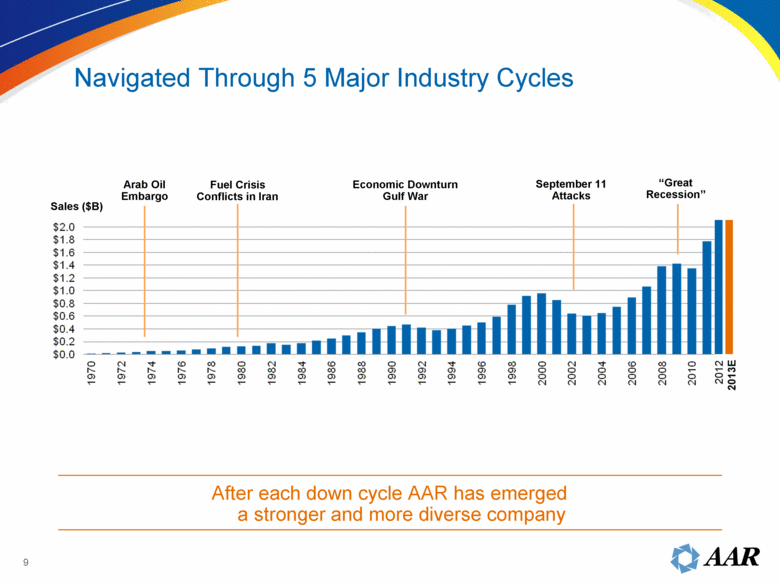
Arab Oil Embargo Fuel Crisis Conflicts in Iran Economic Downturn Gulf War September 11 Attacks “Great Recession” Sales ($B) After each down cycle AAR has emerged a stronger and more diverse company 2012 Navigated Through 5 Major Industry Cycles 2013E |
|
|
Commercial +26%* Q2 YTD FY13 financial performance Revenues up 10% and EPS up 7% Operating margins up to 7.2% vs. 6.9% Strong growth opportunities in Commercial Leadership position in commercial aftermarket MRO and Supply Chain services Aviation Services segment to deliver full solution to customers, both Commercial and Defense Exposure to commercial build cycle with B747-8 and A350 Cargo Systems Government/Defense Airlift contracts renewed Services are budget enablers * Q2 YTD FY13 vs. FY12. Current FY13 Operating Environment Defense - 7%* |
|
|
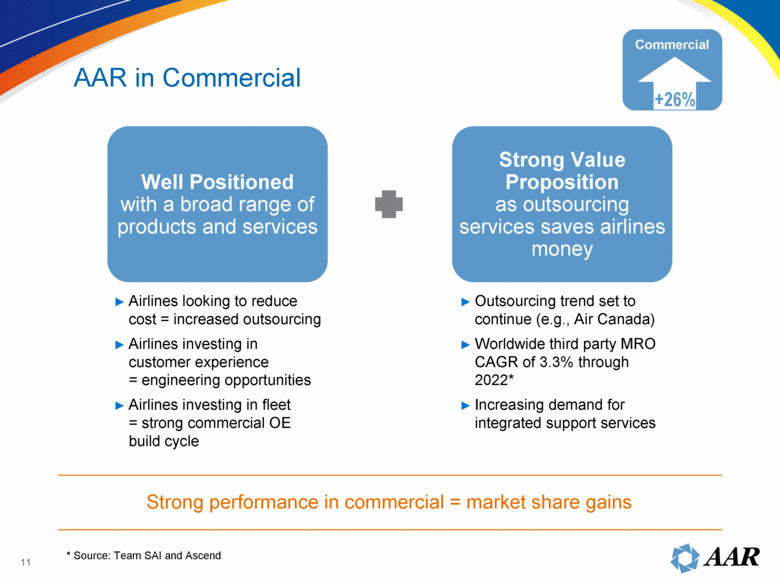
Strong Value Proposition as outsourcing services saves airlines money Outsourcing trend set to continue (e.g., Air Canada) Worldwide third party MRO CAGR of 3.3% through 2022* Increasing demand for integrated support services Airlines looking to reduce cost = increased outsourcing Airlines investing in customer experience = engineering opportunities Airlines investing in fleet = strong commercial OE build cycle Strong performance in commercial = market share gains Commercial +26% * Source: Team SAI and Ascend AAR in Commercial Well Positioned with a broad range of products and services |
|
|
Strong derivative benefit from commercial success Strong Value Proposition via lowering cost and doing “more without more” Long-Term Requirements for Airlift Services Defense flat Proven track record Cost reductions and efficiency gains a central strategy in future budgets: Commercial Off The Shelf solutions (COTS) Leadership position in niche markets AAR in Defense - 7% All current options exercised Adjacent market opportunities DoD DoS Foreign Governments Commercial operations in austere environments |
|
|
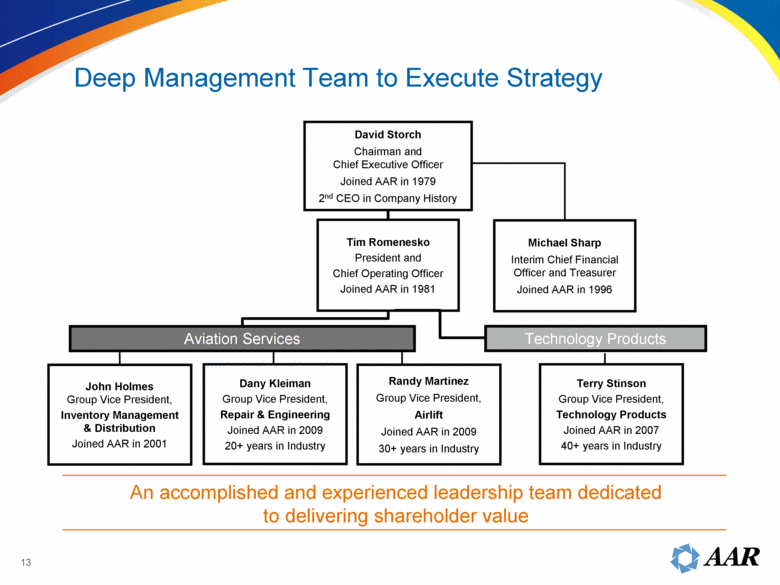
Michael Sharp Interim Chief Financial Officer and Treasurer Joined AAR in 1996 An accomplished and experienced leadership team dedicated to delivering shareholder value Terry Stinson Group Vice President, Technology Products Joined AAR in 2007 40+ years in Industry John Holmes Group Vice President, Inventory Management & Distribution Joined AAR in 2001 Randy Martinez Group Vice President, Airlift Joined AAR in 2009 30+ years in Industry Dany Kleiman Group Vice President, Repair & Engineering Joined AAR in 2009 20+ years in Industry Tim Romenesko President and Chief Operating Officer Joined AAR in 1981 David Storch Chairman and Chief Executive Officer Joined AAR in 1979 2nd CEO in Company History Aviation Services Technology Products Deep Management Team to Execute Strategy |
|
|
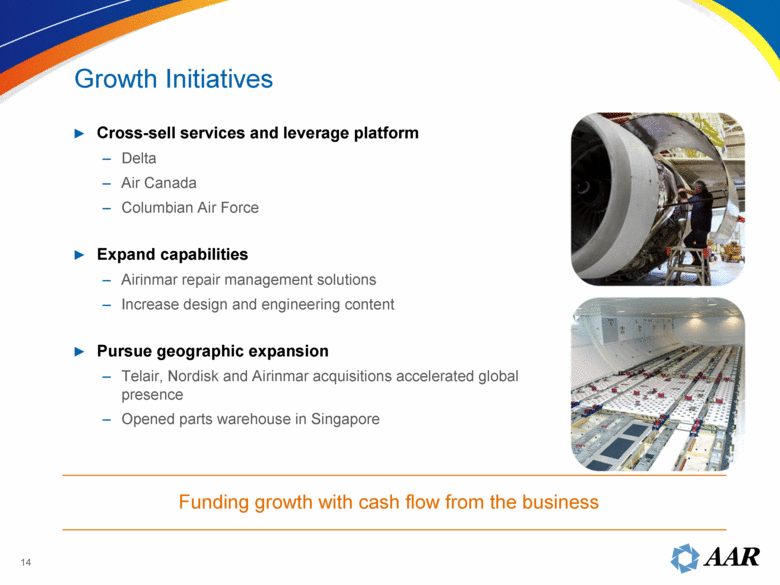
Growth Initiatives Cross-sell services and leverage platform Delta Air Canada Columbian Air Force Expand capabilities Airinmar repair management solutions Increase design and engineering content Pursue geographic expansion Telair, Nordisk and Airinmar acquisitions accelerated global presence Opened parts warehouse in Singapore Funding growth with cash flow from the business |
|
|
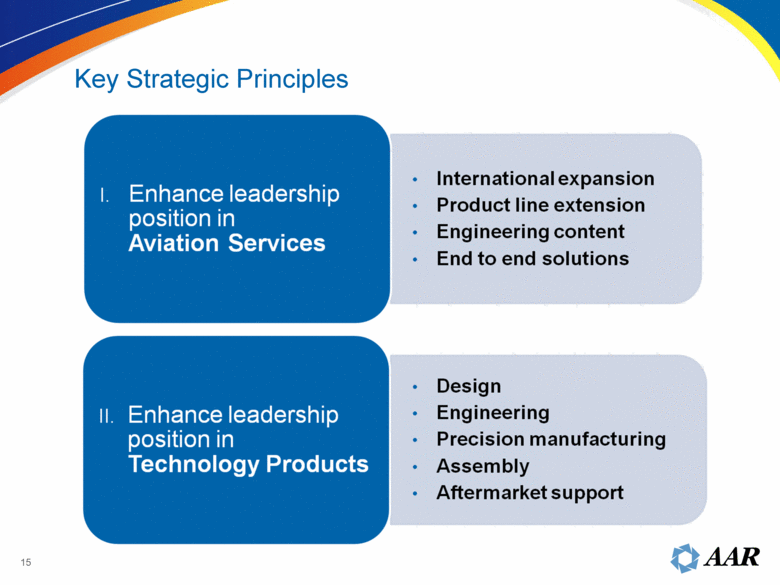
Key Strategic Principles I. Enhance leadership position in Aviation Services • International expansion • Product line extension • Engineering content • End to end solutions II. Enhance leadership position in technology Products • Design • Engineering • Precision manufacturing • Assembly • Aftermarket support |
|
|
Financial Performance |
|
|
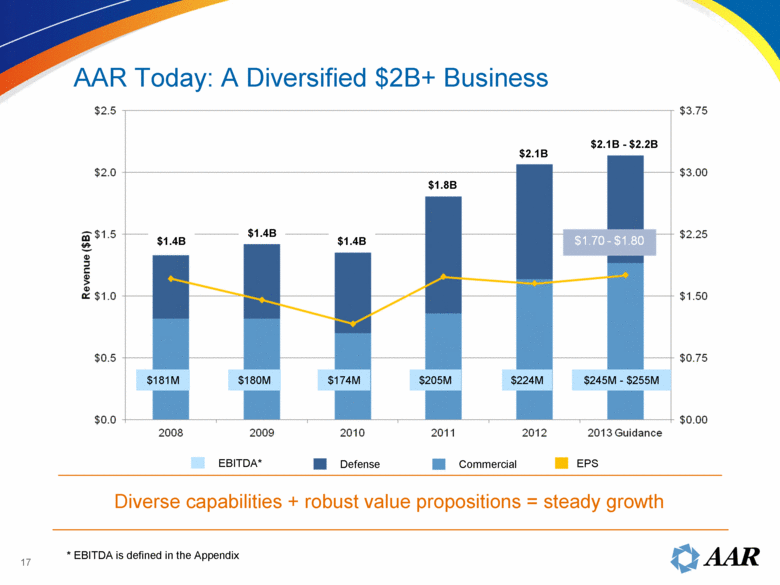
EBITDA* $1.4B $1.4B $1.4B $1.8B $2.1B Diverse capabilities + robust value propositions = steady growth Defense Commercial AAR Today: A Diversified $2B+ Business * EBITDA is defined in the Appendix $2.1B - $2.2B $181M $205M $174M $180M $224M $245M - $255M EPS $1.70 - $1.80 Revenue ($B) $0.0 $0.5 $1.0 $1.5 $2.0 $2.5 $0.00 $0.75 $1.50 $2.25 $3.00 $3.75 2008 2009 2010 2011 2012 2013 Guidance |
|
|
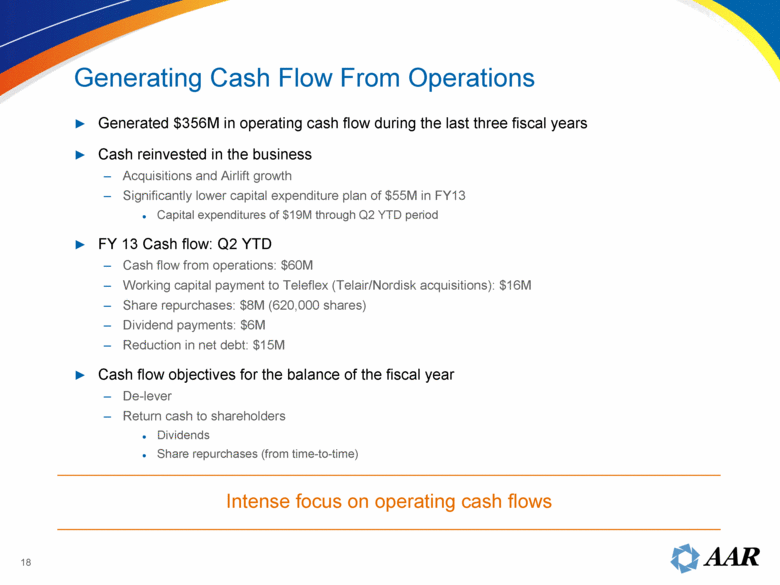
Generated $356M in operating cash flow during the last three fiscal years Cash reinvested in the business Acquisitions and Airlift growth Significantly lower capital expenditure plan of $55M in FY13 Capital expenditures of $19M through Q2 YTD period FY 13 Cash flow: Q2 YTD Cash flow from operations: $60M Working capital payment to Teleflex (Telair/Nordisk acquisitions): $16M Share repurchases: $8M (620,000 shares) Dividend payments: $6M Reduction in net debt: $15M Cash flow objectives for the balance of the fiscal year De-lever Return cash to shareholders Dividends Share repurchases (from time-to-time) Intense focus on operating cash flows Generating Cash Flow From Operations |
|
|
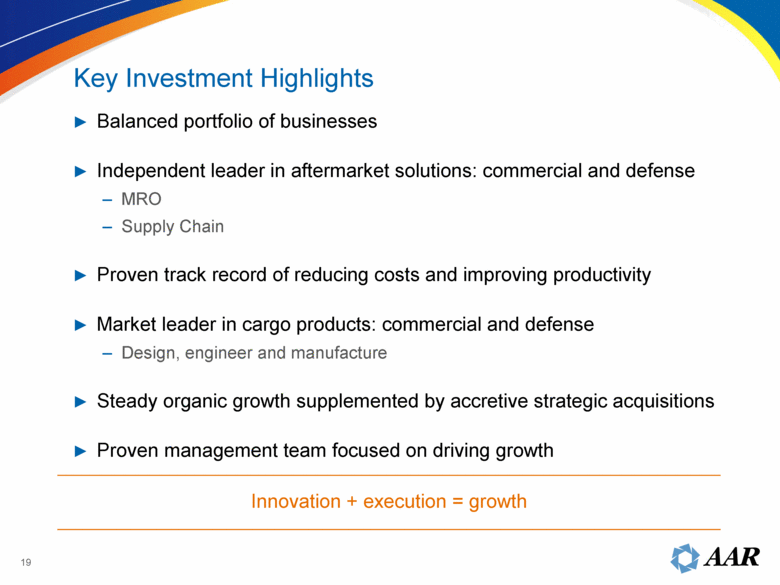
Innovation + execution = growth Key Investment Highlights Balanced portfolio of businesses Independent leader in aftermarket solutions: commercial and defense MRO Supply Chain Proven track record of reducing costs and improving productivity Market leader in cargo products: commercial and defense Design, engineer and manufacture Steady organic growth supplemented by accretive strategic acquisitions Proven management team focused on driving growth |
|
|
Appendix |
|
|
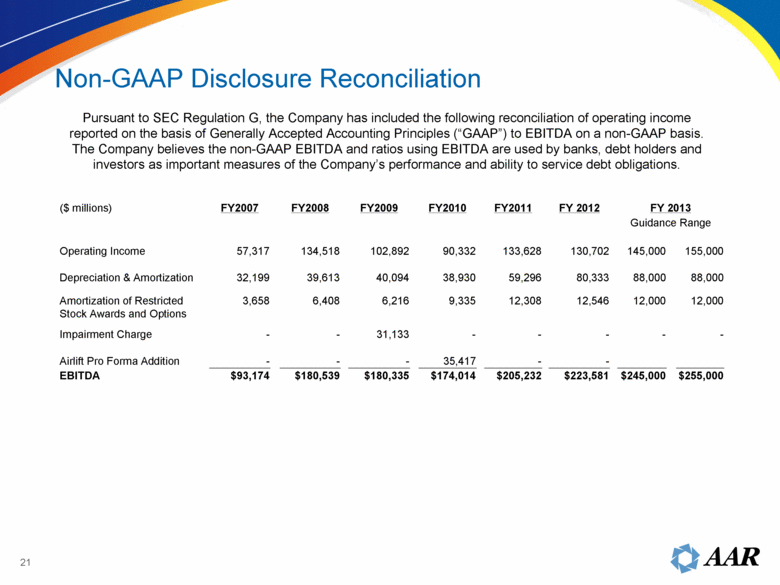
Non-GAAP Disclosure Reconciliation Pursuant to SEC Regulation G, the Company has included the following reconciliation of operating income reported on the basis of Generally Accepted Accounting Principles (“GAAP”) to EBITDA on a non-GAAP basis. The Company believes the non-GAAP EBITDA and ratios using EBITDA are used by banks, debt holders and investors as important measures of the Company’s performance and ability to service debt obligations. ($ millions) FY2007 FY2008 FY2009 FY2010 FY2011 FY 2012 FY 2013 Guidance Range Operating Income 57,317 134,518 102,892 90,332 133,628 130,702 145,000 155,000 Depreciation & Amortization 32,199 39,613 40,094 38,930 59,296 80,333 88,000 88,000 Amortization of Restricted Stock Awards and Options 3,658 6,408 6,216 9,335 12,308 12,546 12,000 12,000 Impairment Charge - - 31,133 - - - - - Airlift Pro Forma Addition - - - 35,417 - - EBITDA $93,174 $180,539 $180,335 $174,014 $205,232 $223,581 $245,000 $255,000 |

