Attached files
| file | filename |
|---|---|
| 8-K - USG CORP. 8-K - USG CORP | a50555034.htm |
| EX-99.1 - EXHIBIT 99.1 - USG CORP | a50555034ex99_1.htm |
Exhibit 99.2
USG Corporation Fourth Quarter 2012 Earnings Conference Call and Webcast February 6, 2013
Forward-Looking Statements This presentation contains forward-looking statements within the meaning of the Private Securities Litigation Reform Act of 1995 related to management’s expectations about future conditions. Actual business, market or other conditions may differ materially from management’s expectations and, accordingly, may affect our sales and profitability or other results and liquidity. Actual results may differ materially due to various other factors, including: economic conditions, such as the levels of new home and other construction activity, employment levels, the availability of mortgage, construction and other financing, mortgage and other interest rates, housing affordability and supply, the levels of foreclosures and home resales, currency exchange rates and consumer confidence; capital markets conditions and the availability of borrowings under our credit agreement or other financings; competitive conditions, such as price, service competition; shortages in raw materials; changes in raw material and product and energy costs; volatility in the assumptions used to determine the funded status of our pension plans; the loss of one or more major customers and our customers’ ability to meet their financial obligations to us; capacity utilization rates for us and the industry; our ability to expand into new geographic markets and the stability of such markets; regulations environmental changes in laws or regulations, including and safety regulations; the satisfactory performance of certain business functions by third party service providers; our ability to achieve anticipated savings from cost reduction programs; the outcome in contested litigation matters; the effects of acts of terrorism or war upon domestic and international economies and financial markets; and acts of God. We assume no obligation to update any forward-looking information contained in this press release. Fourth Quarter 2012 Earnings Call and Webcast 2
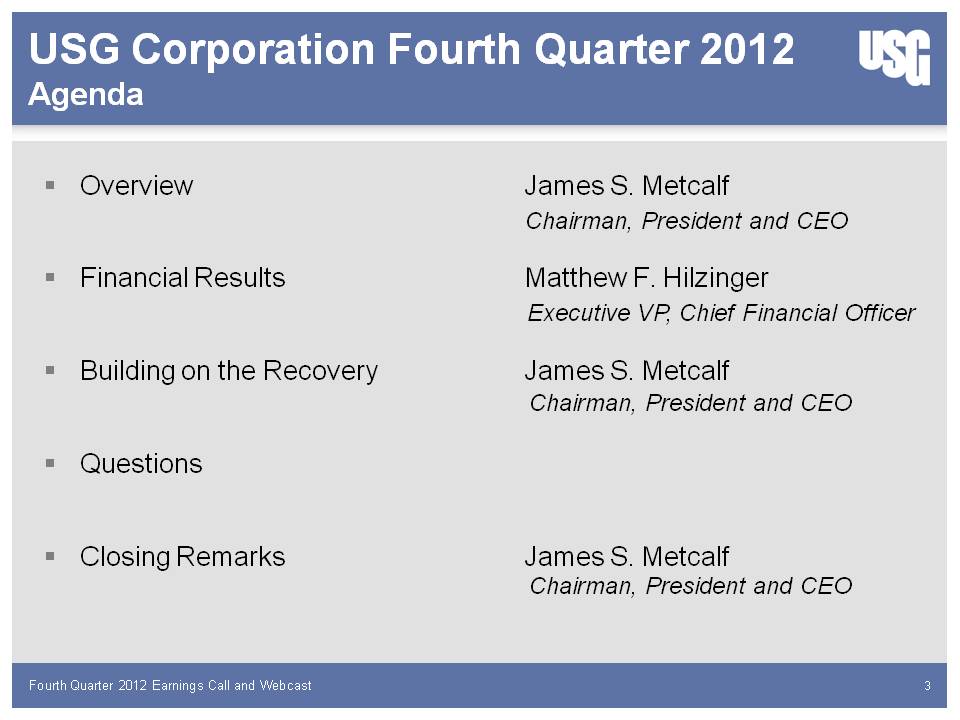
USG Corporation Fourth Quarter 2012 Agenda Overview James S. Metcalf Chairman, President and CEO Financial Results Matthew F. Hilzinger Executive VP, Chief Financial Officer Building on the Recovery James S. Metcalf Chairman, President and CEO Questions Closing Remarks James S. Metcalf Chairman, President and CEO Fourth Quarter 2012 Earnings Call and Webcast 3
James S. Metcalf Chairman, President and CEO
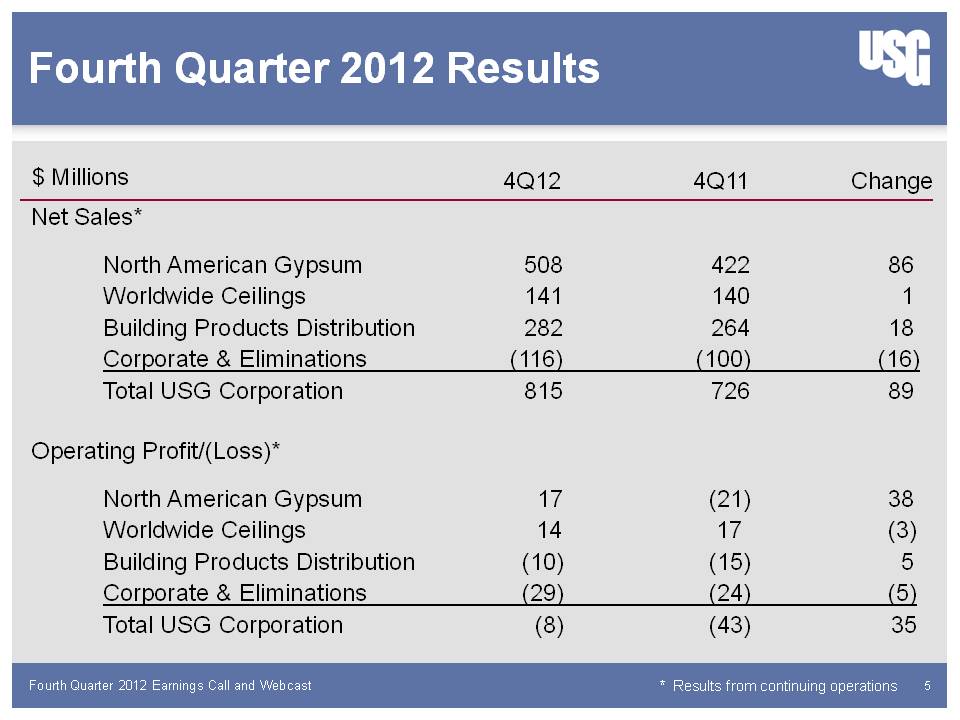
Fourth Quarter 2012 Results $ Millions 4Q12 4Q11 Change Net Sales* North American Gypsum 508 422 86 Worldwide Ceilings 141 140 1 Building Products Distribution 282 264 18 Corporate & Eliminations (116) (100) (16) Total USG Corporation 815 726 89 Operating Profit/(Loss)* North American Gypsum 17 (21) 38 Worldwide Ceilings 14 17 (3) Building Products Distribution (10) (15) 5 Corporate & Eliminations (29) (24) (5) Total USG Corporation (8) (43) 35 Fourth Quarter 2012 Earnings Call and Webcast * Results from continuing operations 5
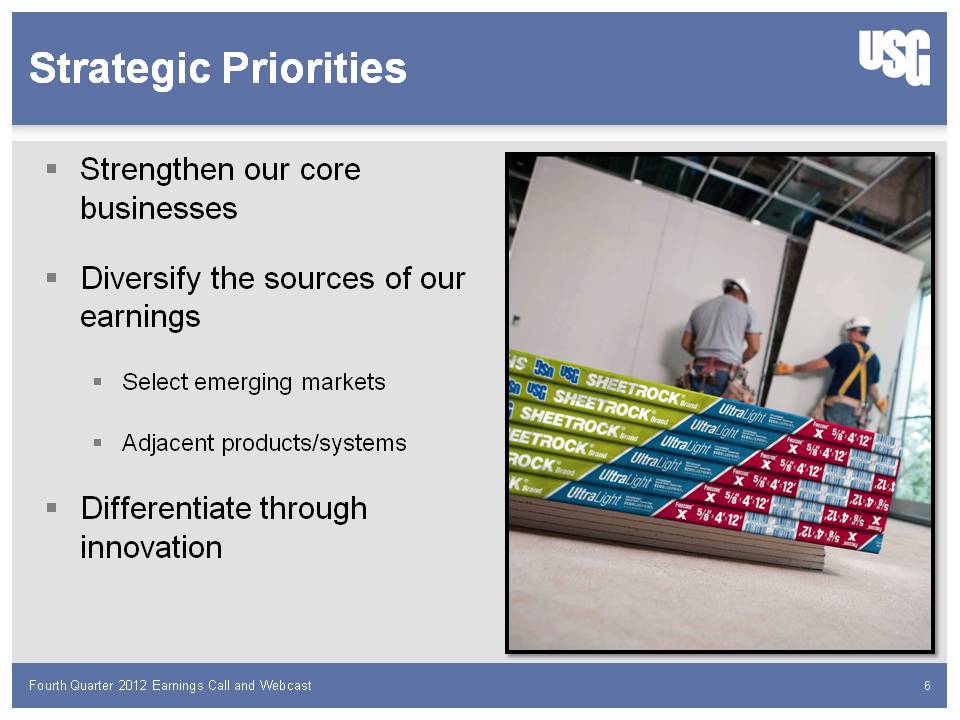
Strategic Priorities Strengthen our core businesses Diversify the sources of our earnings Select emerging markets Adjacent products/systems Differentiate through innovation Fourth Quarter 2012 Earnings Call and Webcast 6
Matthew F. Hilzinger Executive VP, Chief Financial Officer Financial Results
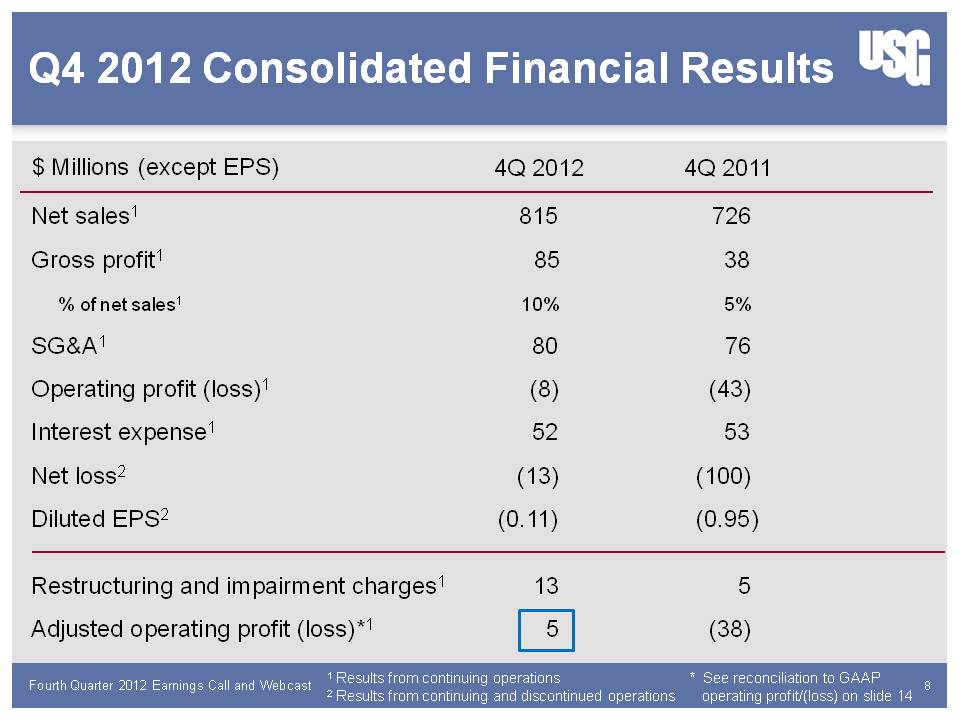
Q4 2012 Consolidated Financial Results $ Millions (except EPS) 4Q 2012 4Q 2011 Net sales1 815 726 Gross profit1 85 38 % of net sales1 10% 5% SG&A1 80 76 Operating profit (loss)1 (8) (43) Interest expense1 52 53 Net loss2 (13) (100) Diluted EPS2 (0.11) (0.95) Restructuring and impairment charges1 13 5 Adjusted operating profit (loss)*1 5 (38) Fourth Quarter 2012 Earnings Call and Webcast 1 Results from continuing operations 2 Results from continuing and discontinued operations * See reconciliation to GAAP operating profit/(loss) on slide 14 8
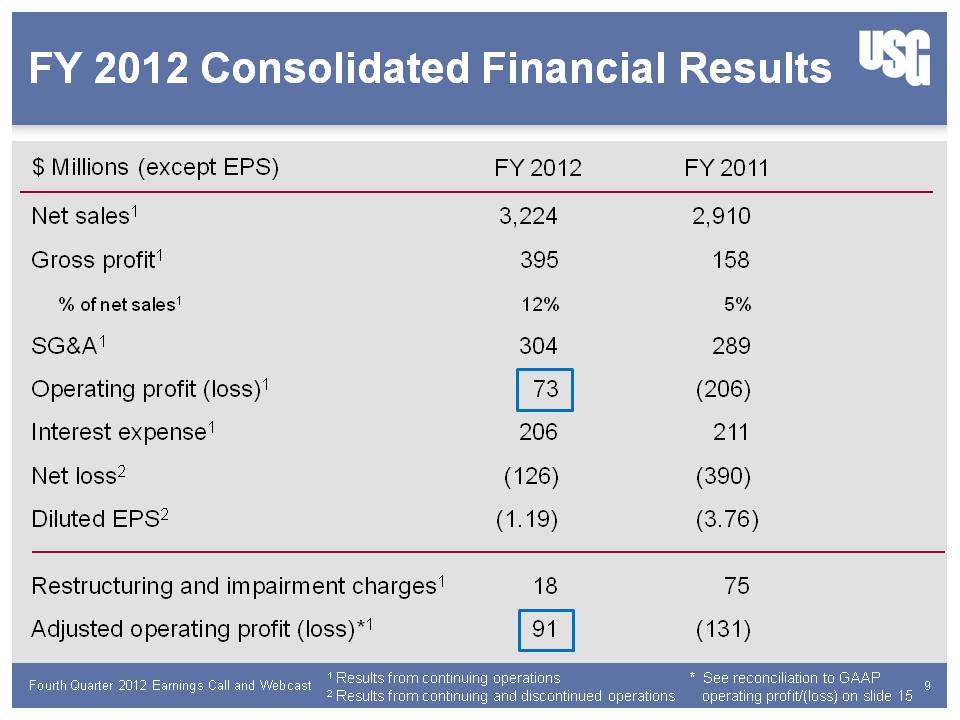
FY 2012 Consolidated Financial Results $ Millions (except EPS) FY 2012 FY 2011 Net sales1 3,224 2,910 Gross profit1 395 158 % of net sales1 12% 5% SG&A1 304 289 Operating profit (loss)1 73 (206) Interest expense1 206 211 Net loss2 (126) (390) Diluted EPS2 (1.19) (3.76) Restructuring and impairment charges1 18 75 Adjusted operating profit (loss)*1 91 (131) Fourth Quarter 2012 Earnings Call and Webcast 1 Results from continuing operations 2 Results from continuing and discontinued operations * See reconciliation to GAAP operating profit/(loss) on slide 15 9
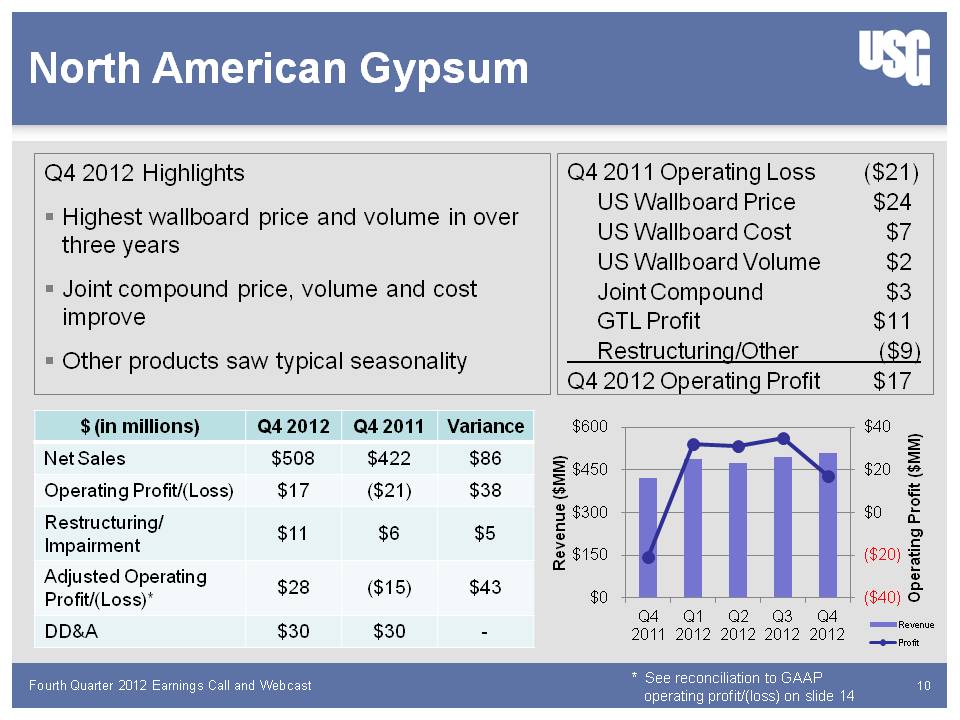
North American Gypsum Q4 2012 Highlights Highest wallboard price and volume in over three years Joint compound price, volume and cost improve Other products saw typical seasonality Q4 2011 Operating Loss ($21) US Wallboard Price $24 US Wallboard Cost $7 US Wallboard Volume $2 Joint Compound $3 GTL Profit $11 Restructuring/Other ($9) Q4 2012 Operating Profit $17 $ (in millions) Q4 2012 Q4 2011 Variance Net Sales $508 $422 $86 Operating Profit/(Loss) $17 ($21) $38 Restructuring/Impairment $11 $6 $5 Adjusted Operating Profit/(Loss)* $28 ($15) $43 DD&A $30 $30 - Fourth Quarter 2012 Earnings Call and Webcast * See reconciliation to GAAP operating profit/(loss) on slide 14 10
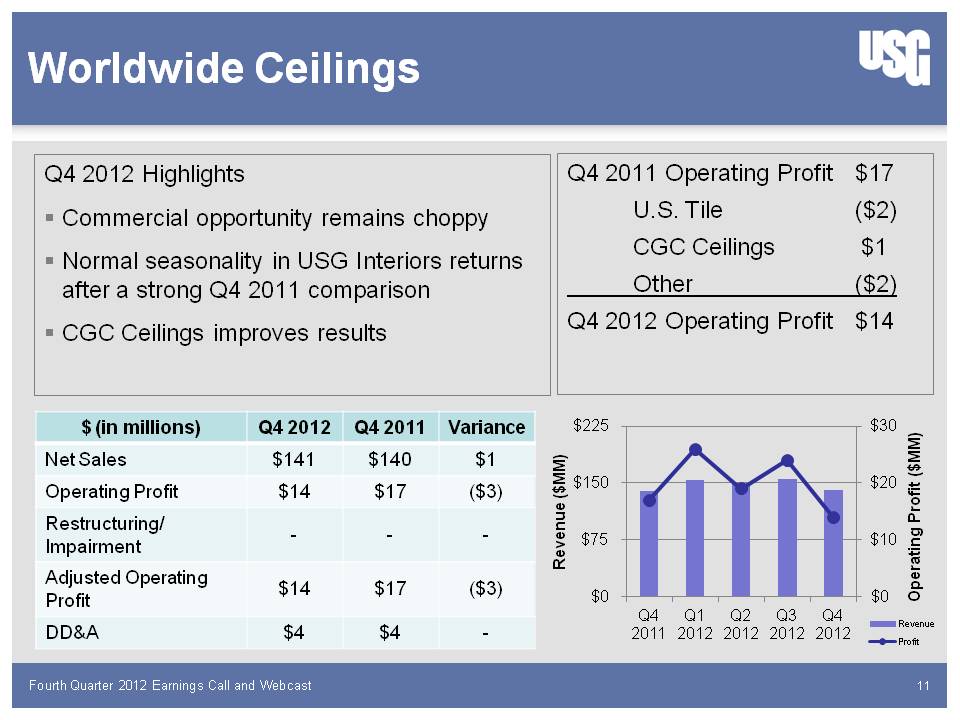
Worldwide Ceilings Q4 2012 Highlights Commercial opportunity remains choppy Normal seasonality in USG Interiors returns after a strong Q4 2011 comparison CGC Ceilings improves results Q4 2011 Operating Profit $17 U.S. Tile ($2) CGC Ceilings $1 Other ($2) Q4 2012 Operating Profit $14 $ (in millions) Q4 2012 Q4 2011 Variance Net Sales $141 $140 $1 Operating Profit $14 $17 ($3) Restructuring/Impairment - - - Adjusted Operating Profit $14 $17 ($3) DD&A $4 $4 - Fourth Quarter 2012 Earnings Call and Webcast 11
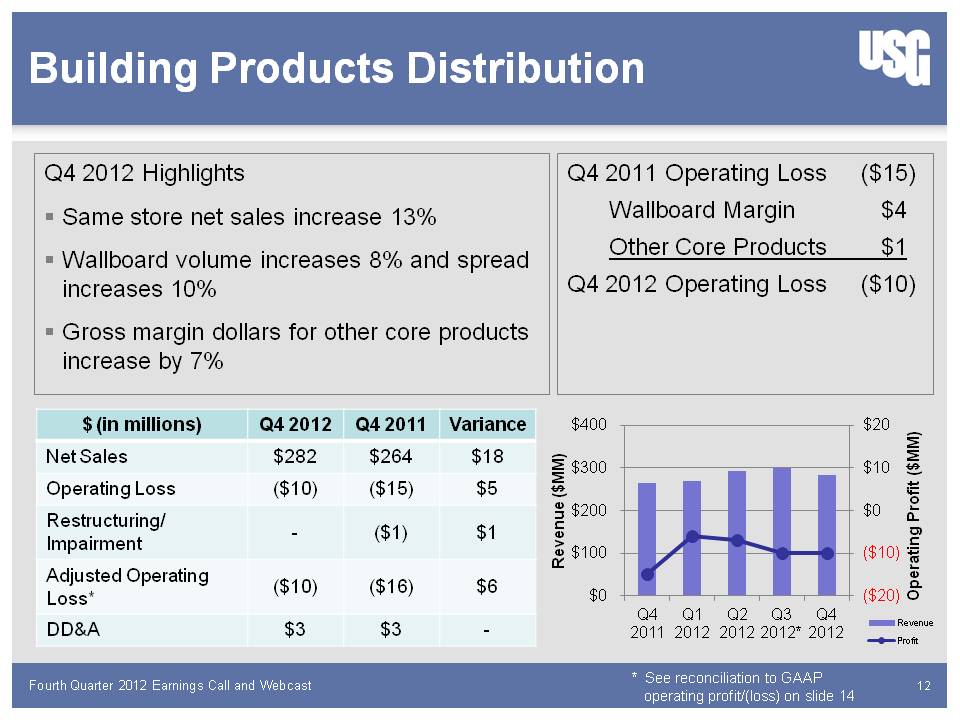
Building Products Distribution Q4 2012 Highlights Same store net sales increase 13% Wallboard volume increases 8% and spread increases 10% Gross margin dollars for other core products increase by 7% Q4 2011 Operating Loss ($15) Wallboard Margin $4 Other Core Products $1 Q4 2012 Operating Loss ($10) $ (in millions) Q4 2012 Q4 2011 Variance Net Sales $282 $264 $18 Operating Loss ($10) ($15) $5 Restructuring/Impairment - ($1) $1 Adjusted Operating Loss* ($10) ($16) $6 DD&A $3 $3 - Fourth Quarter 2012 Earnings Call and Webcast * See reconciliation to GAAP operating profit/(loss) on slide 14 12
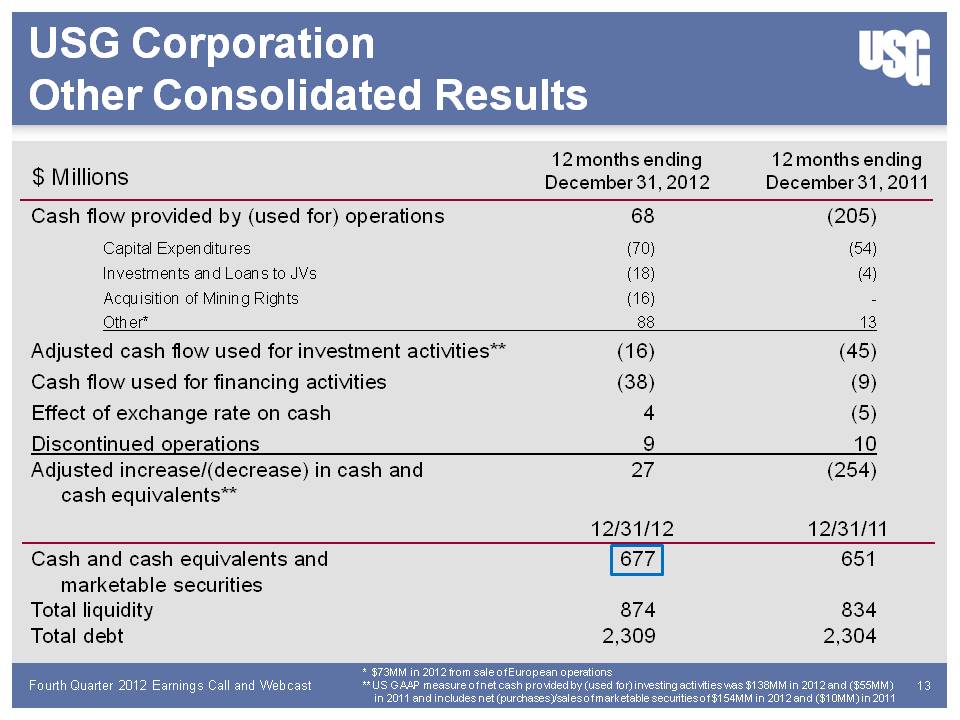
USG Corporation Other Consolidated Results $ Millions 12 months ending December 31, 2012 12 months ending December 31, 2011 Cash flow provided by (used for) operations 68 (205) Capital Expenditures (70) (54) Investments and Loans to JVs (18) (4) Acquisition of Mining Rights (16) - Other* 88 13 Adjusted cash flow used for investment activities** (16) (45) Cash flow used for financing activities (38) (9) Effect of exchange rate on cash 4 (5) Discontinued operations 9 10 Adjusted increase/(decrease) in cash and cash equivalents** 27 (254) 12/31/12 12/31/11 Cash and cash equivalents and marketable securities 677 651 Total liquidity 874 834 Total debt 2,309 2,304 Fourth Quarter 2012 Earnings Call and Webcast * $73MM in 2012 from sale of European operations ** US GAAP measure of net cash provided by (used for) investing activities was $138MM in 2012 and ($55MM) in 2011 and includes net (purchases)/sales of marketable securities of $154MM in 2012 and ($10MM) in 2011 13
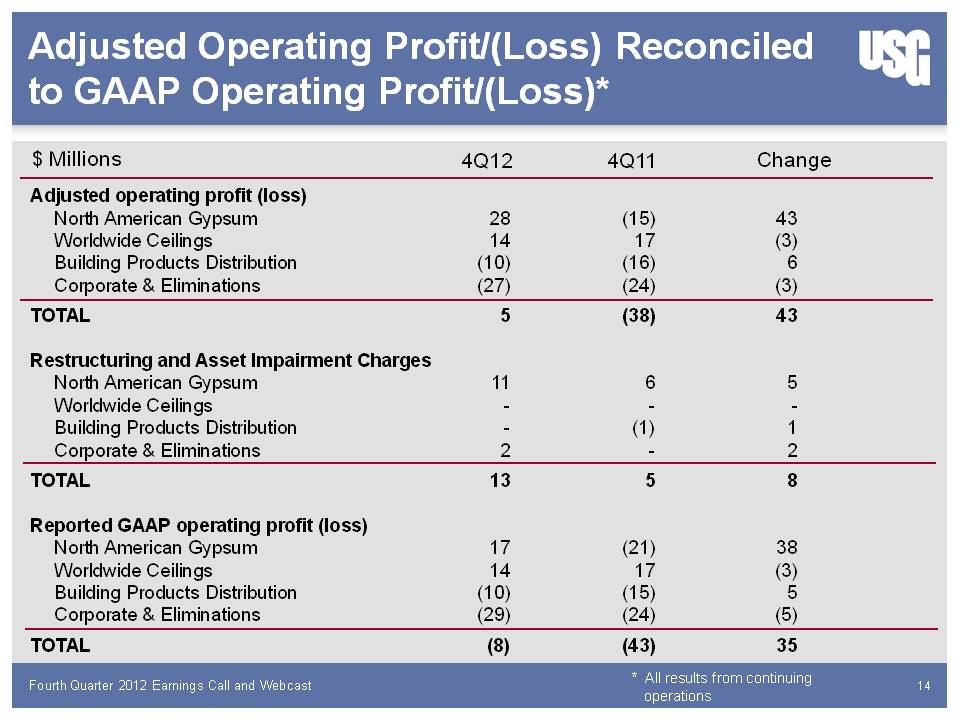
Adjusted Operating Profit/(Loss) Reconciled to GAAP Operating Profit/(Loss)* $ Millions 4Q12 4Q11 Change Adjusted operating profit (loss) North American Gypsum 28 (15) 43 Worldwide Ceilings 14 17 (3) Building Products Distribution (10) (16) 6 Corporate & Eliminations (27) (24) (3) TOTAL 5 (38) 43 Restructuring and Asset Impairment Charges North American Gypsum 11 6 5 Worldwide Ceilings - - - Building Products Distribution - (1) 1 Corporate & Eliminations 2 - 2 TOTAL 13 5 8 Reported GAAP operating profit (loss) North American Gypsum 17 (21) 38 Worldwide Ceilings 14 17 (3) Building Products Distribution (10) (15) 5 Corporate & Eliminations (29) (24) (5) TOTAL (8) (43) 35 Fourth Quarter 2012 Earnings Call and Webcast * All results from continuing operations 14

Adjusted Operating Profit/(Loss) Reconciled to GAAP Operating Profit/(Loss)* $ Millions FY12 FY11 Change Adjusted operating profit (loss) North American Gypsum 130 (69) 199 Worldwide Ceilings 84 82 2 Building Products Distribution (33) (61) 28 Corporate & Eliminations (90) (83) (7) TOTAL 91 (131) 222 Restructuring and Asset Impairment Charges North American Gypsum 15 67 (52) Worldwide Ceilings 1 - 1 Building Products Distribution - 7 (7) Corporate & Eliminations 2 1 1 TOTAL 18 75 (57) Reported GAAP operating profit (loss) North American Gypsum 115 (136) 251 Worldwide Ceilings 83 82 1 Building Products Distribution (33) (68) 35 Corporate & Eliminations (92) (84) (8) TOTAL 73 (206) 279 Fourth Quarter 2012 Earnings Call and Webcast * All results from continuing operations 15
James S. Metcalf Chairman, President and CEO Closing Remarks
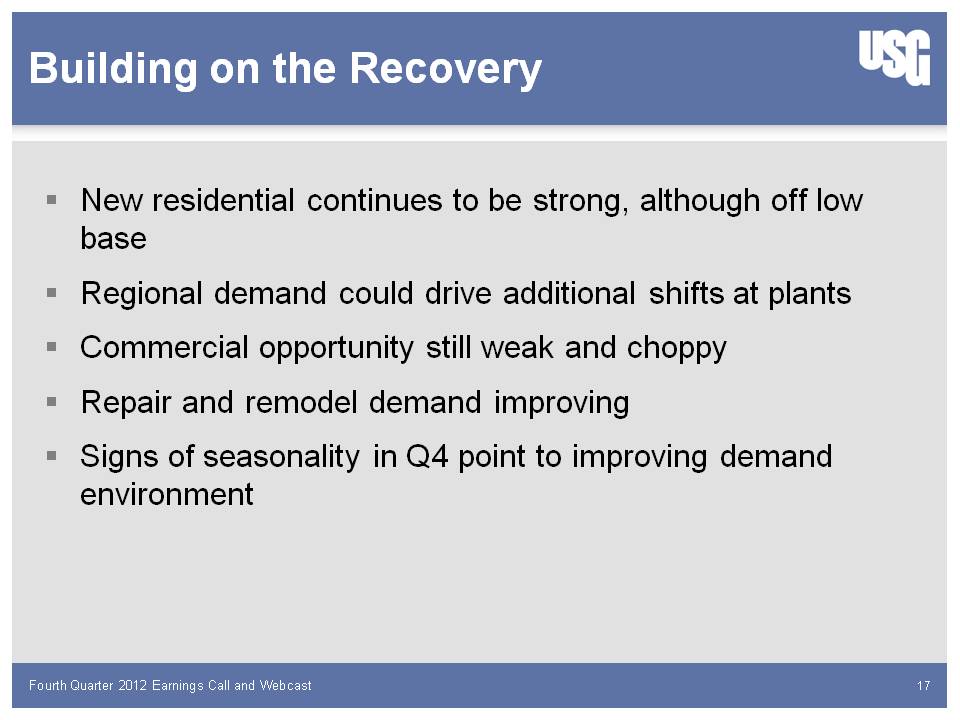
Building on the Recovery New strong residential continues to be strong, although off low base Regional demand could drive additional shifts at plants Commercial opportunity still weak and choppy Repair and remodel demand improving Signs of seasonality in Q4 point to improving demand environment Fourth Quarter 2012 Earnings Call and Webcast 17
Questions?

James S. Metcalf Chairman, President and CEO Closing Remarks