Attached files
| file | filename |
|---|---|
| 8-K - 8-K - PACIFIC PREMIER BANCORP INC | a12-28451_48k.htm |
| EX-99.1 - EX-99.1 - PACIFIC PREMIER BANCORP INC | a12-28451_4ex99d1.htm |
Exhibit 99.2
|
|
1 Common Stock Offering Investor Presentation December 5, 2012 |
|
|
2 Forward-Looking Statements and Where to Find Additional Information Forward Looking Statements This investor presentation may contain forward-looking statements regarding Pacific Premier Bancorp, Inc. (“PPBI” or the “issuer”), including its wholly owned subsidiary Pacific Premier Bank (“PPB”), First Associations Bank (“FAB”) and the proposed acquisition of FAB. You should not unduly rely on forward-looking statements. These statements involve certain risks and uncertainties that could cause actual results to differ materially from those in the forward-looking statements. Such risks and uncertainties include, but are not limited to, the following factors: adverse impacts from general economic conditions, competition, interest rate sensitivity, exposure to regulatory and legislative changes, expected cost savings, synergies and other financial benefits from the acquisition of FAB might not be realized within the expected time frames or at all; conditions to the closing of the acquisition of FAB may not be satisfied; and the shareholders of FAB may fail to approve the consummation of the acquisition. These and other factors that could cause results to differ materially from those described in the forward-looking statements can be found in our annual report on Form 10-K for the year ended December 31, 2011, our quarterly reports on Form 10-Q for the quarterly periods ended March 31, June 30 and September 30, 2012 and other filings made by PPBI with the Securities and Exchange Commission (“SEC”). Annualized, pro forma, projected and estimated numbers in this investor presentation are used for illustrative purposes only, are not forecasts and may not reflect actual results. The forward-looking statements speak only as of the date of this investor presentation, and PPBI undertakes no obligation to revise or publicly release any revision or update to these forward-looking statements to reflect events or circumstances that occur after this date. Notice to Potential Investors The issuer has filed a registration statement (including a prospectus) with the SEC for the offering to which this communication relates. Before you invest, you should read the prospectus in that registration statement and other documents the issuer has filed with the SEC for more complete information about the issuer and this offering. You may get these documents for free by visiting EDGAR on the SEC Web site at www.sec.gov or by visiting the issuer’s website at www.ppbi.com. Alternatively, the issuer, any underwriter or any dealer participating in the offering will arrange to send you the prospectus if you request it by calling Raymond James & Associates, Inc., by calling toll-free 1-877-587-7748 or by e-mailing Mark Edwards at mark.edwards@raymondjames.com. |
|
|
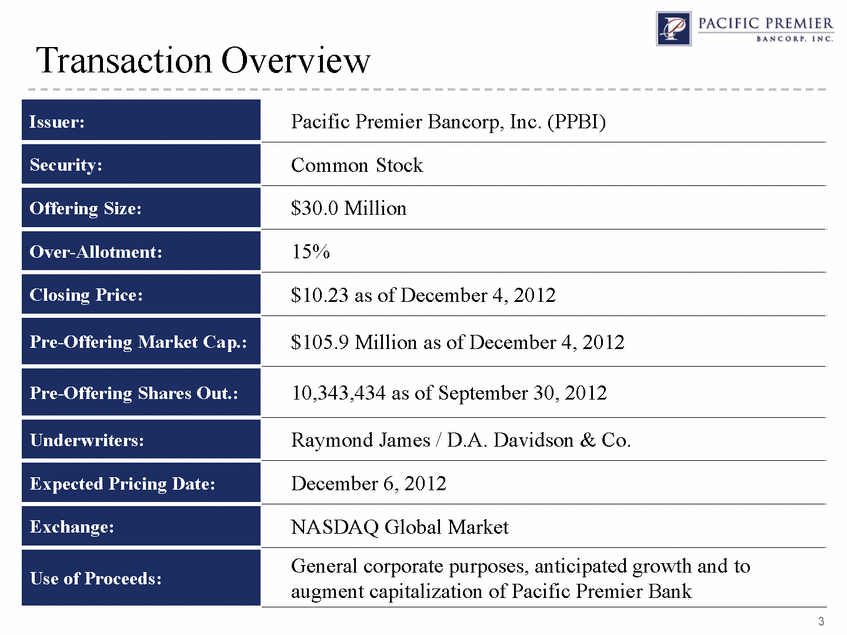
3 Transaction Overview Issuer: Pacific Premier Bancorp, Inc. (PPBI) Security: Common Stock Offering Size: $30.0 Million Over-Allotment: 15% Closing Price: $10.23 as of December 4, 2012 Pre-Offering Market Cap.: $105.9 Million as of December 4, 2012 Pre-Offering Shares Out.: 10,343,434 as of September 30, 2012 Underwriters: Raymond James / D.A. Davidson & Co. Expected Pricing Date: December 6, 2012 Exchange: NASDAQ Global Market Use of Proceeds: General corporate purposes, anticipated growth and to augment capitalization of Pacific Premier Bank |
|
|
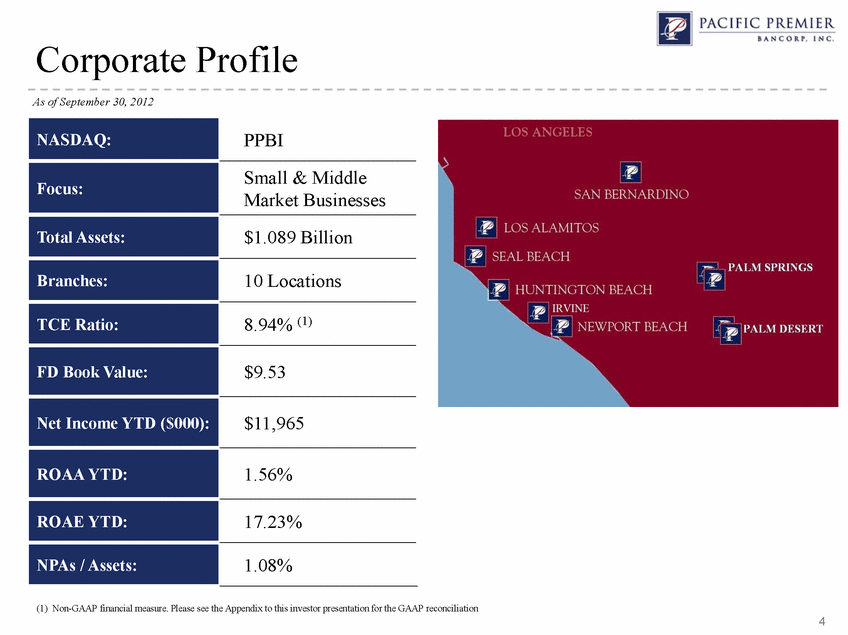
4 Corporate Profile NASDAQ: PPBI Focus: Small & Middle Market Businesses Total Assets: $1.089 Billion Branches: 10 Locations TCE Ratio: 8.94% (1) FD Book Value: $9.53 Net Income YTD ($000): $11,965 ROAA YTD: 1.56% ROAE YTD: 17.23% NPAs / Assets: 1.08% As of September 30, 2012 (1) Non-GAAP financial measure. Please see the Appendix to this investor presentation for the GAAP reconciliation |
|
|
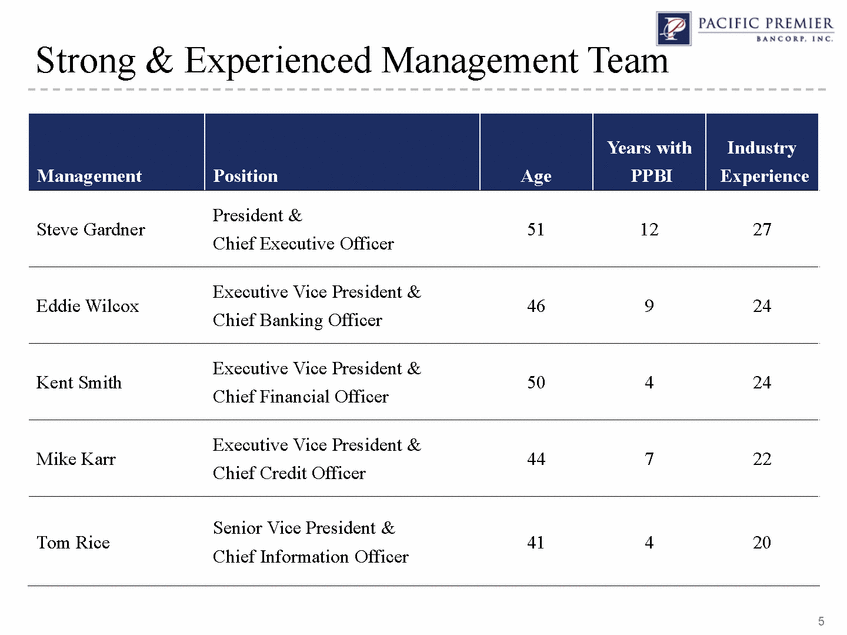
5 Strong & Experienced Management Team Management Position Age Years with PPBI Industry Experience Steve Gardner President & Chief Executive Officer 51 12 27 Eddie Wilcox Executive Vice President & Chief Banking Officer 46 9 24 Kent Smith Executive Vice President & Chief Financial Officer 50 4 24 Mike Karr Executive Vice President & Chief Credit Officer 44 7 22 Tom Rice Senior Vice President & Chief Information Officer 41 4 20 |
|
|
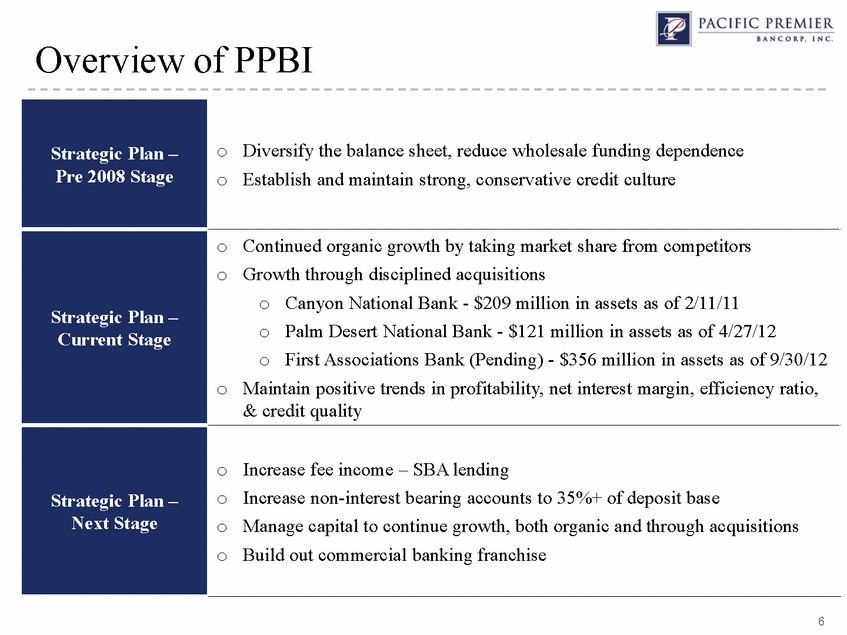
6 Overview of PPBI Strategic Plan – Pre 2008 Stage Diversify the balance sheet, reduce wholesale funding dependence Establish and maintain strong, conservative credit culture Strategic Plan – Current Stage Continued organic growth by taking market share from competitors Growth through disciplined acquisitions Canyon National Bank - $209 million in assets as of 2/11/11 Palm Desert National Bank - $121 million in assets as of 4/27/12 First Associations Bank (Pending) - $356 million in assets as of 9/30/12 Maintain positive trends in profitability, net interest margin, efficiency ratio, & credit quality Strategic Plan – Next Stage oIncrease fee income – SBA lending oIncrease non-interest bearing accounts to 35%+ of deposit base oManage capital to continue growth, both organic and through acquisitions oBuild out commercial banking franchise |
|
|
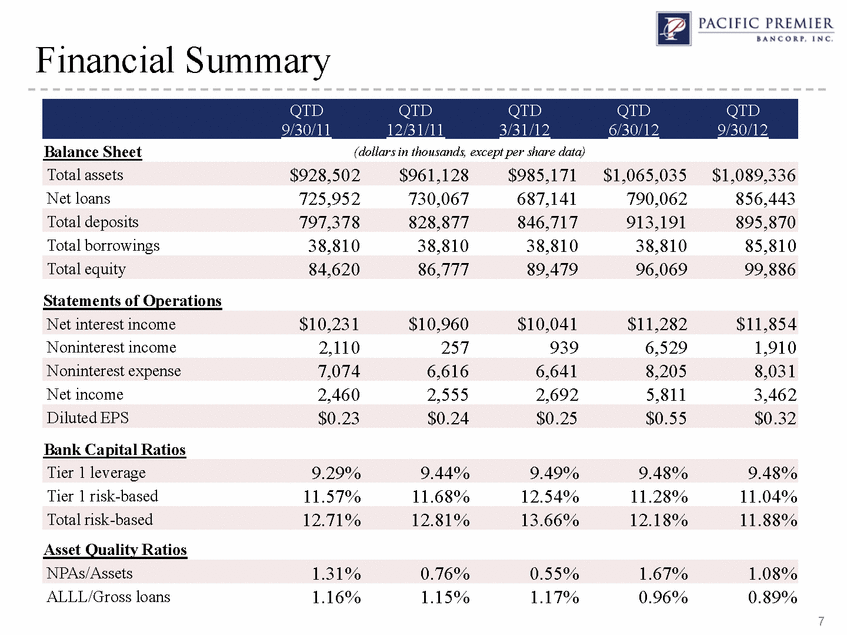
7 Financial Summary QTD 9/30/11 QTD 12/31/11 QTD 3/31/12 QTD 6/30/12 QTD 9/30/12 Balance Sheet (dollars in thousands, except per share data) Total assets $928,502 $961,128 $985,171 $1,065,035 $1,089,336 Net loans 725,952 730,067 687,141 790,062 856,443 Total deposits 797,378 828,877 846,717 913,191 895,870 Total borrowings 38,810 38,810 38,810 38,810 85,810 Total equity 84,620 86,777 89,479 96,069 99,886 Statements of Operations Net interest income $10,231 $10,960 $10,041 $11,282 $11,854 Noninterest income 2,110 257 939 6,529 1,910 Noninterest expense 7,074 6,616 6,641 8,205 8,031 Net income 2,460 2,555 2,692 5,811 3,462 Diluted EPS $0.23 $0.24 $0.25 $0.55 $0.32 Bank Capital Ratios Tier 1 leverage 9.29% 9.44% 9.49% 9.48% 9.48% Tier 1 risk-based 11.57% 11.68% 12.54% 11.28% 11.04% Total risk-based 12.71% 12.81% 13.66% 12.18% 11.88% Asset Quality Ratios NPAs/Assets 1.31% 0.76% 0.55% 1.67% 1.08% ALLL/Gross loans 1.16% 1.15% 1.17% 0.96% 0.89% |
|
|
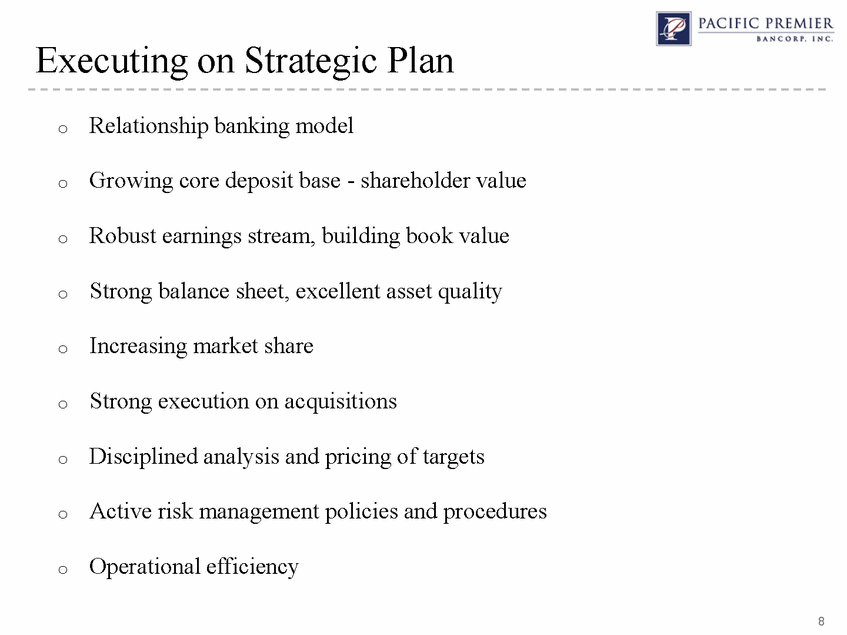
8 Executing on Strategic Plan Relationship banking model Growing core deposit base - shareholder value Robust earnings stream, building book value Strong balance sheet, excellent asset quality Increasing market share Strong execution on acquisitions Disciplined analysis and pricing of targets Active risk management policies and procedures Operational efficiency |
|
|
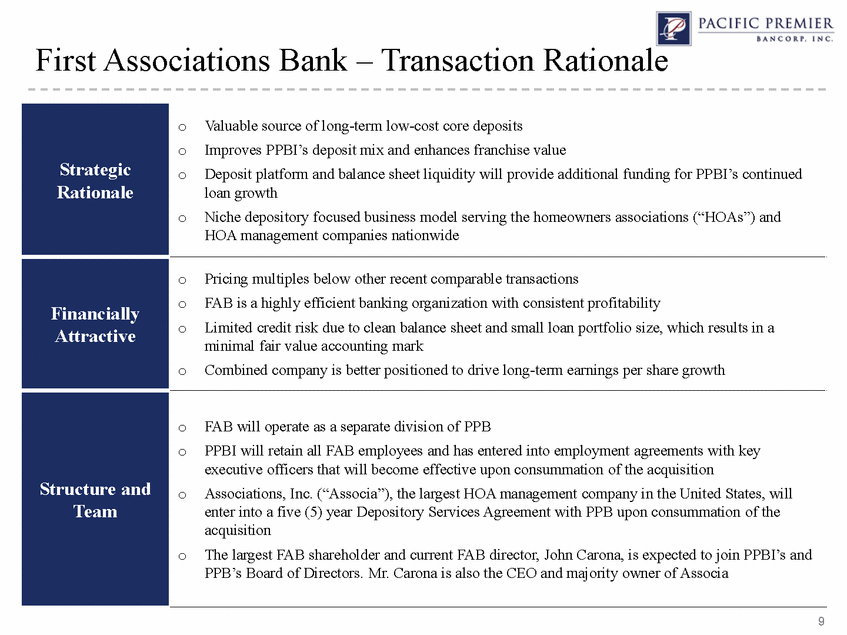
9 First Associations Bank – Transaction Rationale Strategic Rationale Valuable source of long-term low-cost core deposits Improves PPBI’s deposit mix and enhances franchise value Deposit platform and balance sheet liquidity will provide additional funding for PPBI’s continued loan growth Niche depository focused business model serving the homeowners associations (“HOAs”) and HOA management companies nationwide Financially Attractive Pricing multiples below other recent comparable transactions FAB is a highly efficient banking organization with consistent profitability oLimited credit risk due to clean balance sheet and small loan portfolio size, which results in a minimal fair value accounting mark oCombined company is better positioned to drive long-term earnings per share growth Structure and Team oFAB will operate as a separate division of PPB oPPBI will retain all FAB employees and has entered into employment agreements with key executive officers that will become effective upon consummation of the acquisition oAssociations, Inc. (“Associa”), the largest HOA management company in the United States, will enter into a five (5) year Depository Services Agreement with PPB upon consummation of the acquisition oThe largest FAB shareholder and current FAB director, John Carona, is expected to join PPBI’s and PPB’s Board of Directors. Mr. Carona is also the CEO and majority owner of Associa |
|
|
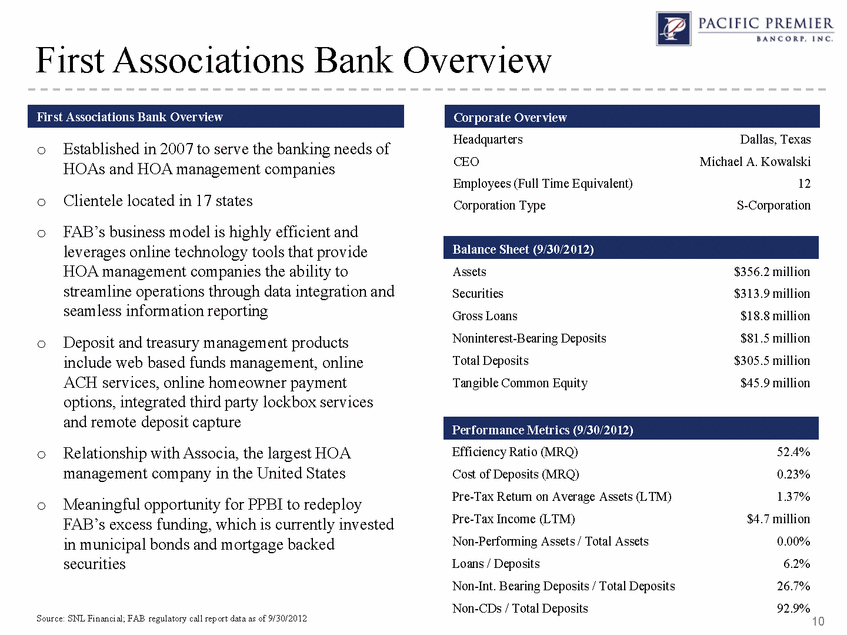
10 First Associations Bank Overview Source: SNL Financial; FAB regulatory call report data as of 9/30/2012 First Associations Bank Overview Established in 2007 to serve the banking needs of HOAs and HOA management companies Clientele located in 17 states FAB’s business model is highly efficient and leverages online technology tools that provide HOA management companies the ability to streamline operations through data integration and seamless information reporting Deposit and treasury management products include web based funds management, online ACH services, online homeowner payment options, integrated third party lockbox services and remote deposit capture oRelationship with Associa, the largest HOA management company in the United States oMeaningful opportunity for PPBI to redeploy FAB’s excess funding, which is currently invested in municipal bonds and mortgage backed securities Balance Sheet (9/30/2012) Assets $356.2 million Securities $313.9 million Gross Loans $18.8 million Noninterest-Bearing Deposits $81.5 million Total Deposits $305.5 million Tangible Common Equity $45.9 million Performance Metrics (9/30/2012) Efficiency Ratio (MRQ) 52.4% Cost of Deposits (MRQ) 0.23% Pre-Tax Return on Average Assets (LTM) 1.37% Pre-Tax Income (LTM) $4.7 million Non-Performing Assets / Total Assets 0.00% Loans / Deposits 6.2% Non-Int. Bearing Deposits / Total Deposits 26.7% Non-CDs / Total Deposits 92.9% Corporate Overview Headquarters Dallas, Texas CEO Michael A. Kowalski Employees (Full Time Equivalent) 12 Corporation Type S-Corporation |
|
|
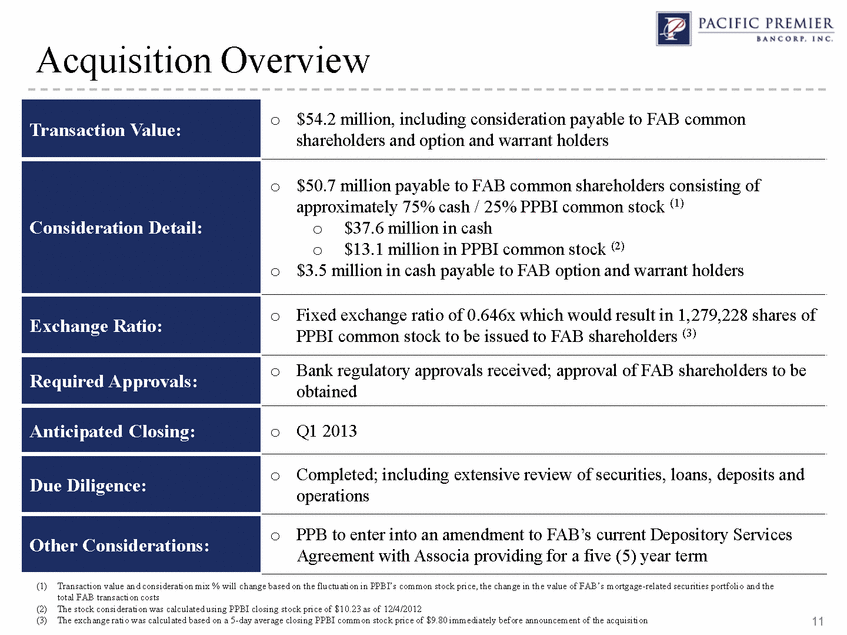
11 Acquisition Overview Transaction Value: o$54.2 million, including consideration payable to FAB common shareholders and option and warrant holders Consideration Detail: o$50.7 million payable to FAB common shareholders consisting of approximately 75% cash / 25% PPBI common stock (1) o$37.6 million in cash o$13.1 million in PPBI common stock (2) o$3.5 million in cash payable to FAB option and warrant holders Exchange Ratio: oFixed exchange ratio of 0.646x which would result in 1,279,228 shares of PPBI common stock to be issued to FAB shareholders (3) Required Approvals: oBank regulatory approvals received; approval of FAB shareholders to be obtained Anticipated Closing: oQ1 2013 Due Diligence: oCompleted; including extensive review of securities, loans, deposits and operations Other Considerations: oPPB to enter into an amendment to FAB’s current Depository Services Agreement with Associa providing for a five (5) year term (1)Transaction value and consideration mix % will change based on the fluctuation in PPBI’s common stock price, the change in the value of FAB’s mortgage-related securities portfolio and the total FAB transaction costs (2)The stock consideration was calculated using PPBI closing stock price of $10.23 as of 12/4/2012 (3)The exchange ratio was calculated based on a 5-day average closing PPBI common stock price of $9.80 immediately before announcement of the acquisition |
|
|
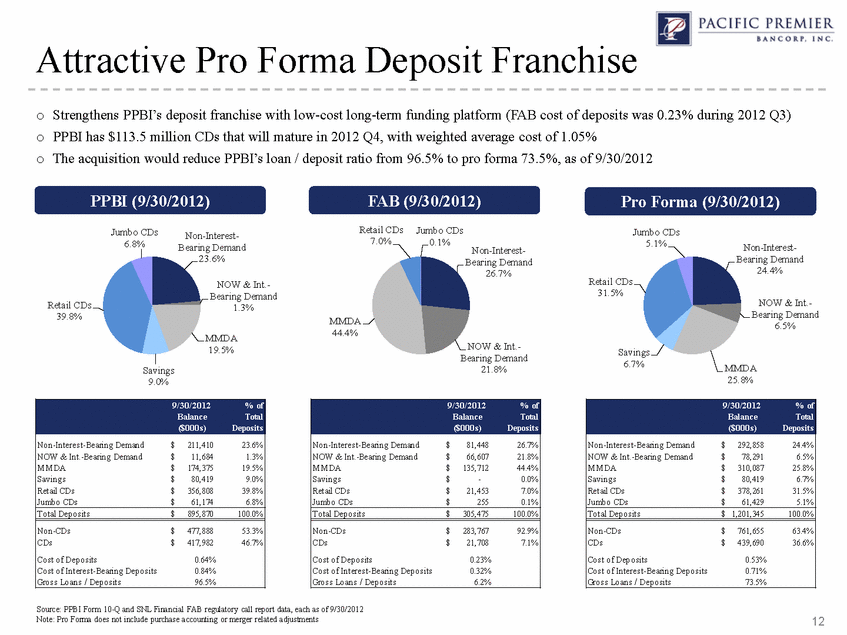
12 Attractive Pro Forma Deposit Franchise Source: PPBI Form 10-Q and SNL Financial FAB regulatory call report data, each as of 9/30/2012 Note: Pro Forma does not include purchase accounting or merger related adjustments Strengthens PPBI’s deposit franchise with low-cost long-term funding platform (FAB cost of deposits was 0.23% during 2012 Q3) PPBI has $113.5 million CDs that will mature in 2012 Q4, with weighted average cost of 1.05% The acquisition would reduce PPBI’s loan / deposit ratio from 96.5% to pro forma 73.5%, as of 9/30/2012 PPBI (9/30/2012) FAB (9/30/2012) Pro Forma (9/30/2012) 9/30/2012 % of Balance Total ($000s) Deposits Non-Interest-Bearing Demand $ 211,410 23.6% NOW & Int.-Bearing Demand $ 11,684 1.3% MMDA $ 174,375 19.5% Savings $ 80,419 9.0% Retail CDs $ 356,808 39.8% Jumbo CDs $ 61,174 6.8% Total Deposits $ 895,870 100.0% Non-CDs $ 477,888 53.3% CDs $ 417,982 46.7% Cost of Deposits 0.64% Cost of Interest-Bearing Deposits 0.84% Gross Loans / Deposits 96.5% 9/30/2012 % of Balance Total ($000s) Deposits Non-Interest-Bearing Demand $ 81,448 26.7% NOW & Int.-Bearing Demand $ 66,607 21.8% MMDA $ 135,712 44.4% Savings $ - 0.0% Retail CDs $ 21,453 7.0% Jumbo CDs $ 255 0.1% Total Deposits $ 305,475 100.0% Non-CDs $ 283,767 92.9% CDs $ 21,708 7.1% Cost of Deposits 0.23% Cost of Interest-Bearing Deposits 0.32% Gross Loans / Deposits 6.2% 9/30/2012 % of Balance Total ($000s) Deposits Non-Interest-Bearing Demand $ 292,858 24.4% NOW & Int.-Bearing Demand $ 78,291 6.5% MMDA $ 310,087 25.8% Savings $ 80,419 6.7% Retail CDs $ 378,261 31.5% Jumbo CDs $ 61,429 5.1% Total Deposits $ 1,201,345 100.0% Non-CDs $ 761,655 63.4% CDs $ 439,690 36.6% Cost of Deposits 0.53% Cost of Interest-Bearing Deposits 0.71% Gross Loans / Deposits 73.5% |
|
|
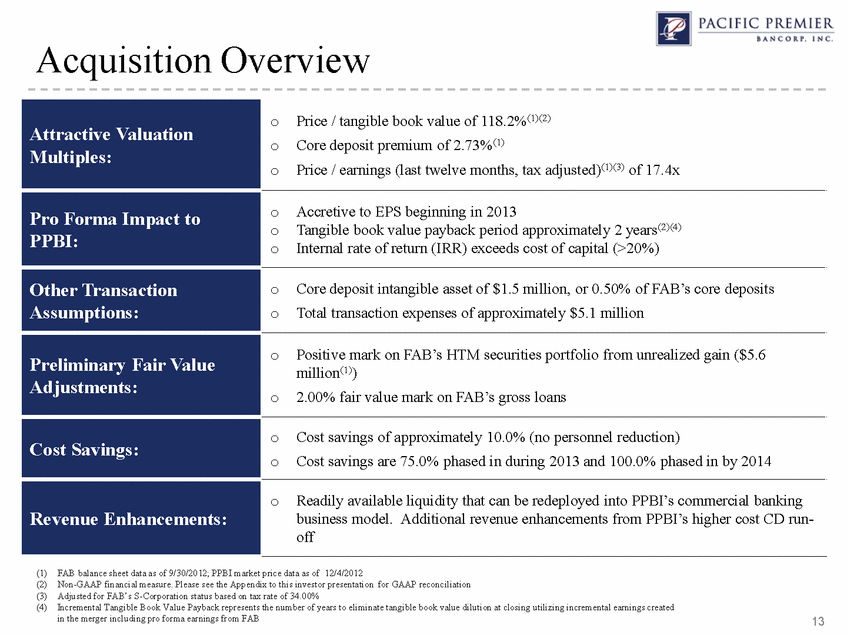
13 Acquisition Overview Attractive Valuation Multiples: oPrice / tangible book value of 118.2%(1)(2) oCore deposit premium of 2.73%(1) oPrice / earnings (last twelve months, tax adjusted)(1)(3) of 17.4x Pro Forma Impact to PPBI: oAccretive to EPS beginning in 2013 oTangible book value payback period approximately 2 years(2)(4) oInternal rate of return (IRR) exceeds cost of capital (>20%) Other Transaction Assumptions: oCore deposit intangible asset of $1.5 million, or 0.50% of FAB’s core deposits oTotal transaction expenses of approximately $5.1 million Preliminary Fair Value Adjustments: oPositive mark on FAB’s HTM securities portfolio from unrealized gain ($5.6 million(1)) o2.00% fair value mark on FAB’s gross loans Cost Savings: oCost savings of approximately 10.0% (no personnel reduction) oCost savings are 75.0% phased in during 2013 and 100.0% phased in by 2014 Revenue Enhancements: oReadily available liquidity that can be redeployed into PPBI’s commercial banking business model. Additional revenue enhancements from PPBI’s higher cost CD run- off (1)FAB balance sheet data as of 9/30/2012; PPBI market price data as of 12/4/2012 (2)Non-GAAP financial measure. Please see the Appendix to this investor presentation for GAAP reconciliation (3)Adjusted for FAB’s S-Corporation status based on tax rate of 34.00% (4)Incremental Tangible Book Value Payback represents the number of years to eliminate tangible book value dilution at closing utilizing incremental earnings created in the merger including pro forma earnings from FAB |
|
|
14 Outlook Gaining market share from competitors Building franchise value Southern California is one of the best banking markets Target rich environment for acquisitions Proven management team and track record Experienced acquirer Liquidity from FAB acquisition will fund future loan growth Well positioned to expand reach throughout Southern California |
|
|
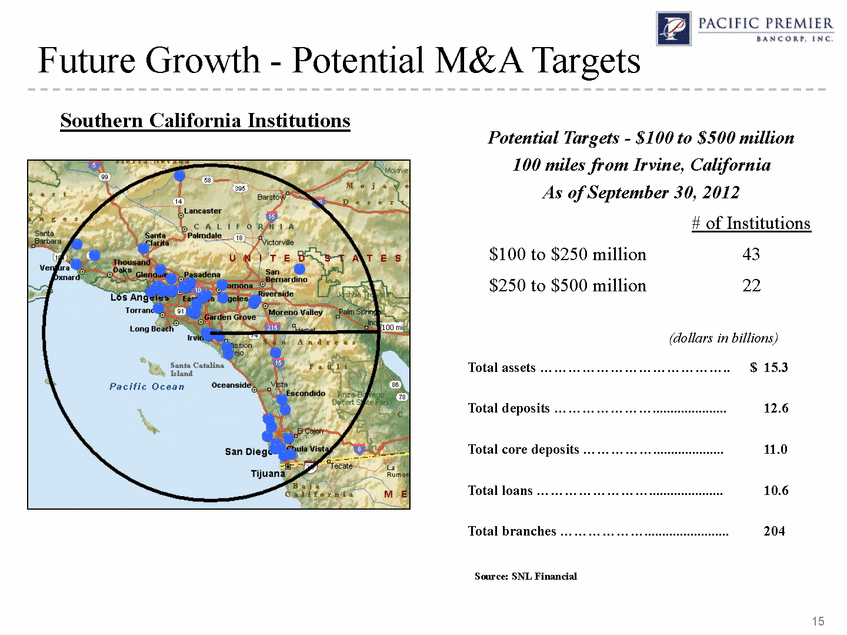
15 Future Growth - Potential M&A Targets Southern California Institutions Source: SNL Financial Total assets $ 15.3 Total deposits 12.6 Total core deposits 11.0 Total loans 10.6 Total branches 204 (dollars in billions) Potential Targets - $100 to $500 million 100 miles from Irvine, California As of September 30, 2012 # of Institutions $100 to $250 million 43 $250 to $500 million 22 |
|
|
16 Appendix |
|
|
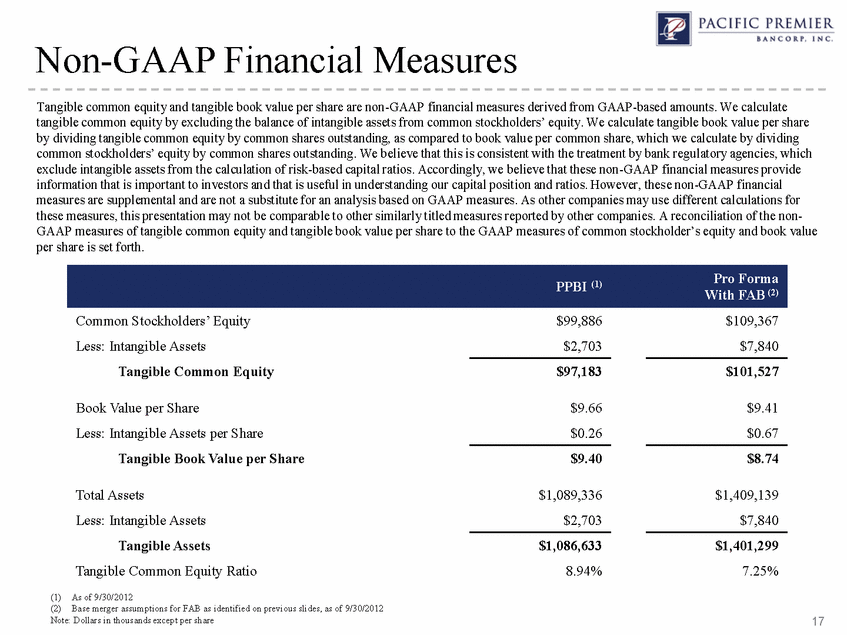
17 Non-GAAP Financial Measures Tangible common equity and tangible book value per share are non-GAAP financial measures derived from GAAP-based amounts. We calculate tangible common equity by excluding the balance of intangible assets from common stockholders’ equity. We calculate tangible book value per share by dividing tangible common equity by common shares outstanding, as compared to book value per common share, which we calculate by dividing common stockholders’ equity by common shares outstanding. We believe that this is consistent with the treatment by bank regulatory agencies, which exclude intangible assets from the calculation of risk-based capital ratios. Accordingly, we believe that these non-GAAP financial measures provide information that is important to investors and that is useful in understanding our capital position and ratios. However, these non-GAAP financial measures are supplemental and are not a substitute for an analysis based on GAAP measures. As other companies may use different calculations for these measures, this presentation may not be comparable to other similarly titled measures reported by other companies. A reconciliation of the non- GAAP measures of tangible common equity and tangible book value per share to the GAAP measures of common stockholder’s equity and book value per share is set forth. PPBI (1) Pro Forma With FAB (2) Common Stockholders’ Equity $99,886 $109,367 Less: Intangible Assets $2,703 $7,840 Tangible Common Equity $97,183 $101,527 Book Value per Share $9.66 $9.41 Less: Intangible Assets per Share $0.26 $0.67 Tangible Book Value per Share $9.40 $8.74 Total Assets $1,089,336 $1,409,139 Less: Intangible Assets $2,703 $7,840 Tangible Assets $1,086,633 $1,401,299 Tangible Common Equity Ratio 8.94% 7.25% (1)As of 9/30/2012 (2)Base merger assumptions for FAB as identified on previous slides, as of 9/30/2012 Note: Dollars in thousands except per share |