Attached files
| file | filename |
|---|---|
| EX-99.1 - PRESS RELEASE - Diamond Foods Inc | d438235dex991.htm |
| 8-K - FORM 8-K - Diamond Foods Inc | d438235d8k.htm |
 November 14, 2012
Diamond Foods Restatement and First
Three Quarters of Fiscal 2012 Earnings Call
Supplemental Materials
Exhibit 99.2 |
 1
Important Information
This presentation includes forward-looking statements, including statements
about our future financial and operating performance and results, fiscal
2012 financial results, bolstering internal controls and remediating
material weaknesses. These forward-looking statements are based on our assumptions,
expectations and projections about future events only as of the date of this
presentation, and we make such forward-looking statements pursuant to
the “safe harbor” provisions of the Private Securities Litigation
Reform Act of 1995. Many of our forward-looking statements include
discussions of trends and anticipated developments under the “Risk
Factors” and “Management’s Discussion and Analysis of Financial Condition
and Results of Operations” sections of the periodic reports that we file
with the SEC. We use the words “anticipate,”
“believe,” “estimate,” “expect,” “intend,” “plan,” “seek,” “may” and other similar expressions to
identify forward-looking statements that discuss our future expectations,
contain projections of our results of operations or financial condition or
state other “forward-looking” information. You also should carefully
consider other cautionary statements elsewhere in this presentation and in other
documents we file from time to time with the SEC. We do not undertake any
obligation to update forward-looking statements to reflect events or
circumstances occurring after the date of this presentation. Actual results may differ
materially from what we currently expect because of many risks and uncertainties,
such as: uncertainty about the need to file additional periodic
reports and financial information in connection with our restatement
disclosures; risks relating to our leverage and its effect on our ability to respond to changes in
our business, markets and industry; increase in the cost of our debt; ability to
raise additional capital and possible dilutive impact of raising such
capital; risks relating to litigation and regulatory proceedings; risks
related to our current inability to timely file
required periodic reports under the Securities Exchange Act of 1934, as amended, and any resulting delisting of Diamond’s common stock on the Nasdaq Global Select
Market; uncertainties relating to relations with growers; availability and cost
of walnuts and other raw materials; increasing competition and possible
loss of key customers; and general economic and capital markets
conditions. Diamond Foods separately reports financial results using non-GAAP financial
measures; a reconciliation of Diamond’s financial results determined in
accordance with GAAP can be found in our press release. |
 Fiscal 2010 and 2011 Restatement |
 3
Background on Restatement
•
On November 1, 2011 Diamond announced that its Audit Committee had initiated an
investigation into certain payments to walnut growers.
•
On February 8, 2012, Diamond announced that their Audit Committee concluded that
a “continuity” payment
made
to
growers
in
August
2010
of
approximately
$20
million
and
a
“momentum”
payment
made to growers in September 2011 of approximately $60 million were not accounted
for in the correct periods.
•
As a result, the Audit Committee determined that a restatement of financial
reports for fiscal 2010 and 2011 was required. In addition, the
Audit Committee identified material weaknesses in the Company’s
internal control over financial reporting. •
Since the February 2012 announcement, Diamond has undertaken a broad and thorough
restatement process.
–
A complete re-audit of entire company financials for fiscal 2010 and
2011 –
Restatement required review of quarterly walnut cost estimates across fiscal
2010 and 2011 •
Material
weaknesses
were
identified
in
three
areas:
control
environment;
walnut
grower
accounting;
accounts payable and accrued expenses. Diamond has taken actions to correct
material weaknesses. –
For
a
complete
discussion
of
material
weaknesses
and
remediation
steps
see
Item
9A
–
Management’s Report on Internal Control Over Financial Reporting in the
10-K/A filed on November 14, 2012. |
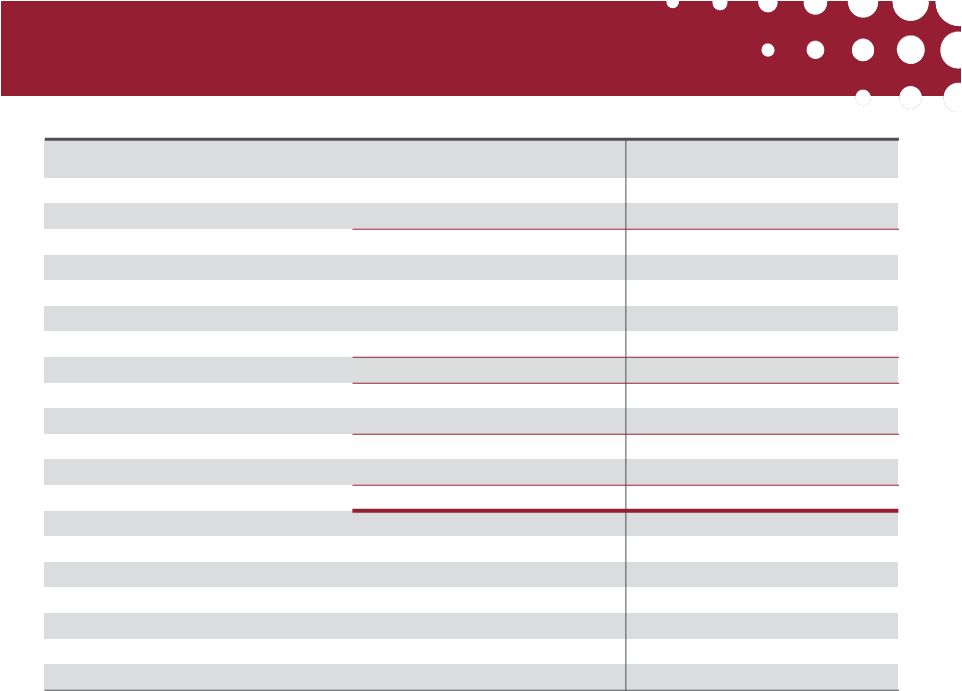
 4
Where to Find Restated Financial Information (I)
Period Restated
Filing
Full Year Fiscal 2011,
and 4
th
quarter
2011 Form 10-K/A (the “10-K/A”). Consolidated balance sheet, statement of operations and
statement of cash flows for the years ended July 31, 2010 and July 31, 2011,
reflecting effects of the restatement are provided in Note 15 to the
consolidated financial statements contained in the 10-K/A.
Selected, unaudited quarterly information for each quarterly period in fiscal
2011 is provided in
Note
16
to
the
consolidated
financial
statements
contained
in
the 10-K/A.
Fiscal 2011,
3
rd
quarter
2012
10-Q
for
3
rd
quarter,
reporting
results
for
that
period
and
restated
results
for
the
comparable period in fiscal 2011.
Selected, unaudited quarterly information for each quarterly period in fiscal
2011 is provided in
Note
16
to
the
consolidated
financial
statements
contained
in
the 10-K/A.
Fiscal 2011,
2
nd
quarter
2012
10-Q
for
2
nd
quarter,
reporting
results
for
that
period
and
restated
results
for
the
comparable period in fiscal 2011.
Selected, unaudited quarterly information for each quarterly period in fiscal
2011 is provided in
Note
16
to
the
consolidated
financial
statements
contained
in
the 10-K/A.
Fiscal 2011,
1
st
quarter
2012
10-Q
for
1
st
quarter,
reporting
results
for
that
period
and
restated
results
for
the
comparable period in fiscal 2011.
Selected, unaudited quarterly information for each quarterly period in fiscal
2011 is provided in
Note
16
to
the
consolidated
financial
statements
contained
in
the 10-K/A.
Please refer to our full periodic reports for complete information
|
 5
Where to Find Restated Financial Information (II)
Period Restated
Filing
Full year fiscal 2010, and
4
quarter
10-K/A. Consolidated balance sheet, statement of operations and
statement of cash flows for the years ended July 31, 2010 and July 31, 2011,
reflecting
effects
of
the
restatement
are
provided
in
Note
15
to
the
consolidated financial statements contained in the 10-K/A.
Selected, unaudited quarterly information for each quarterly period in
fiscal
2010
is
provided
in
Note
16
to
the
consolidated
financial
statements
contained in the 10-K/A.
Fiscal 2010, 3
quarter
Selected, unaudited quarterly information for each quarterly period in
fiscal
2010
is
provided
in
Note
16
to
the
consolidated
financial
statements
contained in the 10-K/A.
Fiscal 2010, 2
quarter
Selected, unaudited quarterly information for each quarterly period in
fiscal
2010
is
provided
in
Note
16
to
the
consolidated
financial
statements
contained in the 10-K/A.
Please refer to our full periodic reports for complete information
Note: 1
quarter
of fiscal 2010 did not require restatement
th
rd
nd
st |
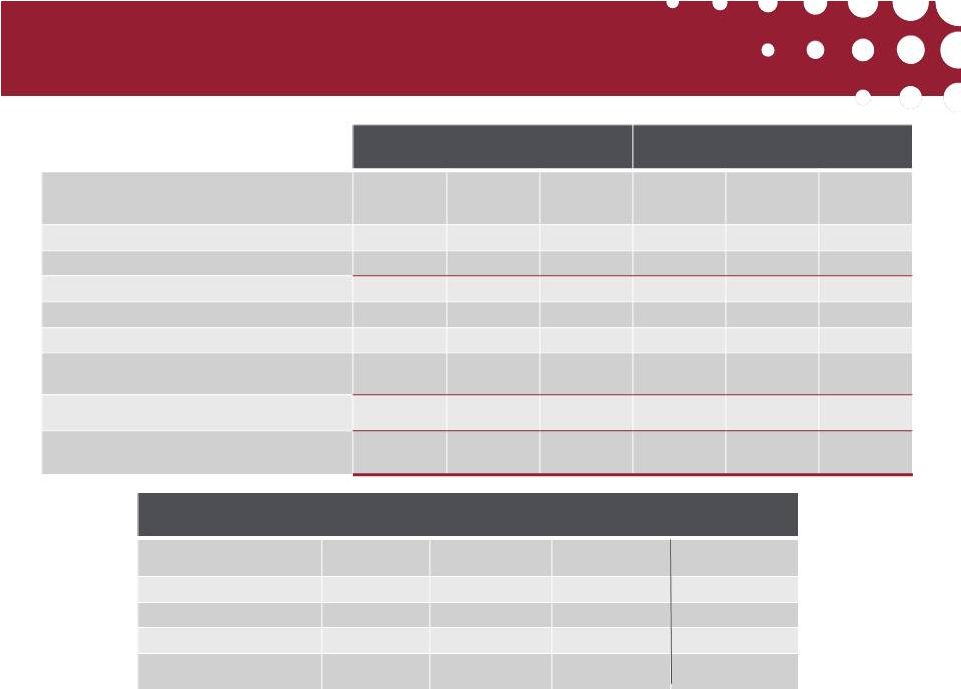
 6
Summary of Restatement Impacts on
2010 and 2011 Income
($ millions)
Twelve Months ended July 31
2011
2010
Restatement Item
Revenue
Cost
Net
Revenue
Cost
Net
Walnut payments
-
+$35.6
-$35.6
-
+$18.3
-$18.3
Timing of expense recognition
-
+$5.0
-$5.0
-
+$0.1
-$0.1
Other items
+$0.8
-$0.4
+$1.2
+$2.2
+$0.8
+$1.4
Tax Impact
-
-$15.8
+$15.8
-
-$6.5
+$6.5
Total Impact
+$0.8
+$24.4
-$23.6
+$2.2
+$12.7
-$10.5 |
 7
Twelve Months
ended July 31
(Restated)
Twelve Months
ended July 31
(Previously Reported)
2011
2010
2011
2010
Gross Margin
22.4%
21.2%
26.0%
23.7%
Adjusted EBIT Margin*
8.4%
7.5%
12.1%
10.0%
Adjusted EBITDA Margin**
11.5%
10.0%
15.1%
12.5%
Fiscal 2010 and 2011 Key Financial Ratios
*Non-GAAP, adjusted EBIT is defined as net income before interest expense,
income taxes, stock-based compensation, acquisition and integration
expenses, costs associated with audit committee restatement and certain SG&A costs.
**Non-GAAP, adjusted EBITDA is defined as net income before interest expense,
income taxes, stock-based compensation, depreciation,
amortization, acquisition and integration expenses, costs associated with
audit committee restatement and certain SG&A costs. |
 8
Organizational Changes to Bolster
Controls and Oversight
•
New executive leadership
–
Appointed food and beverage industry veteran Brian Driscoll, President and
CEO •
New leadership in finance organization
–
Hired Mark Hair, SVP Finance and Controller
o
10 years with Deloitte and 7 years in forensic accounting with
StoneTurn
Group LLP
•
Strengthened Board of Directors
–
Added five experienced Board members including two new members of the audit
committee
o
Alison Davis, former CFO of Barclays Global Investors and 16 years in consulting
with A.T. Kearney and McKinsey (Audit Committee)
o
Nigel Rees, VP and Controller of McKesson Corporation (Audit Committee)
o
R. Dean Hollis, former President and COO ConAgra Consumer Foods and
International Division and Oaktree Advisor
o
Matt Wilson, Oaktree Managing Director
o
Bill
Tos, Walnut Grower
–
Separated Chairman and CEO roles |
 First Three Quarters of Fiscal 2012 and
Fiscal 2011 (Restated) |
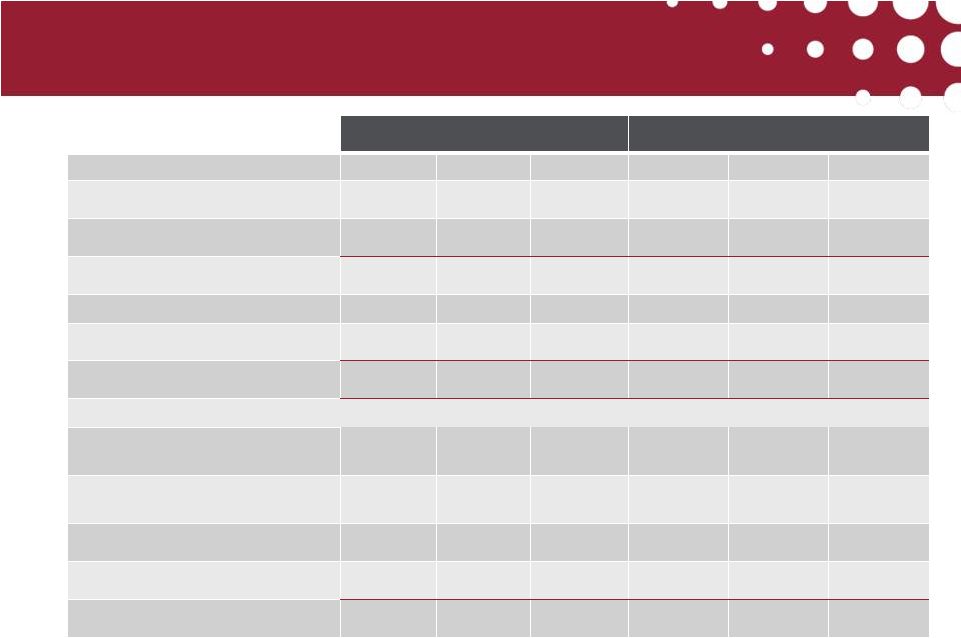
 10
2012 and Restated 2011
Net Sales by Product Line
FY 2012
FY 2011 (Restated)
($ thousands)
Q1
Q2
Q3
Q1
Q2
Q3
Snack
$ 157,122
$ 141,818
147,653
$ 137,056
$ 134,183
$
134,799
and Retail In-
98,112
94,677
49,127
90,190
80,711
46,983
Retail
International Non-
American Ingredient/Food Service/Other
Retail
Total Net Sales
$
Culinary
shell
Total
255,234
236,495
196,780
227,246
214,894
181,782
Retail
21,444
21,025
4,174
21,015
36,793
31,368
North
10,715
4,831
6,731
3,800
5,157
9,916
Total
Non-
32,159
25,856
10,905
24,815
41,950
41,284
$287,393
$262,351
$207,685
$252,061
$256,844
$223,066
Year-
over-
Year
Comparison
(% change)
Q1
Q2
Q3
Q3
YTD
Snack
14.6%
5.7%
9.5%
10.0%
Culinary
and Retail In-
shell
8.8%
17.3%
4.6%
11.0%
Total
Non-
Retail
29.6%
38.4%
73.6%
-36.2%
Total Net Sales
14.0%
2.1%
6.9%
3.5%
-
-
- |
 11
Three Quarters
ended April 30th
(Restated)
2012
2011*
Gross Margin
18.2%
22.9%
Adjusted EBIT Margin**
4.8%
9.2%
Adjusted EBITDA Margin***
7.8%
12.2%
First Three Quarters of Fiscal 2012 and 2011
Key Financial Ratios
*Restated
**Non-GAAP, adjusted EBIT is defined as net income before interest expense,
income taxes, stock-based compensation, acquisition and integration
expenses, costs associated with audit committee restatement and certain SG&A costs.
***Non-GAAP, adjusted EBITDA is defined as net income before interest
expense, income taxes, stock-based compensation, depreciation,
amortization, acquisition and integration expenses, costs associated with
audit committee restatement and certain SG&A costs. |
 12
2012 and Restated 2011
Quarterly Income Statement
12
($ thousands, except per share numbers)
Q1
Q2
Q3
Q1
Q2
Q3
Net sales
$287,393
$262,351
$207,685
$252,061
$256,844
Cost of sales
226,086
220,429
173,457
195,953
197,866
170,576
Gross profit
61,307
41,922
34,228
56,108
58,978
52,490
Operating expenses:
Selling, general and administrative
29,455
34,304
33,260
23,289
24,052
24,229
Advertising
12,716
11,638
7,200
12,469
10,170
11,723
Acquisition and integration related expenses
17,214
12,091
11,336
579
1,023
5,946
Total operating expenses
59,385
58,033
51,796
36,337
35,245
41,898
Income (Loss) from operations
1,922
(16,111)
(17,568 )
19,771
23,733
10,592
Interest expense, net
5,761
6,471
7,701
6,117
5,992
5,941
Income (Loss) before income taxes
(3,839)
(22,582)
(25,269)
13,654
17,741
4,651
Income taxes (Benefit)
(14,640)
(2,398)
18,748
4,372
6,643
1,300
Net income (Loss)
$10,801
($20,184)
($44,017)
$9,282
$11,098
Earnings (loss) per share:
Basic
$0.49
($0.93)
($2.02)
$0.42
$0.51
$0.15
Diluted
$0.47
($0.93)
($2.02)
$0.42
$0.49
$0.15
Shares used to compute earnings per share:
Basic
21,668
21,724
21,752
21,489
21,565
21,604
Diluted
22,567
21,724
21,752
21,933
22,212
22,332
Dividends declared per share
$0.045
$0.045
$
-
$0.045
$0.045
$0.045
FY 2012
FY 2011 (Restated)
$223,066
$ 3,351 |
 13
Quarterly Adjusted EBITDA
Fiscal 2012
Fiscal 2011 (Restated)
($ thousands)
Q1
Q2
Q3
Q1
Q2
Q3
Net income (loss)
$10,801
($20,184)
($44,017)
$9,282
$11,098
$3,351
Income taxes (benefit)
(14,640)
(2,398)
18,748
4,372
6,643
1,300
Income (loss) before income taxes
(3,839)
(22,582)
(25,269)
13,654
17,741
4,651
Other expense, net
-
-
-
-
-
-
Interest expense, net
5,761
6,471
7,701
6,117
5,992
5,941
Income (loss) from operations
1,922
(16,111)
(17,568)
19,771
23,733
10,592
Acquisition and integration related
expenses
17,214
12,091
11,336
579
1,023
5,946
Certain selling, general and
administrative costs
2,016
10,710
7,863
-
-
-
Stock-based compensation expense
1,902
2,949
2,291
1,772
2,104
1,739
Depreciation and amortization
7,180
7,353
7,702
7,472
7,506
7,321
Adjusted EBITDA
$30,234
$16,992
$11,624
$29,594
$34,366
$25,598
1
Non-GAAP, adjusted EBITDA is defined as income before interest expense,
income taxes, stock-based compensation, depreciation,
amortization, acquisition and integration expenses, costs associated with
audit committee restatement and certain SG&A costs. |
 14
Expense Adjustments in
First Three Quarters of Fiscal 2012
$ millions
Fiscal 2012
Description of Expense
Q1
Q2
Q3
Q3
YTD
Acquisition
and
integration
related
expenses
1
$17.2
$12.1
$11.3
$40.6
Audit committee investigation, restatement
and related expenses
2
0.2
10.7
5.7
16.6
Other expenses
3
1.8
-
2.6
4.4
Subtotal
2.0
10.7
8.3
21.0
Forbearance costs
4
-
-
1.0
1.0
TOTAL
$19.2
$22.8
$20.6
$62.6
1
Pringles and Kettle related
2
Included in SG&A in the financial statements; includes certain audit,
consulting, and legal fees 3
Included in SG&A in the financial statements; includes certain legal costs,
cash and stock based retention bonuses, severance, and other related
costs 4
Included in interest expense in the financial statements
14 |
 15
Reconciliation of Income to Non-GAAP EPS
* Includes shares associated with participating securities
Fiscal 2012
Fiscal 2011 (Restated)
($ thousands, except per share amounts)
Q1
Q2
Q3
Q1
Q2
Q3
GAAP income
(loss)before income taxes
($3,839)
($22,582)
($25,269)
$13,654
$17,741
$4,651
Adjustments to exclude acquisition
and
integration related expenses
17,214
12,091
11,336
579
1,023
5,946
Adjustments to exclude certain
SG&A costs
2,016
10,710
8,309
-
-
-
Adjustments to exclude forbearance fee
-
-
1,006
-
-
-
Non
-GAAP income (loss) before income taxes
15,391
219
(4,618)
14,233
18,764
10,597
GAAP income taxes / (benefit)
(14,640)
(2,398)
18,748
4,372
6,643
1,300
Tax effect of Non-GAAP adjustments
13,686
2,384
(18,462)
(1,651)
(3,055)
1,284
Non
-GAAP income taxes / (benefit)
(954)
(14)
286
2,721
3,588
2,584
Non
-GAAP net income (loss)
$16,345
$233
($4,904)
$11,512
$15,176
$8,013
Non
-GAAP EPS-diluted
$0.71
$0.01
($0.22)
$0.52
$0.67
$0.35
Shares used in computing
Non
-GAAP EPS-diluted *
22,932
22,056
22,108
22,343
22,622
22,726 |
 16
Key Drivers of Financial Performance in
First Three Quarters of Fiscal 2012
•
Significant decline in walnut crop receipts led to a 36 percent decrease in
non-retail revenue in the first three quarters of fiscal 2012, which
contributed to a substantial drop in gross margin for the company between
fiscal 2011 and fiscal 2012. –
Plants operating below capacity
•
Increase in average walnut cost per pound in excess of 50 percent led to gross
margin compression as price increases lagged commodity cost rises.
•
Additional pressure on other commodities (e.g. pecans, peanuts, cashews, oil)
also impacted snack portfolio.
•
Emerald and Kettle experienced high levels of promotional spending.
•
Emerald SKU proliferation drove high operating costs in plants.
•
Gross margin also impacted by high manufacturing/supply chain operating costs
due to nut product line complexity and excess capacity in nut and Kettle
U.S. facilities. |
 17
Guidance for Full-Year Fiscal 2012
•
Net sales expected to be between $975 and $980 million
•
Snack sales expected to be between $600 and $605 million
•
Culinary sales expected to be between $290 and $295 million
•
Gross margin expected to be between 18.0% to 18.5%
•
Adjusted EBITDA expected to be between $78 and $81 million
|