Attached files
| file | filename |
|---|---|
| 8-K - USG CORP. 8-K - USG CORP | a50445341.htm |
| EX-99.1 - EXHIBIT 99.1 - USG CORP | a50445341ex99_1.htm |
Exhibit 99.2
USG Corporation Third Quarter 2012 Earnings Conference Call and Webcast October 18, 2012
Forward-Looking Statements This presentation contains forward-looking statements within the meaning of the Private Securities Litigation Reform Act of 1995 related to management’s expectations about future conditions. Actual business, market management s or other conditions may differ from management’s expectations and, accordingly, may affect our sales and profitability or other results and liquidity. Actual results may differ due to various other factors, including: economic conditions, such as the levels of new home and other construction activity, employment levels, the availability of mortgage, construction and other financing, mortgage and other interest rates, housing affordability and supply, the levels of foreclosures and home resales, currency exchange rates and consumer confidence; capital markets conditions and the availability of borrowings under our credit agreement or other financings; competitive conditions, such as price, service and product competition; shortages in raw materials; changes in raw material, energy, transportation and employee benefit costs; the loss of one or more major customers and our customers’ ability to meet their financial obligations to us; capacity utilization rates for us and the industry; changes in laws or regulations including environmental and regulations, safety regulations; the outcome in contested litigation matters; our ability to complete surplus asset sales and other divestitures; the effects of acts of terrorism or war upon domestic and international economies and financial markets; and acts of God. We assume no obligation to update any forward-looking information contained in this presentation. Third Quarter 2012 Earnings Call and Webcast 2
USG Corporation Third Quarter 2012 Agenda Overview James S. Metcalf Chairman, President and CEO Financial Results Matthew F. Hilzinger Executive VP, Chief Financial Officer Looking to 2013 James S. Metcalf Chairman, President and CEO Questions Closing Remarks James S. Metcalf Chairman, President and CEO Third Quarter 2012 Earnings Call and Webcast 3
James S. Metcalf Chairman, President and CEO
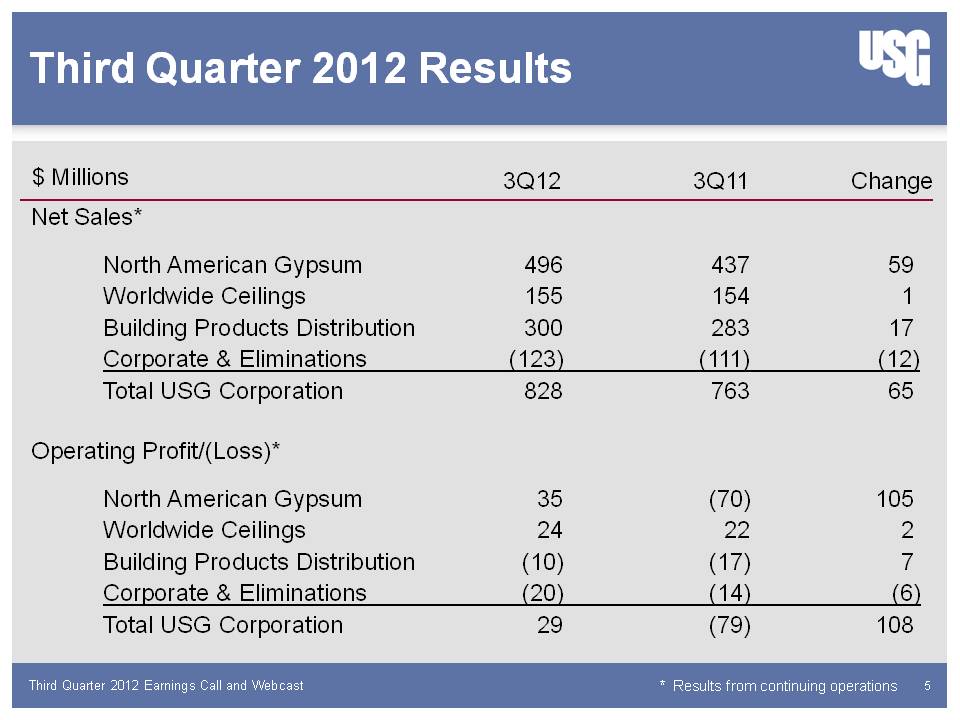
Third Quarter 2012 Results $ Millions 3Q12 3Q11 Change Net Sales* North American Gypsum 496 437 59 Worldwide Ceilings 155 154 1 Building Products Distribution 300 283 17 Corporate & Eliminations (123) (111) (12) Total USG Corporation 828 763 65 Operating Profit/(Loss)* North American Gypsum 35 (70) 105 Worldwide Ceilings 24 22 2 Building Products Distribution (10) (17) 7 Corporate & Eliminations (20) (14) (6) Total USG Corporation 29 (79) 108 * Results from continuing operations Third Quarter 2012 Earnings Call and Webcast 5
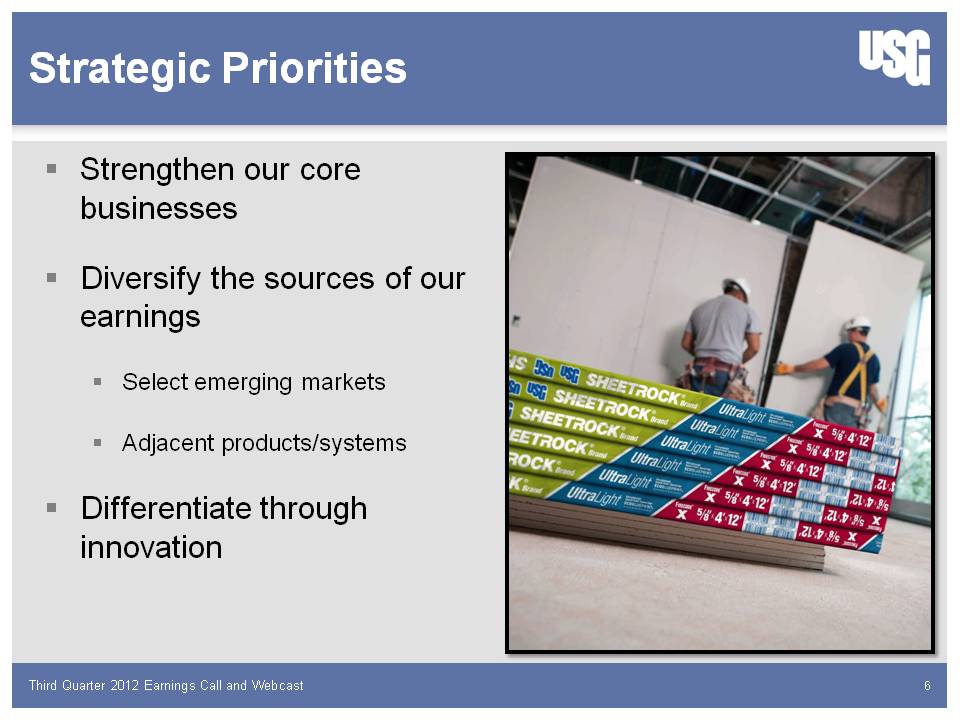
Strategic Priorities Strengthen our core businesses Diversify the sources of our earnings Select emerging markets Adjacent products/systems Differentiate through innovation Third Quarter 2012 Earnings Call and Webcast 6
Matthew F. Hilzinger Executive VP, Chief Financial Officer Financial Results
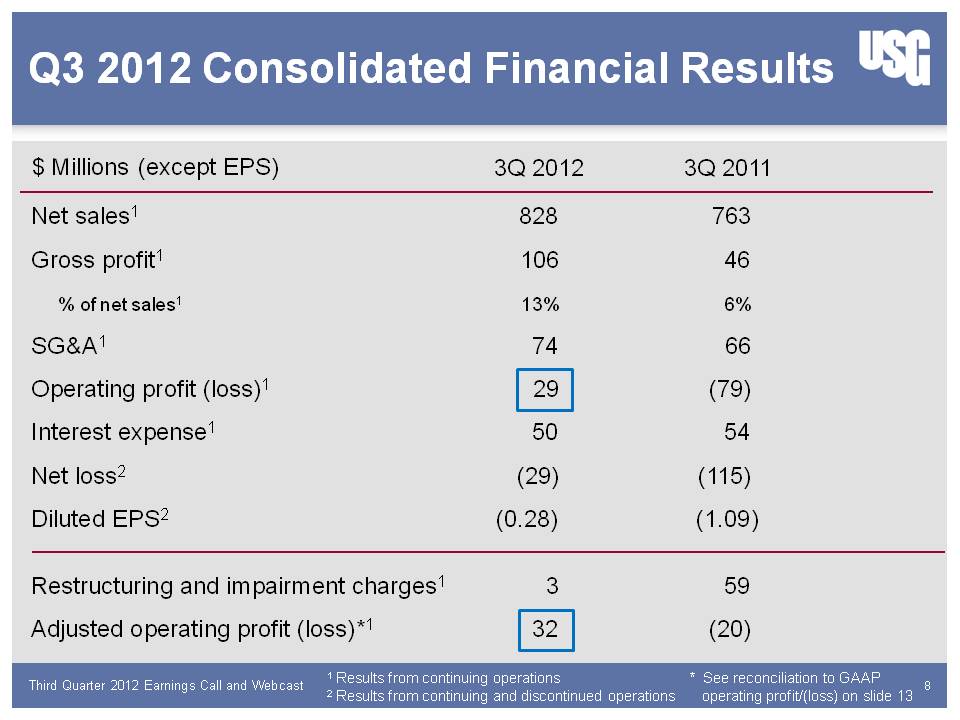
Q3 2012 Consolidated Financial Results $ Millions (except EPS) 3Q 2012 3Q 2011 Net sales1 828 763 Gross profit1 106 46 % of net sales1 13% 6% SG&A1 74 66 Operating profit (loss)1 29 (79) Interest expense1 50 54 Net loss2 (29) (115) Diluted EPS2 (0.28) (1.09) Restructuring and impairment charges1 3 59 Adjusted operating profit (loss)*1 32 (20) 1 Results from continuing operations 2 Results from continuing and discontinued operations * See reconciliation to GAAP operating profit/(loss) on slide 13 Third Quarter 2012 Earnings Call and Webcast 8
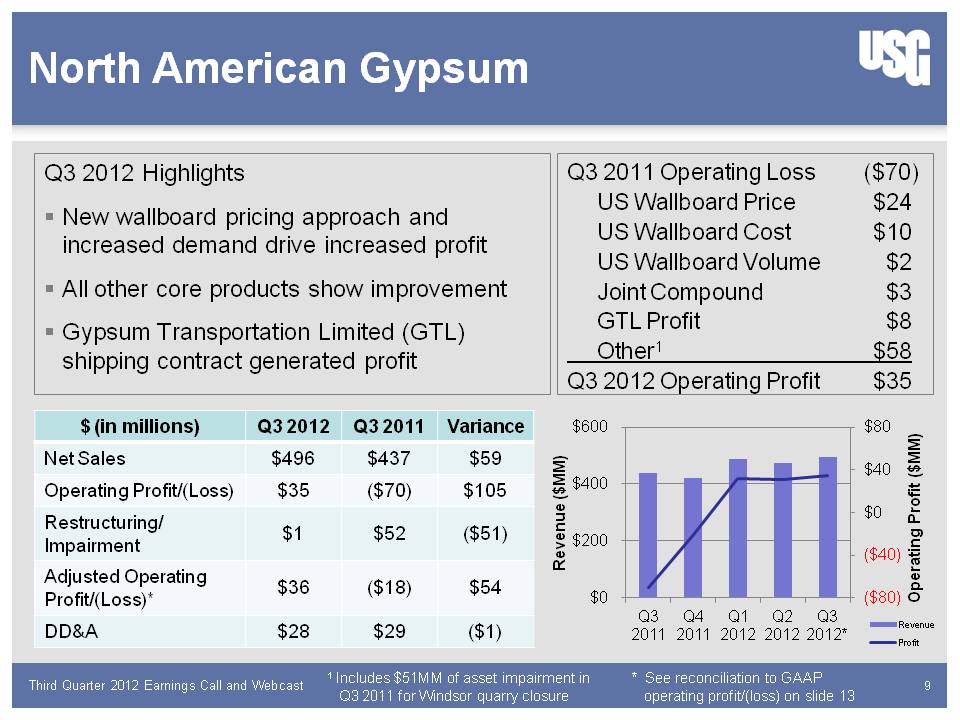
North American Gypsum Q3 2012 Highlights New wallboard pricing approach and increased demand drive increased profit All other core products show improvement Gypsum Transportation Limited (GTL) shipping contract generated profit Q3 2011 Operating Loss ($70) US Wallboard Price $24 US Wallboard Cost $10 US Wallboard Volume $2 Joint Compound $3 GTL Profit $8 Other1 $58 Q3 2012 Operating Profit $35 $ (in millions) Q3 2012 Q3 2011 Variance Net Sales $496 $437 $59 Operating Profit/(Loss) $35 ($70) $105 Restructuring/Impairment $1 $52 ($51) Adjusted Operating Profit/(Loss)* $36 ($18) $54 DD&A $28 $29 ($1) Revenue ($MM) Operating Profit ($MM) $600 $400 $200 $0 $80 $40 $0 ($40) ($80) Q3 2011 Q4 2011 Q1 2012 Q2 2012 Q3 2012* Revenue Profit 1 Includes $51MM of asset impairment in Q3 2011 for Windsor quarry closure * See reconciliation to GAAP operating profit/(loss) on slide 13 Third Quarter 2012 Earnings Call and Webcast 9
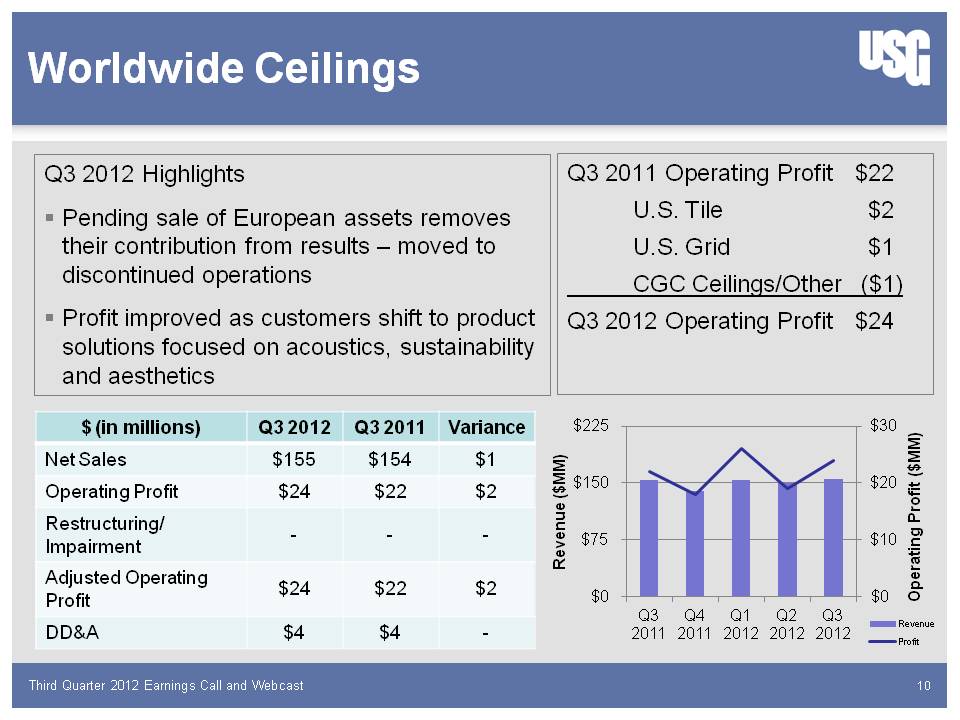
Worldwide Ceilings Q3 2012 Highlights Pending sale of European assets removes their contribution from results – moved to discontinued operations Profit improved as customers shift to product solutions focused on acoustics, sustainability and aesthetics Q3 2011 Operating Profit $22 U.S. Tile $2 U.S. Grid $1 CGC Ceilings/Other ($1) Q3 2012 Operating Profit $24 $ (in millions) Q3 2012 Q3 2011 Variance Net Sales $155 $154 $1 Operating Profit $24 $22 $2 Restructuring/Impairment - - - Adjusted Operating Profit $24 $22 $2 DD&A $4 $4 - Revenue ($MM) Operating Profit ($MM) $225 $150 $75 $0 $30 $20 $10 $0 Q3 2011 Q4 2011 Q1 2012 Q2 2012 Q3 2012 Revenue Profit Third Quarter 2012 Earnings Call and Webcast 10
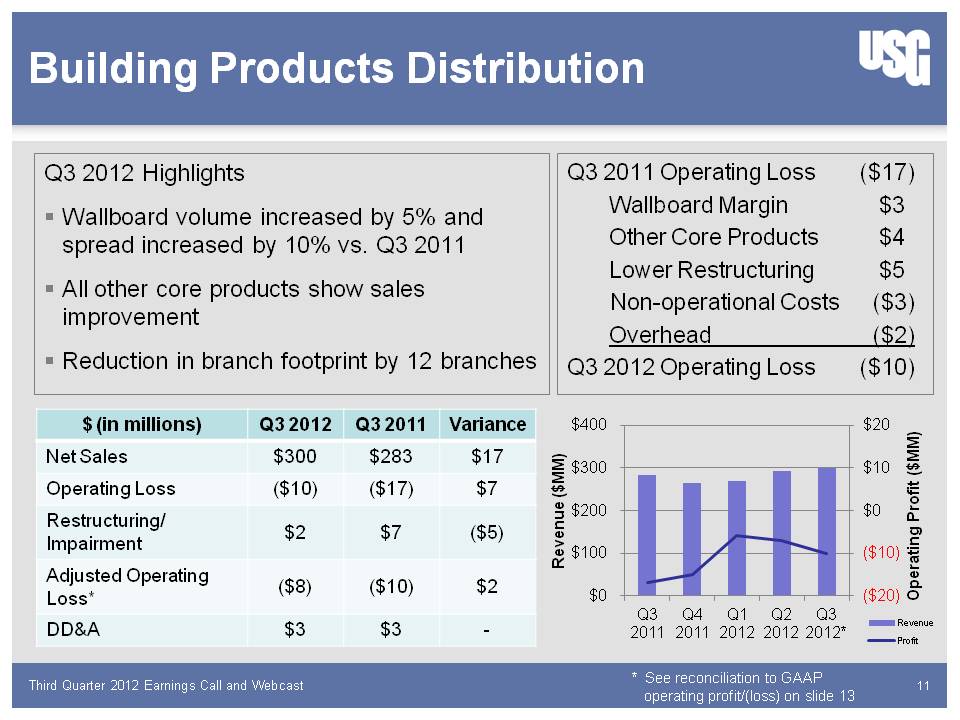
Building Products Distribution Q3 2012 Highlights Wallboard volume increased by 5% and spread increased by 10% vs. Q3 2011 All other core products show sales improvement Reduction in branch footprint by 12 branches Q3 2011 Operating Loss ($17) Wallboard Margin $3 Other Core Products $4 Lower Restructuring $5 Non-operational Costs ($3) Overhead ($2) Q3 2012 Operating Loss ($10) $ (in millions) Q3 2012 Q3 2011 Variance Net Sales $300 $283 $17 Operating Loss ($10) ($17) $7 Restructuring/Impairment $2 $7 ($5) Adjusted Operating Loss* ($8) ($10) $2 DD&A $3 $3 - Revenue ($MM) Operating Profit ($MM) $400 $300 $200 $100 $0 $20 $10 $0 ($10) ($20) Q3 2011 Q4 2011 Q1 2012 Q2 2012 Q3 2012* Revenue Profit * See reconciliation to GAAP operating profit/(loss) on slide 13 Third Quarter 2012 Earnings Call and Webcast 11
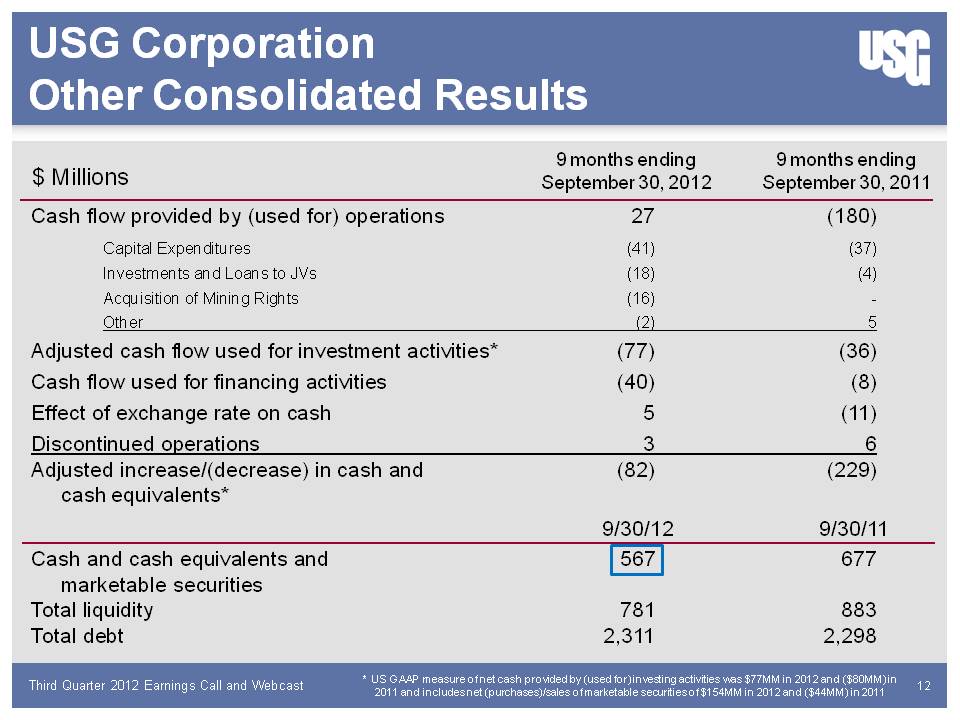
USG Corporation Other Consolidated Results $ Millions 9 months ending September 30, 2011 9 months ending September 30, 2012 Cash flow provided by (used for) operations 27 (180) Capital Expenditures (41) (37) Investments and Loans to JVs (18) (4) Acquisition of Mining Rights (16) - Other (2) 5 Adjusted cash flow used for investment activities* (77) (36) Cash flow used for financing activities (40) (8) Effect of exchange rate on cash 5 (11) Discontinued operations 3 6 Adjusted increase/(decrease) in cash and cash equivalents* (82) (229) 9/30/12 9/30/11 Cash and cash equivalents and marketable securities 567 677 Total liquidity 781 883 Total debt 2,311 2,298 * US GAAP measure of net cash provided by (used for) investing activities was $77MM in 2012 and ($80MM) in 2011 and includes net (purchases)/sales of marketable securities of $154MM in 2012 and ($44MM) in 2011 Third Quarter 2012 Earnings Call and Webcast 12
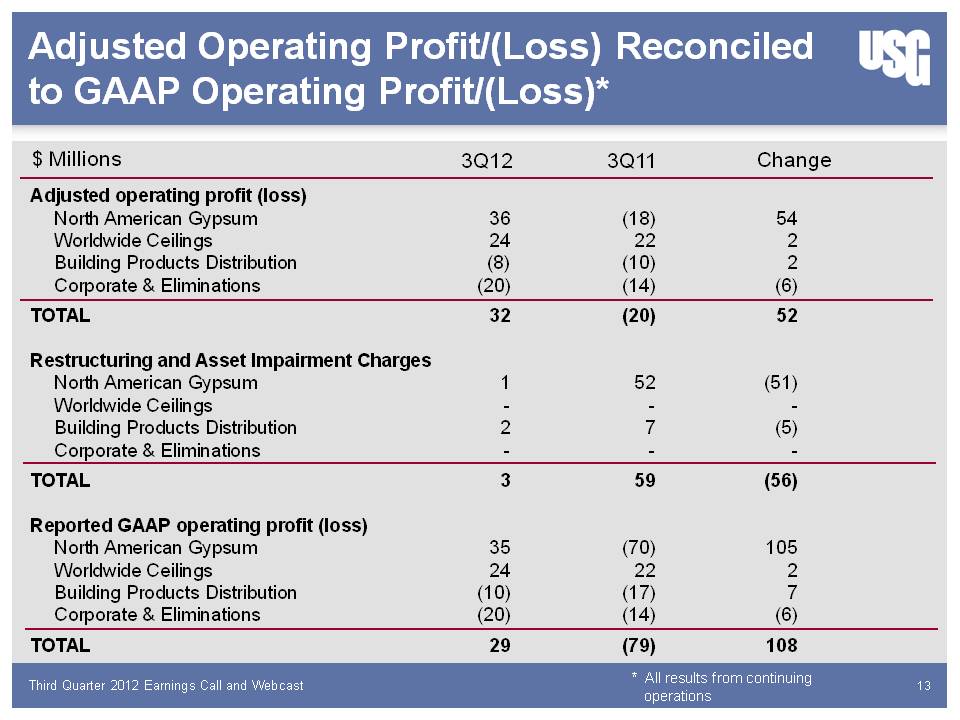
Adjusted Operating Profit/(Loss) Reconciled to GAAP Operating Profit/(Loss)* $ Millions 3Q12 3Q11 Change Adjusted operating profit (loss) North American Gypsum 36 (18) 54 Worldwide Ceilings 24 22 2 Building Products Distribution (8) (10) 2 Corporate & Eliminations (20) (14) (6) TOTAL 32 (20) 52 Restructuring and Asset Impairment Charges North American Gypsum 1 52 (51) Worldwide Ceilings - - - Building Products Distribution 2 7 (5) Corporate & Eliminations - - - TOTAL 3 59 (56) Reported GAAP operating profit (loss) North American Gypsum 35 (70) 105 Worldwide Ceilings 24 22 2 Building Products Distribution (10) (17) 7 Corporate & Eliminations (20) (14) (6) TOTAL 29 (79) 108 * All results from continuing operations Third Quarter 2012 Earnings Call and Webcast 13

James S. Metcalf Chairman, President and CEO Closing Remarks
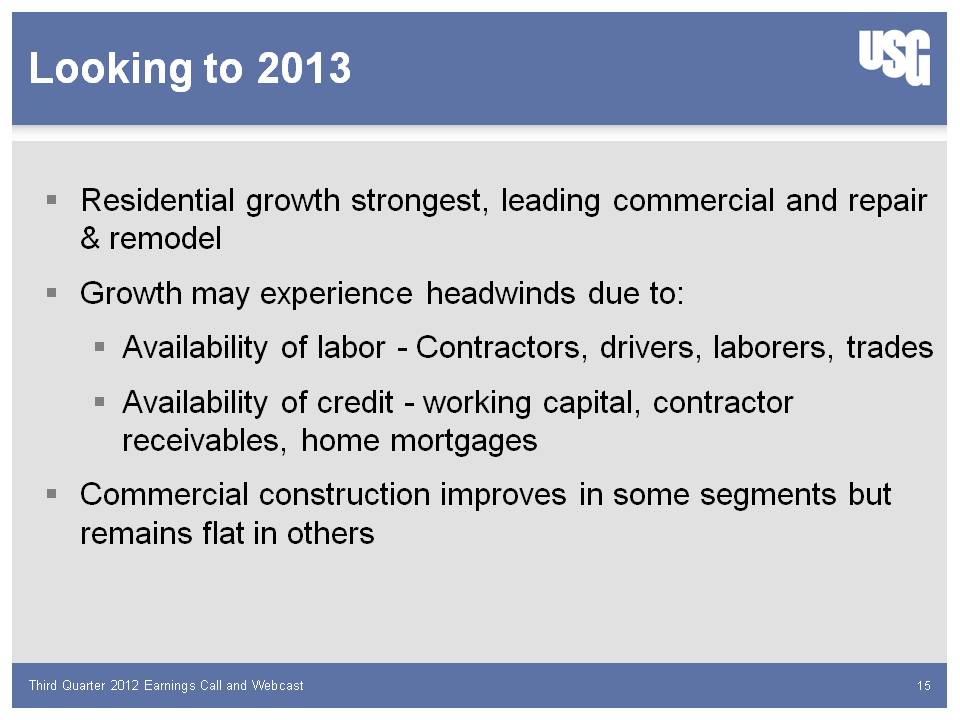
Looking to 2013 Residential growth strongest, leading commercial and repair & remodel Growth may experience headwinds due to: Availability of labor - Contractors, drivers, laborers, trades Availability of credit - working capital, contractor receivables, home mortgages Commercial construction improves in some segments but remains flat in others Third Quarter 2012 Earnings Call and Webcast 15
Questions?
James S. Metcalf Chairman, President and CEO Closing Remarks