Attached files
| file | filename |
|---|---|
| 8-K - FORM 8K - WEST PHARMACEUTICAL SERVICES INC | form8k.htm |
WEST PHARMACEUTICAL SERVICES, INC. Solutions for Injectable Drug Delivery NYSE:WST www.westpharma.com © 2012 by West Pharmaceutical Services, Inc., Lionville, PA. All rights reserved. This material is protected by copyright. No part of it may be reproduced, stored in a retrieval system, or transmitted in any form or by any means, electronic, mechanical, photocopying or otherwise, without written permission of West Pharmaceutical Services, Inc.. All trademarks and registered trademarks are property of West Pharmaceutical Services, Inc., unless noted otherwise. UBS 2012 Global Life Sciences Conference New York, NY September 19, 2012
Safe Harbor Statement Cautionary Statement Under the Private Securities Litigation Reform Act of 1995 This presentation and any accompanying management commentary contain “forward-looking statements” as that term is defined in the Private Securities Litigation Reform Act of 1995. Such statements include, but are not limited to statements about expected financial results for 2012 and future years. Each of these estimates is based on preliminary information, and actual results could differ from these preliminary estimates. We caution investors that the risk factors listed under “Cautionary Statement” in our press releases, as well as those set forth under the caption "Risk Factors" in our most recent Annual Report on Form 10-K as filed with the Securities and Exchange Commission and as revised or supplemented by our quarterly reports on Form 10-Q, could cause our actual results to differ materially from those estimated or predicted in the forward-looking statements. You should evaluate any statement in light of these important factors. Except as required by law or regulation, we undertake no obligation to publicly update any forward-looking statements, whether as a result of new information, future events, or otherwise. Non-GAAP Financial Measures Certain financial measures included in these presentation materials, and which may be referred to in management’s discussion of the Company’s results and outlook, are Non-GAAP (Generally Accepted Accounting Principles) financial measures. Please refer to the “Non-GAAP Financial Measures” and “Notes to Non-GAAP Financial Measures” at the end of these materials for more information. Non-GAAP financial measures should not be considered in isolation or as an alternative to such measures determined in accordance with GAAP. *

A globally diverse manufacturer of products used primarily in containing and administering small-volume parenteral drugs Strong competitive position Diversified customer base Proprietary technology Global footprint Significant barriers to entry Stability with growth potential Proprietary Products Geographic Expansion Financial strength to invest Reliable operating cash flow Well capitalized * West Snapshot
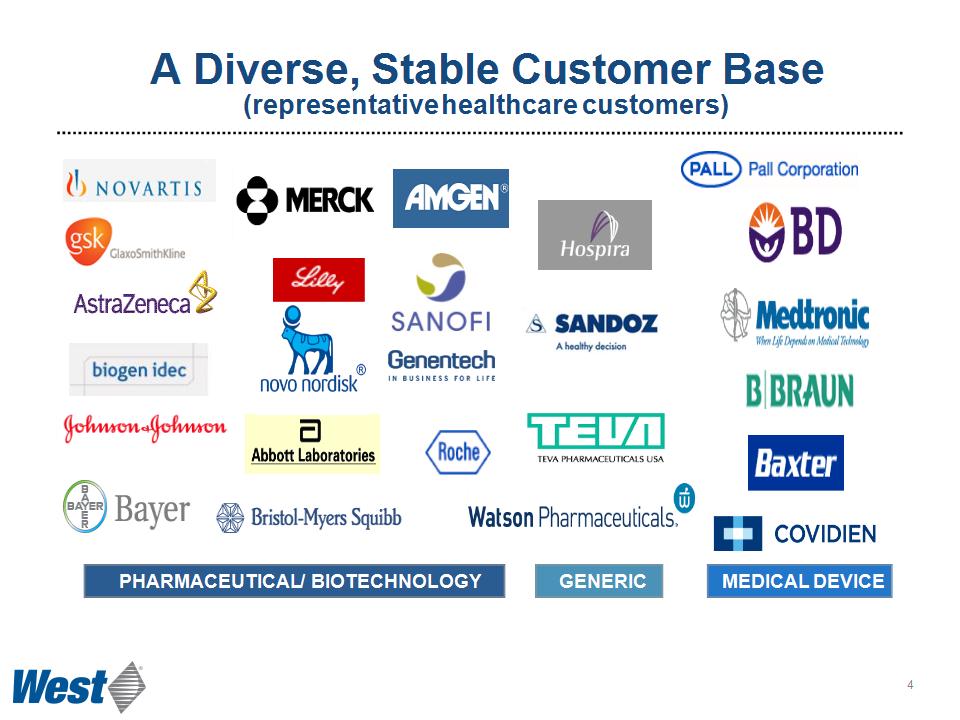
A Diverse, Stable Customer Base (representative healthcare customers) PHARMACEUTICAL / BIOTECHNOLOGY GENERIC MEDICAL DEVICE *

The West Transition Founded in Philadelphia (1923) and listed on NYSE since 1980 Initiated strategic transformation in 2001 to become a leading global supplier of value-added pharmaceutical packaging systems and components * ‘03 ‘04 ‘05 ‘06 ‘07 ‘08 ‘09 ‘10 ‘11 2001 $392 M 2011 $1.2 B Kinston recovery Sale of CCI Sale of Drug Delivery Acquired Tech Group, Medimop Began Eur/Asia expansion Acquired Pharma Pen Acquired Normandy Acquired LaModel China plastics completed Global Quality Initiative China rubber begun
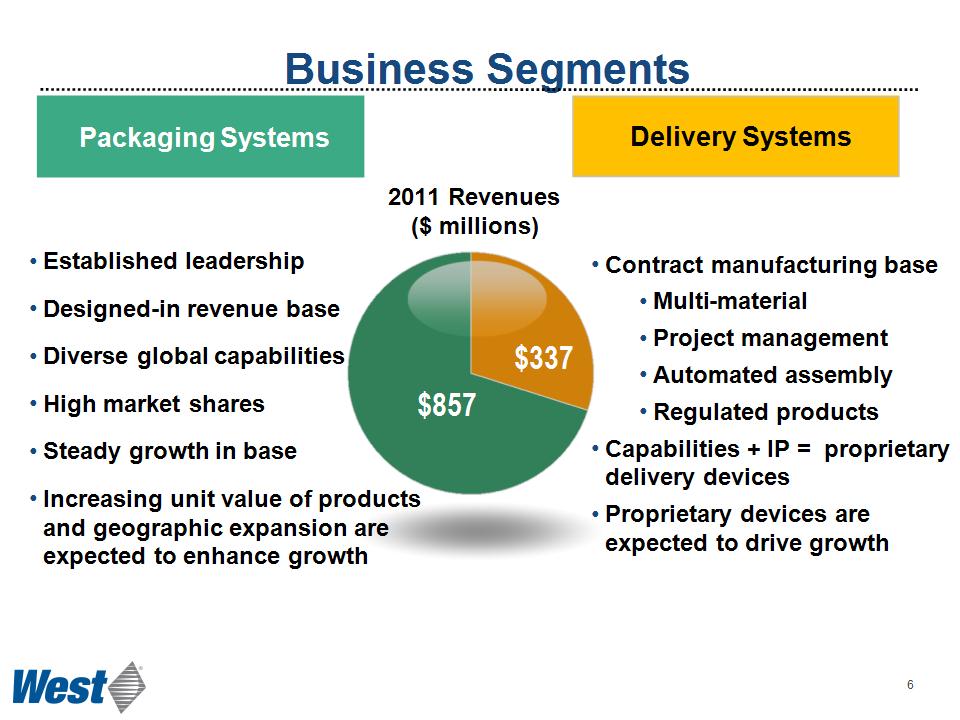
Business Segments $857 $337 2011 Revenues ($ millions) Delivery Systems Contract manufacturing base Multi-material Project management Automated assembly Regulated products Capabilities + IP = proprietary delivery devices Proprietary devices are expected to drive growth Packaging Systems Established leadership Designed-in revenue base Diverse global capabilities High market shares Steady growth in base Increasing unit value of products and geographic expansion are expected to enhance growth *
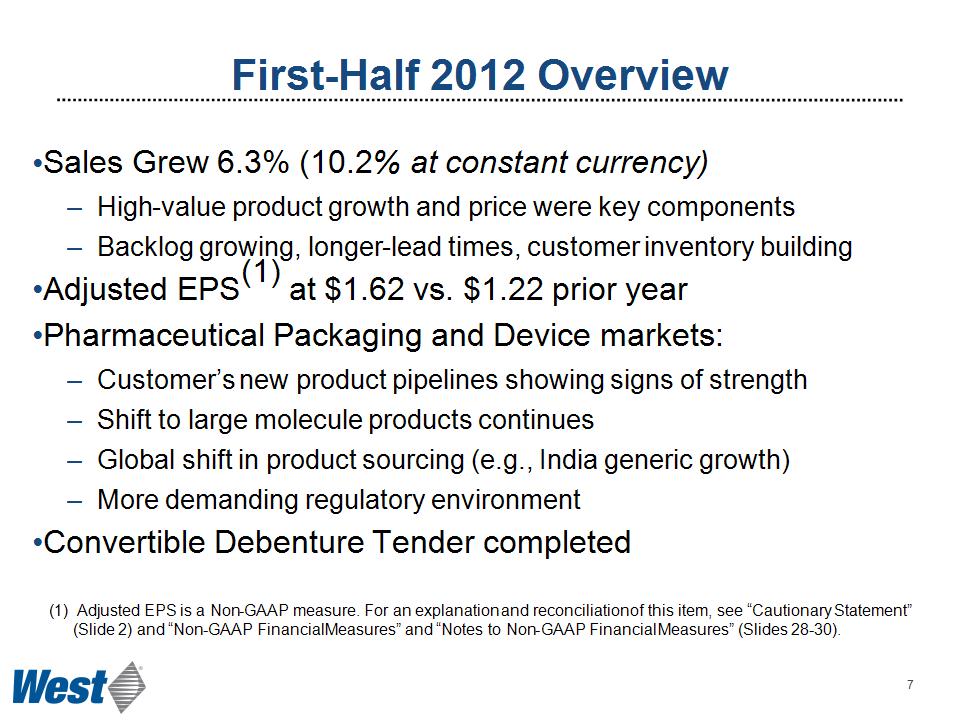
First-Half 2012 Overview Sales Grew 6.3% (10.2% at constant currency) High-value product growth and price were key components Backlog growing, longer-lead times, customer inventory building Adjusted EPS(1) at $1.62 vs. $1.22 prior year Pharmaceutical Packaging and Device markets: Customer’s new product pipelines showing signs of strength Shift to large molecule products continues Global shift in product sourcing (e.g., India generic growth) More demanding regulatory environment Convertible Debenture Tender completed * Adjusted EPS is a Non-GAAP measure. For an explanation and reconciliation of this item, see “Cautionary Statement” (Slide 2) and “Non-GAAP Financial Measures” and “Notes to Non-GAAP Financial Measures” (Slides 28-30).
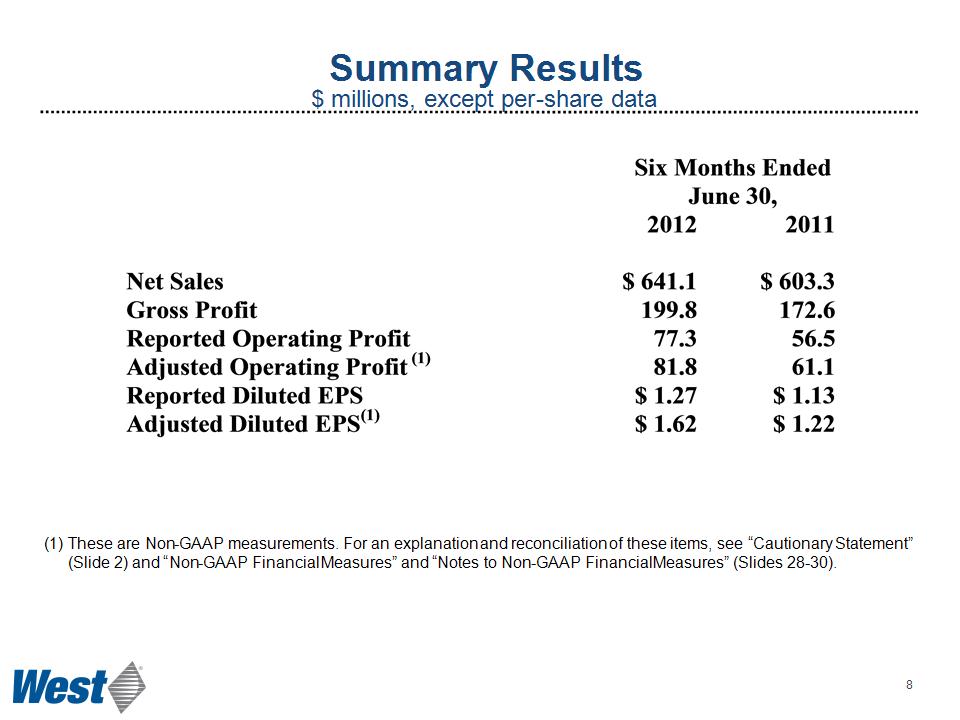
Summary Results $ millions, except per-share data These are Non-GAAP measurements. For an explanation and reconciliation of these items, see “Cautionary Statement” (Slide 2) and “Non-GAAP Financial Measures” and “Notes to Non-GAAP Financial Measures” (Slides 28-30). *
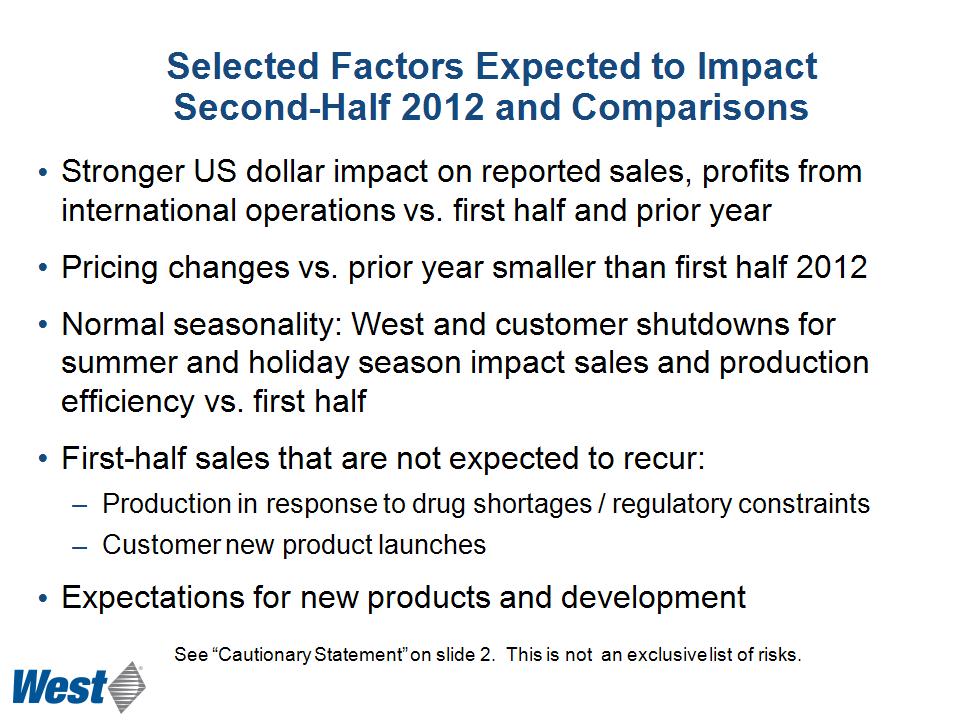
Selected Factors Expected to Impact Second-Half 2012 and Comparisons See “Cautionary Statement” on slide 2. This is not an exclusive list of risks. Stronger US dollar impact on reported sales, profits from international operations vs. first half and prior year Pricing changes vs. prior year smaller than first half 2012 Normal seasonality: West and customer shutdowns for summer and holiday season impact sales and production efficiency vs. first half First-half sales that are not expected to recur: Production in response to drug shortages / regulatory constraints Customer new product launches Expectations for new products and development
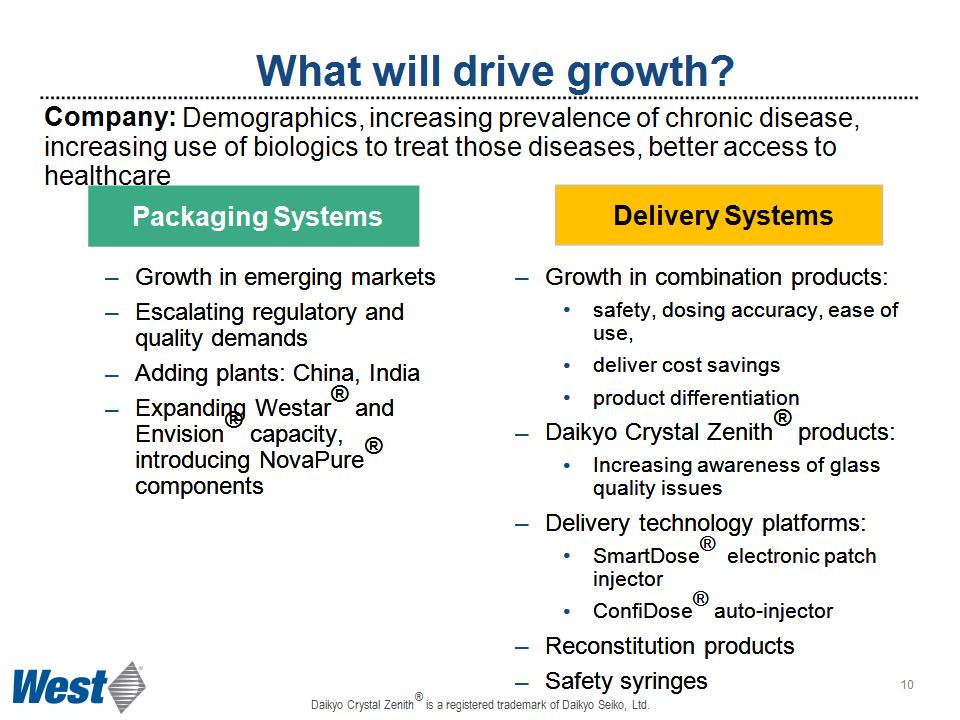
Company: Demographics, increasing prevalence of chronic disease, increasing use of biologics to treat those diseases, better access to healthcare What will drive growth? Growth in emerging markets Escalating regulatory and quality demands Adding plants: China, India Expanding Westar® and Envision® capacity, introducing NovaPure® components Growth in combination products: safety, dosing accuracy, ease of use, deliver cost savings product differentiation Daikyo Crystal Zenith® products: Increasing awareness of glass quality issues Delivery technology platforms: SmartDose® electronic patch injector ConfiDose® auto-injector Reconstitution products Safety syringes Daikyo Crystal Zenith® is a registered trademark of Daikyo Seiko, Ltd. Packaging Systems Delivery Systems *

Category Key Customers Projected Growth Diabetes > 10 % Oncology > 10 % Vaccines > 10 % Autoimmune > 8% Generics >10% IMS April 2010 Report; Business Insights 2009; GBI Research 2009 Therapeutic Category Growth Drivers *
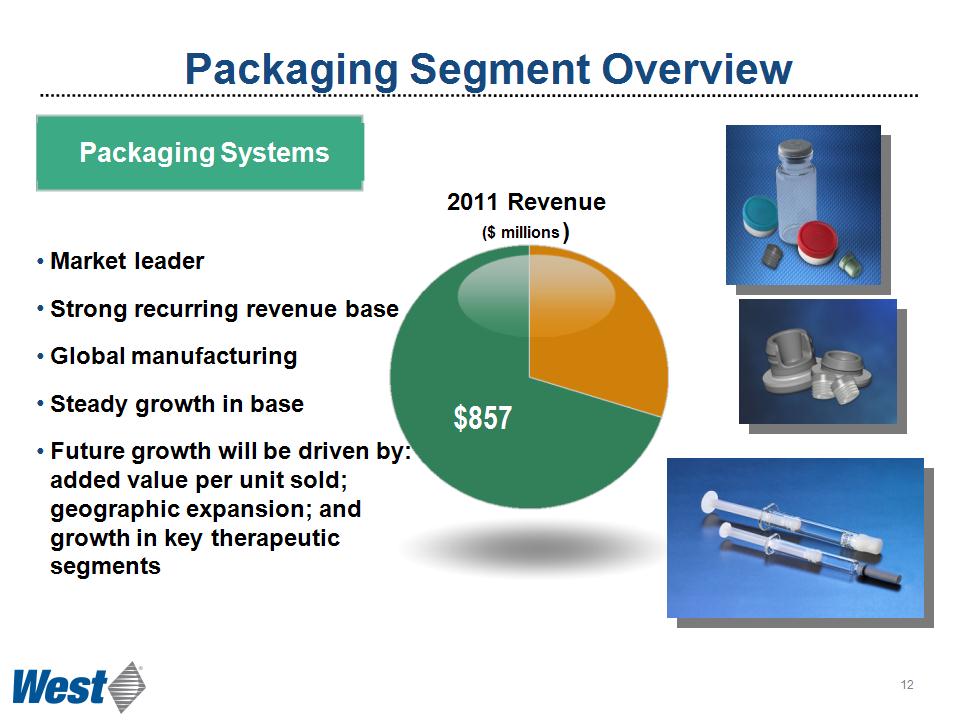
Packaging Segment Overview 2011 Revenue ($ millions) Packaging Systems Market leader Strong recurring revenue base Global manufacturing Steady growth in base Future growth will be driven by: added value per unit sold; geographic expansion; and growth in key therapeutic segments $857 *
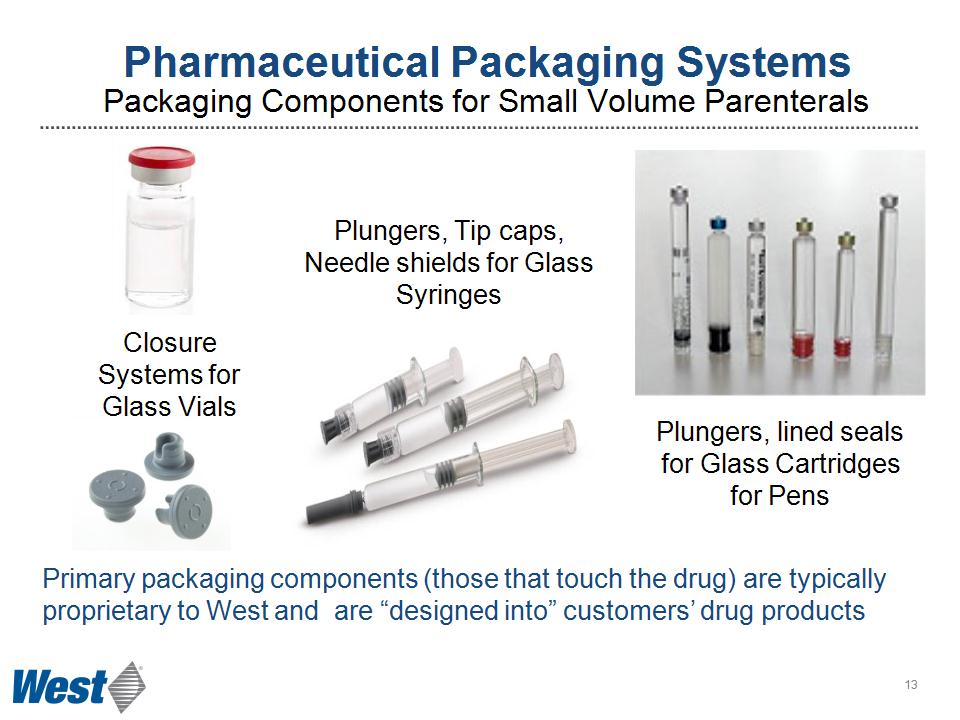
Pharmaceutical Packaging Systems Packaging Components for Small Volume Parenterals Plungers, Tip caps, Needle shields for Glass Syringes Plungers, lined seals for Glass Cartridges for Pens Closure Systems for Glass Vials Primary packaging components (those that touch the drug) are typically proprietary to West and are “designed into” customers’ drug products *
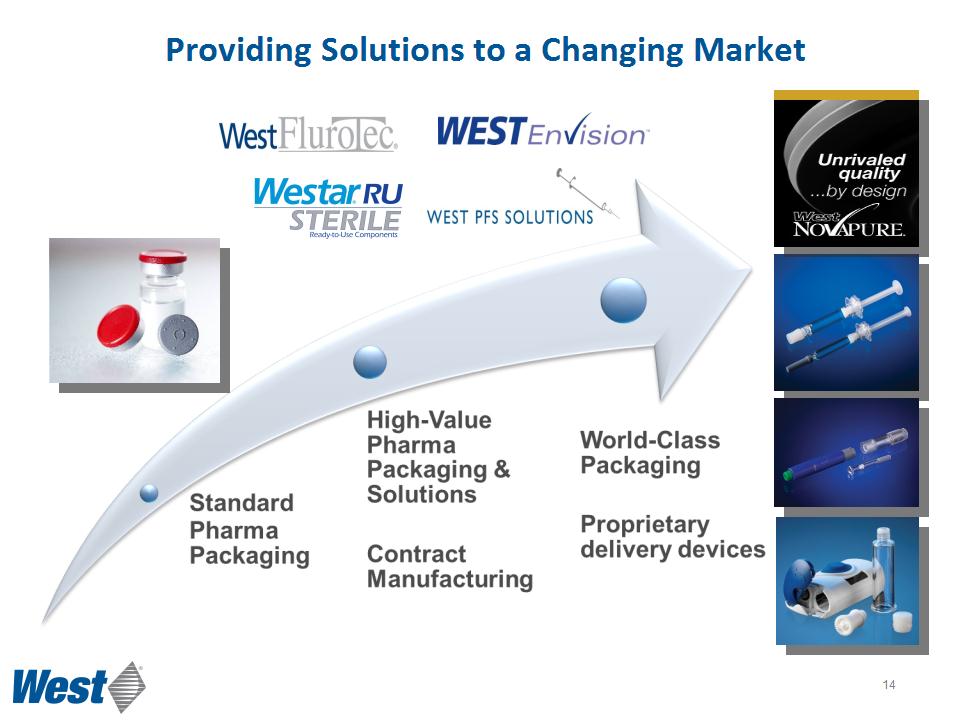
Providing Solutions to a Changing Market *
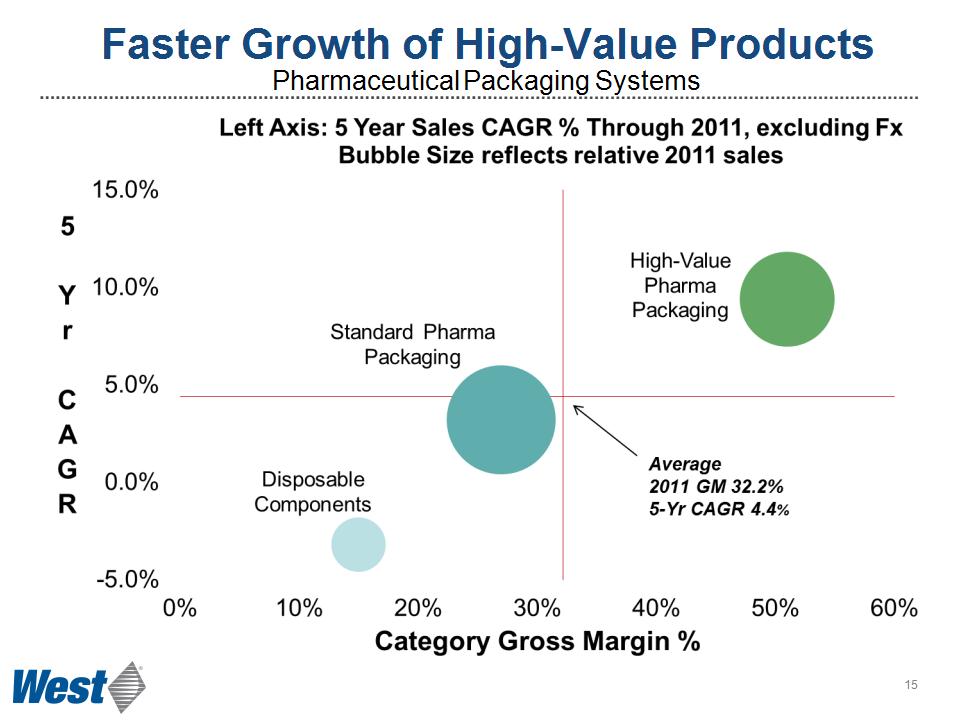
Faster Growth of High-Value Products Pharmaceutical Packaging Systems *
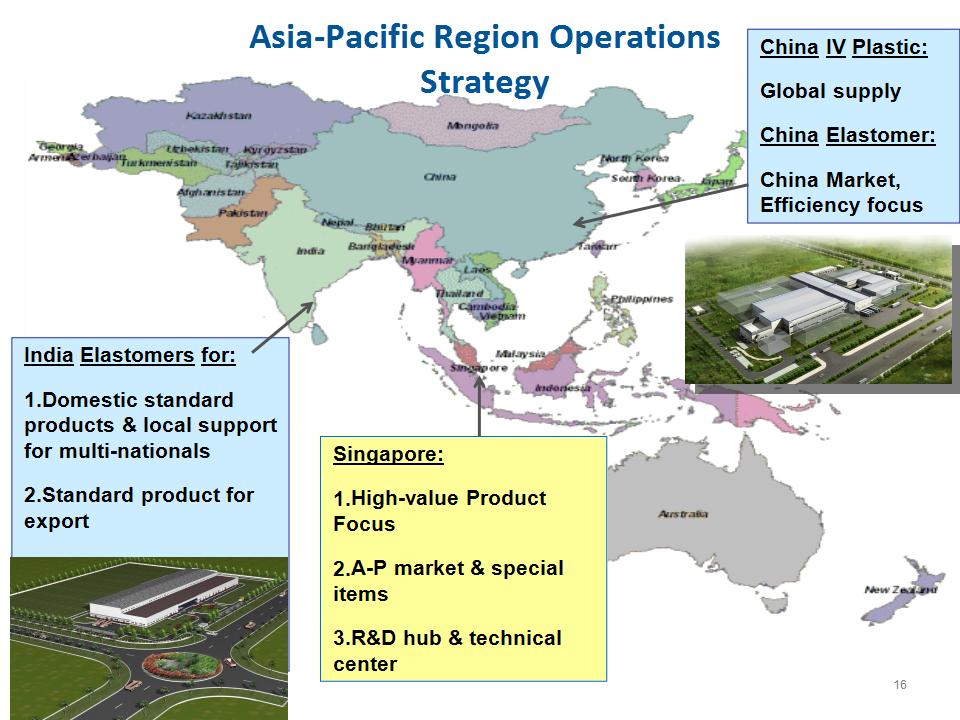
Asia-Pacific Region Operations Strategy Singapore: High-value Product Focus A-P market & special items R&D hub & technical center China IV Plastic: Global supply China Elastomer: China Market, Efficiency focus India Elastomers for: Domestic standard products & local support for multi-nationals Standard product for export India Metal AP market support *
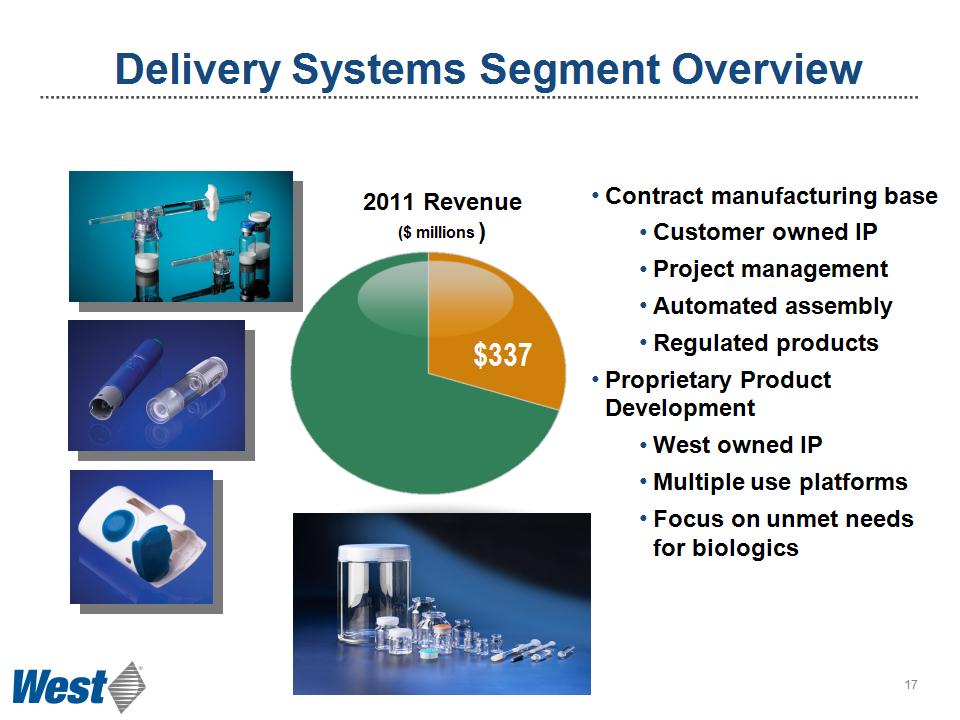
Delivery Systems Segment Overview $337 Contract manufacturing base Customer owned IP Project management Automated assembly Regulated products Proprietary Product Development West owned IP Multiple use platforms Focus on unmet needs for biologics 2011 Revenue ($ millions) *
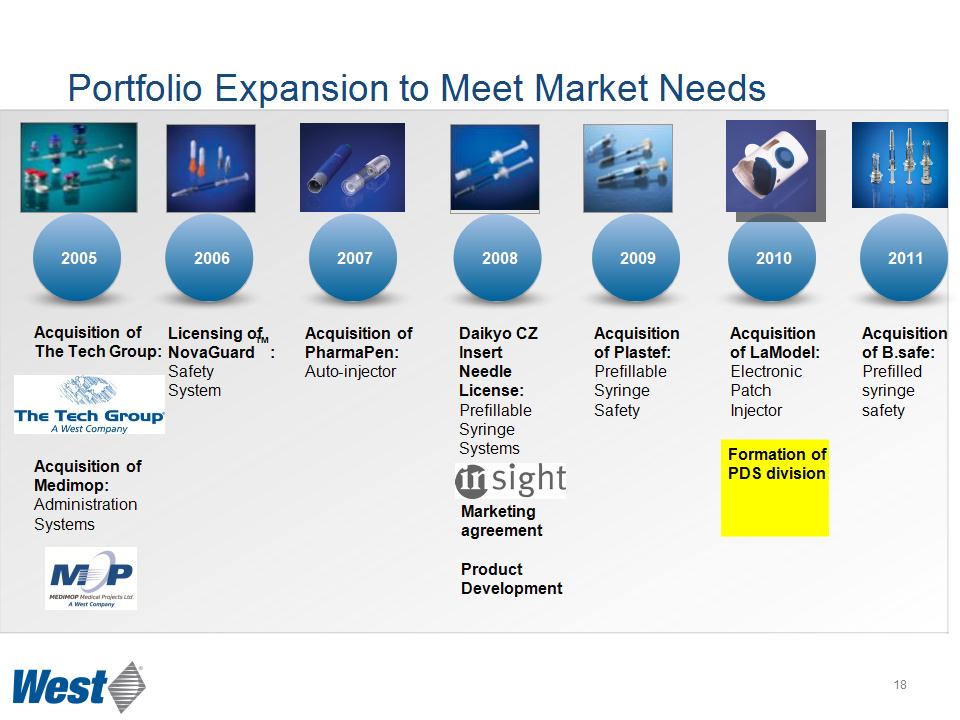
Acquisition of The Tech Group: Acquisition of Medimop: Administration Systems Licensing of NovaGuard™: Safety System Acquisition of PharmaPen: Auto-injector Daikyo CZ Insert Needle License: Prefillable Syringe Systems Acquisition of Plastef: Prefillable Syringe Safety Acquisition of LaModel: Electronic Patch Injector Marketing agreement Product Development Formation of PDS division Portfolio Expansion to Meet Market Needs Acquisition of B.safe: Prefilled syringe safety *
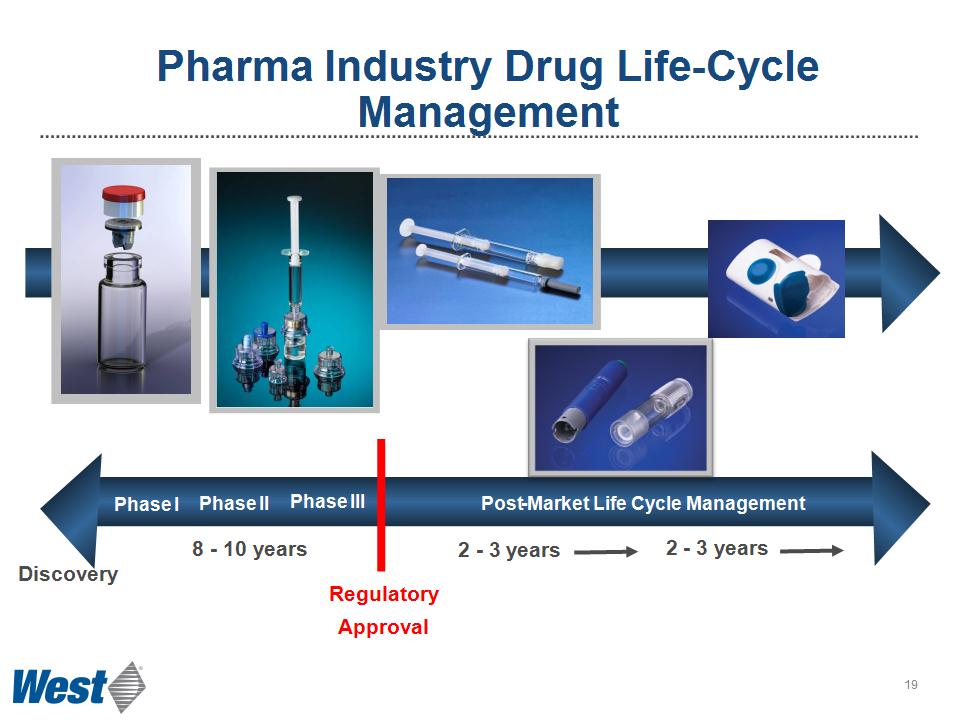
Pharma Industry Drug Life-Cycle Management Phase I Phase II Phase III Post-Market Life Cycle Management 8 - 10 years 2 - 3 years 2 - 3 years Regulatory Approval Discovery *
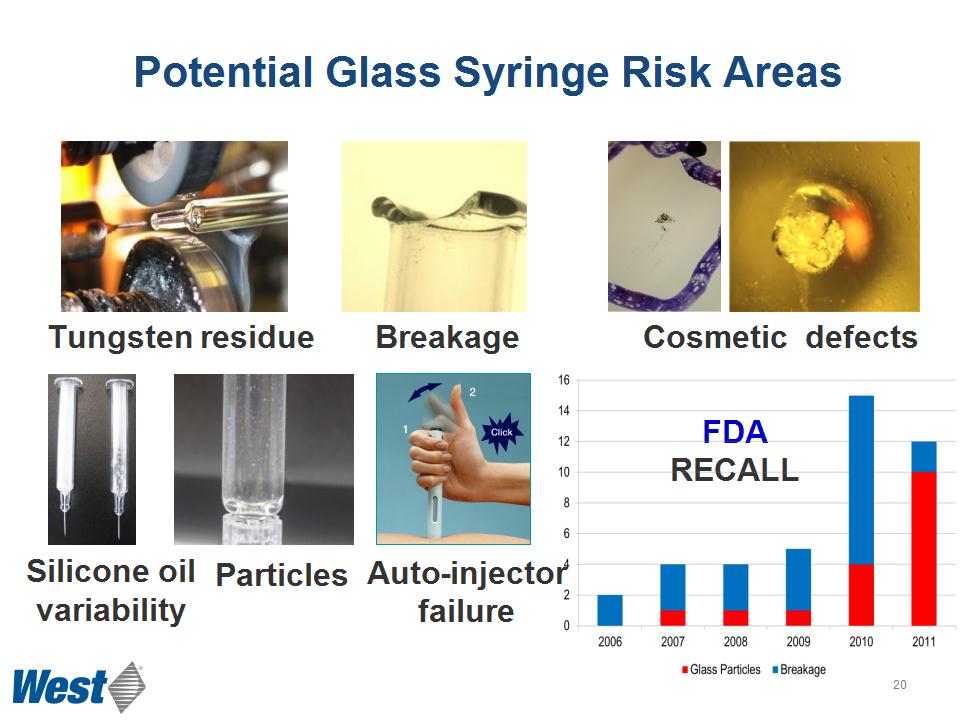
Tungsten residue Breakage Silicone oil variability Auto-injector failure Cosmetic defects Particles FDA RECALL Potential Glass Syringe Risk Areas *

Daikyo CZ Solution with Daikyo Flurotec® Barrier Film Reduces: drug exposure to extractables risk of protein aggregation caused by silicone oil in the drug product returns and in-process clean-ups caused by broken glass risk of delamination and glass-particulate contamination Consistent piston release and travel forces without using silicone oil Flurotec® is a registered trademark of Daikyo Seiko, Ltd. *
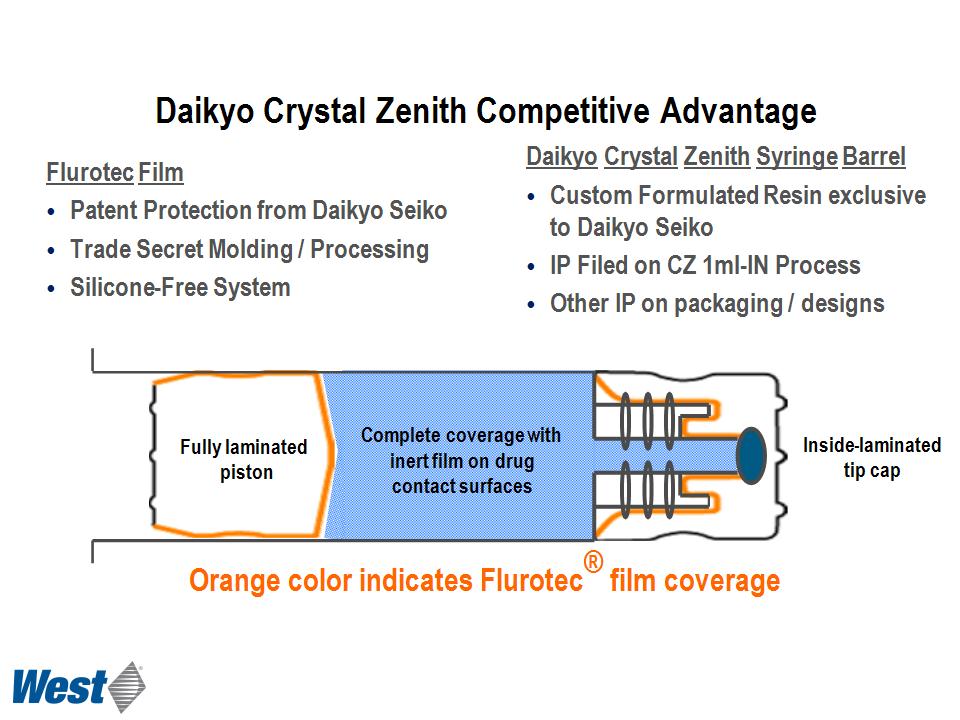
Orange color indicates Flurotec® film coverage Complete coverage with inert film on drug contact surfaces Flurotec Film Patent Protection from Daikyo Seiko Trade Secret Molding / Processing Silicone-Free System Daikyo Crystal Zenith Syringe Barrel Custom Formulated Resin exclusive to Daikyo Seiko IP Filed on CZ 1ml-IN Process Other IP on packaging / designs Daikyo Crystal Zenith Competitive Advantage Fully laminated piston Inside-laminated tip cap
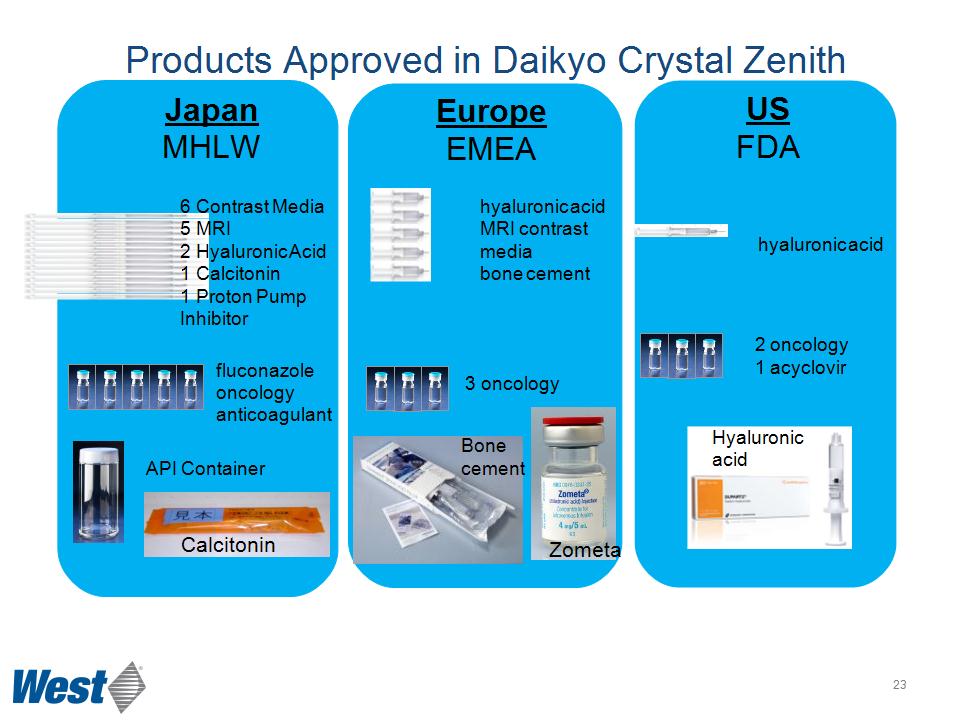
Products Approved in Daikyo Crystal Zenith hyaluronic acid MRI contrast media bone cement 6 Contrast Media 5 MRI 2 Hyaluronic Acid 1 Calcitonin 1 Proton Pump Inhibitor fluconazole oncology anticoagulant 2 oncology 1 acyclovir hyaluronic acid 3 oncology API Container Japan MHLW Europe EMEA US FDA Calcitonin Bone cement Zometa Hyaluronic acid *
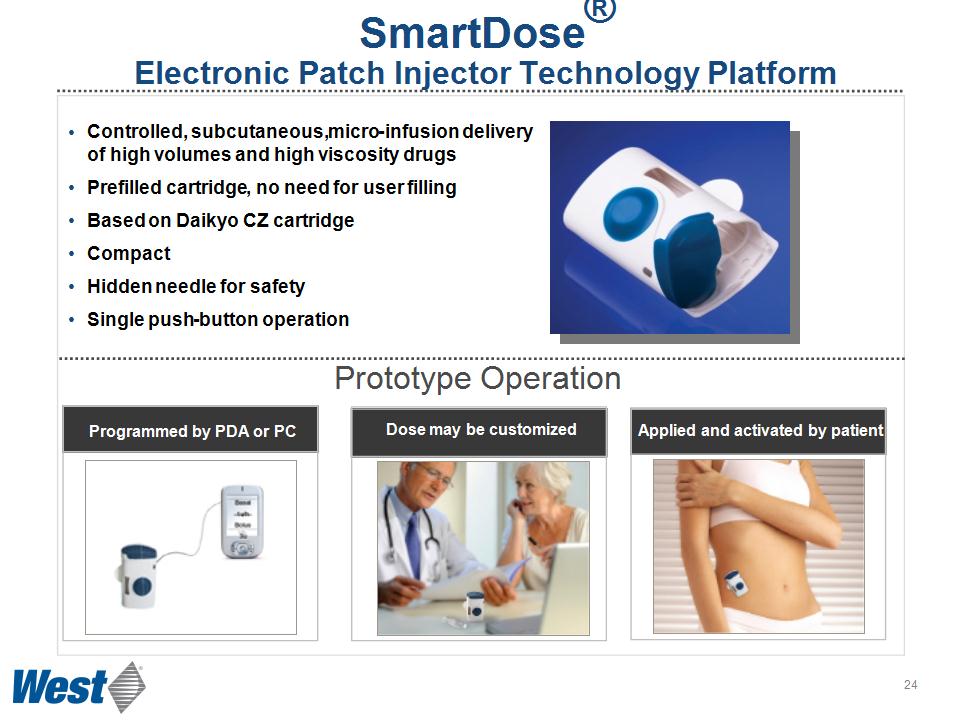
SmartDose® Electronic Patch Injector Technology Platform Programmed by PDA or PC Dose may be customized Applied and activated by patient Controlled, subcutaneous, micro-infusion delivery of high volumes and high viscosity drugs Prefilled cartridge, no need for user filling Based on Daikyo CZ cartridge Compact Hidden needle for safety Single push-button operation Prototype Operation *
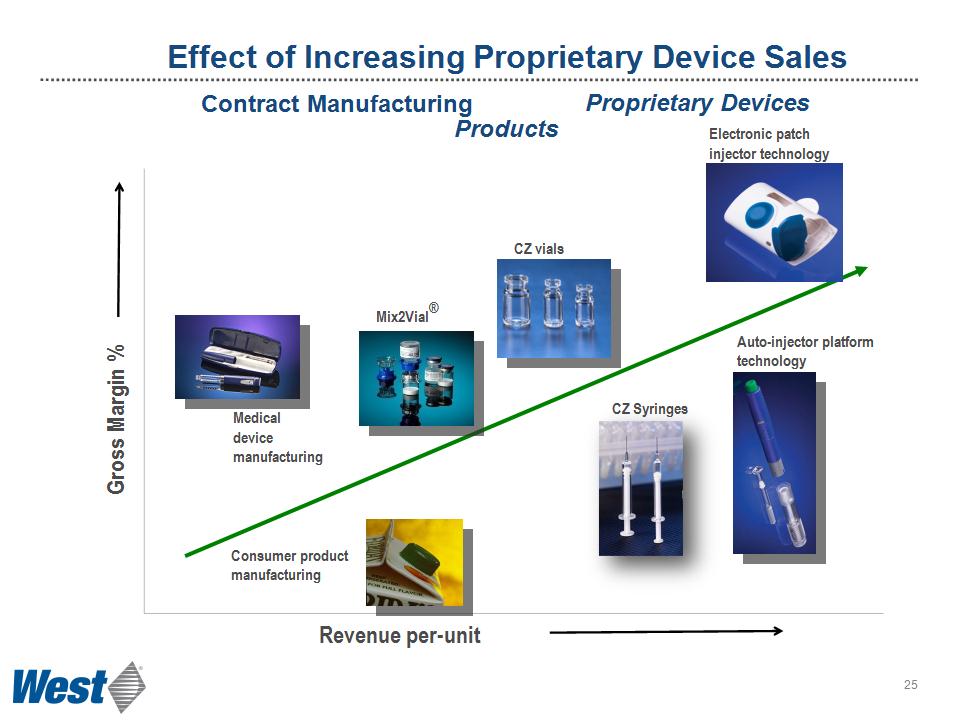
Revenue per-unit Consumer product manufacturing Medical device manufacturing Mix2Vial® CZ vials CZ Syringes Effect of Increasing Proprietary Device Sales Contract Manufacturing Proprietary Devices Products Gross Margin % Auto-injector platform technology Electronic patch injector technology *
Our Long-Term Focus Pharmaceutical Packaging Systems Organic growth of 3-5% per year Margin expansion from efficiency, product mix Capital investments target enhanced quality and value Pharmaceutical Delivery Systems Deliver the potential of Daikyo CZ products Stronger mix of healthcare-consumable contract manufacturing Grow proprietary safety and delivery systems Financial discipline Operating cash flow supports R&D and capital spending Deliver returns (ROIC) that regularly exceed cost of capital (WACC) Maintain quarterly dividend Align incentives with financial performance and value creation *
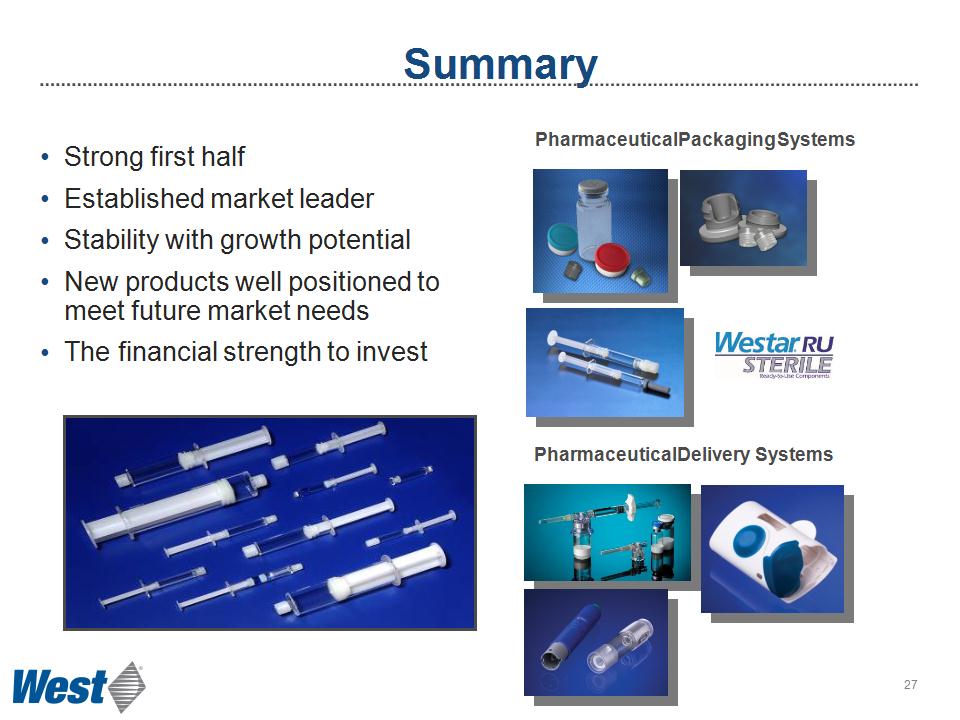
Pharmaceutical Packaging Systems Pharmaceutical Delivery Systems Strong first half Established market leader Stability with growth potential New products well positioned to meet future market needs The financial strength to invest Summary *
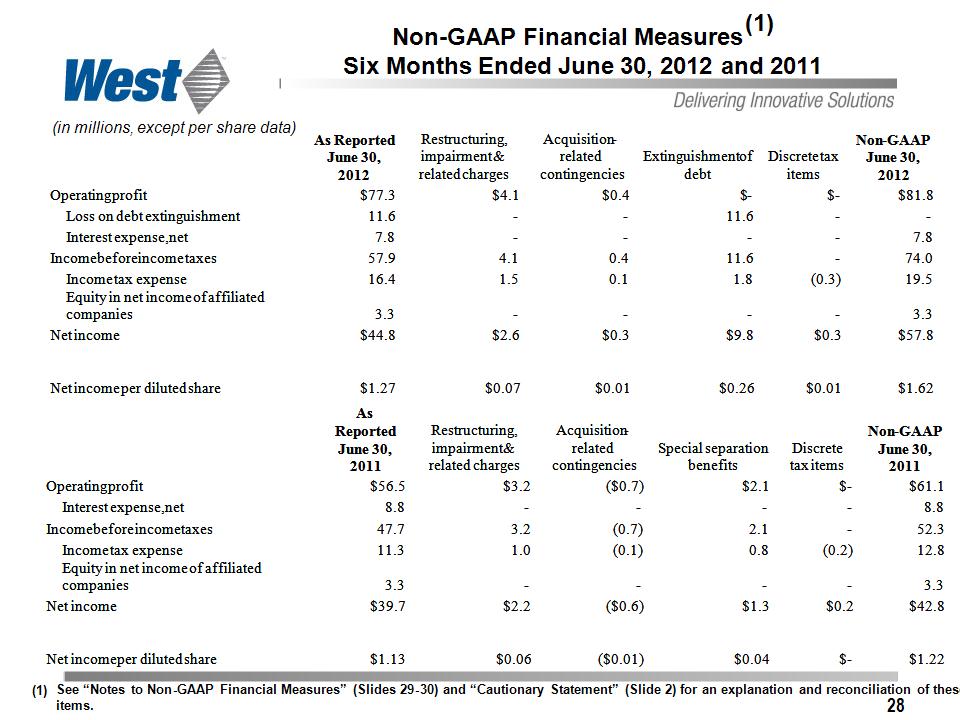
* Non-GAAP Financial Measures(1) Six Months Ended June 30, 2012 and 2011 (in millions, except per share data) See “Notes to Non-GAAP Financial Measures” (Slides 29-30) and “Cautionary Statement” (Slide 2) for an explanation and reconciliation of these items. As Reported June 30, 2012 Restructuring, impairment & related charges Acquisition-related contingencies Extinguishment of debt Discrete tax items Non-GAAP June 30, 2012 Operating profit $77.3 $4.1 $0.4 $- $- $81.8 Loss on debt extinguishment 11.6 - - 11.6 - - Interest expense, net 7.8 - - - - 7.8 Income before income taxes 57.9 4.1 0.4 11.6 - 74.0 Income tax expense 16.4 1.5 0.1 1.8 (0.3) 19.5 Equity in net income of affiliated companies 3.3 - - - - 3.3 Net income $44.8 $2.6 $0.3 $9.8 $0.3 $57.8 Net income per diluted share $1.27 $0.07 $0.01 $0.26 $0.01 $1.62 As Reported June 30, 2011 Restructuring, impairment & related charges Acquisition-related contingencies Special separation benefits Discrete tax items Non-GAAP June 30, 2011 Operating profit $56.5 $3.2 ($0.7) $2.1 $- $61.1 Interest expense, net 8.8 - - - - 8.8 Income before income taxes 47.7 3.2 (0.7) 2.1 - 52.3 Income tax expense 11.3 1.0 (0.1) 0.8 (0.2) 12.8 Equity in net income of affiliated companies 3.3 - - - - 3.3 Net income $39.7 $2.2 ($0.6) $1.3 $0.2 $42.8 Net income per diluted share $1.13 $0.06 ($0.01) $0.04 $- $1.22
* NOTES TO NON-GAAP FINANCIAL MEASURES For additional details, please see today’s press release and Safe Harbor Statement. (continued on following slide) These presentation materials and associated presentation use the following financial measures that have not been calculated in accordance with generally accepted accounting principles (GAAP) accepted in the U.S., and therefore are referred to as non-GAAP financial measures: Adjusted operating profit Adjusted net income Adjusted diluted EPS Net debt Net debt to total invested capital West believes that these non-GAAP measures of financial results provide useful information to management and investors regarding business trends, results of operations, and the Company’s overall performance and financial position. Our executive management team uses these financial measures to evaluate the performance of the Company in terms of profitability and efficiency, to compare operating results to prior periods, to evaluate changes in the operating results of each segment, and to measure and allocate financial resources to our segments. The Company believes that the use of these non-GAAP financial measures provides an additional tool for investors to use in evaluating ongoing operating results and trends in comparing its financial measures with other companies. Our executive management does not consider such non-GAAP measures in isolation or as an alternative to such measures determined in accordance with GAAP. The principal limitation of these financial measures is that they exclude significant expenses and income that are required by GAAP to be recorded. In addition, they are subject to inherent limitations as they reflect the exercise of judgment by management about which items are excluded. In order to compensate for these limitations, non-GAAP financial measures are presented in connection with GAAP results. We urge investors and potential investors to review the reconciliations of our non-GAAP financial measures to the comparable GAAP financial measures, and not to rely on any single financial measure to evaluate the Company’s business. In calculating adjusted operating profit, adjusted net income and adjusted diluted EPS, we exclude the impact of items that are not considered representative of ongoing operations. Such items include restructuring and related costs, certain asset impairments, other specifically identified gains or losses, and discrete income tax items. A reconciliation of these adjusted non-GAAP measures to the comparable GAAP financial measures is included in the accompanying tables. The following is a description of the items excluded from adjusted operating profit, adjusted net income and adjusted diluted EPS for the six-month periods presented in the accompanying tables: Restructuring, impairment & related charges - During the six months ended June 30, 2012, we incurred restructuring, impairment and related charges of $4.1 million, the majority of which related to impairment charges of $3.4 million, as we concluded that the estimated fair
* NOTES TO NON-GAAP FINANCIAL MEASURES For additional details, please see today’s press release and Safe Harbor Statement. (continued from prior slide) value of one of our product lines no longer exceeded the carrying value of the related assembly equipment and intangible asset. The remaining charges were restructuring and related charges associated with the restructuring plan announced in December 2010, primarily for employee severance and benefits, as well as asset transfer and facility closure costs. During the six months ended June 30, 2011, we incurred restructuring, impairment and related charges of $3.2 million, which were associated with the December 2010 restructuring plan and which were primarily for employee severance and benefits, as well as asset transfer and facility closure costs. Acquisition-related contingencies - During the six months ended June 30, 2012, we increased the liability for contingent consideration related to our 2010 acquisition of technology used in our SmartDose™ electronic patch injector system by $0.4 million, due to accretion expense. During the six months ended June 30, 2011, we eliminated $0.8 million of contingent consideration related to our July 2009 éris safety syringe system acquisition. This reflected our assessment that none of the contractual operating targets will be achieved over the earn-out period, which ends in 2014. Partially offsetting this reduction was accretion expense related to the SmartDose electronic patch injector technology acquisition. Extinguishment of debt – During the six months ended June 30, 2012, we recognized a loss on debt extinguishment of $11.6 million related to our repurchase of $158.4 million in aggregate principal amount of 4.00% Convertible Junior Subordinated Debentures Due 2047, which included the purchase premium, transaction costs and a non-cash charge for unamortized debt issuance costs of the purchased Convertible Debentures. The purchase of the Convertible Debentures results in a 2.9 million share, or 7.8%, prospective reduction in West common shares included in the measurement of diluted earnings per share. Special separation benefits - During the six months ended June 30, 2011, we incurred $2.1 million in special separation benefits related to the retirement of our former President and Chief Operating Officer. These costs were primarily for the revaluation and acceleration of stock-based compensation expense as a result of amendments to equity awards that allow certain of his awards to continue to vest over the original vesting period instead of being forfeited upon separation.
WEST PHARMACEUTICAL SERVICES, INC. Solutions for Injectable Drug Delivery NYSE:WST www.westpharma.com © 2012 by West Pharmaceutical Services, Inc., Lionville, PA. All rights reserved. This material is protected by copyright. No part of it may be reproduced, stored in a retrieval system, or transmitted in any form or by any means, electronic, mechanical, photocopying or otherwise, without written permission of West Pharmaceutical Services, Inc.. All trademarks and registered trademarks are property of West Pharmaceutical Services, Inc., unless noted otherwise.