Attached files
|
UNITED
STATES
SECURITIES
AND EXCHANGE COMMISSION
|
Washington,
D.C. 20549
FORM
10-K
(Mark
One)
|
|
þ
|
ANNUAL REPORT PURSUANT TO
SECTION 13 OR 15 (d) OF THE SECURITIES EXCHANGE ACT OF
1934
|
For
the Fiscal Year Ended December 31, 2009
or
|
|
¨
|
TRANSITION REPORT PURSUANT TO
SECTION 13 OR 15 (d) OF THE SECURITIES EXCHANGE ACT OF
1934
|
For
the transition period
from to
Commission
File Number 1-8036
WEST
PHARMACEUTICAL SERVICES, INC.
(Exact
name of registrant as specified in its charter)
|
Pennsylvania
|
23-1210010
|
|
(State
or other jurisdiction of incorporation or organization)
|
(I.R.S.
Employer Identification Number)
|
|
101
Gordon Drive, PO Box 645, Lionville, PA
|
19341-0645
|
|
(Address
of principal executive offices)
|
(Zip
Code)
|
Registrant’s
telephone number, including area code: 610-594-2900
Securities
registered pursuant to Section 12(b) of the Act:
|
Title
of each class
|
Name
of each exchange on which registered
|
|
Common
Stock, par value $.25 per share
|
New
York Stock Exchange
|
Securities registered pursuant to
Section 12 (g) of the Act: None
Indicate
by check mark if the registrant is a well-known seasoned issuer, as defined in
Rule 405 of the Securities Act.
Yes þ No o
Indicate
by check mark if the registrant is not required to file reports pursuant to
Section 13 or Section 15(d) of the Act.
Yes o No þ
Indicate
by check mark whether the registrant (1) has filed all reports required to be
filed by Section 13 or 15 (d) of the Securities Exchange Act of 1934 during the
preceding 12 months (or for such shorter period that the registrant was required
to file such reports), and (2) has been subject to such filing requirements for
the past 90 days. Yes þ No o
Indicate
by check mark whether the registrant has submitted electronically and posted on
its corporate Web site, if any, every Interactive Data File required to be
submitted and posted pursuant to Rule 405 of Regulation S-T (§ 232.405 of this
chapter) during the preceding 12 months (or for such shorter period that the
registrant was required to submit and post such
files). Yes o No o
Indicate
by check mark if disclosure of delinquent filers pursuant to Item 405 of
Regulation S-K is not contained herein, and will not be contained, to the best
of registrant’s knowledge, in definitive proxy or information statements
incorporated by reference in Part III of this Form 10-K or any amendment to this
Form 10-K. o
Indicate
by check mark whether the registrant is a large accelerated filer, an
accelerated filer, a non-accelerated filer, or a smaller reporting
company. See the definitions of “large accelerated filer,”
“accelerated filer” and “smaller reporting company” in Rule 12b-2 of the
Exchange Act.
|
Large
accelerated filer
|
þ
|
Accelerated
filer
|
o
|
|
|
Non-accelerated
filer
|
o
|
(Do
not check if a smaller reporting company)
|
Smaller
reporting company
|
o
|
Indicate
by check mark whether the registrant is a shell company (as defined in rule
12b-2 of the Exchange Act). Yes o No þ
The
aggregate market value of the voting stock held by non-affiliates of the
registrant as of June 30, 2009 was approximately $1,145,638,234 based on the
closing price as reported on the New York Stock Exchange.
As of
January 31, 2010, there were 33,103,281 shares of the registrant’s common stock
outstanding.
DOCUMENTS
INCORPORATED BY REFERENCE
|
Document
|
Parts
Into Which Incorporated
|
|
Proxy
Statement for the Annual Meeting of Shareholders to be held May 4,
2010
|
Part
III
|
TABLE
OF CONTENTS
|
PART I
|
Page
|
|
ITEM 1. BUSINESS
|
3
|
|
3
3
3
4
4
6
6
7
7
7
8
8
8
8
9
9
9
10
10
|
|
|
ITEM 1A. RISK FACTORS
|
10
|
|
ITEM 1B. UNRESOLVED STAFF COMMENTS
|
15
|
|
ITEM 2. PROPERTIES
|
16
|
|
ITEM 3. LEGAL PROCEEDINGS
|
17
|
|
ITEM 4. SUBMISSION OF MATTERS TO A VOTE OF SECURITY
HOLDERS
|
17
|
|
17
|
|
|
PART II
|
|
|
ITEM 5. MARKET FOR REGISTRANT’S COMMON EQUITY, RELATED
STOCKHOLDER MATTERS AND ISSUER PURCHASES OF EQUITY
SECURITIES
|
19
|
|
ITEM 6. SELECTED FINANCIAL DATA
|
21
|
|
ITEM 7. MANAGEMENT’S DISCUSSION AND ANALYSIS OF
FINANCIAL CONDITION AND RESULTS OF OPERATIONS
|
23
|
|
ITEM 7A. QUANTITATIVE AND QUALITATIVE DISCLOSURES ABOUT
MARKET RISK
|
41
|
|
ITEM 8. FINANCIAL STATEMENTS AND SUPPLEMENTARY
DATA
|
43
|
|
ITEM 9. CHANGES IN AND DISAGREEMENTS WITH ACCOUNTANTS ON
ACCOUNTING AND FINANCIAL DISCLOSURE
|
78
|
|
ITEM 9A. CONTROLS AND PROCEDURES
|
78
|
|
ITEM 9B. OTHER INFORMATION
|
78
|
|
PART III
|
|
|
ITEM 10. DIRECTORS, EXECUTIVE OFFICERS AND CORPORATE
GOVERNANCE
|
79
|
|
ITEM 11. EXECUTIVE COMPENSATION
|
79
|
|
ITEM 12. SECURITY OWNERSHIP OF CERTAIN BENEFICIAL
OWNERS AND MANAGEMENT AND RELATED STOCKHOLDER MATTERS
|
79
|
|
ITEM 13. CERTAIN RELATIONSHIPS AND RELATED
TRANSACTIONS, AND DIRECTOR INDEPENDENCE
|
80
|
|
ITEM 14. PRINCIPAL ACCOUNTANT FEES AND SERVICES
|
80
|
|
PART IV
|
|
|
ITEM 15. EXHIBITS AND FINANCIAL STATEMENT
SCHEDULES
|
81
|
2
PART I
ITEM 1. BUSINESS.
West
Pharmaceutical Services, Inc. (which may be referred to as West, the Company, we, us or our) is a manufacturer of
components and systems for injectable drug delivery and plastic packaging, as
well as delivery system components for the pharmaceutical, healthcare and
consumer products industries. Our products include stoppers and seals for vials,
closures and components used in syringe, intravenous and blood collection
systems, prefillable syringe components, and safety and administration systems.
Our customers include the leading global producers and distributors of
pharmaceuticals, biologics, medical devices and personal care products. The
Company was incorporated under the laws of the Commonwealth of Pennsylvania on
July 27, 1923.
All
trademarks and registered trademarks used in this report are the property of
West Pharmaceutical Services, Inc., unless noted otherwise. Exubera® is a
registered trademark of Pfizer, Inc. Teflon® is a registered trademark of E.I.
DuPont de Nemours and Company. Crystal Zenith® is a registered trademark of
Daikyo Seiko, Ltd.
On July
6, 2009, we acquired certain business assets of Plastef Investissements SA
(“Plastef”), a France-based developer and manufacturer of drug delivery devices.
For additional details regarding this acquisition, see Note 2, Acquisition, to our
consolidated financial statements.
West
maintains a website at www.westpharma.com. Our
Annual Report on Form 10-K, Quarterly Reports on Form 10-Q, Current Reports on
Form 8-K and amendments to those reports filed or furnished pursuant to Section
13(a) or 15(d) of the Securities Exchange Act of 1934 are available on our
website under the Investors –
SEC Filings caption as soon as reasonably practical after we
electronically file the material with, or furnish it to, the Securities and
Exchange Commission (SEC). These filings are also available to the public over
the Internet at the SEC’s website at www.sec.gov. You may also
read and copy any document we file at the SEC’s Public Reference Room at 100 F.
Street, N.E., Washington, D.C. 20549. Please call the SEC at
1-800-SEC-0330 for further information on the Public Reference
Room.
Throughout
this Form 10-K, we “incorporate by reference” certain information from parts of
other documents filed with the SEC and from our Proxy Statement for the 2010
Annual Meeting of Shareholders (“2010 Proxy Statement”), which will be filed
with the SEC within 120 days following the end of our 2009 fiscal
year. Our 2010 Proxy Statement will be available on our website on or
about March 31, 2010, under the caption Investors — Proxy
Materials.
Information
about our corporate governance, including our Corporate Governance Principles
and Code of Business Conduct, as well as information about our Directors, Board
Committees, Committee Charters, and instructions on how to contact the Board is
available on our website under the Investors — Corporate Governance
caption. Information relating to the West Pharmaceutical Services
Dividend Reinvestment Plan is also available on our website under the Investors — Dividend Reinvestment
Program caption. We will provide any of the foregoing
information without charge upon written request to John R. Gailey III, Vice
President, General Counsel and Secretary, West Pharmaceutical Services, Inc.,
101 Gordon Drive, Lionville, PA 19341.
3
Business Segments
During
the years presented, our business was conducted through two reportable segments:
Pharmaceutical Systems and Tech Group. Comparative segment revenues
and related financial information for 2009, 2008 and 2007 are presented in a
table contained in Note 6,
Segment Information, to our consolidated financial statements and are
discussed within Results of
Operations in the Management’s Discussion and Analysis
of Financial Condition and Results of Operations section of this 2009
Form 10-K. Intersegment sales are eliminated in consolidation.
Pharmaceutical Systems Segment
Our
Pharmaceutical Systems segment designs, manufactures and sells a variety of
packaging components and systems used in parenteral drug delivery for the
pharmaceutical, biopharmaceutical and generic industries. The primary
components we manufacture are subject to regulatory oversight within our
customers’ manufacturing facilities. We have manufacturing facilities
in North and South America, Europe and Asia Pacific, with affiliated companies
in Mexico and Japan. See Item 2, Properties, for additional
information on our manufacturing sites.
Our
Pharmaceutical Systems segment consists of two operating segments — Americas and
Europe/Asia Pacific — which are aggregated for reporting purposes because they
have similar economic characteristics, as well as similar products,
manufacturing processes, customer objectives, distribution procedures and
regulatory requirements.
Our
Pharmaceutical Systems business is composed of the following product
lines:
Pharmaceutical
packaging
|
·
|
Elastomeric
stoppers and discs, which serve as primary closures for pharmaceutical
vials.
|
|
·
|
Secondary
closures for pharmaceutical vials called Flip-Off® aluminum seals,
consisting of an aluminum seal and a removable plastic button, and in some
applications, just an aluminum
seal.
|
|
·
|
Elastomeric
plungers, needle shields and tip caps to fit most standard prefilled
syringes and combination seals for dental cartridges and pen delivery
systems.
|
|
·
|
Pharmaceutical
containers, closures and dispensers, including the West Ready Pack™
system.
|
|
·
|
Enhanced
component processing: NovaPure™, Envision™, VeriSure™, Westar® RS
(ready-to-sterilize) and Westar® RU
(ready-to-use).
|
|
·
|
Daikyo
Crystal Zenith® RU prefillable syringe
system.
|
Disposable medical
components
|
·
|
Elastomeric
components for blood collection systems, as well as flashback bulbs and
sleeve stoppers for intravenous dispensing
systems.
|
|
·
|
Elastomer
and co-molded elastomer/plastic components for infusion and intravenous
systems.
|
|
·
|
Non-filled
syringe components.
|
|
·
|
Dropper
bulbs for applications such as eye, ear and nasal drops, diagnostic
products and dispensing systems.
|
Safety and administration
systems
|
·
|
Sterile
devices for the reconstitution, transfer and administration of drug
products, including patented products such as the Mixject™, Mix2Vial™ and
vial adapters.
|
4
|
·
|
NovaGuard™
passive safety needle system.
|
Laboratory and other
services
|
·
|
Extractables
and leachables testing, package/container testing, method
development/validation, stability testing, process development and problem
resolution.
|
Sales of
pharmaceutical packaging components represented approximately 60%, 59% and 57%
of consolidated net sales for 2009, 2008 and 2007, respectively. Disposable
medical components sales, as a percent of consolidated net sales, were 10%, 10%
and 12% for 2009, 2008 and 2007, respectively.
Products
and services recently brought to market are the Daikyo Crystal Zenith luer lock
syringe, Envisionand the West Ready Pack system. The Daikyo Crystal Zenith
syringe is the market’s first silicone-free, ready-to-use prefillable syringe
that offers pharmaceutical and biopharmaceutical companies a total system
solution that can mitigate the risks associated with glass syringes. Crystal
Zenith technology is licensed from Daikyo Seiko, Ltd. West’s Envision components
(plungers and stoppers) are inspected by an automated vision inspection system
to ensure they meet enhanced quality specifications for visible and subvisible
particulate and contamination. The West Ready Pack system is a one-source
solution ideal for pharmaceutical research and development and clinical work.
Each system comes with West stoppers, Flip-Off seals and vials conveniently
packaged in small volumes. Because the components are delivered ready-to-use,
component preparation is eliminated from the customer’s processing, saving them
time and money.
Our
tamper-evident Flip-Off seals consist of a metal overseal and a molded plastic
cap that is removed in order to permit needle access to the drug-vial
contents. These are sold in a wide range of sizes and colors to meet
customers’ needs for product identification and differentiation. The seals can
be provided using proprietary printing and embossing technology for multiple
layers of protection, such as point-of-use instructions, item-level information
such as vial contents, drug dosage and strength, and cautionary statements that
can serve as counterfeiting deterrence.
Elastomeric
components are offered in a variety of standard and customer-specific
configurations and formulations and are available with advanced barrier films
and coatings to enhance their performance. West FluroTec® coating is a film that
is applied using a patented molding process to reduce the risk of product loss
by contamination, enhance seal integrity and protect the shelf life of packaged
drugs. We also apply a Teflon® coating to the surface of stoppers and plungers
to improve compatibility between the closure and the drug. B2-Coating is a
coating applied to the surface of stoppers and plungers using a patented process
that eliminates the need for conventional silicone application. It helps
manufacturers reduce product rejections due to trace levels of silicone
molecules found in non-coated packaged drug compounds. FluroTec and B2-Coating
technologies are licensed from Daikyo Seiko, Ltd.
Our
VeriSure components are an example of how laboratory services can be combined
with a product offering. These components allow pharmaceutical and
biopharmaceutical companies to navigate the complex task of extractables
identification and the related analysis for qualifying a drug product’s
container/closure system more efficiently. The customer will receive a
Certificate of Analysis with each shipment of components. Also, with a known
extractables profile, customers can begin the design of leachables studies on a
quicker basis, a process which our analytical laboratory services can
support.
In
addition, our post-manufacturing processes, Westar RS and Westar RU, are
documented and fully validated procedures for washing and siliconizing stoppers
and syringe components to remove biological materials and endotoxins. Westar RS
prepares components for introduction into the customer’s sterilizer and Westar
RU provides sterilized components. The Westar processes increase the overall
efficiency of injectable drug production by outsourcing component processing,
thereby eliminating steps otherwise required in each of our customers’
manufacturing processes, and assure compliance with the latest regulatory
requirements for component preparation.
5
Medimop
Medical Projects, Ltd. (“Medimop”), one of our wholly owned subsidiaries, is a
leader in the world market for transfer, mixing and administration systems for
injectable pharmaceuticals. Many injectable drug products are produced as
freeze-dried powders in order to preserve product efficacy during shipment and
storage. These products must be reconstituted, typically by diluting the powder
with sterile water or other diluent at the point of use. All Medimop
products marketed in the United States are cleared by the U.S. Food and Drug
Administration (FDA). In addition, many Medimop products are protected by
patents.
As an
adjunct to our Pharmaceutical Systems products, we offer contract analytical
laboratory services for testing and evaluating primary drug packaging components
and their compatibility with the contained drug formulation. West Analytical
Services provides us and our customers with in-depth knowledge and analysis of
the interaction and compatibility of drug products with elastomer, glass and
plastic packaging components. Our analytical laboratories also provide
specialized testing for complete drug delivery systems.
Tech Group Segment
Our Tech
Group segment is a global custom injection molder with over 40 years of
experience, offering contract manufacturing solutions for the healthcare and
consumer industries. This segment has manufacturing operations in the U.S.,
Puerto Rico and Ireland. See Item 2, Properties, for additional
information on our manufacturing sites.
Our Tech
Group segment consists of two operating segments — Americas and Europe — which
are aggregated for reporting purposes because they have similar economic
characteristics, as well as similar products, manufacturing processes, customer
objectives, distribution procedures and regulatory requirements.
The Tech
Group is committed to producing the highest quality injection molded components
and devices, which include unique components for surgical, ophthalmic,
diagnostic and drug delivery systems, such as contact lens storage kits, pill
dispensers and disposable blood collection systems, as well as various personal
care and consumer products. The Tech Group’s record of success includes
manufacturing and assembly of systems and devices used for nasal, oral,
pulmonary and injectable delivery of drugs used to treat diseases affecting
people around the world.
Sales of
healthcare devices represent approximately 17%, 16% and 18% of consolidated net
sales for 2009, 2008 and 2007, respectively.
The Tech
Group segment also has expertise in product design and development, including
in-house mold design and construction, an engineering center for developmental
and prototype tooling, process design and validation and high-speed automated
assemblies. Technologies include multi-component molding, in-mold
labeling, ultrasonic welding and clean room molding and device
assembly.
Our
ConfiDose® auto-injector system enhances patient compliance and safety. With
ConfiDose, the needle remains shielded at all times and retracts automatically
after the injection. The system eliminates preparation steps and automates the
injection of drugs, providing patients with a sterile, single-use disposable
system that can be readily used at home. The Tech Group segment is responsible
for manufacturing and assembling commercial quantities of this
system.
2010 Business Operations Realignment
On
December 15, 2009, our Board of Directors approved a realignment of our business
operations into two new divisions, “Pharmaceutical Packaging Systems” and
“Pharmaceutical Delivery Systems,” effective January 1, 2010. Pharmaceutical
Packaging Systems will focus on primary container solutions, including
components for drug packaging and prefillable syringe systems. The division will
consist of our core pharmaceutical packaging products, disposable medical
components, and laboratory and other services. The growth strategy for the
Pharmaceutical Packaging Systems division includes organic growth through market
segmentation, new-product innovation, strategic acquisitions and geographic
expansion.
6
The
Pharmaceutical Delivery Systems division will focus on safety and administration
systems and multi-component systems for drug administration. It will consist of
the injection-molding and assembly business from the current Tech Group segment,
advanced injection systems and other innovation-related products and businesses.
We intend to pursue growth in the Pharmaceutical Delivery Systems division
through the development and commercialization of proprietary multi-component
systems for injectable drug administration and other healthcare
applications.
Restructuring Initiatives
In
December 2007, our Board of Directors approved a restructuring plan for the Tech
Group in an effort to align our plant capacity and workforce with the revised
business outlook and longer-term strategy of focusing the business on
proprietary products. As part of this plan, we implemented a series of
initiatives to reduce operating costs and increase the manufacturing efficiency
of the segment. We incurred a total of $7.5 million in restructuring and related
charges, as part of this plan, through its completion in June 2009.
In
November 2009, we announced restructuring plans for certain business operations
and support functions affecting both of our reporting segments. The
Pharmaceutical Systems plan involves exiting certain specialized laboratory
service offerings due to a change in market demand, reducing support personnel
primarily associated with information technology applications and discontinuing
other non-core initiatives and disposing of the associated assets. The Tech
Group plan is intended to better align our available production capacity with
expected levels of contract manufacturing activity by consolidating
manufacturing operations and support functions. We expect to incur approximately
$9.0 million in restructuring charges and eliminate an estimated 100 positions
as part of these plans. During 2009, Pharmaceutical Systems incurred actual
charges of $7.0 million and Tech Group incurred charges of $0.6 million, with
the balance expected to be incurred through 2010 as the associated activities
are completed. For additional details, see Note 4, Restructuring and Other
Items, to our consolidated financial statements.
We have
significant operations outside the U.S. They are managed through the
same business segments as our U.S. operations – Pharmaceutical Systems and Tech
Group. Sales outside of the U.S. account for approximately 52% of
consolidated net sales. For a geographic breakdown of sales, see the table in
Note 6, Segment
Information, to the consolidated financial statements.
Although
the general business processes are similar to the domestic business,
international operations are exposed to additional risks. These risks
include currency fluctuations relative to the U.S. dollar, multiple tax
jurisdictions and, particularly in Latin and South America and Israel, political
and social issues that could destabilize local markets and affect the demand for
our products.
Depending
on the direction of change relative to the U.S. dollar, foreign currency values
can increase or decrease the reported dollar value of our net assets and results
of operations. See the discussion under the caption Summary of Significant Accounting
Policies - Foreign Currency Translation in Note 1 to our consolidated
financial statements. We also have exposure to the impact of changes in currency
exchange rates on assets and liabilities that are not denominated in the
functional currency of the respective subsidiary. We attempt to minimize some of
our exposure to these exchange rate fluctuations through the use of forward
exchange contracts and foreign currency denominated debt. This
activity is generally discussed in Note 1 under the caption Summary of Significant Accounting
Policies – Financial Instruments and in Note 14, Derivative Financial
Instruments, to our consolidated financial statements in this 2009 Form
10-K.
Raw Materials
We use
three basic raw materials in the manufacture of our products: elastomers,
aluminum and plastic. Elastomers include both natural and synthetic materials.
We have access to adequate supplies of these raw materials to meet our
production needs through agreements with suppliers.
7
We employ
a supply-chain management strategy in our reporting segments, which involves
purchasing from integrated suppliers that control their own sources of supply.
This strategy has reduced the number of our raw material suppliers. Due to
regulatory control over our production processes, and the cost and time involved
in qualifying suppliers, we rely on single-source suppliers for many critical
raw materials. This strategy increases the risk that our supply lines may be
interrupted in the event of a supplier production problem. These risks are
managed, where possible, by selecting suppliers with multiple manufacturing
sites, rigid quality control systems, surplus inventory levels and other methods
of maintaining supply in case of an interruption in production, and therefore we
foresee no significant availability problems in the near future.
Intellectual Property Rights
Patents
and other proprietary rights are important to our business. We own or license
numerous patents and have patent applications pending in the U.S. and in other
countries that relate to various aspects of our products. In addition, key
value-added and proprietary products and processes are licensed from our
Japanese affiliate, Daikyo Seiko Ltd. Our patents and other proprietary rights
have been useful in establishing our market share and in the growth of our
business, and are expected to continue to be of value in the future, as we
continue to develop proprietary products. Although important in the aggregate,
we do not consider our business to be materially dependent on any individual
patent.
We also
rely heavily on trade secrets, manufacturing know-how and continuing
technological innovations, as well as in-licensing opportunities, to maintain
and further develop our competitive position, particularly in the area of
formulation development and tooling design.
Although
our Pharmaceutical Systems business is not inherently seasonal, sales and
operating profit in the second half of the year are typically lower than the
first half primarily due to scheduled plant shutdowns in conjunction with our
customers’ production schedules and the year-end impact of holidays on
production. During the shutdown periods, maintenance procedures are performed
and vacations are taken by production employees.
Working Capital
We are
required to carry significant amounts of inventory to meet customer
requirements. Other agreements also require us to purchase inventory in bulk
orders, which increases inventory levels but decreases the risk of supply
interruption. Levels of inventory are also influenced by the seasonal patterns
addressed above. For a more detailed discussion of working capital, please see
the discussion in Management’s
Discussion and Analysis of Financial Condition and Results of Operations
under the caption Financial Condition, Liquidity and
Capital Resources.
Our
Pharmaceutical Systems customers include practically every major branded
pharmaceutical, generic and biopharmaceutical company in the world.
Pharmaceutical Systems components and other products are sold to major
pharmaceutical, biotechnology and hospital supply/medical device companies,
which incorporate them into their products for distribution to the ultimate
end-user.
With
extensive experience in contract manufacturing, our Tech Group segment sells to
many of the world’s largest medical device and pharmaceutical companies and to
large customers in the personal care and food-and-beverage industries. Tech
Group components generally are incorporated into our customers’ manufacturing
lines for further processing or assembly. West’s products and services are
distributed primarily through our own sales force and distribution network, with
limited use of contract sales agents and regional distributors.
Our ten
largest customers accounted for 38.3% of our consolidated net sales in 2009, but
not one of these customers individually accounted for more than 10% of net
sales.
8
Order Backlog
At
December 31, 2009, our order backlog was $238.7 million, most of which is
expected to be filled during fiscal year 2010. The order backlog was $230.1
million at the end of 2008. The increase is primarily due to foreign currency
translation. Order backlog includes firm orders placed by customers for
manufacture over a period of time according to their schedule or upon
confirmation by the customer. We also have contractual arrangements with a
number of our customers, and products covered by these contracts are included in
our backlog only as orders are received.
We
compete with several companies across our Pharmaceutical Systems product lines.
However, we believe that we supply a major portion of the U.S. market for
pharmaceutical elastomer and metal packaging components and have a significant
share of the European market for these components. Because of the special nature
of our pharmaceutical packaging components and our long-standing participation
in the market, competition is based primarily on product design and performance,
although total cost is becoming increasingly important as pharmaceutical
companies continue with aggressive cost-control programs across their
operations.
We
differentiate ourselves from our competition as a "full-service, value-added"
global supplier that can provide pre-sale formula and engineering development,
analytical services, regulatory expertise and post-manufacturing technologies,
as well as after-sale technical support. Customers also appreciate the global
scope of West’s manufacturing capability and our ability to produce many
products at multiple sites.
Our Tech
Group business is in very competitive markets for both healthcare and consumer
products. The competition varies from smaller regional companies to large global
molders that command significant market shares. There are extreme cost pressures
and many of our customers look off-shore to reduce cost. We differentiate
ourselves by leveraging our global capability and by employing new technologies
such as high-speed automated assembly, insert-molding, multi-shot molding and
expertise with multiple-piece closure systems. Because of the more demanding
regulatory requirements in the medical device component area, there are a
smaller number of other competitors, mostly large-scale companies. We compete
for this market on the basis of our reputation for quality and reliability in
engineering and project management, diverse contract manufacturing capabilities
and knowledge of and experience in complying with FDA requirements.
Research and Development Activities
We
maintain our own research-scale production facilities and laboratories for
developing new products and offer contract engineering design and development
services to assist customers with new product development. Our quality control,
regulatory and laboratory testing capabilities are used to ensure compliance
with applicable manufacturing and regulatory standards for primary and secondary
pharmaceutical packaging components. The engineering departments are responsible
for product and tooling design and testing, and for the design and construction
of processing equipment. The primary responsibility of our innovation group is
seeking new opportunities in injectable packaging and delivery systems, most of
which will be manufactured by our Tech Group segment and marketed by our
Pharmaceutical Systems segment. Research and development spending will continue
to increase as we pursue innovative strategic platforms in prefillable syringe,
injectable container, advanced injection and safety and administration
systems.
We spent
$18.0 million in 2009, $17.2 million in 2008 and $14.0 million in 2007 on
research and development for the Pharmaceutical Systems segment. The Tech Group
segment incurred research and development expenses of $1.9 million, $1.5
million, and $2.1 million in the years 2009, 2008 and 2007,
respectively.
Commercial
development of our new products and services for medical and pharmaceutical
applications commonly requires several years. New products that we develop may
require separate approval as medical devices, and products that are intended to
be used in packaging and delivery of pharmaceutical products will be subject to
both customer acceptance of our products and regulatory approval of the
customer’s products following our development period.
9
Environmental Regulations
We are
subject to various federal, state and local provisions regulating the discharge
of materials into the environment or otherwise relating to the protection of the
environment. Our compliance with these laws and regulations has not had a
material impact on our financial position or results of operations. There were
no material capital expenditures for environmental control facilities in fiscal
year 2009 and there are no material expenditures planned for such purposes in
fiscal year 2010.
As of
December 31, 2009, we employed 6,408 people in our operations throughout the
world.
ITEM 1A. RISK FACTORS.
The
statements in this section describe major risks to our business and should be
considered carefully. In addition, these statements constitute our cautionary
statements under the Private Securities Litigation Reform Act of
1995.
Our
disclosure and analysis in this 2009 Form 10-K contains some forward-looking
statements that are based on management’s beliefs and assumptions, current
expectations, estimates and forecasts. We also provide forward-looking
statements in other materials we release to the public as well as oral
forward-looking statements. Such statements give our current expectations or
forecasts of future events. They do not relate strictly to historical or current
facts. We have attempted, wherever possible, to identify forward-looking
statements by using words such as “estimate,” “expect,” “intend,” “believe,”
“plan,” “anticipate” and other words and terms of similar meaning. In
particular, these include statements relating to future actions, business plans
and prospects, new products, future performance or results of current or
anticipated products, sales efforts, expenses, interest rates, foreign-exchange
rates, economic effects, the outcome of contingencies, such as legal
proceedings, and financial results.
Many
of the factors that will determine our future results are beyond our ability to
control or predict. Achievement of future results is subject to known or unknown
risks or uncertainties, and therefore, actual results could differ materially
from past results and those expressed or implied in any forward-looking
statement. You should bear this in mind as you consider forward-looking
statements.
We
undertake no obligation to publicly update forward-looking statements, whether
as a result of new information, future events or otherwise. We also refer you to
further disclosures we make on related subjects in our Quarterly Reports on Form
10-Q and 8-K reports to the Securities and Exchange Commission.
Our
operating results may be adversely affected by unfavorable economic and market
conditions.
The
current uncertainty in the global economy, including the continuing effects of
recession or slow economic growth in the U.S., Europe and Asia, may negatively
affect our operating results. Examples of the effects of these continuing global
economic challenges include: our suppliers’ and our customers’ inability to
access the credit markets at commercially reasonable rates; reduction in sales
due to customers decreasing their inventories in the near-term or long-term or
due to liquidity difficulties; reduction in sales due to shortages of materials
we purchase from our suppliers; reduction in research and development efforts
and expenditures by our customers; our inability to hedge our currency and raw
material risks sufficiently or at commercially reasonable prices; insolvency of
suppliers or customers; inflationary pressures on our supplies or our products;
and increased expenses due to growing taxation of corporate profits or revenues.
Our operating results in one or more geographic regions may also be affected by
uncertain or changing economic conditions within that region. If global economic
and market conditions, or economic conditions in the U.S., Europe or Asia remain
uncertain or weaken further, we may experience material adverse impacts on our
business, financial condition and results of operations.
10
We
are exposed to credit risk on accounts receivable and certain prepayments made
in the normal course of business. This risk is heightened during periods when
economic conditions worsen.
A
substantial majority of our outstanding trade receivables are not covered by
collateral or credit insurance. In addition, we have made prepayments associated
with insurance premiums and other advances in the normal course of business.
While we have procedures to monitor and limit exposure to credit risk on trade
receivables and other current assets, there can be no assurance such procedures
will effectively limit our credit risk and avoid losses, which could have a
material adverse effect on our financial condition and operating
results.
We
are exposed to fluctuations in the market values and the risk of loss of our
investment portfolio.
Our
available cash and cash equivalents are held in bank deposits, money market
funds and other short-term investments. We have funds in our operating accounts
that are with third-party financial institutions. These balances in the U.S. may
exceed the FDIC (Federal Deposit Insurance Corporation) insurance limits. While
we monitor the cash balances in our operating accounts, and adjust the balances
as appropriate, we could lose this cash or be unable to withdraw it in a timely
manner if the underlying financial institutions fail. Although we have not
recognized any material losses on our cash, cash equivalents and other cash
investments, future declines in their market values or other unexpected losses
could have a material adverse effect on our financial condition and operating
results.
Our
sales and profitability depend to a large extent on the sale of drug products
delivered by injection. If the products developed by our customers in the future
use another delivery system, our sales and profitability could
suffer.
Our
business depends to a substantial extent on customers' continued sales and
development of products that are delivered by injection. If our customers fail
to continue to sell, develop and deploy new injectable products or we are unable
to develop new products that assist in the delivery of drugs by alternative
methods, our sales and profitability may suffer.
If
we are unable to provide comparative value advantages, timely fulfillment of
customer orders, or resist pricing pressure, we will have to reduce our prices,
which may negatively impact our profit margins.
We
compete with several companies across our major product lines. Because of the
special nature of these products, competition is based primarily on product
design and performance, although total cost is becoming increasingly important
as pharmaceutical companies continue with aggressive cost control programs
across their entire operations. Competitors often compete on the basis of price.
We differentiate ourselves from our competition as a "full-service value-added"
supplier that is able to provide pre-sale compatibility studies and other
services and sophisticated post-sale technical support on a global basis.
However, we face continued pricing pressure from our customers and competitors.
If we are unable to resist or to offset the effects of continued pricing
pressure through our value-added services, improved operating efficiencies and
reduced expenditures, or if we have to reduce our prices, our sales and
profitability may suffer.
If we are
unable to expand our production capacity at our European and Asian facilities,
there may be a delay in fulfilling or we may be unable to fulfill customer
orders and this could potentially reduce our sales and our profitability may
suffer.
We
have significant indebtedness and debt service payments which could negatively
impact our liquidity.
We owe
substantial debts and have to commit significant cash flow to debt service
requirements. The level of our indebtedness, among other things,
could:
|
·
|
make
it difficult for us to obtain any necessary future financing for working
capital, capital expenditures, debt service requirements or other
purposes;
|
11
|
·
|
limit
our flexibility in planning for, or reacting to changes in, our business;
and
|
|
·
|
make
our financial results and share value more vulnerable in the event of a
downturn in our business.
|
Our
ability to meet our debt service obligations and to reduce our total
indebtedness depends on the results of our product development efforts, our
future operating performance, our ability to generate cash flow from the sale of
our products and on general economic, financial, competitive, legislative,
regulatory and other factors affecting our operations. Many of these factors are
beyond our control and our future operating performance could be adversely
affected by some or all of these factors.
If we
incur new indebtedness in the future, the related risks that we now face could
intensify. Whether we are able to make required payments on our outstanding
indebtedness and satisfy any other future debt obligations will depend on our
future operating performance and our ability to obtain additional debt or equity
financing.
Our
intellectual property assets may not prevent competitive offerings.
Our
patents, trademarks and other intellectual property may not prevent competitors
from independently developing products and services similar to or duplicative to
ours, nor can there be any assurance that the resources invested by us to
protect our intellectual property will be sufficient or that our intellectual
property portfolio will adequately deter misappropriation or improper use of our
technology. In addition, we may be the target of aggressive enforcement of
patents held by third parties. Any litigation regarding our intellectual
property rights could be time-consuming and costly and the results could be
unpredictable.
We
are subject to regulation by governments around the world, and if these
regulations are not complied with, existing and future operations may be
curtailed, and we could be subject to liability.
The
design, development, manufacturing, marketing and labeling of certain of our
products and our customers’ products that incorporate our products are subject
to regulation by governmental authorities in the U.S., Europe and other
countries, including the FDA and the European Medicines Agency. The regulatory
process can result in required modification or withdrawal of existing products
and a substantial delay in the introduction of new products. Also, it is
possible that regulatory approval may not be obtained for a new product. In
addition, our analytical laboratories perform certain contract services for drug
manufacturers and are subject to the FDA's current good manufacturing practices
regulations. We must also register as a contract laboratory with the FDA and are
subject to periodic inspections by the FDA. The Drug Enforcement Administration
has licensed our contract analytical laboratories to handle and store controlled
substances. Failure to comply with applicable regulatory requirements can result
in actions that could adversely affect our business and financial
performance.
Our
business may be adversely affected by changes in the regulation of drug products
and devices.
An effect
of the governmental regulation of our customers’ drug products, devices, and
manufacturing processes is that compliance with regulations makes it costly and
time-consuming for customers to substitute or replace components and devices
produced by one supplier with those from another. In general terms, regulation
of our customers’ products that incorporate our components and devices has
increased over time. However, if the applicable regulations were to
be modified in a way that reduced the cost and time involved for customers to
substitute one supplier’s components or devices for those made by another, it is
likely that the competitive pressure on us would increase and adversely affect
our sales and profitability.
12
Our
business may be adversely affected by risks typically encountered in
international operations.
We
conduct business in most of the major pharmaceutical markets in the world. Sales
outside the U.S. account for approximately 52% of consolidated net sales.
Virtually all of these sales and related operating costs are denominated in the
currency of the local country and translated into U.S. dollars, which can result
in significant increases or decreases in the amount of those sales or earnings.
The main currencies, to which we are exposed, besides the U.S. dollar, are the
Euro, British Pound, Danish Krone and Singapore Dollar. The exchange rates
between these currencies and the U.S. dollar in recent years have fluctuated
significantly and may continue to do so in the future. In addition to
translation risks, we incur currency transaction gains or losses when we or one
of our subsidiaries enters into a purchase or sales transaction in a currency
other than that entity’s local currency.
International
operations are also exposed to the following risks: transportation delays and
interruptions; political and economic instability and disruptions; imposition of
duties and tariffs; import and export controls; the risks of divergent business
expectations or cultural incompatibility inherent in establishing and
maintaining operations in foreign countries; difficulties in staffing and
managing multi-national operations; labor strikes and/or disputes; and
potentially adverse tax consequences. Limitations on our ability to enforce
legal rights and remedies with third parties or our joint venture partners
outside of the U.S. could also create exposure. In addition, we may not be able
to operate in compliance with foreign laws and regulations, or comply with
applicable customs, currency exchange control regulations, transfer pricing
regulations or any other laws or regulations to which we may be subject, in the
event that these laws or regulations change.
Any of
these events could have an adverse effect on our international operations in the
future by reducing the demand for our products, decreasing the prices at which
we can sell our products or otherwise have an adverse effect on our financial
condition, results of operations and cash flows.
Raw
material and energy prices have a significant impact on our profitability. If
raw material and/or energy prices increase, and we cannot pass those price
increases on to our customers, our profitability and financial condition may
suffer.
We use
three basic raw materials in the manufacture of our products: elastomers (which
include synthetic and natural material), aluminum and plastic. In addition, our
manufacturing facilities consume a wide variety of energy products to fuel, heat
and cool our operations. Supply and demand factors, which are beyond our
control, generally affect the price of our raw materials and utility costs. If
we are unable to pass along increased raw material prices and energy costs to
our customers, our profitability, and thus our financial condition, may be
adversely affected. The prices of many of these raw materials and utilities are
cyclical and volatile. For example, the prices of certain commodities,
particularly petroleum-based raw materials, have in the recent past exhibited
rapid changes, increasing the cost of synthetic elastomers and plastic. While we
generally attempt to pass along increased costs to our customers in the form of
sales price increases, historically there has been a time delay between raw
material and/or energy price increases and our ability to increase the prices of
our products. In some circumstances, we may not be able to increase the prices
of our products due to competitive pressure and other factors.
Disruptions
in the supply of key raw materials and difficulties in the supplier
qualification process, could adversely impact our operations.
We employ
a supply chain management strategy in our reporting segments, which involves
purchasing from integrated suppliers that control their own sources of supply.
This strategy has reduced the number of raw material suppliers used by us. This
increases the risk that our supply lines may be interrupted in the event of a
supplier production problem or financial difficulties. If one of our suppliers
is unable to supply materials needed for our products or our strategies for
managing these risks are unsuccessful, we may be unable to complete the process
of qualifying new replacement materials for some programs in time to meet future
production needs. Prolonged disruptions in the supply of any of our key raw
materials, difficulty completing qualification of new sources of supply, or in
implementing the use of replacement materials or new sources of supply could
have a material adverse effect on our operating results, financial condition or
cash flows.
13
Our
operations must comply with environmental statutes and regulations, and any
failure to comply could result in extensive costs which would harm our
business.
The
manufacture of some of our products involves the use, transportation, storage
and disposal of hazardous or toxic materials and is subject to various
environmental protection and occupational health and safety laws and regulations
in the countries in which we operate. This has exposed us in the past, and could
expose us in the future, to risks of accidental contamination and events of
non-compliance with environmental laws. Any such occurrences could result in
regulatory enforcement or personal injury and property damage claims or could
lead to a shutdown of some of our operations, which could have an adverse effect
on our business and results of operations. We currently incur costs to comply
with environmental laws and regulations and these costs may become more
significant.
A
loss of key personnel or highly skilled employees could disrupt our
operations.
Our
executive officers are critical to the management and direction of our
businesses. Our future success depends, in large part, on our ability to retain
these officers and other capable management personnel. With the exception of our
chief executive officer, in general, we do not enter into employment agreements
with our executive officers. We have entered into severance agreements with our
officers that allow those officers to terminate their employment under
particular circumstances, such as a change of control affecting our company.
Although we believe that we will be able to attract and retain talented
personnel and replace key personnel should the need arise, our inability to do
so could disrupt the operations of the unit affected or our overall operations.
In addition, because of the complex nature of many of our products and programs,
we are generally dependent on an educated and highly skilled engineering staff
and workforce. Our operations could be disrupted by a shortage of available
skilled employees.
The
disruption of our normal business activities as a result of the implementation
of our new enterprise resource planning system and updates to shop floor systems
could have an adverse effect on our business and results of
operations.
During
the second quarter of 2008, we successfully replaced our financial reporting,
cash disbursement and order-to-cash systems in our North American operations
with a new enterprise resource planning (“ERP”) system. Phase two of the ERP
project, which focused on the replacement of planning and manufacturing systems,
as well as updates to shop floor systems, commenced in late 2008 and was
completed in the fourth quarter of 2009.
Our ERP
system is critical to our ability to accurately and efficiently maintain our
books and records, record transactions, provide critical information to our
management and prepare our financial statements. We have invested significant
capital and human resources in the design and implementation of this system. The
inability of the ERP and shop floor systems to work as anticipated could
adversely affect our ability to process and ship orders, provide services and
customer support, bill and track customers, fulfill contractual obligations and
file quarterly or annual reports with the SEC in a timely manner. The resulting
disruptions to our business could adversely affect our results of operations,
financial condition and cash flows.
Our
acquisition strategy may not yield the expected benefits.
We are
always analyzing our prospects for growth by acquisition of companies or other
entities with developing technology and other assets that we believe would be
helpful to our growth and profit. The integration of any or all completed or
planned acquisitions may not be successful. The tax and other benefits expected
from the acquisitions that we have entered into or may enter into may not
materialize due to changes in applicable laws or regulations, uncertainties in
the application of laws or regulations or the inability to achieve expected
levels of sales and operating profit.
14
Our
recent realignment of our business units may not deliver the expected
growth.
Effective
January 1, 2010, we realigned our business operations into two divisions,
“Pharmaceutical Packaging Systems” and “Pharmaceutical Delivery Systems.” Our
new Pharmaceutical Delivery Systems division plans to pursue growth through the
development and commercialization of proprietary multi-component systems for
injectable drug administration and other healthcare applications. Although we
believe that this effort will be successful, this division’s growth could suffer
if proprietary systems cannot be developed quickly enough or on a cost-efficient
basis or if they are not of sufficient commercial value. Growth in this division
could also suffer as a result of soft demand by our customers or if anticipated
markets for these products do not develop. Additionally, our Pharmaceutical
Delivery Systems division will be subject to further regulatory oversight than
our business has historically been subject to, and there can be no guarantee
that we will be able to successfully meet the new regulatory obligations in a
commercially reasonable manner.
The
uncertain effects of potential climate change legislation could lead to
significantly increased costs.
If
legislation or regulations are enacted or promulgated in the U.S., Europe or
Asia or any other jurisdictions in which we do business that limit or reduce
allowable greenhouse gas emissions and other emissions, such restrictions could
have a significant effect on our operating and financial decisions, including
those involving capital expenditures to reduce emissions, and our results of
operations. Our manufacturing operations may not be able to operate as planned
if we are not able to comply with new legal and regulatory legislation around
climate change, or it may become too costly to operate in a profitable manner.
Additionally, suppliers’ added expenses could be passed on to us in the form of
higher prices and we may not be able to pass on such expenses to our customers
through price increases.
The
uncertain effects of potential healthcare legislation in the U.S. could lead to
significantly increased costs and other unforeseen consequences.
Political,
economic and regulatory influences are subjecting the healthcare industry in the
U.S. to potential fundamental changes. The effects of this potential legislation
and any regulations that emanate from it are uncertain at this time. However,
based on drafts of the legislation that have passed in the U.S. Senate and the
U.S. House of Representatives and proposals put forth by the Obama
Administration, we expect that this potential reform could result in significant
costs for us and also for our customers. One proposal, an excise tax on medical
device companies, may result in a significant increase in the tax burden on our
new Pharmaceutical Delivery Systems division. In addition, this reform may
impose enhanced benefit requirements for our employees which could increase our
labor costs significantly. Until legislation is final, however, the full range
of consequences stemming from this reform is difficult to predict.
As of the
filing of this annual report on Form 10-K, there were no unresolved comments
from the Staff of the Securities and Exchange Commission.
15
ITEM 2. PROPERTIES.
Our
corporate headquarters are located in a leased building at 101 Gordon Drive,
Lionville, Pennsylvania. This building also houses our North American
sales and marketing, administrative support and customer service
functions.
The
following table summarizes production facilities by segment and geographic
region. All facilities shown are owned except where otherwise
noted.
|
Pharmaceutical Systems
|
|
|
Manufacturing:
|
Contract
Analytical Laboratory:
|
|
North
American Operations
|
North
American Operations
|
|
United
States
Clearwater,
FL (1)
Jersey
Shore, PA
Kearney,
NE
Kinston,
NC
Lititz,
PA
St.
Petersburg, FL
South
American Operations
Brazil
Sao
Paulo
European
Operations
Denmark
Horsens
England
St.
Austell
France
Le
Nouvion
Le
Vaudreuil (2)
Germany
Eschweiler (1)
Stolberg
Serbia
Kovin
Asia
Pacific Operations
China
Shanghai
Singapore
Jurong
|
United States
Lionville, PA (2)
Maumee, OH
Mold-and-Die
Tool Shops:
North
American Operations
United
States
Upper Darby, PA (2)
European Operations
England
Bodmin (2)
Tech Group
Manufacturing:
North
American Operations
United
States
Frankfort,
IN (2)
Grand
Rapids, MI
Montgomery,
PA (2)
Phoenix,
AZ (2)
Scottsdale,
AZ (2)
(3)
Tempe,
AZ (2)
Williamsport,
PA
Puerto
Rico
Cayey
European
Operations
Ireland
Dublin (2)
Mold-and-Die
Tool Shop:
European
Operations
Denmark
Roskilde (2)
|
|
(1)
|
This
manufacturing facility is also used for research and development
activities.
|
|
(2)
|
This
facility is leased in whole or in
part.
|
|
(3)
|
This
manufacturing facility is also used for mold and die
production.
|
Our
Pharmaceutical Systems segment also owns facilities located in Ra’anana, Israel
and Athens, Texas used for research and development activities. Sales offices in
various locations are leased under short-term arrangements.
16
Our
manufacturing production facilities are well maintained and are operating
generally on two or three shifts. During the last two years, we made
significant strides in increasing our plant capacity in Germany, Serbia, France,
Singapore and the U.S. As part of our effort to increase manufacturing capacity,
we continue to move forward in establishing a manufacturing presence in the
Peoples Republic of China. During 2009, we completed construction of our China
plastic components facility and started commercial production. We continue to
evaluate opportunities for constructing rubber manufacturing facilities in China
and India.
ITEM
3. LEGAL
PROCEEDINGS.
None.
ITEM 4. SUBMISSION OF MATTERS TO A VOTE OF SECURITY
HOLDERS.
None.
EXECUTIVE OFFICERS OF THE COMPANY
The
executive officers of the Company are set forth in this table. Each holds the
offices indicated until his successor is chosen and qualified at the regular
meeting of the board of directors to be held immediately following the 2010
Annual Meeting of Shareholders.
|
Name
|
Age
|
Position
|
|
Joseph
E. Abbott
|
57
|
Vice
President since March 2002 and Corporate Controller since July
2000. He was Director of Internal Audit from June 1997 to July
2000.
|
|
Michael
A. Anderson
|
54
|
Vice
President and Treasurer since June 2001. He was Finance
Director, Drug Delivery Systems Division from October 1999 to June 2001,
Vice President, Business Development from July 1997 to October 1999 and
Director of Taxes from July 1992 to April 1997.
|
|
Steven
A. Ellers
|
59
|
President
since June 2005 and Chief Operating Officer since February
2010. Previously, he served as Chief Operating Officer from
June 2005 through July 2008, Executive Vice President from June 2001 to
June 2005 and Chief Financial Officer from April 1998 to July 2000, and he
held numerous positions in operations prior thereto.
|
|
William
J. Federici
|
50
|
Vice
President and Chief Financial Officer since joining the Company in August
2003. He was National Industry Director for Pharmaceuticals of
KPMG LLP (accounting firm) from June 2002 until August 2003 and prior
thereto, an audit partner with Arthur Andersen, LLP.
|
|
John
R. Gailey III
|
55
|
Vice
President since December 1995, General Counsel since May 1994 and
Secretary since November 1991. He served as Corporate Counsel
from 1991 until his appointment as General Counsel.
|
17
|
Heino
Lennartz
|
44
|
President,
Pharmaceutical Packaging Systems Europe Region since February 2010 and,
prior thereto, President, Europe, Pharmaceutical Systems since July
2009. He was Vice President Finance, MIS & Purchasing for
Europe & Asia Pacific from December 2006 until July
2009. Mr. Lennartz was Vice President Corporate Finance of
AIXTRON AG, a leading semiconductor equipment company, from 2003 to 2006
and, prior thereto, held various positions, including Director Business
Systems Europe, at GDX Automotive, a rubber and plastic car body sealing
system supplier.
|
|
Richard
D. Luzzi
|
58
|
Vice
President, Human Resources since June 2002. He served as Vice
President, Human Resources of GS Industries, a steel manufacturer, from
1998 to 2002, Vice President, Human Resources of Lukens Steel from 1993 to
1998, and Vice President, Human Resources of Rockwell International, from
1990 to 1993.
|
|
Donald
A. McMillan
|
51
|
President,
Pharmaceutical Packaging Systems Americas Region since February 2010, and,
prior thereto, President, Americas, Pharmaceutical Systems since July
2008. He was President, North America, Pharmaceutical Systems
Division from October 2005 to July 2008 and held numerous positions of
increasing responsibility prior thereto, including Vice President,
Marketing, North America from September 2002 to October 2005 and Americas
Regional Director from July 1997 to September 2000.
|
|
Donald
E. Morel, Jr., Ph.D.
|
52
|
Chairman
of the Board of the Company since March 2003 and our Chief Executive
Officer since April 2002. He was our President from April 2002
to June 2006 and Chief Operating Officer from May 2001 to April
2002. He was Division President, Drug Delivery Systems from
October 1999 to May 2001, and prior thereto, Group President.
|
|
John
Paproski
|
53
|
President,
Pharmaceutical Delivery Systems since December 2009. He was
Vice President of Innovation, from January 2005 to December 2009 and Vice
President, Global Product Development from August 1996 to January
2005. He has held numerous other operations and engineering
positions within the Company, including Vice President of Rubber
Operations from August 1993 to January 2005 and Director of Manufacturing
Engineering from 1991 to 1993.
|
|
Ron
van Dijk
|
49
|
President,
Pharmaceutical Packaging Systems Asia Pacific Region since February 2010
and, prior thereto, President, Asia Pacific, Pharmaceutical Systems since
July 2009. He has served in a variety of capacities with
increasing responsibility since 1997, including as Manager, Financial
Planning and Analysis Europe from March 1997 to December 2002, Director of
Finance, Europe and Asia Pacific from January 2003 to March 2005, Vice
President Finance and MIS for Europe and Asia Pacific from April 2005 to
September 2006 and Managing Director and Vice President Asia Pacific from
October 2006 to June 2009.
|
18
PART II
ITEM
5. MARKET
FOR REGISTRANT’S COMMON EQUITY, RELATED STOCKHOLDER MATTERS AND ISSUER PURCHASES
OF EQUITY SECURITIES.
Our
common stock is listed on the New York Stock Exchange. The high and low prices
for the stock for each calendar quarter in 2009 and 2008 and full year 2009 and
2008 were as follows:
|
First
Quarter
|
Second
Quarter
|
Third
Quarter
|
Fourth
Quarter
|
Year
|
||||||||||||||||||||||||||||||||||||
|
High
|
Low
|
High
|
Low
|
High
|
Low
|
High
|
Low
|
High
|
Low
|
|||||||||||||||||||||||||||||||
|
2009
|
38.50 | 27.85 | 35.19 | 31.28 | 41.22 | 31.65 | 41.77 | 36.65 | 41.77 | 27.85 | ||||||||||||||||||||||||||||||
|
2008
|
45.47 | 36.96 | 48.92 | 43.04 | 52.00 | 42.26 | 49.60 | 29.52 | 52.00 | 29.52 | ||||||||||||||||||||||||||||||
As of
January 31, 2010, we had 1,210 shareholders of record. There were also 2,741
holders of shares registered in nominee names. Our common stock paid
a quarterly dividend of $0.14 per share in each of the first three quarters of
2008; $0.15 per share in the fourth quarter of 2008 and each of the first three
quarters of 2009; and $0.16 per share in the fourth quarter of
2009.
Issuer
Purchases of Equity Securities
The
following table shows information with respect to purchases of our common stock
made during the three months ended December 31, 2009 by us or any of our
“affiliated purchasers” as defined in Rule 10b-18(a)(3) under the Exchange
Act:
|
Period
|
Total
number of shares purchased (1)(2)(3)
|
Average
price paid per share
|
Total
number of shares purchased as part of publicly announced plans or
programs
|
Maximum
number of shares that may yet be purchased under the plans or
programs
|
||||||||||||
|
October
1 – 31, 2009
|
- | $ | - | - | - | |||||||||||
|
November
1 – 30, 2009
|
575 | 37.44 | - | - | ||||||||||||
|
December
1 – 31, 2009
|
15,111 | 39.57 | - | - | ||||||||||||
|
Total
|
15,686 | $ | 39.49 | - | - | |||||||||||
(1) Includes
654 shares purchased on behalf of employees enrolled in the Non-Qualified
Deferred Compensation Plan for Designated Officers (Amended and Restated
Effective January 1, 2008). Under the plan, Company match
contributions are delivered to the plan’s investment administrator, who upon
receipt, purchases shares in the open market and credits the shares to
individual plan accounts.
(2) Includes
8,223 shares of common stock acquired from employees who tendered already-owned
shares to satisfy the exercise price on option exercises as part of our 2007
Omnibus Incentive Compensation Plan (the “2007 Plan”).
(3) Includes
6,809 shares of common stock acquired from employees who tendered already-owned
shares to satisfy withholding tax obligations on option exercises, as part of
the 2007 Plan.
19
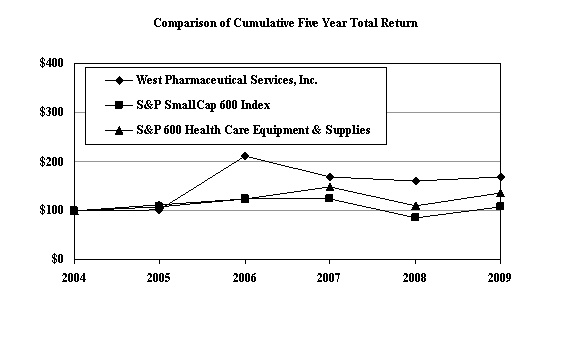
Performance
Graph
The
following graph compares the cumulative total return to holders of our common
stock with the cumulative total return of the Standard & Poor’s SmallCap 600
Index and the Standard & Poor’s 600 Health Care Equipment & Supplies
Industry for the five years ended December 31, 2009. Cumulative total return to
shareholders is measured by dividing total dividends (assuming dividend
reinvestment) plus the per-share price change for the period by the share price
at the beginning of the period. The Company’s cumulative shareholder return is
based on an investment of $100 on December 31, 2004 and is compared to the
cumulative total return of the SmallCap 600 Index and the 600 Health Care
Equipment & Supplies Industry over the period with a like amount
invested.
20
ITEM
6. SELECTED FINANCIAL DATA.
FIVE-YEAR
SUMMARY
West
Pharmaceutical Services, Inc. and Subsidiaries
|
(in
millions, except per share data)
|
2009
|
2008
|
2007
|
2006
|
2005
|
|||||||||||||||
|
SUMMARY
OF OPERATIONS
|
||||||||||||||||||||
|
Net
sales
|
$ | 1,055.7 | $ | 1,051.1 | $ | 1,020.1 | $ | 913.3 | $ | 699.7 | ||||||||||
|
Operating
profit
|
97.5 | 124.1 | 94.9 | 101.0 | 73.4 | |||||||||||||||
|
Income
from continuing operations
|
72.6 | 86.6 | 71.7 | 61.8 | 46.1 | |||||||||||||||
|
(Loss)
income from discontinued operations
|
- | - | (0.5 | ) | 5.6 | 0.4 | ||||||||||||||
|
Net
income
|
72.6 | 86.6 | 71.2 | 67.4 | 46.5 | |||||||||||||||
|
Less:
net income attributable to noncontrolling interests
|
- | 0.6 | 0.5 | 0.3 | 0.1 | |||||||||||||||
|
Net
income attributable to common shareholders
|
$ | 72.6 | $ | 86.0 | $ | 70.7 | $ | 67.1 | $ | 46.4 | ||||||||||
|
Income
per share attributable to common shareholders from continuing
operations:
|
||||||||||||||||||||
|
Basic
(1)
|
$ | 2.21 | $ | 2.65 | $ | 2.18 | $ | 1.91 | $ | 1.48 | ||||||||||
|
Diluted
(2)
|
2.12 | 2.50 | 2.06 | 1.83 | 1.41 | |||||||||||||||
|
(Loss)
income per share attributable to common shareholders from discontinued
operations:
|
||||||||||||||||||||
|
Basic
(1)
|
- | - | (.02 | ) | .18 | .01 | ||||||||||||||
|
Diluted
(2)
|
- | - | (.01 | ) | .17 | .01 | ||||||||||||||
|
Weighted
average common shares outstanding
|
32.8 | 32.4 | 32.7 | 32.2 | 31.1 | |||||||||||||||
|
Weighted
average shares assuming dilution
|
36.3 | 36.1 | 36.2 | 33.6 | 32.5 | |||||||||||||||
|
Dividends
declared per common share
|
$ | 0.62 | $ | 0.58 | $ | 0.54 | $ | 0.50 | $ | 0.46 | ||||||||||
|
YEAR-END
FINANCIAL POSITION
|
||||||||||||||||||||
|
Cash
and cash equivalents
|
$ | 83.1 | $ | 87.2 | $ | 108.4 | $ | 47.1 | $ | 48.8 | ||||||||||
|
Working
capital
|
226.1 | 207.1 | 229.4 | 124.8 | 118.8 | |||||||||||||||
|
Total
assets
|
1,271.0 | 1,168.7 | 1,185.6 | 918.2 | 833.5 | |||||||||||||||
|
Total
invested capital:
|
||||||||||||||||||||
|
Total
debt
|
379.6 | 386.0 | 395.1 | 236.3 | 281.0 | |||||||||||||||
|
Total
equity
|
579.1 | 487.1 | 490.9 | 419.3 | 344.0 | |||||||||||||||
|
Total
invested capital
|
$ | 958.7 | $ | 873.1 | $ | 886.0 | $ | 655.6 | $ | 625.0 | ||||||||||
|
PERFORMANCE
MEASUREMENTS (3)
|
||||||||||||||||||||
|
Gross
margin (a)
|
28.8 | % | 28.8 | % | 28.6 | % | 29.0 | % | 28.1 | % | ||||||||||
|
Operating
profitability (b)
|
9.2 | % | 11.8 | % | 9.3 | % | 11.1 | % | 10.5 | % | ||||||||||
|
Effective
tax rate
|
16.2 | % | 21.6 | % | 19.9 | % | 29.1 | % | 29.0 | % | ||||||||||
|
Return
on invested capital (c)
|
8.9 | % | 11.1 | % | 9.9 | % | 11.2 | % | 9.5 | % | ||||||||||
|
Net
debt-to-total invested capital (d)
|
33.9 | % | 38.0 | % | 36.9 | % | 31.1 | % | 40.3 | % | ||||||||||
|
Research
and development expenses
|
$ | 19.9 | $ | 18.7 | $ | 16.1 | $ | 11.1 | $ | 7.9 | ||||||||||
|
Operating
cash flow
|
137.7 | 135.0 | 129.2 | 139.4 | 85.6 | |||||||||||||||
|
Stock
price range
|
$ | 41.77-27.85 | $ | 52.00-29.52 | $ | 54.83-35.20 | $ | 52.77-24.83 | $ | 29.99-18.58 | ||||||||||
(1) Based
on weighted average common shares outstanding.
(2) Based
on weighted average shares, assuming dilution.
(3)
Performance measurements represent indicators commonly used in the financial
community. They are not measures of financial performance under U.S.
GAAP.
(a) Net
sales minus cost of goods and services sold, including applicable depreciation
and amortization, divided by net sales.
(b)
Operating profit divided by net sales.
(c)
Operating profit multiplied by one minus the effective tax rate divided by
average total invested capital.
(d) Net
debt (total debt less cash and cash equivalents) divided by total invested
capital net of cash and cash equivalents.
21
Factors
affecting the comparability of the information reflected in the selected
financial data:
|
§
|
2009
income from continuing operations includes the impact of restructuring
charges and asset impairments of $9.5 million pre-tax, a pre-tax gain on
Brazilian tax amnesty benefits of $2.0 million and the recognition of
discrete tax benefits totaling $6.1 million. Collectively, these items
decreased operating profit by $7.5 million pre-tax and increased income
from continuing operations by $0.2 million after
tax.
|
|
§
|
Income
from continuing operations in 2008 includes a net pre-tax gain on contract
settlement proceeds of $4.2 million, restructuring and related charges of
$3.0 million and discrete income tax benefits of $3.5 million.
Collectively, these items increased operating profit by $1.2 million
pre-tax and increased income from continuing operations by $4.3 million
after tax.
|
|
§
|
On
December 29, 2008, we purchased the remaining 10% interest in our Medimop
subsidiary for $8.5 million, which resulted in a $5.4 million reduction to
the noncontrolling interest
balance.
|
|
§
|
2007
income from continuing operations includes the impact of the restructuring
charges at our Tech Group segment, an impairment loss on our Nektar
contract intangible asset for the Exubera device and our provisions for
Brazilian tax issues, totaling a $26.4 million pre-tax charge ($19.4
million after tax). Our 2007 results also include the recognition of
discrete tax benefits totaling $8.2
million.
|
|
§
|
During
2007, we issued $161.5 million of convertible junior subordinated
debentures carrying a 4% coupon rate and due on March 15, 2047, resulting
in net cash proceeds of $156.3 million, after payment of underwriting and
other costs of $5.2 million. These debentures are convertible
into our common stock at any time at a conversion price of $55.85 per
share. We have and may use the proceeds for general corporate purposes,
which include capital expenditures, working capital, possible acquisitions
of other businesses, technologies or products, repaying debt, and
repurchasing our common stock.
|
|
§
|
2006
income from continuing operations includes a pre-tax loss on
extinguishment of debt of $5.9 million ($4.1 million net of tax) and a
gain on a tax refund of $0.6
million.
|
|
§
|
On
December 31, 2006, we adopted new guidance which requires the recognition
of the overfunded or underfunded status of a defined benefit
postretirement plan, as measured by the difference between the fair value
of plan assets and the benefit obligation. The adoption of this guidance
resulted in a reduction of shareholder’s equity of $19.7 million ($32.0
million pre-tax, less a $12.3 million deferred tax benefit) at December
31, 2006.
|
|
§
|
During
2005, we acquired the businesses of Monarch, TGI and Medimop. Our
financial statements include the results of acquired businesses for
periods subsequent to their acquisition
date.
|
|
§
|
2005
income from continuing operations includes incremental income tax expense
of $1.5 million associated with the repatriation of foreign-sourced income
under the American Jobs Creation Act of 2004 and a reduction in an
estimate for restructuring costs which increased income from continuing
operations by $1.3 million.
|
22
ITEM 7. MANAGEMENT’S DISCUSSION AND ANALYSIS OF
FINANCIAL CONDITION AND RESULTS OF OPERATIONS.
COMPANY
OVERVIEW
West
Pharmaceutical Services, Inc. (which may be referred to as West, the Company, we, us or our) is a manufacturer of
components and systems for injectable drug delivery and plastic packaging and
delivery system components for the pharmaceutical, healthcare and consumer
products industries. The vast majority of our business is conducted in the
pharmaceutical and healthcare markets. Our mission is to develop and apply
proprietary technologies that improve the safety and effectiveness of
therapeutic and diagnostic healthcare delivery systems. During the years
presented, our business was conducted through two segments - "Pharmaceutical
Systems" and "Tech Group." Pharmaceutical Systems focused on primary packaging
and systems for injectable drug delivery, including stoppers and seals for
vials, closures and other components used in syringe, intravenous and blood
collection systems, prefillable syringe components, and safety and
administration systems. The Tech Group offered custom contract-manufacturing
solutions using plastic injection molding and manual and automated assembly
processes targeted to the healthcare and consumer products industries. As
described in the Recent
Developments section below, beginning in 2010 we realigned our business
operations into two new segments. Our customer base includes the leading global
producers and distributors of pharmaceuticals, biologics, medical devices and
personal care products. We have a global manufacturing footprint with production
and distribution facilities in North America, Europe, Latin America, Asia and
Australia. West has also formed global partnerships to share technologies and
market products with companies in Japan and Mexico.
As a
result of our global manufacturing and distribution presence, more than half of
our revenues are generated outside of the U.S. in currencies other than the U.S.
dollar, including 44% in Europe and 8% collectively in South America, Asia and
Australia. In terms of net sales and operating profit, the most significant
foreign currencies are the Euro, the British Pound, the Danish Krone and the
Singapore Dollar, with Euro-denominated sales representing the majority of sales
transacted in foreign currencies. For consolidated financial reporting purposes,
transactions and balances reported in foreign currencies must be translated into
U.S. dollars based upon applicable foreign currency exchange rates.
2009
Financial Performance Highlights
|
·
|
Net
sales were $1,055.7 million, marginally higher than the prior year’s
sales. Excluding impacts from changes in foreign currency exchange rates,
the increase was $37.1 million, or
3.5%.
|
|
·
|
Gross
profit increased to $303.6 million, slightly higher than 2008, and our
gross margin percentage was consistent with the prior year at 28.8%.
Excluding foreign exchange effects, gross profit increased $9.7 million
over the 2008 period.
|
|
·
|
Operating
profit for our reportable segments was $148.2 million, a decrease of $6.3
million compared with 2008. Including corporate costs and other
unallocated charges (credits), operating profit for 2009 was $97.5 million
compared with $124.1 million in the prior
year.
|
|
·
|
Net
income from continuing operations for 2009 was $72.6 million, or $2.12 per
diluted share compared to $86.0 million, or $2.50 per diluted share, in
the prior year.
|
|
·
|
At
December 31, 2009 our total debt was $379.6 million compared with $386.0
million in the prior year and our net debt-to-total invested capital ratio
was 33.9%, an improvement of 4.1 percentage
points.
|
|
·
|
Our
financial position remains very strong, with net cash flow from operations
totaling $137.7 million in 2009, compared to $135.0 million in the prior
year.
|
|
·
|
Our
Board of Directors approved an increase in the quarterly cash dividend
from $0.15 to $0.16 per share beginning with the fourth-quarter 2009
dividend.
|
23
We
achieved higher sales and gross profit in 2009, driven by the strong fourth
quarter performance of our Pharmaceutical Systems segment. Despite the
recessionary economic conditions and conservative ordering patterns from our
customers, we were successful in growing revenues by managing pricing, improving
sales mix and capitalizing on unique opportunities such as the H1N1 influenza
vaccination effort. Sales volumes were not a significant contributor to growth
in 2009 as our customers searched for ways to cut costs including lowering
inventories on hand and delaying discretionary development projects. However, we
grew revenue by converting customers to our higher value pharmaceutical
packaging products that incorporate various post-manufacturing, value-added
processes and advanced coatings that enhance quality, minimize defects and
incorporate the most rigorous regulatory standards. Increased production levels
in the fourth quarter contributed to improved plant utilization and we also saw
a return to favorable raw material prices compared with the exceptionally high
prices experienced in the second half of 2008 and the majority of 2009. The Tech
Group was most affected by economic conditions during 2009 as certain customers
withdrew from new product launches, reduced inventories on hand and curtailed
purchases in line with lower consumer spending. Consolidated gross profit
improved over the prior year as a result of increased demand in the fourth
quarter and cost reduction efforts within both segments. The effect of a
significant increase in U.S. pension costs, unfavorable foreign currency
translation and higher general and administrative costs within our operating
segments resulted in lower operating profit for the year. Overall, our pricing
management, improved sales mix and manufacturing cost reduction initiatives
combined with lower cash paid for taxes outweighed the increased general and
administrative costs during 2009, resulting in increased operating cash flows
and a reduction in net debt.
RECENT
DEVELOPMENTS
Acquisition
On July
6, 2009, we acquired certain business assets of Plastef Investissements SA
(“Plastef”) and its subsidiaries, a France-based developer and manufacturer of
drug delivery devices. Plastef’s products include the Eris safety syringe
system, which addresses the market for fixed-needle prefilled syringes and
complements our NovaGuard™ safety system, which employs the other common syringe
format, luer-lock syringes. The acquired business assets included a
manufacturing facility located at Le Vaudreuil, Normandy, intellectual property
and working capital. The purchase price included cash paid at closing of $16.9
million, funded from cash on hand, and contingent consideration with a fair
value of $2.6 million which is dependent upon the achievement of operating goals
and other milestones over the next five years. Sales and operating results
generated from the assets acquired from Plastef are considered part of our Tech
Group segment.
Restructuring
Initiatives
In
December 2007, we launched a restructuring plan for our Tech Group which
addressed changes in customers’ marketing plans for certain products and aligned
our plant capacity and workforce with the longer-term strategy of focusing the
business on proprietary products. As part of this plan, we implemented a series
of restructuring initiatives to reduce production and engineering operations,
reduce administrative costs, and consolidate our tool shops into one location.
During the first half of 2009, we incurred $1.1 million in costs as we completed
these restructuring activities. During 2008 and 2007, we incurred restructuring
costs totaling $3.0 million and $3.4 million, respectively. In the aggregate,
costs of this program consisted of $3.7 million in severance and benefits, $2.6
million in impairments and other asset-related charges, and $1.2 million for
contract termination fees and other expenses.
In
November 2009, we announced restructuring plans for certain business operations
and support functions affecting both of our reporting segments. The
Pharmaceutical Systems plan involves exiting certain specialized laboratory
service offerings due to a change in market demand, reducing support personnel
primarily associated with information technology applications and discontinuing
other non-core initiatives and disposing of the associated assets. The costs are
estimated to be approximately $7.0 million, which consists of $2.0 million in
cash expenditures related to employee severance benefits and $5.0 million in
asset impairment charges primarily related to removing certain laboratory
equipment and plant assets from service. Annual savings from this portion of the
plan are expected to be approximately $4.0 million, including $1.0 million in
reduced depreciation expense.
24
The Tech
Group plan is intended to better align our available production capacity with
expected levels of contract manufacturing activity by consolidating
manufacturing operations and support functions. Total costs of the Tech Group
plan are estimated to be approximately $2.0 million, which consists of $1.5
million in cash expenditures for severance and asset relocation costs and $0.5
million in accelerated depreciation due to the shortened useful life of the
affected fixed assets. This portion of the plan is expected to generate savings
of approximately $2.0 million in 2010, increasing to approximately $4.0 million
annually following completion. During 2009, Pharmaceutical Systems incurred
actual charges of $7.0 million and Tech Group incurred charges of $0.6 million,
with the balance expected in 2010 as the respective activities are
completed.
Currency
Exchange Rates
Fluctuations
in foreign currency exchange rates can have a significant influence on our
consolidated financial results. In particular, changes in the Euro exchange rate
have the greatest potential to impact results as Euro- denominated sales
accounted for 37% of our consolidated sales and 71% of all non-U.S. dollar
denominated sales during 2009, and a similar amount in the prior two years. In
general, our financial results are affected positively by a weaker U.S. dollar
and negatively by a stronger U.S. dollar as compared to the foreign currencies
in which we conduct our business. During 2009, on average, the U.S. dollar
appreciated 5.2% against the Euro and a combined 7.6% against other key
currencies, resulting in lower reported revenues of $32.5 million and reduced
operating profit of $5.1 million versus the prior year.
For 2010,
our projections currently anticipate that changes in foreign currency exchange
rates will have a slightly favorable impact on consolidated sales and operating
profit resulting from a depreciation of the U.S. dollar relative to 2009
exchange rates.
U.S.
Pension Plan Expense
Our
expense for U.S. pension and other post-retirement benefits for 2009 was
significantly higher than the prior year due primarily to the 2008 market
decline in pension plan assets. During 2008, the slowing economy and adverse
conditions in equity and debt markets contributed to a 25% decline in the value
of our U.S. pension assets, compared to a long-term rate of return assumption at
the time of 8.0%. As a result of this and other changes in key actuarial
assumptions, we experienced incremental expense of approximately $10.7 million
during 2009 versus 2008. As shown in the Results of Operations section
below, U.S. pension and other retirement plan expenses are considered a
corporate cost and are not allocated to our reportable segments. Actual returns
on our U.S. pension plan assets during 2009 were significantly above our revised
expected long-term rate of return of 7.75%, and we expect our 2010 expense to be
lower than the 2009 amount.
2010
Business Operations Realignment
Effective
January 1, 2010 our business operations have been realigned into two new
management divisions, “Pharmaceutical Packaging Systems” and “Pharmaceutical
Delivery Systems” in order to further align our business units with the
underlying markets and customers they serve. Pharmaceutical Packaging Systems
will consist of our core pharmaceutical packaging products, disposable medical
components, and laboratory and other services. Pharmaceutical Delivery Systems
will include safety and administration systems and multi-component systems for
drug administration, most of which were manufactured by our Tech Group segment.
In addition, the new Pharmaceutical Delivery Systems segment will be responsible
for the advancement of new delivery system products currently in development or
early-stage marketing. The majority of the costs for these development and
marketing activities were previously included in the Pharmaceutical Systems
segment. Beginning with the first quarter of 2010, this realignment will result
in a change to our reportable segments, and our historical results will be
restated accordingly to provide comparative financial information.
25
2010
BUSINESS OUTLOOK
Although
we expect growth to continue to be hampered by a slow economic recovery, our
business outlook for 2010 is positive as we anticipate customers will revert to
normal ordering patterns and begin to move development programs ahead. We expect
full year 2010 revenues to grow moderately, driven by volume and mix improvement
from our high-value packaging product offerings, safety and administration
systems and the launch of certain innovation products. A smaller portion of our
2010 growth is expected to come from selling price increases which will serve to
offset anticipated increases in raw materials and other production costs.
Pension costs will remain at relative high levels as a consequence of the plan
asset losses experienced during the 2008 market decline, although we expect some
improvement from the 2009 expense. We believe that the combination of higher
revenues, a better mix of product sales and a lower cost structure, made
possible by restructuring initiatives and aggressive lean savings initiatives at
our production facilities, will provide for growth in operating profit during
2010.
Although
there are a number of uncertainties that could impact our operating results,
such as continued consolidation of the pharmaceuticals industry, the outcome of
pending U.S. healthcare legislation and continued recessionary pressures, we
believe that the long-term drivers remain strong and market dynamics support
future growth with an aging population, continued advances in treatments for
chronic illnesses and increased regulatory scrutiny. Given our positive growth
outlook, we plan to continue funding the capital projects necessary to meet
customer demand and to provide for improved results in our longer-term strategic
plan. During the last two years, we made significant strides in increasing our
plant capacity in Germany, Serbia, France, Singapore and the U.S., and in 2009
we completed construction and commenced commercial production at our China
plastic components facility. During 2010, we expect that our capital spending
will be between $115 million and $130 million and that it will continue to be
heavily weighted toward new products and expansion projects, as we plan to
invest in a new rubber-components facility in China, expand enhanced products
capabilities in the U.S. and Europe, fund innovation projects and implement
various global quality initiatives.
RESULTS
OF OPERATIONS
Management’s
discussion and analysis of our operating results for the three years ended
December 31, 2009, and our financial position as of December 31, 2009, should be
read in conjunction with the accompanying consolidated financial statements and
footnotes appearing in Item 8 of this Report on Form 10-K. For the purpose of
aiding the comparison of our year-to-year results, reference is made in
management's discussion and analysis to results excluding the effects of changes
in foreign exchange rates. Constant currency amounts are calculated by
translating the current year’s functional currency results at the prior period’s
exchange rate. Those re-measured period results on a constant currency basis are
not in conformity with U.S. generally accepted accounting principles (“U.S.
GAAP”) and should not be used as a substitute for the related U.S. GAAP
financial measures. The non-U.S. GAAP financial measures are presented because
management uses them in evaluating our results of operations and in comparing
operating results to prior periods and believes that this information provides
users a valuable insight into our results.
Percentages
in the following tables and throughout the Results of Operations section may
reflect rounding adjustments.
NET
SALES
The
following table summarizes net sales by reportable segment:
|
Year
Ended December 31,
|
%
Change
|
|||||||||||||||||||
|
($
in millions)
|
2009
|
2008
|
2007
|
09/08 | 08/07 | |||||||||||||||
|
Pharmaceutical
Systems
|
$ | 808.7 | $ | 792.1 | $ | 741.8 | 2.1 | % | 6.8 | % | ||||||||||
|
Tech
Group
|
258.3 | 270.5 | 289.2 | (4.5 | )% | (6.5 | )% | |||||||||||||
|
Intersegment
sales
|
(11.3 | ) | (11.5 | ) | (10.9 | ) | - | - | ||||||||||||
|
Total
net sales
|
$ | 1,055.7 | $ | 1,051.1 | $ | 1,020.1 | 0.4 | % | 3.0 | % | ||||||||||
26
2009 compared to
2008
Consolidated
2009 net sales increased marginally over those achieved in the prior year
including an unfavorable foreign exchange impact of $32.5 million. Excluding
foreign currency translation effects, 2009 net sales increased $37.1 million, or
3.5%, from the prior year. The increase was principally due to the favorable
impact of annual selling price increases of 1.9 percentage points, improved
sales volume and mix of 0.7 percentage points and 0.9 percentage points
resulting from our acquisition of Plastef. Overall favorable sales results were
attributable to Pharmaceutical Systems as the Tech Group sales were lower on
unfavorable volume and mix and lower cost-adjusted selling prices, as described
below.
Pharmaceutical Systems - This
segment contributed $16.6 million to the full year sales increase, despite an
unfavorable foreign currency translation impact of $29.9 million. Excluding
currency translation effects, sales were $46.5 million, or 5.9%, above
prior-year levels due mostly to higher selling prices and increased demand for
our pharmaceutical packaging components. Sales of pharmaceutical packaging
products excluding foreign currency changes during the year were $43.4 million
higher than the prior year due to higher sales of stoppers used in packaging for
various drugs including the H1N1 influenza vaccine and increased demand for
prefilled injection packaging components used in insulin applications. Orders
relating to the H1N1 vaccination effort resulted in an estimated $22.0 million
of 2009 sales, and are expected to contribute $15.0 million to $20.0 million
less than this during 2010. Also contributing to the increase in packaging
components revenues was an increase in sales of flip-off seals, mostly within
North America. Sales of disposable medical components and safety and
administration products were higher by approximately $2.2 million, due mostly to
the introduction of ready-to-use closures for intravenous bottles in South
America. The remainder of the increase in 2009 revenues came from other products
and laboratory services sales which were $1.0 million higher than the prior
year.
Tech Group - Full year sales
were $12.2 million below 2008 levels, including $2.6 million of unfavorable
foreign currency translation. Excluding the impact of foreign currency changes,
sales were $9.6 million, or 3.5%, below prior year levels. Sales of consumer and
personal care products declined by $17.5 million compared to the prior year as a
result of lower plastic resin costs, which are contractually passed through to
many Tech Group customers in the form of adjusted selling prices, our decision
to discontinue manufacturing a specific customer’s product in Mexico and
regulatory action which halted sales of one of our customer’s products. The
reduction in revenues caused by resin cost pass-through adjustments alone was
approximately $6.4 million. Overall sales of healthcare devices, tooling and
other excluding foreign currency changes were $7.9 million higher compared with
2008 due to $10.2 million of incremental sales from our July 2009 acquisition of
Plastef and strong sales of an intra-nasal medical device manufactured in
Europe, partially offset by lower U.S. sales due to customer stock reductions
and fewer new product introductions.
2008 compared to
2007
Consolidated
2008 net sales increased by $31.0 million, or 3.0%, over those achieved in the
prior year. Favorable foreign currency translation accounted for the vast
majority of the consolidated sales growth. Sales price increases contributed 2.3
percentage points to sales growth, as price increases including raw material
surcharges were implemented in response to rising raw material and energy costs
during the year. Substantially offsetting the impact of sales price increases
were lower volumes and unfavorable mix resulting from regulatory and insurance
reimbursement related constraints and the discontinuation of certain products,
which resulted in lost sales within both reporting segments.
Pharmaceutical Systems - This
segment contributed $50.3 million to the full year sales increase, including
$26.2 million resulting from favorable foreign currency translation. Excluding
currency translation effects, sales were $24.1 million, or 3.3%, above prior
year levels due to the following revenues by product group. Sales of
pharmaceutical packaging components excluding foreign currency changes were
$15.1 million higher than the prior year due to increased sales of stoppers and
seals used in a variety of customer products. These increases more than
compensated for a decline in sales of a prefillable syringe component caused by
regulatory and insurance reimbursement changes affecting the demand for certain
customer products designed to treat anemia in cancer and other patients. Sales
of disposable medical components were $9.6 million lower, as sales of other
syringe components replaced a portion of the $13.6 million of 2007 sales of a
low-margin blood collection system component that we ceased producing. Sales of
safety and administration systems, and
27
laboratory
and other services were $18.6 million higher than the prior year, most of which
was due to increased demand for our drug reconstitution products and higher
tooling activity.
Tech Group - Full year sales
were $18.7 million below 2007 levels, including $3.6 million of favorable
foreign currency translation. Excluding the impact of foreign currency
translation, sales were $22.3 million, or 7.7%, below prior year levels as
follows. Sales of healthcare devices excluding foreign currency changes
decreased $23.2 million compared with 2007. After considering the lost Exubera
sales of $33.0 million, we experienced increased sales volume of other
healthcare devices including medical filter products, self-injection pens, and
intra-nasal drug delivery systems, partially offset by a drop-off in sales of
packaging for a customer’s over-the-counter weight loss product following a June
2007 market launch. Sales of consumer products, tooling and other services
increased by $1.0 million due to increased volume of juice and dairy carton
closures, partially offset by lower demand for certain personal care products
and tooling services. Intersegment sales of $11.1 million and $10.5 million in
2008 and 2007, respectively, were eliminated in consolidation.
The
majority of intersegment sales eliminations in all periods presented represent
sales of healthcare devices from the Tech Group to Pharmaceutical
Systems.
Information
regarding fluctuations in sales by significant product group presented above has
been calculated on a constant currency basis. Refer to Note 6, Segment Information, to the
consolidated financial statements for sales by significant product group using
actual foreign currency exchange rates.
GROSS
PROFIT
The
following table summarizes our gross profit and related gross margins by
reportable segment:
|
Year
Ended December 31,
|
%
Change
|
|||||||||||||||||||
|
($
in millions)
|
2009
|
2008
|
2007
|
09/08 | 08/07 | |||||||||||||||
|
Pharmaceutical
Systems:
|
||||||||||||||||||||
|
Gross
Profit
|
$ | 267.6 | $ | 265.7 | $ | 256.3 | 0.7 | % | 3.7 | % | ||||||||||
|
Gross
Margin
|
33.1 | % | 33.5 | % | 34.5 | % | ||||||||||||||
|
Tech
Group:
|
||||||||||||||||||||
|
Gross
Profit
|
$ | 36.0 | $ | 36.9 | $ | 35.5 | (2.4 | )% | 3.9 | % | ||||||||||
|
Gross
Margin
|
13.9 | % | 13.7 | % | 12.3 | % | ||||||||||||||
|
Consolidated
gross profit
|
$ | 303.6 | $ | 302.6 | $ | 291.8 | 0.3 | % | 3.7 | % | ||||||||||
|
Consolidated
gross margin
|
28.8 | % | 28.8 | % | 28.6 | % | ||||||||||||||
2009 compared to
2008
Consolidated
gross profit increased by $1.0 million over 2008 full year results, despite an
unfavorable foreign currency translation impact of $8.7 million. Excluding
foreign exchange impacts, gross profit increased by $9.7 million, or 3.2%, as a
result of higher selling prices and a significant fourth quarter increase in
volume and mix contributed by Pharmaceutical Systems. Our overall gross margin
percentage remained consistent with the prior year as we were able to maintain
margins through sales price increases and improved volume and mix, partially
offset by higher depreciation expense as described below. We expect our gross
margin percentage to improve within the next year as a result of improved sales
volume and mix and further gains in plant efficiency from lean savings
initiatives and recent restructuring efforts.
Pharmaceutical Systems – Our
reported gross profit of $267.6 million increased by $1.9 million compared with
the 2008 results. Excluding foreign currency translation effects of $7.6
million, 2009 gross profit was $9.5 million higher than the prior year. The
gross margin percentage for Pharmaceutical Systems declined by 0.4 percentage
points versus the prior year despite the increase in gross profit. The decline
was attributable to higher depreciation expense resulting from our global
capital expansion activity which began in the latter half of 2008, partially
offset by improved selling prices. Overall, the price impact on our gross margin
percentage was positive as increased selling prices more than offset increases
in energy, wages and other production costs experienced during the
year.
28
Tech Group – Reported gross
profit of $36.0 million decreased by $0.9 million compared with the full-year
2008 results including $1.1 million in unfavorable foreign currency effects.
Excluding the translation effects, 2009 gross profit was slightly higher than
the prior year. Despite a decrease in gross profit, our 2009 profit margin
percentage improved slightly to 13.9% compared with the prior year largely due
to the impact of reduced resin costs on selling prices which resulted in a
higher ratio of gross profit to revenues. Also contributing to the gross margin
improvement was a reduction in plant overhead costs and improved production
efficiency resulting from our restructuring efforts in the U.S. and higher
production volume within our European operations.
2008 compared to
2007
Consolidated
gross profit increased by $10.8 million over 2007, including the favorable
effect from foreign currency translation of $9.4 million. The gross margin
percentage improved slightly despite the unfavorable impact on sales volume and
mix caused by the loss of discrete business described in the Net Sales section
above.
Pharmaceutical Systems - Gross
margin for Pharmaceutical Systems declined by one percentage point versus the
prior year. Approximately half of this decrease was due to unfavorable volume
and mix resulting from the regulatory and insurance reimbursement issues
affecting the demand for prefillable syringe components used in certain anemia
products. The remaining decline resulted from increased depreciation expense and
production cost increases, as the positive benefit of sales price increases
offset a majority of the increased costs of raw materials, wages and utilities
used to operate our production facilities.
Tech Group - Gross margins
improved by 1.4 percentage points in comparison to prior year results. The
improved gross margin performance was largely due to a significant reduction in
plant overhead and improved production efficiency which contributed 3.4
percentage points. These gains resulted from our restructuring efforts and
efficiencies from the completion of start-up activities at our expanded
production facility in Michigan. Partially offsetting these increases by 1.5
percentage points was the impact of lower sales and unfavorable mix. Despite
sales increases in consumer products and other healthcare devices, the loss of
business associated with the Exubera device and the prior year weight loss
product launch resulted in a decline in sales and negative impact on gross
margin. During the year, the majority of raw material, energy and wage cost
increases were passed on to customers in the form of increased selling
prices.
RESEARCH
AND DEVELOPMENT (“R&D”) COSTS
Our
development projects are primarily a response to the market opportunities
created by the convergence of primary drug packaging and delivery systems and
include initiatives in traditional injection systems, components for pen system
applications and auto-injection systems.
The
following table summarizes R&D costs by reportable segment:
|
($
in millions)
|
2009
|
2008
|
2007
|
|||||||||
|
Pharmaceutical
Systems
|
$ | 18.0 | $ | 17.2 | $ | 14.0 | ||||||
|
Tech
Group
|
1.9 | 1.5 | 2.1 | |||||||||
|
Total
R&D costs
|
$ | 19.9 | $ | 18.7 | $ | 16.1 | ||||||
R&D
costs during 2009 were $1.2 million higher than those incurred in 2008, mostly
due to accelerated development spending on our high-value packaging and
injection systems and ready-to-use components. Also contributing to the increase
was incremental R&D during the second half of 2009 resulting from the
acquisition of Plastef.
2008
R&D costs were $2.6 million higher than those incurred in 2007, mostly due
to increased spending on three ongoing development projects in the
Pharmaceutical Systems segment. These projects included our development of
prefillable syringe systems that use Daikyo Seiko, Ltd. (“Daikyo”) Crystal
Zenith® resin, an advanced injection system using auto-injector technology, and
a passive needle safety device.
29
Estimated
2010 R&D spending is expected to exceed 2009 levels by approximately 30% as
we continue to invest in advanced injectable packaging and delivery systems and
safety and reconstitution products. We anticipate that a majority of our
developmental medical devices will be manufactured by our newly-formed
Pharmaceutical Delivery Systems segment. We believe that our commitment to
develop and apply proprietary technologies that improve the quality, safety and
effectiveness of therapeutic and diagnostic healthcare delivery systems will
result in continued long-term growth.
SELLING,
GENERAL and ADMINISTRATIVE (“SG&A”) COSTS
The
following table summarizes SG&A costs by reportable segment including
corporate and unallocated costs:
|
($
in millions)
|
2009
|
2008
|
2007
|
|||||||||
|
Pharmaceutical
Systems SG&A costs
|
$ | 115.2 | $ | 110.1 | $ | 98.3 | ||||||
|
Pharmaceutical
Systems SG&A as a % of segment net sales
|
14.3 | % | 13.9 | % | 13.3 | % | ||||||
|
Tech
Group SG&A costs
|
$ | 19.6 | $ | 17.9 | $ | 22.0 | ||||||
|
Tech
Group SG&A as a % of segment net sales
|
7.6 | % | 6.6 | % | 7.6 | % | ||||||
|
Corporate
costs:
|
||||||||||||
|
General
corporate costs
|
$ | 18.7 | $ | 18.9 | $ | 21.0 | ||||||
|
Stock-based
compensation expense
|
7.5 | 6.4 | 5.1 | |||||||||
|
U.S.
pension plan expense
|
16.7 | 6.0 | 6.1 | |||||||||
|
Total
SG&A costs
|
$ | 177.7 | $ | 159.3 | $ | 152.5 | ||||||
|
Total
SG&A as a % of total net sales
|
16.8 | % | 15.2 | % | 14.9 | % | ||||||
2009 compared to
2008
Consolidated
SG&A expenses were $18.4 million above those recorded in 2008. Excluding the
favorable effects from foreign currency translation of $3.8 million, all of
which related to the Pharmaceutical Systems segment, 2009 SG&A expenses were
$22.2 million higher than the prior year. SG&A as a percentage of net sales
increased by 1.6 percentage points, the majority of which related to the
increase in U.S. pension and other retirement plan costs.
In
Pharmaceutical Systems, excluding the favorable impact from foreign currency
translation, 2009 SG&A expenses increased by $8.9 million over the
prior-year amount as a result of several individual items including the
following. Other compensation costs were $2.1 million above those incurred in
2008 due to increased staffing of information technology and other necessary
technical, manufacturing support and marketing functions and from the impact of
annual salary increases. Increased depreciation expense and other costs
associated with our 2008 and 2009 information systems implementations accounted
for $1.9 million of the increase, and costs associated with our acquisition
activities and geographic expansion in China accounted for $1.6 million of the
increase. Severance and related benefit costs increased by $1.1 million, most of
which resulted from our decision to consolidate laboratory functions and
relocate certain business development center functions. Various other costs
including professional services and office facilities costs contributed to the
remaining increase in 2009 SG&A expense compared to the prior
year.
SG&A
costs in the Tech Group were $1.7 million higher than the amount incurred in
2008. Increases during 2009 were largely the result of annual salary and
compensation increases and costs associated with our information systems
upgrades.
30
General
corporate costs include executive and director compensation other than
stock-based compensation and other corporate administrative and facilities
expenses that are not allocated to the segments. Also included in general
corporate costs are any above or below-target performance adjustments for our
worldwide cash bonus program. Annual cash bonus payments are made based on the
achievement of sales, operating profit, earnings per share and cash flow
targets, and certain qualitative performance milestones. General corporate costs
for 2009 were marginally favorable to prior-year levels as the impact of annual
salary increases was more than offset by lower annual cash bonus costs and
reduced amounts of outside professional fees.
Stock-based
compensation costs for 2009 increased by $1.1 million compared to the prior year
due to the impact of changes in our stock price on the fair value of our
stock-price indexed deferred compensation liabilities. During 2009, our stock
price increased $1.43 per share, closing at $39.20 per share on December 31,
2009, while during 2008 our stock price decreased $2.82, closing at $37.77 per
share on December 31, 2008.
U.S.
pension and other retirement benefits expense in 2009 was $10.7 million higher
than the prior year due to increased amortization of actuarial losses and lower
expected return on plan assets resulting from the loss in plan asset values
during the 2008 stock market decline. The costs of non-U.S. pension and other
retirement benefits programs are reflected in the operating profit of the
respective segment for all periods presented.
2008 compared to
2007
Consolidated
SG&A expenses were $6.8 million above those recorded in 2007, but only
increased marginally as a percentage of total net sales. The impact of foreign
currency translation accounted for $3.3 million of the increase.
In
Pharmaceutical Systems, 2008 SG&A expenses increased by $11.8 million over
the prior year. Foreign currency translation accounted for $3.1 million of the
increase. Compensation costs were $4.4 million above those incurred in 2007 due
to the impact of annual pay increases and increased staffing of information
technology support functions. Costs associated with our new information systems
implementation, including depreciation expense and third-party consulting fees,
accounted for $2.3 million of the increase. Various other increases including
utilities and other corporate facilities costs contributed to the remaining
increase in SG&A expense.
SG&A
costs in the Tech Group were $4.1 million lower than the amount incurred in
2007. A net reduction in headcount associated with our restructuring efforts
accounted for half of the reduction in SG&A. The remainder of the reduction
was attributable to lower amortization expense, resulting from the 2007 Nektar
contract intangible write-off, and a reduction in various third-party consulting
services.
General
corporate SG&A costs were $2.1 million favorable to 2007 levels. The
majority of the decrease is the result of lower facilities and
administrative-related costs. 2008 cash-based bonus costs were slightly lower
than those earned in the prior year based upon management’s achievement of
targets.
Stock-based
compensation costs for 2008 increased by $1.3 million due to the impact of
changes in our stock price on the fair value of our stock-price indexed deferred
compensation liabilities. During 2008, our stock price decreased $2.82 per
share, closing at $37.77 per share on December 31, 2008, while during 2007 our
stock price decreased $10.64 per share, closing at $40.59 per share on December
31, 2007.
31
RESTRUCTURING,
IMPAIRMENT AND OTHER ITEMS
Other
income and expense items, consisting of gains, losses or impairments of segment
assets, foreign exchange transaction gains and losses, miscellaneous royalties
and sundry transactions are generally recorded within the respective segment.
Certain restructuring, impairments and other discrete gains and losses
considered outside the control of segment management are not allocated to our
reporting segments. The following table summarizes our restructuring charges and
other income and expense items for each of the three years ended December
31:
|
($
in millions)
|
2009
|
2008
|
2007
|
|||||||||
|
Pharmaceutical
Systems
|
$ | 0.2 | $ | 1.7 | $ | 2.1 | ||||||
|
Tech
Group
|
0.5 | (0.3 | ) | (0.2 | ) | |||||||
|
Corporate
|
0.3 | 0.3 | - | |||||||||
|
Unallocated
charges (credits):
|
||||||||||||
|
Impairment
charge, contract settlement and related gain, net
|
0.8 | (4.2 | ) | 12.9 | ||||||||
|
Restructuring
and related charges
|
8.7 | 3.0 | 3.4 | |||||||||
|
Brazil
tax penalties and amnesty benefits
|
(2.0 | ) | - | 10.1 | ||||||||
|
Total
unallocated charges (credits)
|
7.5 | (1.2 | ) | 26.4 | ||||||||
|
Total
restructuring, impairment and other charges
|
$ | 8.5 | $ | 0.5 | $ | 28.3 | ||||||
The
reduction in other expense for Pharmaceutical Systems is attributable to a
lesser amount of foreign exchange losses on intercompany and third-party
transactions recognized during 2009 compared with 2008. For Tech Group, the
increase in other expense resulted primarily from the recognition of foreign
exchange transaction losses in 2009 compared with gains in the 2008
year.
Impairment charge, contract
settlement and related gain, net – During the fourth quarter of 2009, we
determined that a cost-basis investment that arose from the 2005 divestiture of
a former drug delivery business was impaired and we recorded a $0.8 million
charge to write-off our investment. We do not expect any further charges
associated with this investment. In the fourth quarter of 2007, we recorded a
$12.9 million impairment charge representing our net book value in the Nektar
contract intangible asset associated with the Exubera device. Under an agreement
reached with Nektar in February 2008, we received full reimbursement for, among
other things, severance related employee costs, equipment, purchased raw
materials and components, leases and other facility costs associated with the
shutdown of manufacturing operations related to this device. During 2008, we
received payments from Nektar which more than offset the related costs incurred,
resulting in a net gain of $4.2 million.
Restructuring and related
charges – During the fourth quarter of 2009, we recognized restructuring
and other charges of $7.6 million, comprised of employee severance and benefits
costs of $2.7 million, asset impairment and accelerated depreciation of $4.8
million, and $0.1 million in asset relocation costs. During 2009, we also
incurred $1.1 million in restructuring costs, consisting mostly of employee
severance benefits, asset impairments, and accelerated depreciation associated
with the completion of our 2007 Tech Group restructuring program.
During
2008 and 2007, we incurred $3.0 million and $3.4 million, respectively, as part
of the 2007 Tech Group restructuring plan. The majority of these charges in each
year related to severance and post-employment benefits and a smaller portion
resulted from asset impairments and accelerated depreciation and other related
costs.
Brazil tax penalties and amnesty
benefits – In September 2009, we enrolled in a tax amnesty program which
provided for reduced penalties and interest on certain tax-related obligations.
During 2007, we increased our accruals for a series of social, excise and other
tax contingencies in Brazil by $10.1 million. These charges followed a detailed
review of several related tax cases pending in the Brazilian courts, which
indicated that it was probable that our positions taken on previous tax returns,
some of which date back to the late 1990’s, would not be
sustained.
32
Refer to
Note 4, Restructuring and
Other Items, to the consolidated financial statements for a further
discussion of the restructuring, impairment and other items within this
section.
OPERATING
PROFIT
Operating
profit (loss) by reportable segment, corporate and other unallocated costs was
as follows:
|
($
in millions)
|
2009
|
2008
|
2007
|
|||||||||
|
Pharmaceutical
Systems
|
$ | 134.2 | $ | 136.7 | $ | 141.9 | ||||||
|
Tech
Group
|
14.0 | 17.8 | 11.6 | |||||||||
|
Corporate
and other unallocated costs:
|
||||||||||||
|
General
corporate costs
|
(19.0 | ) | (19.2 | ) | (21.0 | ) | ||||||
|
Stock-based
compensation costs
|
(7.5 | ) | (6.4 | ) | (5.1 | ) | ||||||
|
U.S.
pension expenses
|
(16.7 | ) | (6.0 | ) | (6.1 | ) | ||||||
|
Other
unallocated items
|
(7.5 | ) | 1.2 | (26.4 | ) | |||||||
|
Consolidated
Operating Profit
|
$ | 97.5 | $ | 124.1 | $ | 94.9 | ||||||
2009 compared to
2008
Our 2009
combined segment operating profit decreased by $6.3 million from that achieved
in the prior year, including an unfavorable foreign exchange impact of $5.1
million. The Pharmaceutical Systems segment’s 2009 results were lower by $2.5
million as a result of higher general and administrative and R&D costs and
unfavorable foreign currency changes, offset partially by increased gross
profit. Excluding a $3.9 million unfavorable foreign exchange impact,
Pharmaceutical Systems’ operating profit exceeded the 2008 amount by $1.4
million. Tech Group operating profit was $3.8 million below that achieved in the
prior year, largely due to increased general and administrative costs and a
decline in gross profit on lower sales.
Consolidated
operating profit for 2009 and 2008 was reduced by corporate and unallocated
costs of $50.7 million and $30.4 million, respectively. The majority of these
increased costs related to the U.S. pension and other retirement benefits
expense, as described in the Selling, General and Administrative
Costs section above, and restructuring, impairment and other unallocated
charges.
2008 compared to
2007
The 2008
combined segment operating profit increased by $1.0 million from that achieved
in the 2007 year, including a favorable foreign exchange impact of $5.8 million.
Pharmaceutical Systems operating profit was lower than prior year results by
$5.2 million, including a foreign currency translation benefit of $5.5 million.
The impact of higher sales and gross profit was more than offset by higher
spending on information systems and research and development initiatives as we
replaced outdated management reporting systems and invested in innovative
products for the future. Tech Group operating profit was $6.2 million above that
achieved in the prior year, including a foreign currency benefit of $0.3
million, largely due to savings resulting from the restructuring program
initiated in late 2007, and production efficiencies coming from higher
throughput at our recently expanded Michigan facility.
Consolidated
operating profit for 2008 and 2007 also included corporate and unallocated costs
of $30.4 million and $58.6 million, respectively. The majority of this decrease
related to other unallocated items which are described in the Restructuring, Impairment and Other
Items section above.
INTEREST
EXPENSE, NET
The
following table summarizes our net interest expense:
|
($
in millions)
|
2009
|
2008
|
2007
|
|||||||||
|
Interest
expense
|
$ | 17.6 | $ | 18.6 | $ | 16.4 | ||||||
|
Capitalized
interest
|
(2.4 | ) | (2.6 | ) | (1.9 | ) | ||||||
|
Interest
income
|
(0.8 | ) | (1.4 | ) | (6.0 | ) | ||||||
|
Interest
expense, net
|
$ | 14.4 | $ | 14.6 | $ | 8.5 | ||||||
33
2009 compared to
2008
Consolidated
interest expense, net for 2009 was relatively consistent with the prior year, as
lower interest rates reduced both interest expense on our variable rate
revolving credit facility and interest income on bank deposits. In addition, we
held less cash on average during 2009 as compared with the prior year. The
majority of capitalized interest during both 2009 and 2008 resulted from our
plant expansion projects in Europe and the construction of our new plastics
plant in China.
2008 compared to
2007
Consolidated
interest expense, net during 2008 increased $6.1 million compared with the prior
year. Interest expense for the 2008 year was $2.2 million above that recorded in
2007. The timing of our issuance of $161.5 million in convertible debt in March
and April of 2007 accounted for $1.3 million of the full-year increase, as the
notes were outstanding for the entire 2008 year compared to a partial year in
2007. The impact of changes in foreign exchange rates and bank commitment fees
accounted for another $1.0 million of the increase. The decrease in interest
income is also largely due to the timing of the convertible debt issuance, as a
portion of the proceeds was invested in money market accounts and a strategic
cash management fund in the first half of 2007, and then subsequently used in
our stock buy-back program and in our capital expansion programs. In addition,
interest income was reduced by other-than-temporary losses on our strategic cash
management fund investment totaling $1.4 million in 2008. Capitalized interest
increased as a result of our Pharmaceutical Systems capital expansion projects
in Europe.
INCOME
TAXES
Our
effective tax rate was 16.2% in 2009, 21.6% in 2008 and 19.9% in 2007. The
following discrete items affected the comparability of effective tax rates in
2009 versus 2008:
|
·
|
In
2009, we recognized a $2.8 million net tax provision benefit principally
resulting from the completion of a tax audit and the expiration of open
tax periods in various tax
jurisdictions.
|
|
·
|
We
recognized tax credits of $2.4 million in 2009 resulting from the
identification of additional qualified R&D activities related to prior
years, and other tax provision benefits of $0.9 million primarily from the
reversal of valuation allowances on prior year tax losses carried
forward.
|
|
·
|
In
2008, an agreement with the Republic of Singapore reduced our income tax
rate in that country for a period of 10 years, on a retroactive basis back
to July 2007, resulting in a $1.0 million tax
benefit.
|
|
·
|
A
2008 United Kingdom tax law change effectively eliminated a portion of our
capital allowance carryforwards, resulting in a $1.2 million increase in
our tax provision.
|
|
·
|
Also
in 2008, we recognized a $3.4 million net tax provision benefit resulting
from the expiration of open audit years in various tax jurisdictions, and
$0.3 million in other discrete benefits including reversals of U.S. state
valuation allowances and provision adjustments for returns filed in
2008.
|
During
2009, we recognized a pre-tax benefit of $2.0 million relating to our
participation in the tax amnesty program in Brazil along with the related income
tax provision of $1.6 million. The impact of these items and the tax effect on
restructuring, impairment and other charges reduced our effective tax rate by
7.2 percentage points in 2009 and 3.2 percentage points in 2008. Excluding these
items mentioned above, our effective tax rate was 23.4% and 24.8% for 2009 and
2008, respectively. The lower 2009 effective tax rate resulted from a larger
amount of U.S. foreign tax credits on taxes paid in certain foreign
jurisdictions and increased current year development activities that qualified
for R&D tax credits.
In
addition to the 2008 factors listed above, the following items impacted the
comparability of the tax rate in 2008 versus 2007:
|
·
|
In
2007, we recognized a $3.2 million provision benefit related to tax
credits originally generated and fully reserved in previous
periods.
|
|
·
|
We
recorded a $3.7 million tax provision benefit in 2007 principally
resulting from the revision of tax planning strategies and the completion
of related documentation supporting prior year R&D credits, and a $1.3
million tax benefit due to the closure of certain U.S. federal and state
tax audit years.
|
34
The
impact of these two items and the 2007 restructuring activities reduced our
effective tax rate by 8.8 percentage points. Excluding these items in both
years’ results in an effective tax rate of 24.8% in 2008 and 28.7% in 2007, the
decrease resulting from a change in geographic mix of earnings and an increase
in R&D tax benefits in the U.S. and Ireland.
Our
anticipated effective tax rate for the year ending December 31, 2010 is expected
to be relatively consistent with that of 2009, absent the impact of discrete
items or legislative changes in tax rates.
EQUITY
IN NET INCOME OF AFFILIATES
Equity in
net income from our 25% ownership interest in Daikyo in Japan and our 49%
ownership interest in three companies in Mexico was $3.0 million, $0.8 million,
and $2.5 million for the years 2009, 2008 and 2007, respectively. The
significant increase in equity earnings for 2009 versus 2008 came from Daikyo,
as their sales were 14% above prior-year levels, and their gross margins
improved by 8 percentage points. Contributing to the improvement were higher
sales of various pharmaceutical packaging components, an increase in royalty
income and favorable foreign currency exchange rates. Also, 2008 results were
adversely affected by significant charges for plant demolition and higher
pension costs, as described below.
Our 2008
equity income was $1.7 million lower than the prior year due to reduced earnings
of Daikyo. The lower earnings were primarily the result of plant demolition and
disposal costs, as well as incremental depreciation expense associated with a
significant Crystal Zenith capital expansion project and pension plan
termination costs.
Purchases
from affiliates totaled $45.4 million in 2009, $36.3 million in 2008 and $31.3
million in 2007, the majority of which related to a distributorship agreement
with Daikyo which allows us to purchase and re-sell Daikyo products. Sales to
affiliates were $1.9 million, $1.7 million and $0.9 million in 2009, 2008 and
2007, respectively.
INCOME
FROM CONTINUING OPERATIONS
Income
from continuing operations in 2009 was $72.6 million, a decrease of $13.4
million over 2008. Diluted earnings per share in 2009 was $2.12, a decrease of
$0.38 per diluted share compared with the prior year. Our 2009 results included
the impact of restructuring charges and asset impairments of $9.5 million
pre-tax ($6.3 million after tax), a gain on Brazilian tax amnesty benefits of
$2.0 million pre-tax ($0.4 million after tax) and the recognition of discrete
tax benefits totaling $6.1 million. Collectively, these items increased net
income from continuing operations by $0.2 million, or $0.01 per diluted
share.
Income
from continuing operations attributable to common shareholders in 2008 was $86.0
million, an increase of $14.8 million over 2007. Diluted earnings per share in
2008 was $2.50, an increase of $0.44 per diluted share over the prior year. Our
2008 results included a net gain on contract settlement proceeds of $4.2 million
pre-tax ($2.7 million after tax), restructuring and related charges of $3.0
million pre-tax ($1.9 million after tax), and discrete income tax benefits of
$3.5 million. In the aggregate, these items increased net income from continuing
operations by $4.3 million, or $0.12 per diluted share.
Income
from continuing operations attributable to common shareholders in 2007 was $71.2
million, or $2.06 per diluted share. Our 2007 results include the impact of
restructuring charges, an impairment loss on our customer contract intangible
asset with Nektar, and our provisions for Brazilian tax issues which totaled
$26.4 million pre-tax ($19.4 million after tax) and discrete tax benefits of
$8.2 million. Collectively, these items reduced net income from continuing
operations by $11.2 million, or $0.31 per diluted share.
DISCONTINUED
OPERATIONS
Our 2007
results included a $0.5 million provision for claims resulting from the 2005
divestiture of our former drug delivery business.
35
FINANCIAL
CONDITION, LIQUIDITY AND CAPITAL RESOURCES
Cash
Flow Activity
The
following table and explanations provide cash flow data from continuing
operations for the years ended December 31,
|
($
in millions)
|
2009
|
2008
|
2007
|
|||||||||
|
Net
cash provided by operating activities
|
$ | 137.7 | $ | 135.0 | $ | 129.2 | ||||||
|
Net
cash used in investing activities
|
$ | (121.9 | ) | $ | (119.7 | ) | $ | (155.9 | ) | |||
|
Net
cash provided by (used in) financing activities
|
$ | (22.6 | ) | $ | (29.4 | ) | $ | 84.6 | ||||
Cash Flows from Operating Activities
– Our 2009 operating cash flows increased $2.7 million compared to the
prior year. The lower net income in the current year, net of an increased amount
of non-cash charges such as depreciation, amortization and stock-based
compensation, was more than offset by favorable variances in other assets and
liabilities including lower cash paid for taxes in 2009 compared with the prior
year. Included in 2009 net cash provided by operating activities was a $10.0
million voluntary contribution to our U.S. qualified pension plan, compared with
no contributions made during 2008. Included in 2008 operating cash flow was a
$12.7 million payment for income tax and other tax-related issues in
Brazil.
Operating
cash flow increased $5.8 million in 2008 compared to the prior year, including
$16.7 million in proceeds received from our contract settlement with Nektar,
partially offset by related cash costs of $7.0 million. Our favorable cash flow
from operating results and the impact of this contract settlement was reduced by
the 2008 payment of income and other tax-related liabilities in Brazil totaling
$12.7 million. Operating cash flows in 2007 also reflected significant cash
payments related to tax issues in Brazil. During 2007, we paid $11.7 million to
escrow representing judicial deposits for the benefit of the Brazil government
to avoid further accretion of interest and penalties on tax-related liabilities.
After considering these items, the 2008 cash flows from operating activities
were slightly lower than 2007, as increased earnings in 2008 were offset by cash
outflows for changes in working capital and other assets and
liabilities.
Cash Flows from Investing Activities
– Cash used in investing activities was $2.2 million higher than the 2008
amount as a result of increased spending on a business acquisition and fewer
cash redemptions of short-term investments, partially offset by decreased
capital spending. During 2009, cash redemptions from short-term investments were
$14.2 million less than the prior year, the majority of which related to the
liquidation of our investment in the Columbia Strategic Cash Portfolio Fund,
which was fully redeemed at December 31, 2009. See Note 15, Fair Value of Financial
Instruments, to the consolidated financial statements for more
information regarding the Columbia Strategic Cash Portfolio Fund. Cash paid to
acquire the Plastef business assets and other acquisition-related earnouts paid
during 2009 totaled $19.8 million.
Capital
spending in 2009 totaled $104.9 million, a $33.7 million decrease over the prior
year. Pharmaceutical Systems spending was $93.3 million, a decrease of $29.0
million over the prior year resulting from the completion of several major plant
expansion projects that began during 2008 and were placed into service during
2009. In the aggregate, we spent $26.3 million less for capital expansion
projects in 2009 compared to the prior year, a portion of which was the result
of discretionary reductions in spending as we postponed certain components of
our expansion plans in response to the recessionary impacts on market demand.
The remainder of the decrease related to lower spending on information
technology projects as our project to replace our North American procurement and
plant operations systems was completed in the fourth quarter of 2009. Tech Group
capital spending was $11.4 million, an increase of $2.2 million compared to the
prior year. The remainder of the decrease relates to changes in the 2009 balance
of accrued capital spending compared to the 2008 change.
In 2008,
cash flows used in investing activities were $36.2 million less than the prior
year, despite a $9.2 million increase in capital spending. The majority of the
year-over-year decrease resulted from $16.8 million in redemptions from the
Columbia Strategic Cash Portfolio Fund, compared to $22.7 million in net
purchases in 2007.
36
Capital
spending totaled $138.6 million in 2008 compared with $129.4 million in the
prior year. Pharmaceutical Systems spending was $122.3 million, an increase of
$14.2 million over the prior year. The increase was the result of major projects
to increase our manufacturing capacity, including the expansion of our rubber
compounding capacity in Kinston, North Carolina, and ongoing plant expansion
projects in Europe and Asia. A portion of the total spending increase pertained
to information technology as we replaced our financial reporting, cash
disbursements and order-to-cash systems in North America. Tech Group capital
spending was $9.2 million, a decrease of $11.7 million compared to the prior
year. Spending in 2007 was higher due to our Grand Rapids, Michigan plant
expansion project. The remainder of the increase relates to a change in the 2008
balance of accrued capital spending compared to the 2007 change.
Cash Flows from Financing Activities
– The year-over-year decrease in cash used for financing activities was
the result of payments made in 2008 to acquire the remaining noncontrolling
interest (10%) in our Medimop subsidiaries, partially offset by a larger amount
of debt repayment and higher dividend payments in 2009 compared to 2008. Cash
flows used in financing activities for 2009 included $5.9 million in net
repayment of borrowings under our revolving credit facility and $4.3 million in
payments of short-term notes and capital leases compared with combined net debt
repayments of $9.2 million in 2008. We paid cash dividends totaling $20.1
million ($0.61 per share) during 2009, compared to $18.6 million ($0.57 per
share) and $17.5 million ($0.53 per share) in 2008 and 2007, respectively. We
expect to continue our quarterly dividend program, subject to annual Board of
Directors’ approval.
In 2008,
the majority of the year-over-year decrease in cash flows from financing
activities resulted from the 2007 issuance of long-term debt, partially offset
by stock repurchase activity and the acquisition of the remaining
non-controlling ownership of Medimop for $8.5 million. Cash flows used in
financing activities for 2008 included $12.3 million in net repayment of
borrowings under our revolving credit facility and $3.1 million in new issuances
of short-term notes payable. Cash dividends paid during 2008 increase by $1.1
million over the 2007 amount. Cash flows provided by financing activities for
2007 included the issuance of $161.5 million of convertible junior subordinated
debentures carrying a 4% coupon rate and due in March of 2047, resulting in net
cash proceeds of $156.3 million, after payment of underwriting and other costs
of $5.2 million. These net proceeds provided funds used in the reduction of
revolving credit facility borrowings totaling $19.1 million. During 2007, we
initiated and completed an open-market repurchase program under which we
acquired 980,300 shares of common stock at total cost of $39.4 million ($40.23
per share).
Liquidity
Measures
The table
below displays key liquidity measures for West as of December 31,
|
($
in millions)
|
2009
|
2008
|
2007
|
|||||||||
|
Cash
and cash equivalents
|
$ | 83.1 | $ | 87.2 | $ | 108.4 | ||||||
|
Working
capital
|
$ | 226.1 | $ | 207.1 | $ | 229.4 | ||||||
|
Current
ratio
|
2.3
to 1
|
2.3
to 1
|
2.3
to 1
|
|||||||||
|
Total
debt
|
$ | 379.6 | $ | 386.0 | $ | 395.1 | ||||||
|
Net
debt-to-total invested capital
|
33.9 | % | 38.0 | % | 36.9 | % | ||||||
Short-term
investments that have maturities of ninety days or less when purchased are
considered cash equivalents. Working capital is defined as current assets less
current liabilities. Current ratio is defined as the ratio of current assets to
current liabilities. Net debt is defined as total debt less cash and cash
equivalents, and total invested capital is defined as the sum of net debt and
total shareholders' equity.
Working
capital at December 31, 2009 increased $19.0 million compared with the balance
at December 31, 2008, reflecting higher trade accounts receivable and
inventories partially offset by increased accrued liabilities balances. Both
accounts receivable and inventory increased due to the impact of foreign
currency exchange rates and from the addition of assets acquired from Plastef in
July 2009. In addition, accounts receivable was higher as a result of a
significant increase in fourth quarter 2009 sales, and inventory
increased
37
due to an
increase in strategic stock of certain raw materials and higher finished goods
balances. Our accounts receivable days-sales-outstanding (“DSO”) ratio was 48
days at December 31, 2009 compared to 45 days at December 31, 2008, and our
inventory turnover ratio was 6.1 and 6.5 at December 31, 2009 and 2008,
respectively. Included in working capital at December 31, 2009 and 2008 was cash
held in escrow representing judicial deposits for the government of Brazil
related to various tax positions taken in prior years and the related tax
liabilities. The escrow balance recorded in other current assets at December 31,
2009 was $12.1 million which will be used to settle our outstanding tax-related
obligations in that country. As a result of the 2009 Brazil tax amnesty program,
we estimate that $4.8 million in excess deposits will be returned to us over the
next twelve months as the underlying tax cases are settled.
The 2009
ratio of net debt-to-total invested capital decreased by 4.1 percentage points
compared with the prior year as a result of our debt repayments and increases in
other comprehensive income resulting from foreign currency translation and
current year earnings net of dividends. The $6.4 million decrease in total debt
resulted from $10.2 million in cash payments, partially offset by foreign
exchange increases of $1.4 million and $2.4 million in capital leases acquired
from Plastef.
Based on
our business outlook and our capital structure at the close of 2009, we believe
that we have ample liquidity to fund our business needs, new product
development, capital expansion, pension and other post-retirement benefits and
to pay dividends. We expect that our cash requirements for the foreseeable
future will be met primarily through our cash flows from operations, cash and
cash equivalents on hand, and amounts available under our $200.0 million
multi-currency unsecured committed revolving credit agreement, which we
generally use for working capital requirements. As of December 31, 2009, we had
available $174.5 million of borrowing capacity under this facility, and we have
not experienced any limit on our ability to access this source of funds. Amounts
outstanding under this revolving credit agreement are currently classified as
long-term debt based upon our intent and ability to refinance amounts borrowed
on a long-term basis. Due to the fact that this facility expires in February of
2011, any amounts outstanding under this facility as of the end of our first
quarter in 2010 will need to be reclassified to current liabilities. We
currently intend to enter into a replacement facility prior to the February 2011
expiry date. Market conditions could affect the cost and terms of the
replacement facility, as well as terms of other debt instruments we enter into
from time to time.
To date,
we have not experienced any significant increase in customer collectibility
risks, nor have we experienced increased supply risks due to vendor insolvency.
We do not expect that recent global credit market conditions will have a
significant impact on our liquidity; however, no assurance can be given that the
ongoing economic downturn will not have a material adverse effect on our demand
for products, liquidity or capital resources.
Commitments
and Contractual Obligations
The
following table summarizes our contractual obligations and commitments at
December 31, 2009. These obligations are not expected to have a material impact
on liquidity.
|
Payments
Due By Period
|
||||||||||||||||||||
|
($
in millions)
|
Less
than 1 year
|
1
to 3 years
|
3
to 5 years
|
More
than 5 years
|
Total
|
|||||||||||||||
|
Unconditional
purchase obligations
|
$ | 6.7 | $ | 2.4 | $ | 2.9 | $ | 2.9 | $ | 14.9 | ||||||||||
|
Notes
payable and long-term debt
|
0.5 | 74.2 | 29.8 | 275.1 | 379.6 | |||||||||||||||
|
Interest
on long-term debt and interest rate swaps (1)
|
16.1 | 30.3 | 23.7 | 213.4 | 283.5 | |||||||||||||||
|
Operating
lease obligations
|
10.8 | 17.8 | 8.1 | 18.9 | 55.6 | |||||||||||||||
|
Pensions/other
post-retirement obligations
|
11.7 | - | - | - | 11.7 | |||||||||||||||
|
Total
contractual obligations
|
$ | 45.8 | $ | 124.7 | $ | 64.5 | $ | 510.3 | $ | 745.3 | ||||||||||
|
(1)
|
For
fixed-rate long-term debt, interest was based on principal amounts and
fixed coupon rates at year end. Future interest payments on variable-rate
debt were calculated using principal amounts and the applicable ending
interest rate at year end. Interest on fixed-rate derivative instruments
was based on notional amounts and fixed interest rates contractually
obligated at year end.
|
38
Reserves for uncertain tax
positions - The table above does not include $5.6 million of the total
unrecognized tax benefits for uncertain tax positions and approximately $0.5
million of associated accrued interest as of December 31, 2009. Due to the high
degree of uncertainty regarding the timing of potential cash flows, we cannot
reasonably estimate the settlement periods for amounts which may be
paid.
Letters of credit - We have
letters of credit totaling $2.1 million supporting the reimbursement of workers’
compensation and other claims paid on our behalf by insurance carriers and to
guarantee equipment lease payments in Ireland and the payment of sales tax
liabilities in the U.S. The accrual for insurance obligations was $5.2 million
at December 31, 2009.
Unconditional purchase
obligations – Our business creates a need to enter into various
commitments with suppliers. In accordance with U.S. GAAP, these purchase
obligations are not reflected in the accompanying consolidated balance sheets.
These purchase commitments do not exceed our projected requirements and are in
the normal course of business.
Foreign currency contracts –
We periodically enter into foreign currency contracts to reduce our exposure to
variability in cash flows related to anticipated purchases of raw materials and
other inventory denominated in non-functional currencies. We also enter into
forward exchange contracts to mitigate exposure of non-functional currency asset
and liability balances to changes in exchange rates. As of December 31, 2009,
the liability at a fair value of our foreign currency hedge contract was $0.1
million, which was not reflected in the above table.
Pension/other post-retirement
obligations – Our objective in funding the U.S. tax-qualified pension
plan is to accumulate funds sufficient to provide for all benefits and to
satisfy the minimum contribution requirements of ERISA. Our annual funding
decision also takes into account the extent to which the benefit obligation
exceeds its corresponding funded status. Outside of the U.S., our objective is
to fund the retirement costs over time within the limits of minimum requirements
and allowable tax deductions. The table above reflects an estimated 2010 minimum
U.S. qualified pension plan contribution in the amount of $8.0 million. The
amounts and timing of future company contributions to the defined benefit and
other post-retirement pension plans are unknown because they are dependent on
pension fund asset performance, as well as other factors. The non-qualified
defined benefit pension plans and post-retirement medical plans are generally
not funded in advance.
OFF-BALANCE
SHEET AGREEMENTS
At
December 31, 2009, the Company had no off-balance sheet financing arrangements
other than operating leases and unconditional purchase obligations incurred in
the ordinary course of business and outstanding letters of credit related to
various insurance programs and leased equipment and sales tax liability
guarantees as noted above.
CRITICAL
ACCOUNTING POLICIES AND ESTIMATES
Management’s
discussion and analysis addresses consolidated financial statements that are
prepared in accordance with accounting principles generally accepted in the U.S.
The application of these principles requires management to make estimates and
assumptions, some of which are subjective and complex, that affect the amounts
reported in the consolidated financial statements. We believe the following
accounting policies and estimates are critical to understanding and evaluating
our results of operations and financial position:
39
REVENUE RECOGNITION: The majority of our
revenue is generated from our product manufacturing operations which convert
rubber, metal, and plastic raw materials into parts used in closure systems and
syringe components for use with injectable drugs and drug delivery devices.
Sales of manufactured components are recorded at the time title and risk of loss
passes to the customer. Some customers receive pricing rebates upon attaining
established sales volumes. Management records rebate costs when the sales occur
based on its assessment of the likelihood that these volumes will be attained.
We also establish product return liabilities for customer quality claims when
such amounts are deemed probable and can be reasonably estimated.
IMPAIRMENT OF LONG-LIVED
ASSETS: We review goodwill and other long-lived assets annually and
whenever circumstances indicate that the carrying value of these assets may not
be recoverable. Goodwill is tested for impairment as part of the reporting unit
to which it belongs. Our reporting units are the same as our operating segments,
which we have determined to be the Americas and Europe/Asia Pacific divisions of
the Pharmaceutical Systems segment and the Americas and Europe divisions of our
Tech Group segment. For assets held and used in the business, management
estimates the future cash flows to be derived from the related asset or business
unit. When assets are held for sale, management determines fair value by
estimating the anticipated proceeds to be received upon the sale of the asset,
less disposition costs. Changes in the estimate of fair value, including the
estimate of future cash flows, could have a material impact on our future
results of operations and financial position.
EMPLOYEE BENEFITS: We sponsor
qualified and non-qualified defined benefit pension plans that cover employees
in the U.S. and in a number of other countries. In addition, we sponsor unfunded
postretirement benefit plans, which provide healthcare benefits for eligible
employees who retire or are disabled. The measurement of the annual cost and
obligations under our defined benefit pension and postretirement medical plans
is subject to a number of assumptions. U.S. GAAP accounting for compensation and
retirement benefits requires companies to use an expected long-term rate of
asset return assumption for computing current year pension expense. For U.S.
plans, which accounted for 91% of global plan assets, the long-term rate of
return assumption was 7.75% in 2009 and 8.0% in the prior two years. This
assumption is reviewed annually and determined by the projected return for our
target mix of plan assets (approximately 65% equity and 35% debt securities).
Differences between the actual and expected returns are recognized in
accumulated other comprehensive income (loss) and subsequently amortized into
earnings as actuarial gains or losses. The accounting standards also require
companies to discount future obligations back to today’s dollars using an
appropriate discount rate. The discount rate selected is the single rate
equivalent for a theoretical portfolio of high quality corporate bonds that
produces a cash flow pattern equivalent to our plans’ projected benefit
payments. An increase in the discount rate decreases the pension benefit
obligation. This decrease is recognized in accumulated other comprehensive
income (loss) and subsequently amortized into earnings as an actuarial
gain.
Changes
in key assumptions, including the market performance of plan assets and other
actuarial assumptions, could have a material impact on our future results of
operations and financial position. We estimate that every 25 basis point
reduction in the long-term rate of return assumption would increase pension
expense by $0.5 million, and a 25 basis point reduction in the discount rate
would increase pension expense by $0.5 million.
The
discount rate used in determining the U.S. pension plans’ benefit obligation at
December 31, 2009 decreased 50 basis points to 6.0%, to reflect market
conditions at that time. As of December 31, 2009, pre-tax actuarial losses
recognized in accumulated other comprehensive loss related to pension and other
retirement benefits were $88.4 million, including a current year actuarial gain
of $1.1 million compared with a 2008 actuarial loss of $56.5 million. We
estimate that our 2010 pension costs will be approximately $2.0 lower than 2009
as a result of improved plan asset performance and other changes in
assumptions.
40
U.S. GAAP
requires the recognition of an asset or liability for the funded status of a
defined benefit postretirement plan as measured by the difference between the
fair value of plan assets and the benefit obligation. For a pension plan, the
benefit obligation is the projected benefit obligation; for any other
postretirement plan, such as a retiree health plan, the benefit obligation is
the accumulated postretirement benefit obligation. For 2009, the U.S. pension
plan assets generated an actual return of 26.5%, compared to a loss of 25.0% in
2008, resulting in an improvement in funded status during 2009 compared to the
significant decline in funded status during the prior year. Partially offsetting
the improvement was a decrease in our weighted average discount rate (from 6.46%
at December 31, 2008 to 5.94% at December 31, 2009), which increased our pension
plan liability. Our net pension underfunded balance at December 31, 2009 was
$69.1 million compared to $73.0 million at December 31, 2008. Our underfunded
balance for other postretirement benefits was $18.1 million and $15.0 million at
December 31, 2009 and 2008, respectively.
INCOME TAXES: We estimate
income taxes payable based upon current domestic and international tax
legislation. In addition, deferred income tax assets and liabilities are
established to recognize differences between the tax basis and financial
statement carrying values of assets and liabilities. We maintain valuation
allowances where it is more likely than not that all or a portion of a deferred
tax asset will not be realized. The recoverability of tax assets is subject to
our estimates of future profitability, generally at the respective subsidiary
company and country level. Changes in tax legislation, business plans and other
factors may affect the ultimate recoverability of tax assets or final tax
payments, which could result in adjustments to tax expense in the period such
change is determined.
On
January 1, 2007, we adopted the requirements for accounting for uncertainty in
income taxes recognized in financial statements which prescribes a
more-likely-than-not threshold for financial statement recognition and
measurement of a tax position taken or expected to be taken in a tax return. The
adoption of this accounting standard resulted in the recognition of net tax
assets that met the more-likely-than-not threshold of $21.6 million and was
reflected as an adjustment to the opening balance of retained earnings for
2007.
Please
refer to Note 1, Summary of
Significant Accounting Policies and Note 19, New Accounting Standards, to
our consolidated financial statements for additional information on accounting
and reporting standards considered in the preparation and presentation of our
financial statements.
ITEM 7A. QUANTITATIVE AND QUALITATIVE DISCLOSURE
ABOUT MARKET RISK.
We are
exposed to various market risk factors such as fluctuating interest rates,
foreign currency exchange rates and increasing commodity prices. These risk
factors can impact our results of operations, cash flows and financial position.
To manage these risks, we periodically enter into derivative financial
instruments such as interest rate swaps, call options and forward exchange
contracts for periods consistent with and for notional amounts equal to or less
than the underlying exposures. In accordance with Company policy, derivative
financial instruments are not used for speculation or trading
purposes.
Foreign Currency Exchange
Risk
We have
subsidiaries outside the U.S. accounting for over 50% of consolidated net sales.
Virtually all of these sales and related operating costs are denominated in the
currency of the local country and translated into U.S. dollars for consolidated
reporting purposes. Although the majority of the assets and liabilities of these
subsidiaries are denominated in the functional currency of the subsidiary, they
may also hold assets or liabilities not denominated in other currencies. These
items may give rise to foreign currency transaction gains and losses. As a
result, our results of operations and financial position are exposed to changing
currency exchange rates. We periodically use forward contracts to hedge certain
transactions or to neutralize month-end balance sheet exposures on
cross-currency intercompany loans.
As of
December 31, 2009, we have entered into a forward exchange contract hedging a
non-functional currency obligation with a fair value of $0.1 million at December
31, 2009.
41
In
addition, we have designated our €81.5 million Euro-denominated notes as a hedge
of our investment in the net assets of our European operations. We also have a
1.7 billion Yen-denominated note payable which has been designated as a hedge of
our investment in a Japanese affiliate. At December 31, 2009, a cumulative
foreign currency translation loss on these net investment hedges of $14.4
million (net of tax of $8.9 million) was recorded within accumulated other
comprehensive income.
Interest Rate
Risk
As a
result of our normal borrowing activities, we have long-term debt with both
fixed and variable interest rates. Long-term debt consists of senior notes,
convertible debentures, revolving credit facilities and capital lease
obligations. Our exposures to fluctuations in interest rates are managed to the
extent considered necessary by entering into interest rate swap
agreements.
The
following table summarizes our interest rate risk-sensitive
instruments:
|
($
in millions)
|
2010
|
2011
|
2012
|
2013
|
2014
|
Thereafter
|
Carrying
Value
|
Fair
Value
|
||||||||||||||||||||||||
|
Current
Debt and Capital Leases:
|
||||||||||||||||||||||||||||||||
|
Euro
denominated
|
$ | 0.4 | - | - | - | - | - | $ | 0.4 | $ | 0.4 | |||||||||||||||||||||
|
Average
interest rate – fixed
|
5.4 | % | ||||||||||||||||||||||||||||||
|
Real
denominated
|
0.1 | - | - | - | - | - | 0.1 | 0.1 | ||||||||||||||||||||||||
|
Average
interest rate – fixed
|
6.4 | % | ||||||||||||||||||||||||||||||
|
Long-Term
Debt and Capital Leases:
|
||||||||||||||||||||||||||||||||
|
U.S.
dollar denominated (1)
|
- | - | 50.0 | - | - | 25.0 | 75.0 | 70.9 | ||||||||||||||||||||||||
|
Average
interest rate – variable
|
1.1 | % | 1.2 | % | ||||||||||||||||||||||||||||
|
U.S.
dollar denominated
|
- | - | - | - | - | 161.5 | 161.5 | 135.5 | ||||||||||||||||||||||||
|
Average
interest rate – fixed
|
4.0 | % | ||||||||||||||||||||||||||||||
|
Euro
denominated
|
- | 0.6 | 0.3 | 29.8 | - | 88.6 | 119.3 | 116.3 | ||||||||||||||||||||||||
|
Average
interest rate – fixed
|
4.2 | % | 5.3 | % | 4.3 | % | 4.4 | % | ||||||||||||||||||||||||
|
British
pound denominated
|
- | 4.8 | - | - | - | - | 4.8 | 4.7 | ||||||||||||||||||||||||
|
Average
interest rate – fixed
|
1.4 | % | ||||||||||||||||||||||||||||||
|
Yen
denominated
|
- | 18.4 | - | - | - | - | 18.4 | 18.1 | ||||||||||||||||||||||||
|
Average
interest rate – variable
|
1.0 | % | ||||||||||||||||||||||||||||||
(1) As of
December 31, 2009, we have two interest rate swap agreements outstanding which
are designed to protect against volatility in variable interest rates payable on
a $50.0 million note maturing on July 28, 2012 (“Series A Note”) and a $25.0
million note maturing July 28, 2015 (“Series B Note”). The first interest-rate
swap agreement has a notional amount of $50.0 million and corresponds to the
maturity date of the Series A Note and the second interest rate swap has a
notional amount of $25.0 million and corresponds with the maturity date of the
Series B Note. Under each of the swap agreements we will receive variable
interest rate payments based on three-month LIBOR in return for making quarterly
fixed payments. The interest-rate swap agreements effectively fix the interest
rates payable on our Series A and B notes at 5.32% and 5.51%, respectively. At
December 31, 2009, the interest rate-swap agreements had a fair value of $5.5
million, unfavorable to the Company, and are recorded as a noncurrent
liability.
Commodity Price
Risk
Many of
our Pharmaceutical Systems products are made from synthetic elastomers, which
are derived from the petroleum refining process. We purchase the majority of our
elastomers via long-term supply contracts, some of which contain clauses that
provide for surcharges related to changes in crude oil prices. In December 2009,
we purchased a series of crude oil call options for a total of 47,000 barrels of
crude oil, which are intended to reduce our exposure to increases in oil-based
surcharges and protect operating cash flows with regard to a portion of our
forecasted elastomer purchases during the months of July through December 2010.
These call options cap our cost of the crude oil component of elastomer prices
for a portion of our forecasted purchases, allowing us to limit our exposure to
increasing petroleum prices. With these option contracts, we may benefit from a
decline in crude oil prices, as there is no downward exposure other than the
premium that we paid to purchase the contracts. These call options were not
designated as hedging instruments.
42
ITEM 8. FINANCIAL STATEMENTS AND SUPPLEMENTARY
DATA.
CONSOLIDATED
STATEMENTS OF INCOME
West
Pharmaceutical Services, Inc. and Subsidiaries for the years ended December 31,
2009, 2008 and 2007
|
(in
millions, except per share data)
|
2009
|
2008
|
2007
|
|||||||||
|
Net
sales
|
$ | 1,055.7 | $ | 1,051.1 | $ | 1,020.1 | ||||||
|
Cost
of goods and services sold
|
752.1 | 748.5 | 728.3 | |||||||||
|
Gross
profit
|
303.6 | 302.6 | 291.8 | |||||||||
|
Research
and development
|
19.9 | 18.7 | 16.1 | |||||||||
|
Selling,
general and administrative expenses
|
177.7 | 159.3 | 152.5 | |||||||||
|
Restructuring
and other items (Note 4)
|
8.5 | 0.5 | 28.3 | |||||||||
|
Operating
profit
|
97.5 | 124.1 | 94.9 | |||||||||
|
Interest
expense
|
15.2 | 16.0 | 14.5 | |||||||||
|
Interest
income
|
(0.8 | ) | (1.4 | ) | (6.0 | ) | ||||||
|
Income
before income taxes
|
83.1 | 109.5 | 86.4 | |||||||||
|
Income
tax expense
|
13.5 | 23.7 | 17.2 | |||||||||
|
Equity
in net income of affiliated companies
|
3.0 | 0.8 | 2.5 | |||||||||
|
Income
from continuing operations
|
72.6 | 86.6 | 71.7 | |||||||||
|
Loss
from discontinued operations, net of tax
|
- | - | (0.5 | ) | ||||||||
|
Net
income
|
72.6 | 86.6 | 71.2 | |||||||||
|
Less:
net income attributable to noncontrolling interests
|
- | 0.6 | 0.5 | |||||||||
|
Net
income attributable to common shareholders
|
$ | 72.6 | $ | 86.0 | $ | 70.7 | ||||||
|
Net
income per share attributable to common shareholders:
|
||||||||||||
|
Basic:
|
||||||||||||
|
Continuing
operations
|
$ | 2.21 | $ | 2.65 | $ | 2.18 | ||||||
|
Discontinued
operations
|
- | - | (0.02 | ) | ||||||||
| $ | 2.21 | $ | 2.65 | $ | 2.16 | |||||||
|
Diluted:
|
||||||||||||
|
Continuing
operations
|
$ | 2.12 | $ | 2.50 | $ | 2.06 | ||||||
|
Discontinued
operations
|
- | - | (0.01 | ) | ||||||||
| $ | 2.12 | $ | 2.50 | $ | 2.05 | |||||||
|
Weighted
average common shares outstanding
|
32.8 | 32.4 | 32.7 | |||||||||
|
Weighted
average shares assuming dilution
|
36.3 | 36.1 | 36.2 | |||||||||
|
Amounts
attributable to common shareholders:
|
||||||||||||
|
Income
from continuing operations
|
$ | 72.6 | $ | 86.0 | $ | 71.2 | ||||||
|
Loss
from discontinued operations, net of tax
|
- | - | (0.5 | ) | ||||||||
|
Net
income
|
$ | 72.6 | $ | 86.0 | $ | 70.7 | ||||||
The
accompanying notes are an integral part of the consolidated financial
statements.
43
CONSOLIDATED
STATEMENTS OF COMPREHENSIVE INCOME
West
Pharmaceutical Services, Inc. and Subsidiaries for the years ended December 31,
2009, 2008 and 2007
|
(in
millions)
|
2009
|
2008
|
2007
|
|||||||||
|
Net
income
|
$ | 72.6 | $ | 86.6 | $ | 71.2 | ||||||
|
Other
comprehensive (loss) income, net of tax (tax amounts shown below for 2009,
2008, 2007, respectively):
|
||||||||||||
|
Foreign
currency translation adjustments
|
19.0 | (38.3 | ) | 20.3 | ||||||||
|
Defined
benefit pension and other postretirement plans:
|
||||||||||||
|
Prior
service cost arising during period, net of tax of $0, $0 and
$(0.7)
|
- | - | (1.2 | ) | ||||||||
|
Net
actuarial (loss) gain arising during period, net of tax of $(1.1), $(21.6)
and $3.4
|
- | (34.9 | ) | 6.4 | ||||||||
|
Less:
amortization of actuarial loss, net of tax of $2.7, $0.6 and
$1.0
|
4.3 | 1.0 | 1.6 | |||||||||
|
Less:
amortization of prior service credit included in net periodic benefit
cost, net of tax of $(0.4), $(0.4) and $(0.4)
|
(0.6 | ) | (0.6 | ) | (0.7 | ) | ||||||
|
Less:
amortization of transition obligation included in net periodic benefit
cost
|
0.1 | 0.1 | 0.1 | |||||||||
|
Net
unrealized (losses) gains on investment securities, net of tax of $0.3,
$(1.6) and $(0.4)
|
0.4 | (2.2 | ) | (0.6 | ) | |||||||
|
Unrealized
gains (losses) on derivatives, net of tax of $1.2, $(2.8) and
$(1.3)
|
2.0 | (4.4 | ) | (2.1 | ) | |||||||
|
Other
comprehensive income (loss), net of tax
|
25.2 | (79.3 | ) | 23.8 | ||||||||
|
Comprehensive
income
|
97.8 | 7.3 | 95.0 | |||||||||
|
Comprehensive
(loss) income attributable to noncontrolling interests
|
- | (0.2 | ) | 0.9 | ||||||||
|
Comprehensive
income attributable to common shareholders
|
$ | 97.8 | $ | 7.5 | $ | 94.1 | ||||||
The
accompanying notes are an integral part of the consolidated financial
statements.
44
CONSOLIDATED
BALANCE SHEETS
West
Pharmaceutical Services, Inc. and Subsidiaries at December 31, 2009 and
2008
|
(in
millions, except per share data)
|
2009
|
2008
|
||||||
|
ASSETS
|
||||||||
|
Current
assets:
|
||||||||
|
Cash,
including cash equivalents
|
$ | 83.1 | $ | 87.2 | ||||
|
Accounts
receivable, net
|
138.7 | 128.6 | ||||||
|
Inventories
|
129.2 | 115.7 | ||||||
|
Deferred
income taxes
|
7.8 | 5.1 | ||||||
|
Other
current assets
|
38.4 | 29.6 | ||||||
|
Total
current assets
|
397.2 | 366.2 | ||||||
|
Property,
plant and equipment
|
1,062.1 | 965.0 | ||||||
|
Less
accumulated depreciation and amortization
|
485.0 | 434.0 | ||||||
|
Property,
plant and equipment, net
|
577.1 | 531.0 | ||||||
|
Investments
in affiliated companies
|
38.2 | 33.6 | ||||||
|
Goodwill
|
114.2 | 105.3 | ||||||
|
Deferred
income taxes
|
69.4 | 63.7 | ||||||
|
Intangible
assets, net
|
55.6 | 50.0 | ||||||
|
Other
assets
|
19.3 | 18.9 | ||||||
|
Total
Assets
|
$ | 1,271.0 | $ | 1,168.7 | ||||
|
LIABILITIES
AND SHAREHOLDERS’ EQUITY
|
||||||||
|
Current
liabilities:
|
||||||||
|
Notes
payable and other current debt
|
$ | 0.5 | $ | 3.9 | ||||
|
Accounts
payable
|
68.4 | 67.6 | ||||||
|
Pension
and other postretirement benefits
|
2.1 | 2.0 | ||||||
|
Accrued
salaries, wages and benefits
|
46.8 | 42.3 | ||||||
|
Income
taxes payable
|
5.7 | 2.7 | ||||||
|
Taxes
other than income
|
8.1 | 7.0 | ||||||
|
Deferred
income taxes
|
0.1 | 0.9 | ||||||
|
Other
current liabilities
|
39.4 | 32.7 | ||||||
|
Total
current liabilities
|
171.1 | 159.1 | ||||||
|
Long-term
debt
|
379.1 | 382.1 | ||||||
|
Deferred
income taxes
|
22.9 | 20.4 | ||||||
|
Pension
and other postretirement benefits
|
85.1 | 86.0 | ||||||
|
Other
long-term liabilities
|
33.7 | 34.0 | ||||||
|
Total
Liabilities
|
691.9 | 681.6 | ||||||
|
Commitments
and contingencies (Note 18)
|
||||||||
|
Shareholders’
equity:
|
||||||||
|
Preferred
stock, 3.0 million shares authorized; 0 shares issued and 0 shares
outstanding in 2009 and 2008
|
- | - | ||||||
|
Common
stock, par value $.25 per share; 50.0 million shares authorized; shares
issued: 34.3 million in 2009 and 2008; shares outstanding: 33.0 million in
2009 and 32.7 million in 2008
|
8.6 | 8.6 | ||||||
|
Capital
in excess of par value
|
72.9 | 69.3 | ||||||
|
Retained
earnings
|
569.4 | 517.3 | ||||||
|
Accumulated
other comprehensive loss
|
(19.7 | ) | (44.9 | ) | ||||
|
Treasury
stock, at cost (1.3 million shares in 2009; 1.6 million shares in
2008)
|
(52.1 | ) | (63.2 | ) | ||||
|
Total
shareholders’ equity
|
579.1 | 487.1 | ||||||
|
Total
Liabilities and Equity
|
$ | 1,271.0 | $ | 1,168.7 | ||||
The
accompanying notes are an integral part of the consolidated financial
statements.
45
CONSOLIDATED
STATEMENTS OF CHANGES IN EQUITY
West
Pharmaceutical Services, Inc. and Subsidiaries for the years ended December 31,
2009, 2008 and 2007
|
Common
Shareholders
|
||||||||||||||||||||||||||||||||||||
|
Common
Stock
|
Treasury
Stock
|
|||||||||||||||||||||||||||||||||||
|
(in
millions, except per share data)
|
Number
of shares
|
Common
Stock
|
Capital
in excess of par value
|
Retained
earnings
|
Accumulated
other comprehensive income (loss)
|
Number
of shares
|
Treasury
Stock
|
Noncontrolling
Interest
|
Total
|
|||||||||||||||||||||||||||
|
Balance,
December 31, 2006
|
34.3 | $ | 8.6 | $ | 52.8 | $ | 375.7 | $ | 10.6 | (1.4 | ) | $ | (33.2 | ) | $ | 4.7 | $ | 419.2 | ||||||||||||||||||
|
Cumulative
effect of adoption of FIN 48 (Note 5)
|
21.6 | 21.6 | ||||||||||||||||||||||||||||||||||
|
Net
income
|
70.7 | 0.5 | 71.2 | |||||||||||||||||||||||||||||||||
|
Shares
issued under stock plans
|
2.8 | 0.4 | 3.7 | 6.5 | ||||||||||||||||||||||||||||||||
|
Stock-based
compensation
|
6.5 | 6.5 | ||||||||||||||||||||||||||||||||||
|
Shares
purchased under stock repurchase program
|
(1.0 | ) | (39.4 | ) | (39.4 | ) | ||||||||||||||||||||||||||||||
|
Shares
repurchased for employee tax withholdings
|
(1.0 | ) | (0.1 | ) | (2.6 | ) | (3.6 | ) | ||||||||||||||||||||||||||||
|
Excess
tax benefit from employee stock plans
|
3.2 | 3.2 | ||||||||||||||||||||||||||||||||||
|
Cash
dividends declared ($0.54 per share)
|
(17.7 | ) | (17.7 | ) | ||||||||||||||||||||||||||||||||
|
Affiliate
adoption of SFAS 158, net of tax
|
(0.4 | ) | (0.4 | ) | ||||||||||||||||||||||||||||||||
|
Changes
– other comprehensive income
|
23.4 | 0.4 | 23.8 | |||||||||||||||||||||||||||||||||
|
Balance,
December 31, 2007
|
34.3 | $ | 8.6 | $ | 64.3 | $ | 450.3 | $ | 33.6 | (2.1 | ) | $ | (71.5 | ) | $ | 5.6 | $ | 490.9 | ||||||||||||||||||
|
Net
income
|
86.0 | 0.6 | 86.6 | |||||||||||||||||||||||||||||||||
|
Shares
issued under stock plans
|
(6.1 | ) | 0.6 | 13.5 | 7.4 | |||||||||||||||||||||||||||||||
|
Stock-based
compensation
|
5.2 | 5.2 | ||||||||||||||||||||||||||||||||||
|
Shares
repurchased for employee tax withholdings
|
(0.1 | ) | (5.2 | ) | (5.2 | ) | ||||||||||||||||||||||||||||||
|
Excess
tax benefit from employee stock plans
|
5.9 | 5.9 | ||||||||||||||||||||||||||||||||||
|
Cash
dividends declared ($0.58 per share)
|
(19.0 | ) | (19.0 | ) | ||||||||||||||||||||||||||||||||
|
Changes
– other comprehensive loss
|
(78.5 | ) | (0.8 | ) | (79.3 | ) | ||||||||||||||||||||||||||||||
|
Purchase
of subsidiary shares from noncontrolling interest
|
(5.4 | ) | (5.4 | ) | ||||||||||||||||||||||||||||||||
|
Balance,
December 31, 2008
|
34.3 | $ | 8.6 | $ | 69.3 | $ | 517.3 | $ | (44.9 | ) | (1.6 | ) | $ | (63.2 | ) | $ | - | $ | 487.1 | |||||||||||||||||
|
Net
income
|
72.6 | 72.6 | ||||||||||||||||||||||||||||||||||
|
Shares
issued under stock plans
|
(5.9 | ) | 0.4 | 12.5 | 6.6 | |||||||||||||||||||||||||||||||
|
Stock-based
compensation
|
5.5 | 5.5 | ||||||||||||||||||||||||||||||||||
|
Shares
repurchased for employee tax withholdings
|
(0.1 | ) | (1.4 | ) | (1.4 | ) | ||||||||||||||||||||||||||||||
|
Excess
tax benefit from employee stock plans
|
4.0 | 4.0 | ||||||||||||||||||||||||||||||||||
|
Cash
dividends declared ($0.62 per share)
|
(20.5 | ) | (20.5 | ) | ||||||||||||||||||||||||||||||||
|
Changes
– other comprehensive income
|
25.2 | 25.2 | ||||||||||||||||||||||||||||||||||
|
Balance,
December 31, 2009
|
34.3 | $ | 8.6 | $ | 72.9 | $ | 569.4 | $ | (19.7 | ) | (1.3 | ) | $ | (52.1 | ) | $ | - | $ | 579.1 | |||||||||||||||||
The
accompanying notes are an integral part of the consolidated financial
statements.
46
CONSOLIDATED
STATEMENTS OF CASH FLOWS
West
Pharmaceutical Services, Inc. and Subsidiaries for the years ended December 31,
2009, 2008 and 2007
|
(in
millions)
|
2009
|
2008
|
2007
|
|||||||||
|
Cash
flows from operating activities:
|
||||||||||||
|
Net
income
|
$ | 72.6 | $ | 86.6 | $ | 71.2 | ||||||
|
Adjustments
to reconcile net income to net cash provided by operating activities of
continuing operations:
|
||||||||||||
|
Loss
from discontinued operations, net of tax
|
- | - | 0.5 | |||||||||
|
Depreciation
|
63.9 | 56.1 | 51.6 | |||||||||
|
Amortization
|
4.2 | 4.5 | 5.0 | |||||||||
|
Stock-based
compensation
|
7.5 | 6.4 | 5.1 | |||||||||
|
Loss
on sales of equipment and asset impairments
|
6.7 | - | 13.7 | |||||||||
|
Deferred
income taxes
|
(4.8 | ) | 7.3 | (6.4 | ) | |||||||
|
Pension
and other retirement plans
|
5.9 | 4.9 | 5.9 | |||||||||
|
Equity
in undistributed earnings of affiliates, net of dividends
|
(2.7 | ) | (0.7 | ) | (2.4 | ) | ||||||
|
Changes
in assets/liabilities, net of discontinued operations and
acquisitions:
|
||||||||||||
|
(Increase)
decrease in accounts receivable
|
(6.0 | ) | 1.9 | (20.5 | ) | |||||||
|
Increase
in inventories
|
(6.4 | ) | (13.4 | ) | (9.0 | ) | ||||||
|
(Increase)
decrease in other current assets
|
(0.1 | ) | (0.7 | ) | 3.9 | |||||||
|
(Decrease)
increase in accounts payable
|
(0.7 | ) | (3.3 | ) | 16.0 | |||||||
|
Changes
in other assets and liabilities
|
(2.4 | ) | (14.6 | ) | (5.4 | ) | ||||||
|
Net
cash provided by operating activities
|
137.7 | 135.0 | 129.2 | |||||||||
|
Cash
flows from investing activities:
|
||||||||||||
|
Capital
expenditures
|
(104.9 | ) | (138.6 | ) | (129.4 | ) | ||||||
|
Acquisition
of patents and other long-term assets
|
(2.9 | ) | (0.5 | ) | (4.7 | ) | ||||||
|
Acquisition
of business
|
(16.9 | ) | - | - | ||||||||
|
Redemptions
(purchase) of investments, net
|
2.6 | 16.8 | (22.7 | ) | ||||||||
|
Other
|
0.2 | 2.6 | 0.9 | |||||||||
|
Net
cash used in investing activities
|
(121.9 | ) | (119.7 | ) | (155.9 | ) | ||||||
|
Cash
flows from financing activities:
|
||||||||||||
|
Issuance
of long-term debt
|
- | - | 156.3 | |||||||||
|
Repayments
under revolving credit agreements, net
|
(5.9 | ) | (12.3 | ) | (19.1 | ) | ||||||
|
Changes
in other debt, including overdrafts
|
(4.3 | ) | 3.1 | 0.3 | ||||||||
|
Acquisition
of noncontrolling interest
|
- | (8.5 | ) | - | ||||||||
|
Dividend
payments
|
(20.1 | ) | (18.6 | ) | (17.5 | ) | ||||||
|
Shares
purchased under stock repurchase program
|
- | - | (39.4 | ) | ||||||||
|
Issuance
of common stock under employee stock plans
|
5.0 | 6.2 | 4.4 | |||||||||
|
Excess
tax benefit from employee stock plans
|
4.0 | 5.9 | 3.2 | |||||||||
|
Shares
repurchased for employee tax withholdings
|
(1.3 | ) | (5.2 | ) | (3.6 | ) | ||||||
|
Net
cash (used in) provided by financing activities
|
(22.6 | ) | (29.4 | ) | 84.6 | |||||||
|
Effect
of exchange rates on cash
|
2.7 | (7.1 | ) | 3.4 | ||||||||
|
Net
(decrease) increase in cash and cash equivalents
|
(4.1 | ) | (21.2 | ) | 61.3 | |||||||
|
Cash
and cash equivalents at beginning of period
|
87.2 | 108.4 | 47.1 | |||||||||
|
Cash
and cash equivalents at end of period
|
$ | 83.1 | $ | 87.2 | $ | 108.4 | ||||||
|
Supplemental
cash flow information:
|
||||||||||||
|
Interest
paid, net of amounts capitalized
|
$ | 15.5 | $ | 15.9 | $ | 12.2 | ||||||
|
Income
taxes paid, net
|
$ | 19.0 | $ | 25.0 | $ | 25.3 | ||||||
|
Dividends
declared, not paid
|
$ | 5.3 | $ | 4.9 | $ | 4.5 | ||||||
The
accompanying notes are an integral part of the consolidated financial
statements.
47
NOTES
TO CONSOLIDATED FINANCIAL STATEMENTS
Note
1: Summary of Significant Accounting Policies
Principles of
Consolidation: The
consolidated financial statements include the accounts of West Pharmaceutical
Services, Inc. and its majority-owned subsidiaries (which may be referred to as
“West”, the “Company”, “we”, “us” or “our”) after the elimination of
intercompany transactions. We have no participation or other rights in variable
interest entities.
Use of Estimates: The
financial statements are prepared in conformity with generally accepted
accounting principles in the United States (“U.S. GAAP”). These principles
require management to make estimates and assumptions that affect the reported
amounts of assets, liabilities, revenues and expenses and the disclosure of
contingencies in the financial statements. Actual amounts realized may differ
from these estimates.
Reclassifications: As
discussed in Note 19, New
Accounting Standards, we adopted new accounting guidance related to
noncontrolling interests in consolidated financial statements, which required
retrospective application. As a result, certain reclassifications were made to
prior period financial statements to conform to the current year
presentation.
Subsequent
Events:
We have
evaluated subsequent events and transactions for potential recognition or
disclosure in the financial statements through February 25, 2010, the date the
financial statements were issued.
Cash and Cash
Equivalents: Cash equivalents include time deposits,
certificates of deposit and all highly liquid debt instruments with maturities
of three months or less at the time of purchase.
Accounts Receivable: Our
accounts receivable balance at both December 31, 2009 and 2008 was net of an
allowance for doubtful accounts of $0.7 million. We record the allowance based
on a specific identification methodology.
Inventories: Inventories are
valued at the lower of standard cost (which approximates actual cost on a
first-in-first-out basis) or market. The following is a summary of
inventories at December 31:
|
($
in millions)
|
2009
|
2008
|
||||||
|
Finished
goods
|
$ | 53.6 | $ | 46.9 | ||||
|
Work
in process
|
19.7 | 18.8 | ||||||
|
Raw
materials
|
55.9 | 50.0 | ||||||
| $ | 129.2 | $ | 115.7 | |||||
Property, Plant and Equipment:
Property, plant and equipment assets are carried at cost. Maintenance and minor
repairs and renewals are charged to expense as incurred. Costs incurred for
computer software developed or obtained for internal use are capitalized for
application development activities and immediately expensed for preliminary
project activities or post-implementation activities. Upon sale or retirement of
depreciable assets, costs and related accumulated depreciation are eliminated,
and gains or losses are recognized in restructuring and other items.
Depreciation and amortization are computed principally using the straight-line
method over the estimated useful lives of the assets, or the remaining term of
the lease, if shorter.
Goodwill and Other
Intangibles: Goodwill and indefinite-lived intangibles are tested at
least annually for impairment in the fourth quarter following the completion of
our annual budget and long-range plan process, or more frequently in certain
circumstances. Intangible assets with finite lives are amortized using the
straight-line method over their estimated useful lives, and reviewed for
recovery if an event occurs that indicates that there may be an impairment. The
goodwill impairment test first requires a comparison of the fair value of each
reporting unit to its carrying amount, including goodwill. If the carrying
amount exceeds fair value, a second step must be performed.
48
The
second step requires the comparison of the carrying amount of the goodwill to
its implied fair value, which is calculated as if the reporting unit had just
been acquired as of the testing date. Any excess of the carrying amount of
goodwill over the implied fair value would represent an impairment
loss.
Certain
trademarks have been determined to have indefinite lives and therefore are not
subject to amortization. Impairment testing for indefinite-lived intangibles
requires a comparison between the fair value and carrying value of the asset,
and any excess carrying value would represent an impairment. Fair values are
primarily determined using discounted cash flow analyses.
Impairment of Long-Lived
Assets: Long-lived assets, including property, plant and equipment, and
intangible assets subject to amortization, are reviewed for impairment whenever
circumstances indicate that the carrying value of these assets may not be
recoverable. An asset is considered impaired if the carrying value of the asset
exceeds the sum of the future expected undiscounted cash flows to be derived
from the asset. Once an asset is considered impaired, an impairment loss is
recorded within restructuring and other items for the difference between the
asset's carrying value and its fair value. For assets to be held and used in the
business, management determines fair value using estimated future cash flows to
be derived from the asset discounted to a net present value using an appropriate
discount rate. For assets held for sale or for investment purposes, management
determines fair value by estimating the proceeds to be received upon sale of the
asset, less costs to sell.
Employee Benefits: The
measurement of the obligations under our defined benefit pension and
postretirement medical plans are subject to a number of assumptions. These
include the rate of return on plan assets and the rate at which the future
obligations are discounted to present value. U.S. GAAP requires the recognition
of an asset or liability for the funded status of a defined benefit
postretirement plan as measured by the difference between the fair value of plan
assets and the benefit obligation. For a pension plan, the benefit obligation is
the projected benefit obligation; for any other postretirement plan, such as a
retiree health plan, the benefit obligation is the accumulated postretirement
benefit obligation. See Note 16, Benefit Plans, for a more
detailed discussion of our pension and other retirement plans.
Financial Instruments: All
derivatives are recognized as either assets or liabilities in the balance sheet
and recorded at their fair value. For a derivative designated as hedging the
exposure to variable cash flows of a forecasted transaction (referred to as a
cash flow hedge), the effective portion of the derivative's gain or loss is
initially reported as a component of other comprehensive income, net of tax, and
subsequently reclassified into earnings when the forecasted transaction affects
earnings. For a derivative designated as hedging the exposure to changes in the
fair value of a recognized asset or liability or a firm commitment (referred to
as a fair value hedge), the
derivative’s gain or loss is recognized in earnings in the period of change
together with the offsetting loss or gain on the hedged item. For a
derivative designated as hedging the foreign currency exposure of a net
investment in a foreign operation, the gain or loss is reported in other
comprehensive income, net of tax, as part of the cumulative translation
adjustment. The ineffective portion of any derivative used in a hedging
transaction is recognized immediately into earnings. Derivative financial
instruments that are not designated as hedges are also recorded at fair value,
with the change in fair value recognized immediately into earnings. We do not
purchase or hold any derivative financial instrument for investment or trading
purposes.
Foreign Currency Translation:
Foreign currency transaction gains and losses are recognized in the
determination of net income. Foreign currency translation adjustments of
subsidiaries and affiliates operating outside the U.S. are accumulated in other
comprehensive income, a separate component of shareholders' equity.
Revenue Recognition: The
majority of our revenue is generated from our standard product manufacturing
operations which convert rubber, metal, and plastic raw materials into component
parts used in closure systems and syringe components for use with injectable
drugs and drug delivery devices. Sales of manufactured components are recorded
at the time title and risk of loss pass to the customer. Some customers receive
pricing rebates upon attaining established sales volumes. We record rebate costs
when sales occur based on our assessment of the likelihood that these volumes
will be attained. We also establish product return liabilities for customer
quality claims when such amounts are deemed probable and can be reasonably
estimated.
49
Shipping and Handling Costs:
Shipping and handling costs are included in cost of goods and services sold.
Shipping and handling costs billed to customers in connection with the sale are
included in net sales.
Research and Development:
Research and development expenditures are for the creation, engineering and
application of new or improved products and processes. Expenditures include
primarily salaries and outside services for those directly involved in research
and development activities and are expensed as incurred.
Environmental Remediation and
Compliance Costs: Environmental remediation costs are accrued when such
costs are probable and reasonable estimates are determinable. Cost estimates
include investigation, cleanup and monitoring activities; such estimates are
adjusted, if necessary, based on additional findings. Environmental compliance
costs are expensed as incurred as part of normal operations.
Litigation: From time to time,
we are involved in product liability matters and other legal proceedings and
claims generally incidental to our normal business activities. In accordance
with U.S. GAAP, we accrue for loss contingencies when it is probable that a
liability has been incurred and the amount of the loss can be reasonably
estimated. These estimates are based on an analysis made by internal and
external legal counsel considering information known at the time. Legal costs in
connection with loss contingencies are expensed as incurred.
Income Taxes: Deferred income
taxes are recognized by applying enacted statutory tax rates, applicable to
future years, to temporary differences between the tax basis and financial
statement carrying values of our assets and liabilities. Valuation allowances
are established when it is more likely than not that all or a portion of a
deferred tax asset will not be realized. No provision is made for the U.S.
income taxes on the undistributed earnings of wholly-owned foreign subsidiaries
as such earnings are intended to be permanently reinvested. We recognize
interest costs related to income taxes in interest expense and penalties within
restructuring and other items. The tax law ordering approach is used for
purposes of determining whether an excess tax benefit has been realized during
the year.
Stock-Based Compensation:
Under the fair value provisions of U.S. GAAP, stock-based compensation cost is
measured at the grant date based on the value of the award and is recognized as
expense over the vesting period. In order to determine the fair value of stock
options on the grant date, the company uses the Black-Scholes valuation
model.
Net Income Per Share: Basic
net income per share is computed by dividing net income attributable to common
shareholders by the weighted average number of shares of common stock
outstanding during each period. Net income per share assuming dilution considers
the dilutive effect of outstanding stock options and other stock awards based on
the treasury stock method, as well as convertible debt based on the if-converted
method. The treasury stock method assumes the use of exercise proceeds to
repurchase common stock at the average fair market value in the period. The
if-converted method assumes conversion of the debt at the beginning of the
reporting period (or at time of issuance, if later). In addition, interest
charges applicable to the convertible debt, net of tax, are added back to net
income for the purpose of this calculation.
Note
2: Acquisition
On July
6, 2009, we acquired certain business assets of Plastef Investissements SA
(“Plastef”), a France-based developer and manufacturer of drug delivery devices.
Plastef’s products include the Eris safety syringe system, which addresses the
market for fixed-needle prefilled syringes and complements our NovaGuard™ safety
system for luer-lock syringes. The purchase price included cash paid at closing
of $16.9 million and contingent consideration with a fair value of $2.6 million
which is dependent upon the achievement of operating goals and other milestones
over the next five years. The purchase price allocation consisted primarily of
$4.9 million of property, plant and equipment, $7.8 million of goodwill and $8.8
million of other intangible assets, offset by $2.4 million of lease obligations.
The assets and liabilities acquired and operating results for Plastef were
included within the Tech Group segment from the date of acquisition. Pro forma
results were not presented as the acquisition was not considered material to our
consolidated balance sheets or results of operations.
50
Note
3: Discontinued Operations
In 2007,
we recorded a $0.5 million provision, or ($0.01) per diluted share, for claims
resulting from the 2005 divestiture of our former drug delivery
business.
Note
4: Restructuring and Other Items
Restructuring
and other items consisted of:
|
($
in millions)
|
2009
|
2008
|
2007
|
|||||||||
|
Restructuring
and related charges
|
||||||||||||
|
Severance
and post-employment benefits
|
$ | 3.0 | $ | 1.4 | $ | 2.0 | ||||||
|
Asset
write-offs
|
5.3 | 1.0 | 1.1 | |||||||||
|
Other
|
0.4 | 0.6 | 0.3 | |||||||||
|
Total
restructuring and related charges
|
8.7 | 3.0 | 3.4 | |||||||||
|
Impairment
charges
|
0.8 | - | 12.9 | |||||||||
|
Other
items:
|
||||||||||||
|
Contract
settlement and related costs (gain)
|
- | (4.2 | ) | - | ||||||||
|
Brazil
tax penalties and amnesty benefits
|
(2.0 | ) | - | 10.1 | ||||||||
|
Foreign
exchange losses
|
0.5 | 1.6 | 0.7 | |||||||||
|
Loss
on sales of equipment
|
0.9 | 0.7 | 1.1 | |||||||||
|
Other
|
(0.4 | ) | (0.6 | ) | 0.1 | |||||||
|
Total
other items
|
(1.0 | ) | (2.5 | ) | 12.0 | |||||||
|
Total
restructuring and other items
|
$ | 8.5 | $ | 0.5 | $ | 28.3 | ||||||
Restructuring
and Related Charges
In
November 2009, we announced restructuring plans for certain business operations
and support functions affecting both of our reporting segments. The
Pharmaceutical Systems plan involves exiting certain specialized laboratory
services offerings, reducing support personnel primarily associated with
information technology applications and discontinuing other non-core initiatives
and associated assets. The costs are estimated to be approximately $7.0 million,
which consists of $2.0 million in cash expenditures related to employee
severance benefits and $5.0 million in asset impairment charges primarily
related to removing certain laboratory equipment and plant assets from service.
The Tech Group plan is intended to better align our available production
capacity with expected levels of contract manufacturing activity by
consolidating manufacturing operations and support functions. Total costs of the
Tech Group plan are estimated to be approximately $2.0 million, which consists
of $1.5 million in cash expenditures for severance and asset relocation costs
and $0.5 million in accelerated depreciation due to the shortened useful life of
the affected fixed assets.
During
2009, Pharmaceutical Systems incurred actual charges of $7.0 million and Tech
Group incurred charges of $0.6 million, with the balance expected in 2010 as the
respective costs are incurred. Also in 2009, we incurred $1.1 million in
restructuring costs, consisting mainly of employee severance benefits, asset
impairments and accelerated depreciation associated with the completion of our
2007 Tech Group restructuring plan.
During
2008 and 2007, we incurred $3.0 million and $3.4 million, respectively, in
restructuring and related charges as part of the 2007 Tech Group
plan.
51
The
following table details activity related to our restructuring obligations
recorded within other current liabilities:
|
($
in millions)
|
Severance
and benefits
|
Other
Costs
|
Total
|
|||||||||
|
Balance,
December 31, 2007
|
$ | 1.9 | $ | 0.3 | $ | 2.2 | ||||||
|
Charges
|
1.4 | 1.6 | 3.0 | |||||||||
|
Non-cash
adjustments
|
- | (0.6 | ) | (0.6 | ) | |||||||
|
Cash
payments
|
(3.1 | ) | (0.9 | ) | (4.0 | ) | ||||||
|
Balance,
December 31, 2008
|
0.2 | 0.4 | 0.6 | |||||||||
|
Charges
|
3.0 | 0.4 | 3.4 | |||||||||
|
Cash
payments
|
(1.3 | ) | (0.7 | ) | (2.0 | ) | ||||||
|
Balance,
December 31, 2009
|
$ | 1.9 | $ | 0.1 | $ | 2.0 | ||||||
We expect
all payments associated with the plans to be completed by the end of
2010.
Impairment
Charges
During
the fourth quarter of 2009, we determined that a cost-basis investment that
arose from the 2005 divestiture of our former drug delivery business was
impaired and we recorded a $0.8 million charge to write-off our investment. We
do not expect any further charges associated with this investment.
In the
fourth quarter of 2007, we recorded a $12.9 million impairment charge
representing our net book value in the Nektar contract intangible asset
associated with the Exubera device.
Other
Items
In
September 2009, we enrolled in a tax amnesty program in Brazil which provided
for reduced penalties and interest on certain tax-related obligations. We
recognized a pre-tax benefit of $2.0 million in 2009 relating to our
participation in this program. During 2007, we increased our accruals in Brazil
for a series of excise, gross receipts and value-added tax contingencies by
$10.1 million. The increased provisions followed a detailed review of several
related tax cases pending in the Brazilian courts, which indicated that it was
probable that the positions taken on previous tax filings, some of which date
back to the late 1990’s, would not be sustained.
Under an
agreement reached with Nektar in February 2008, we received full reimbursement
for, among other things, severance-related employee costs, equipment, purchased
raw materials and components, leases and other facility costs associated with
the shutdown of manufacturing operations related to the Exubera device. During
2008, we received payments from Nektar which more than offset the related costs
incurred, resulting in a net gain of $4.2 million.
Note
5: Income Taxes
On
January 1, 2007, we adopted new guidance that clarifies the accounting for
uncertainty in income taxes recognized in financial statements and prescribes a
more-likely-than-not threshold for financial statement recognition and
measurement of a tax position taken or expected to be taken in a tax return. The
adoption of this guidance resulted in the recognition of net tax assets that met
the more-likely-than-not threshold of $21.6 million and was reflected as an
adjustment to the opening balance of retained earnings for 2007.
Because
we are a global organization, we and our subsidiaries file income tax returns in
the U.S. Federal jurisdiction and various state and foreign jurisdictions.
During 2009, the statute of limitations for the 2005 U.S. Federal tax year
lapsed, leaving tax years 2006 through 2009 open to examination in the U.S.
Federal tax jurisdiction. We are also subject to examination in various state
and foreign jurisdictions for tax years 2002 through 2009.
52
A
reconciliation of the beginning and ending amount of unrecognized tax benefits
is as follows:
|
($
in millions)
|
2009
|
2008
|
||||||
|
Balance
at January 1
|
$ | 7.9 | $ | 10.2 | ||||
|
Additions
for tax positions taken in the current year
|
0.5 | 0.3 | ||||||
|
Additions
for tax positions of prior years
|
1.4 | 0.8 | ||||||
|
Reduction
for expiration of statute of limitations/audits
|
(4.2 | ) | (3.4 | ) | ||||
|
Balance
at December 31
|
$ | 5.6 | $ | 7.9 | ||||
In
addition, we had accrued interest and penalties of $0.5 million and $1.0 million
at December 31, 2009 and 2008, respectively. During 2009 and 2008, we recognized
$(0.4) million and $0.3 million, respectively, in tax-related interest (income)
expense and penalties. As of December 31, 2009, we had approximately $5.6
million of total gross unrecognized tax benefits, which, if recognized, would
favorably impact the effective income tax rate. It is reasonably possible that
due to the expiration of statutes and the closing of audits during the next 12
months, the total amount of unrecognized tax benefits may be reduced further by
approximately $2.1 million.
The
components of income before income taxes are:
|
($
in millions)
|
2009
|
2008
|
2007
|
|||||||||
|
U.S.
operations
|
$ | 6.5 | $ | 27.4 | $ | 25.6 | ||||||
|
International
operations
|
76.7 | 82.1 | 60.8 | |||||||||
|
Total
income before income taxes
|
$ | 83.2 | $ | 109.5 | $ | 86.4 | ||||||
The
related provision for income taxes from continuing operations consists
of:
|
($
in millions)
|
2009
|
2008
|
2007
|
|||||||||
|
Current:
|
||||||||||||
|
Federal
|
$ | (1.9 | ) | $ | (2.8 | ) | $ | 0.5 | ||||
|
State
|
- | - | - | |||||||||
|
International
|
20.2 | 19.2 | 23.1 | |||||||||
|
Current
income tax provision
|
18.3 | 16.4 | 23.6 | |||||||||
|
Deferred:
|
||||||||||||
|
Federal
and state
|
(5.1 | ) | 7.5 | 0.3 | ||||||||
|
International
|
0.3 | (0.2 | ) | (6.7 | ) | |||||||
|
Deferred
income tax provision
|
(4.8 | ) | 7.3 | (6.4 | ) | |||||||
|
Provision
for income taxes, continuing operations
|
$ | 13.5 | $ | 23.7 | $ | 17.2 | ||||||
Deferred
income taxes result from temporary differences between the amount of assets and
liabilities recognized for financial reporting and tax purposes. The significant
components of our deferred tax assets and liabilities at December 31
are:
|
($
in millions)
|
2009
|
2008
|
||||||
|
Deferred
tax assets
|
||||||||
|
Net
operating loss carryforwards
|
$ | 33.6 | $ | 36.9 | ||||
|
Tax
credit carryforwards
|
28.7 | 21.1 | ||||||
|
Restructuring
and impairment charges
|
0.8 | 0.2 | ||||||
|
Capital
loss carryforwards
|
1.4 | 1.1 | ||||||
|
Pension
and deferred compensation
|
41.9 | 47.4 | ||||||
|
Other
|
11.2 | 10.1 | ||||||
|
Valuation
allowance
|
(24.3 | ) | (23.4 | ) | ||||
|
Total
deferred tax assets
|
93.3 | 93.4 | ||||||
|
Deferred
tax liabilities:
|
||||||||
|
Accelerated
depreciation
|
37.9 | 40.1 | ||||||
|
Other
|
1.2 | 5.8 | ||||||
|
Total
deferred tax liabilities
|
39.1 | 45.9 | ||||||
|
Net
deferred tax asset
|
$ | 54.2 | $ | 47.5 | ||||
53
A
reconciliation of the U.S. statutory corporate tax rate to our effective
consolidated tax rate on income before income taxes from continuing operations
follows:
|
2009
|
2008
|
2007
|
||||||||||
|
U.S.
statutory corporate tax rate
|
35.0 | % | 35.0 | % | 35.0 | % | ||||||
|
Tax
on international operations less than U.S. tax rate
|
(7.6 | ) | (7.6 | ) | (4.2 | ) | ||||||
|
Non-benefited
losses
|
2.0 | 0.5 | 2.5 | |||||||||
|
Reversal
of prior valuation allowance
|
(1.2 | ) | (1.2 | ) | (4.2 | ) | ||||||
|
Reversal
of reserves for unrecognized tax benefits
|
(3.4 | ) | (3.1 | ) | (1.5 | ) | ||||||
|
U.S.
tax on international earnings, net of foreign tax credits
|
(3.2 | ) | (0.9 | ) | (4.1 | ) | ||||||
|
State
income taxes, net of federal tax benefit
|
(1.1 | ) | 0.2 | (3.2 | ) | |||||||
|
General
Business Credits
|
(5.4 | ) | (1.1 | ) | (2.1 | ) | ||||||
|
Other
|
1.1 | (0.2 | ) | 1.7 | ||||||||
|
Effective
tax rate, continuing operations
|
16.2 | % | 21.6 | % | 19.9 | % | ||||||
At
December 31, 2009, we had U.S. federal net operating loss carryforwards of $25.1
million and state operating loss carryforwards of $241.5 million, which created
deferred tax assets of $8.8 million and $14.3 million, respectively; and foreign
operating loss carryforwards of $40.3 million, which created a deferred tax
asset of $10.5 million. Management estimates that certain state and
foreign operating loss carryforwards are unlikely to be utilized and the
associated deferred tax assets have been fully reserved. Federal net operating
loss carryforwards expire after 2024. State loss carryforwards expire as
follows: $3.4 million in 2010 and $238.1 million thereafter. Foreign loss
carryforwards will begin to expire in 2013, while $33.0 million of the total
$40.3 million will not expire.
As of
December 31, 2009, we had available foreign tax credit carryforwards of $17.1
million expiring as follows: $0.2 million in 2011, $2.6 million in 2012, $0.4
million in 2014, $3.5 million in 2015, $1.8 million in 2016, $2.8 million in
2017, $2.4 million in 2018 and $3.4 million in 2019. We have U.S. federal, state
and foreign research and development credit carryforwards of $8.2 million, $2.5
million and $0.7 million, respectively. The $8.2 million of U.S.
federal research and development credits expire as follows: $0.4 million expire
in 2021, $0.5 million expire in 2022 and $7.3 million expire after 2022. The
$2.5 million of state research and development credits expire as follows: $0.7
million expire in 2021, $0.6 million expire in 2022 and $1.2 million expire
after 2022. The foreign research and development credits have an indefinite
carryforward.
As of
December 31, 2009, we had U.S. capital loss carryforwards of $3.7 million, which
created a deferred tax asset of $1.4 million, which is fully reserved. During
2007, as the result of an Internal Revenue Service closing agreement, we
realized an additional $8.1 million benefit in the basis of an investment
related to the disposition of our former drug delivery business, creating a
deferred tax asset of $3.2 million which is fully reserved. The U.S. capital
loss carryforwards will begin to expire in 2012.
Undistributed
earnings of foreign subsidiaries amounted to $482.7 million at December 31,
2009, on which deferred income taxes have not been provided because such
earnings are intended to be reinvested indefinitely outside of the
U.S.
Note
6: Segment Information
Our
operations are comprised of two reportable segments: “Pharmaceutical Systems”
and “Tech Group”. Pharmaceutical Systems focuses on the design,
manufacture and distribution of elastomer and metal components used in
parenteral drug delivery for customers in the pharmaceutical and
biopharmaceutical industries. The Tech Group offers custom
contract-manufacturing solutions utilizing plastic injection molding processes
targeted to the healthcare and consumer product industries. Pharmaceutical
Systems has two operating segments: the Americas and Europe/Asia Pacific. Tech
Group is also split into two operating segments: the Americas and Europe. These
operating segments are aggregated for reporting purposes as they have common
economic characteristics, produce and sell a similar range of products, use a
similar distribution process and have a similar customer base.
54
Our
executive management evaluates the performance of these operating segments based
on operating profit and cash flow generation. General corporate
expenses, restructuring charges and other items considered outside the control
of segment management are not allocated to the segments. Corporate assets
include pension assets, investments in affiliated companies and net assets of
discontinued operations. The accounting policies of the segments are
the same as those described in the summary of significant accounting
policies.
The
following table provides information on sales by significant product
group:
|
($
in millions)
|
2009
|
2008
|
2007
|
|||||||||
|
Pharmaceutical
packaging
|
$ | 637.3 | $ | 622.8 | $ | 577.8 | ||||||
|
Disposable
medical components
|
105.1 | 107.2 | 120.4 | |||||||||
|
Safety
and administration systems
|
32.9 | 33.1 | 25.5 | |||||||||
|
Laboratory
and other services
|
33.4 | 29.0 | 18.1 | |||||||||
|
Pharmaceutical
Systems
|
808.7 | 792.1 | 741.8 | |||||||||
|
Healthcare
devices
|
182.1 | 171.7 | 188.8 | |||||||||
|
Consumer
products
|
56.2 | 74.1 | 73.3 | |||||||||
|
Tooling
and other services
|
20.0 | 24.7 | 27.1 | |||||||||
|
Tech
Group
|
258.3 | 270.5 | 289.2 | |||||||||
|
Intersegment
sales
|
(11.3 | ) | (11.5 | ) | (10.9 | ) | ||||||
|
Net
sales
|
$ | 1,055.7 | $ | 1,051.1 | $ | 1,020.1 | ||||||
We do not
have any customers accounting for greater than 10% of consolidated net
sales.
The
following table presents sales and net property, plant and equipment, by the
country in which the legal subsidiary is domiciled and assets are
located.
|
Sales
|
Property,
Plant and Equipment, Net
|
|||||||||||||||||||||||
|
($
in millions)
|
2009
|
2008
|
2007
|
2009
|
2008
|
2007
|
||||||||||||||||||
|
United
States
|
$ | 502.8 | $ | 488.5 | $ | 496.4 | $ | 242.5 | $ | 238.9 | $ | 209.9 | ||||||||||||
|
Germany
|
148.3 | 145.4 | 114.7 | 129.9 | 119.9 | 111.0 | ||||||||||||||||||
|
France
|
105.3 | 100.7 | 99.8 | 45.9 | 43.4 | 43.1 | ||||||||||||||||||
|
Other
European countries
|
209.3 | 211.5 | 193.6 | 83.2 | 72.6 | 70.8 | ||||||||||||||||||
|
Other
|
90.0 | 105.0 | 115.6 | 75.6 | 56.2 | 46.9 | ||||||||||||||||||
| $ | 1,055.7 | $ | 1,051.1 | $ | 1,020.1 | $ | 577.1 | $ | 531.0 | $ | 481.7 | |||||||||||||
The
following tables provide summarized financial information for our
segments:
|
($
in millions)
|
Pharmaceutical
Systems
|
Tech
Group
|
Corporate
and Eliminations
|
Consolidated
|
||||||||||||
|
2009
|
||||||||||||||||
|
Net
sales
|
$ | 808.7 | $ | 258.3 | $ | (11.3 | ) | $ | 1,055.7 | |||||||
|
Income
before income taxes
|
134.2 | 14.0 | (65.1 | ) | 83.1 | |||||||||||
|
Segment
assets
|
909.0 | 253.0 | 109.0 | 1,271.0 | ||||||||||||
|
Capital
expenditures
|
93.3 | 11.4 | 0.2 | 104.9 | ||||||||||||
|
Depreciation
and amortization expense
|
50.6 | 15.3 | 2.2 | 68.1 | ||||||||||||
|
2008
|
||||||||||||||||
|
Net
sales
|
$ | 792.1 | $ | 270.5 | $ | (11.5 | ) | $ | 1,051.1 | |||||||
|
Income
before income taxes
|
136.7 | 17.8 | (45.0 | ) | 109.5 | |||||||||||
|
Segment
assets
|
816.3 | 227.5 | 124.9 | 1,168.7 | ||||||||||||
|
Capital
expenditures
|
122.3 | 9.2 | 7.1 | 138.6 | ||||||||||||
|
Depreciation
and amortization expense
|
43.9 | 14.9 | 1.8 | 60.6 | ||||||||||||
55
|
($
in millions)
|
Pharmaceutical
Systems
|
Tech
Group
|
Corporate
and Eliminations
|
Consolidated
|
||||||||||||
|
2007
|
||||||||||||||||
|
Net
sales
|
$ | 741.8 | $ | 289.2 | $ | (10.9 | ) | $ | 1,020.1 | |||||||
|
Income
before income taxes
|
141.9 | 11.6 | (67.1 | ) | 86.4 | |||||||||||
|
Segment
assets
|
737.7 | 247.4 | 200.5 | 1,185.6 | ||||||||||||
|
Capital
expenditures
|
108.1 | 20.9 | 0.4 | 129.4 | ||||||||||||
|
Depreciation
and amortization expense
|
39.0 | 15.9 | 1.7 | 56.6 | ||||||||||||
Note
7: Net Income Per Share
The
following tables reconcile net income and shares, attributable to common
shareholders, used in the calculation of basic net income per share to those
used for diluted net income per share:
|
($
and shares in millions)
|
2009
|
2008
|
2007
|
|||||||||
|
Net
income, as reported, for basic net income per share
|
$ | 72.6 | $ | 86.0 | $ | 70.7 | ||||||
|
Plus:
interest expense on convertible debt, net of tax
|
4.3 | 4.3 | 3.4 | |||||||||
|
Net
income for diluted net income per share
|
$ | 76.9 | $ | 90.3 | $ | 74.1 | ||||||
|
Weighted
average common shares outstanding
|
32.8 | 32.4 | 32.7 | |||||||||
|
Assumed
stock options exercised and awards vested, based on the treasury stock
method
|
0.6 | 0.8 | 1.2 | |||||||||
|
Assumed
conversion of convertible debt, based on the if-converted
method
|
2.9 | 2.9 | 2.3 | |||||||||
|
Weighted
average shares assuming dilution
|
36.3 | 36.1 | 36.2 | |||||||||
Options
outstanding but not included in the computation of diluted net income per share
because their impact was antidilutive were 1.1 million, 0.6 million and 0.3
million for fiscal years 2009, 2008 and 2007, respectively.
Note
8: Comprehensive Income
Comprehensive
income consists of reported net income and other comprehensive income, which
reflects revenues, expenses and gains and losses that generally accepted
accounting principles exclude from net income. For us, the items excluded from
current net income were cumulative foreign currency translation adjustments,
unrealized gains or losses on available-for-sale securities of affiliates, fair
value adjustments on derivative financial instruments and pension and other
postretirement liability adjustments.
The
components of accumulated other comprehensive income, net of tax, at December 31
are as follows:
|
($
in millions)
|
2009
|
2008
|
||||||
|
Foreign
currency translation
|
$ | 35.0 | $ | 16.0 | ||||
|
Unrealized
losses on securities of affiliates
|
(0.5 | ) | (0.9 | ) | ||||
|
Unrealized
losses on derivatives
|
(3.4 | ) | (5.4 | ) | ||||
|
Defined
benefit pension and other postretirement plans
|
(50.8 | ) | (54.6 | ) | ||||
| $ | (19.7 | ) | $ | (44.9 | ) | |||
Note
9: Stock Repurchase Program
On August
8, 2007, our Board of Directors authorized a share repurchase program of up to
one million shares of our common stock. The program allowed us to repurchase our
shares on the open market or in privately negotiated transactions in accordance
with the requirements of the Securities and Exchange Commission. During the year
ended December 31, 2007, we purchased 980,300 shares of common stock under this
program at a cost of $39.4 million, or an average price of $40.23 per share. On
February 27, 2008, we announced that we did not intend to make further share
repurchases under this program.
56
Note
10: Goodwill and Intangibles
The
changes in the carrying amount of goodwill by reportable segment are as
follows:
|
($
in millions)
|
Pharmaceutical
Systems
|
Tech
Group
|
Total
|
|||||||||
|
Balance,
December 31, 2007
|
$ | 75.1 | $ | 34.1 | $ | 109.2 | ||||||
|
Additions
|
3.1 | - | 3.1 | |||||||||
|
Foreign
currency translation
|
(6.9 | ) | (0.1 | ) | (7.0 | ) | ||||||
|
Balance,
December 31, 2008
|
71.3 | 34.0 | 105.3 | |||||||||
|
Additions
|
- | 7.8 | 7.8 | |||||||||
|
Foreign
currency translation
|
0.8 | 0.3 | 1.1 | |||||||||
|
Balance,
December 31, 2009
|
$ | 72.1 | $ | 42.1 | $ | 114.2 | ||||||
On July
6, 2009, we acquired certain business assets of Plastef, a France-based
developer and manufacturer of drug delivery devices, which resulted in goodwill
of $7.8 million. On December 29, 2008, we purchased the remaining 10%
noncontrolling interest in our Medimop subsidiary for $8.5 million, which
resulted in additional goodwill of $3.1 million.
Intangible
assets and accumulated amortization as of December 31 were as
follows:
|
2009
|
2008
|
|||||||||||||||||||||||
|
($
in millions)
|
Cost
|
Accumulated
Amortization
|
Net
|
Cost
|
Accumulated
Amortization
|
Net
|
||||||||||||||||||
|
Technology
and patents
|
$ | 15.3 | $ | (4.4 | ) | $ | 10.9 | $ | 10.7 | $ | (3.5 | ) | $ | 7.2 | ||||||||||
|
Trademarks
|
12.2 | (0.5 | ) | 11.7 | 11.2 | (0.3 | ) | 10.9 | ||||||||||||||||
|
Customer
relationships
|
29.3 | (7.7 | ) | 21.6 | 29.3 | (6.0 | ) | 23.3 | ||||||||||||||||
|
Customer
contracts
|
12.0 | (2.0 | ) | 10.0 | 8.2 | (1.5 | ) | 6.7 | ||||||||||||||||
|
Non-compete
agreements
|
3.9 | (2.5 | ) | 1.4 | 3.9 | (2.0 | ) | 1.9 | ||||||||||||||||
| $ | 72.7 | $ | (17.1 | ) | $ | 55.6 | $ | 63.3 | $ | (13.3 | ) | $ | 50.0 | |||||||||||
As part
of the July 6, 2009 acquisition of Plastef, Tech Group acquired $8.8 million of
intangible assets consisting of $3.5 million in patents and patent applications,
$0.9 million in tradenames, $3.7 million in customer contracts and $0.7 million
in licenses. The estimated useful lives for these assets are as follows: 14.5
years for patents, 18.5 years for patent applications, 14.5 years for
tradenames, 20 years for customer contracts and 10.5 years for licenses. For
additional details regarding this acquisition, see Note 2, Acquisition.
During
2008, Pharmaceutical Systems acquired licenses for a total of $0.5 million, to
be amortized over 5 years.
The cost
basis of intangible assets includes the effects of foreign currency translation
adjustments, which were $(0.3) million and $2.0 million for the twelve months
ended December 31, 2009 and 2008, respectively. Amortization expense for the
years ended December 31, 2009, 2008 and 2007 was $3.8 million, $3.5 million and
$4.4 million, respectively. Estimated future annual amortization expense is as
follows: 2010 to 2011 - $4.1 million, 2012 - $3.7 million, 2013 - $3.5 million
and 2014 - $3.4 million. Trademarks with a carrying amount of $10.0 million were
determined to have indefinite lives and therefore do not require
amortization.
57
Note
11: Property, Plant and Equipment
A summary
of gross property, plant and equipment at December 31 is presented in the
following table:
|
($
in millions)
|
Expected
useful lives (years)
|
2009
|
2008
|
|||||||||
|
Land
|
$ | 9.6 | $ | 9.5 | ||||||||
|
Buildings
and improvements
|
5-50 | 267.1 | 220.7 | |||||||||
|
Machinery
and equipment
|
10-15 | 543.9 | 499.6 | |||||||||
|
Molds
and dies
|
4-7 | 81.9 | 73.1 | |||||||||
|
Computer
hardware and software
|
3-10 | 59.9 | 20.1 | |||||||||
|
Construction
in progress
|
99.7 | 142.0 | ||||||||||
| $ | 1,062.1 | $ | 965.0 | |||||||||
Depreciation
expense for the years ended December 31, 2009, 2008 and 2007 was $63.9 million,
$56.1 million and $51.6 million, respectively.
During
the second quarter of 2008, we successfully replaced our financial reporting,
cash disbursement and order-to-cash systems in our North American operations
with a new enterprise resource planning (“ERP”) system. Phase two of the ERP
project, which focused on procurement and plant operations, commenced in late
2008 and was completed in the fourth quarter of 2009.
Capitalized
leases included in ‘buildings and improvements’ were $5.1 million and $2.5
million at December 31, 2009 and 2008, respectively. Capitalized leases included
in ‘machinery and equipment’ were $4.4 million and $2.2 million at December 31,
2009 and 2008, respectively. Accumulated depreciation on all
property, plant and equipment accounted for as capitalized leases was $2.6
million and $1.9 million at December 31, 2009 and 2008, respectively. At
December 31, 2009, future minimum payments under capital leases were $1.3
million in 2010, $0.8 million in 2011, $0.4 million in 2012, $0.3 million in
2013, $0.2 million in 2014 and $0.2 million thereafter.
We
capitalize interest on borrowings during the active construction period of major
capital projects. Capitalized interest
is added to the cost of the underlying assets and is amortized over the useful
lives of the assets. Capitalized interest for the years ended December 31, 2009,
2008 and 2007 was $2.4 million, $2.6 million and $1.9 million, respectively.
Note
12: Affiliated Companies
At
December 31, 2009, the following affiliated companies were accounted for under
the equity method:
|
Location
|
Ownership
interest
|
||||
|
West
Pharmaceutical Services Mexico, S.A. de C.V.
|
Mexico
|
49 | % | ||
|
Aluplast
S.A. de C.V.
|
Mexico
|
49 | % | ||
|
Pharma
Tap S.A. de C.V.
|
Mexico
|
49 | % | ||
|
Daikyo
Seiko, Ltd. (“Daikyo”)
|
Japan
|
25 | % | ||
Unremitted
income of affiliated companies included in consolidated retained earnings
amounted to $27.4 million, $24.7 million and $24.0 million at December 31, 2009,
2008 and 2007, respectively. Dividends received from affiliated companies were
$0.3 million in 2009 and $0.1 million for both 2008 and 2007.
Our
equity in unrealized (losses) gains of Daikyo's investment in securities
available-for-sale and derivative instruments, included in accumulated other
comprehensive income, a separate component of shareholders' equity, was $(0.5)
million, $(0.9) million and $1.7 million at December 31, 2009, 2008 and 2007,
respectively.
58
Our
purchases and royalty payments made to affiliates totaled $45.4 million, $36.3
million and $31.3 million, respectively, in 2009, 2008 and 2007, of which $3.4
million and $3.7 million was due and payable as of December 31, 2009 and 2008,
respectively. These transactions primarily relate to a distributorship agreement
allowing us to purchase and re-sell Daikyo products. Sales to affiliates were
$1.9 million, $1.7 million and $0.9 million, respectively, in 2009, 2008 and
2007, of which $0.1 million and $0.2 million was receivable as of December 31,
2009 and 2008, respectively.
At
December 31, the aggregate carrying amount of investments in affiliated
companies was as follows:
|
($
in millions)
|
2009
|
2008
|
||||||
|
Equity
companies
|
$ | 38.2 | $ | 32.8 | ||||
|
Cost
companies
|
- | 0.8 | ||||||
| $ | 38.2 | $ | 33.6 | |||||
During
the fourth quarter of 2009, we determined that our cost-basis investment that
arose from the 2005 divestiture of a former drug delivery business was impaired
and we recorded a $0.8 million charge to write-off our investment.
Note
13: Debt
At
December 31, 2009 and 2008, we had short-term obligations under capital leases
of $0.5 million and $0.4 million, respectively, primarily denominated in Euros
and carrying a weighted average interest rate of 5.5%. In December 2008, we
issued a note payable for $3.5 million carrying an interest rate of 2.4%, which
matured and was repaid during 2009.
The
following table summarizes our long-term debt obligations at December 31. The
interest rates shown in parentheses are as of December 31, 2009:
|
($
in millions)
|
2009
|
2008
|
||||||
|
Capital
leases, due through 2016 (4.5 - 7.2%)
|
$ | 2.6 | $ | 0.8 | ||||
|
Revolving
credit facility, due 2011 (1.1%)
|
23.2 | 29.9 | ||||||
|
Series
A floating rate notes, due 2012 (1.1%)
|
50.0 | 50.0 | ||||||
|
Series
B floating rate notes, due 2015 (1.2%)
|
25.0 | 25.0 | ||||||
|
Euro
note A, due 2013 (4.2%)
|
29.2 | 28.7 | ||||||
|
Euro
note B, due 2016 (4.4%)
|
87.6 | 86.2 | ||||||
|
Convertible
debt, due 2047 (4.0%)
|
161.5 | 161.5 | ||||||
| $ | 379.1 | $ | 382.1 | |||||
Real
property and equipment long-term lease obligations, denominated in Euros, of
$2.4 million were acquired on July 6, 2009 as part of the Plastef acquisition.
Refer to Note 2, Acquisition, for more
details.
As of
December 31, 2009, we have $23.2 million of borrowings under our multi-currency
revolving credit agreement due in 2011, of which $18.4 million is denominated in
Japanese Yen and $4.8 million is denominated in British Pounds. The
Yen-denominated note is accounted for as a hedge of our net investment in our
Japanese affiliate. Borrowings under the revolving credit facility are at
variable rates determined by reference to the applicable London Interbank
Offering Rates (“LIBOR”) plus a margin ranging from 0.5 percentage points to
1.375 percentage points determined by our leverage ratio. Under the leverage
ratio, our total indebtedness cannot exceed three-and one-half (3.5) times our
earnings before income tax, depreciation and amortization for any period of four
consecutive quarters. Our credit agreement contains a $200 million committed
credit facility and an “accordion” feature under which the credit facility may
be temporarily increased to $250 million. We pay a quarterly commitment fee
ranging from 0.125% to 0.30% as determined by the leverage ratio on any unused
commitments. The borrowings under the revolving credit agreement together with
outstanding letters of credit of $2.1 million result in an unused commitment
level of $174.5 million under the facility at December 31,
2009.
59
In 2005,
we concluded a private placement of $75.0 million in senior floating rate notes.
The total amount of the private placement was divided into two tranches with
$50.0 million maturing on July 28, 2012 (“Series A Notes”) and $25.0 million
maturing on July 28, 2015 (“Series B Notes”). The two tranches have
interest payable based on LIBOR rates, with the Series A Notes at LIBOR plus 0.8
percentage points and the Series B Notes at LIBOR plus 0.9 percentage points. We
entered into two interest-rate swap agreements to protect against volatility in
the interest rates payable on the Series A and B floating rate notes (discussed
in Note 14, Derivative
Financial
Instruments).
In 2006,
we issued Euro-denominated notes totaling €81.5 million. Euro note A of €20.4
million (or $29.2 million at December 31, 2009) has a term of 7 years due
February 27, 2013 with a fixed annual interest rate of 4.215% while Euro note B
of €61.1 million ($87.6 million at December 31, 2009) has a term of 10 years due
February 27, 2016 at a fixed annual interest rate of 4.38%. These
Euro-denominated notes are accounted for as a hedge of our net investment in our
European subsidiaries.
On March
14, 2007, the Company issued $150.0 million of Convertible Junior Subordinated
Debentures (“debentures”) due March 15, 2047. On April 3, 2007, the underwriters
exercised an over-allotment option resulting in the issuance of an additional
$11.5 million of debentures, bringing the total aggregate principal amount
outstanding to $161.5 million. The debentures bear interest at a rate of 4.0%
annually and are convertible into shares of our common stock at a conversion
rate, subject to adjustment, of 17.9041 shares per $1,000 of principal amount,
which equals a conversion price of approximately $55.85 per share. The holders
may convert their debentures at any time prior to maturity. On or after March
20, 2012, if our common stock closing price exceeds 150% of the then prevailing
conversion price for at least 20 trading days during any 30 consecutive trading
day period, we have the option to cause the debentures to be automatically
converted into West shares at the prevailing conversion rate. As of December 31,
2009, no debentures have been converted.
Total net
proceeds from this offering were $156.3 million. We have and may use the
proceeds for general corporate purposes, which include capital expenditures,
working capital, possible acquisitions of other businesses, technologies or
products, repaying debt, and repurchasing our capital stock. In connection with
the offering, we incurred debt issuance costs in the amount of $5.2 million,
consisting of underwriting discounts and commissions, legal and other
professional fees. These costs were recorded as a noncurrent asset and are being
amortized as additional interest expense over the term of the
debentures.
Covenants
included in our senior debt agreements conform to those in our revolving credit
agreement.
Interest
costs incurred during 2009, 2008 and 2007 were $17.6 million, $18.6 million and
$16.4 million, respectively, including the amounts capitalized as part of the
cost of constructing property, plant and equipment. The aggregate annual
maturities of long-term debt were as follows: 2011 - $23.9 million, 2012 - $50.3
million, 2013 - $29.8 million, 2015 - $25.0 million and thereafter - $250.1
million.
Note
14: Derivative Financial Instruments
All
derivatives are recorded on the balance sheet at fair value. As part of our
ongoing business operations, we are exposed to various risks such as fluctuating
interest rates, foreign exchange rates and increasing commodity prices. To
manage these market risks, we periodically enter into derivative financial
instruments such as interest rate swaps, call options and foreign exchange
contracts for periods consistent with and for notional amounts equal to or less
than the related underlying exposures. We do not purchase or hold any derivative
financial instruments for speculation or trading purposes.
60
Interest
Rate Risk
As a
result of our normal borrowing activities, we have entered into long-term debt
obligations with both fixed and variable interest rates. As of December 31,
2009, we have two interest rate swap agreements outstanding which are designated
as cash flow hedges to protect against volatility in the interest rates payable
on our $50.0 million note maturing July 28, 2012 (“Series A Note”) and our $25.0
million note maturing July 28, 2015 (“Series B Note”). Under both of these
swaps, we will receive variable interest rate payments based on three-month
London Interbank Offering Rates (“LIBOR”) in return for making quarterly fixed
payments. Including the applicable margin, the interest rate swap agreements
effectively fix the interest rates payable on the Series A and B notes at 5.32%
and 5.51%, respectively.
Foreign
Exchange Rate Risk
During
2009, we entered into a series of foreign currency hedge contracts, designated
as cash flow hedges, to eliminate the currency risk associated with forecasted
U.S. dollar (“USD”) denominated inventory purchases made by certain European
subsidiaries. The notional amount for each contract was $0.9 million. The
contracts effectively fixed the Euro to USD exchange rate for a portion of our
anticipated needs at a maximum of 1.28 USD per Euro while allowing us to benefit
from any currency movement between 1.28 and 1.46 USD per Euro. The last contract
matured on December 15, 2009.
We also
entered into a series of foreign currency hedge contracts, designated as cash
flow hedges, to eliminate the currency risk related to forecasted
Yen-denominated inventory purchases made by certain European subsidiaries. The
notional amount for each contract was ¥33.5 million. The contracts effectively
fixed the Euro to Yen (“JPY”) exchange rate for a portion of our anticipated
needs at a maximum of 131.00 JPY per Euro while allowing us to benefit from any
currency movement between 131.00 and 145.75 JPY per Euro. The last contract
matured on December 15, 2009.
We
periodically use forward exchange contracts, designated as fair value hedges, to
neutralize our exposure to fluctuating foreign exchange rates on cross-currency
intercompany loans. As of December 31, 2009, there was one contract outstanding,
with a notional amount of €3.0 million that settled on January 15, 2010. Changes
in the fair value of this derivative were recognized within restructuring and
other items and were offset by changes in the fair value of the underlying
exposure being hedged.
In
addition, we have designated our €81.5 million Euro-denominated notes as a hedge
of our net investment in certain European subsidiaries. A cumulative foreign
currency translation loss of $16.7 million pre-tax ($10.3 million after tax) on
this debt is recorded within accumulated other comprehensive income as of
December 31, 2009. We have also designated our 1.7 billion
Yen-denominated note payable as a hedge of our net investment in a Japanese
affiliate. At December 31, 2009, there was a cumulative foreign currency
translation loss on this Yen-denominated debt of $6.6 million pre-tax ($4.1
million after tax) which is also included within accumulated other comprehensive
income.
Commodity
Price Risk
Many of
our Pharmaceutical Systems products are made from synthetic elastomers, which
are derived from the petroleum refining process. We purchase the majority of our
elastomers via long-term supply contracts, some of which contain clauses that
provide for surcharges related to changes in crude oil prices. In December 2009,
we purchased a series of crude oil call options for a total of 47,000 barrels of
crude oil, which are intended to reduce our exposure to increases in oil-based
surcharges and protect operating cash flows with regard to a portion of our
forecasted elastomer purchases during the months of July through December 2010.
These call options cap our cost of the crude oil component of elastomer prices
for a portion of our forecasted purchases, allowing us to limit our exposure to
increasing petroleum prices. With these option contracts, we may benefit from a
decline in crude oil prices, as there is no downward exposure other than the
premium that we paid to purchase the contracts. These call options were not
designated as hedging instruments.
61
Effects
of Derivative Instruments on Financial Position and Results of
Operations
Refer to
Note 15, Fair Value of
Financial Instruments, for the balance sheet location and fair values of
our derivative instruments as of December 31, 2009 and 2008.
The
following table summarizes the effects of derivative instruments on other
comprehensive income (“OCI”) and earnings for the year ended December 31,
2009:
|
($
in millions)
|
Amount
of Gain (Loss) Recognized in OCI
|
Amount
of Gain (Loss) Reclassified from Accumulated OCI into
Income
|
Location
of Gain (Loss) Reclassified from Accumulated OCI into
Income
|
||||||
|
Cash
Flow Hedges:
|
|||||||||
|
Foreign
currency hedge contracts
|
$ | 0.4 | $ | - |
Cost
of goods and services sold
|
||||
|
Interest
rate swap contracts
|
4.3 | (2.7 | ) |
Interest
expense
|
|||||
|
Total
|
$ | 4.7 | $ | (2.7 | ) | ||||
|
Net
Investment Hedges:
|
|||||||||
|
Foreign
currency-denominated debt
|
$ | (1.4 | ) | $ | - |
Restructuring
and other items
|
|||
|
Total
|
$ | (1.4 | ) | $ | - | ||||
During
the year ended December 31, 2009, we recognized a $0.1 million loss, in
restructuring and other items, related to our fair value hedges. There was no
ineffectiveness related to our cash flow and net investment hedges during this
same time period.
Note
15: Fair Value of Financial Instruments
On
January 1, 2008, we adopted the new guidance for fair value measurements of
financial assets and liabilities, which defines fair value, establishes a
framework for measuring fair value in U.S. GAAP, and expands disclosure
requirements. Fair value is defined as the price that would be received to sell
an asset or paid to transfer a liability (exit price) in an orderly transaction
between market participants at the measurement date.
The
guidance also established a fair value hierarchy that classifies the inputs to
valuation techniques used to measure fair value into one of the following three
levels:
|
·
|
Level 1:
Unadjusted quoted prices in active markets for identical assets or
liabilities.
|
|
·
|
Level 2: Inputs
other than quoted prices that are observable for the asset or liability,
either directly or indirectly. These include quoted prices for similar
assets or liabilities in active markets and quoted prices for identical or
similar assets or liabilities in markets that are not
active.
|
|
·
|
Level 3:
Unobservable inputs that reflect the reporting entity’s own
assumptions.
|
62
The
following table summarizes the assets and liabilities that are measured at fair
value on a recurring basis in the balance sheet:
|
Basis
of Fair Value Measurements
|
||||||||||||||||
|
Balance
at
|
||||||||||||||||
|
December
31,
|
||||||||||||||||
|
($
in millions)
|
2009
|
Level
1
|
Level
2
|
Level
3
|
||||||||||||
|
Assets:
|
||||||||||||||||
|
Short-term
investments
|
$ | 2.7 | $ | 2.7 | $ | - | $ | - | ||||||||
|
Deferred
compensation asset
|
3.5 | 3.5 | - | - | ||||||||||||
|
Commodity
contracts
|
0.3 | - | 0.3 | - | ||||||||||||
| $ | 6.5 | $ | 6.2 | $ | 0.3 | $ | - | |||||||||
|
Liabilities:
|
||||||||||||||||
|
Foreign
currency hedge contract
|
$ | 0.1 | $ | - | $ | 0.1 | $ | - | ||||||||
|
Deferred
compensation liability
|
8.7 | 8.7 | - | - | ||||||||||||
|
Interest
rate swap contracts
|
5.5 | - | 5.5 | - | ||||||||||||
| $ | 14.3 | $ | 8.7 | $ | 5.6 | $ | - | |||||||||
|
Basis
of Fair Value Measurements
|
||||||||||||||||
|
Balance
at
|
||||||||||||||||
|
December
31,
|
||||||||||||||||
|
($
in millions)
|
2008
|
Level
1
|
Level
2
|
Level
3
|
||||||||||||
|
Assets:
|
||||||||||||||||
|
Short-term
investments
|
$ | 4.3 | $ | - | $ | 4.3 | $ | - | ||||||||
|
Deferred
compensation asset
|
2.8 | 2.8 | - | - | ||||||||||||
|
Long-term
investments
|
0.8 | - | 0.8 | - | ||||||||||||
| $ | 7.9 | $ | 2.8 | $ | 5.1 | $ | - | |||||||||
|
Liabilities:
|
||||||||||||||||
|
Foreign
currency hedge contracts
|
$ | 2.0 | $ | - | $ | 2.0 | $ | - | ||||||||
|
Deferred
compensation liability
|
7.5 | 7.5 | - | - | ||||||||||||
|
Interest
rate swap contracts
|
8.2 | - | 8.2 | - | ||||||||||||
| $ | 17.7 | $ | 7.5 | $ | 10.2 | $ | - | |||||||||
Short-term
and long-term investments at December 31, 2008 represent our investment in the
Columbia Strategic Cash Portfolio Fund, which was fully liquidated by December
31, 2009. See the discussion below regarding this fund. Deferred compensation
assets are included within other current assets and are valued based on quoted
market prices in an active market. The fair value of the related deferred
compensation liability is based on quoted prices of the underlying employees’
investment selections and is included within other long-term liabilities. The
fair value of commodity contracts is included within other current assets. The
fair values of our foreign currency contracts are included within other current
liabilities and are valued using quoted forward foreign exchange rates and spot
rates at the reporting date. Interest rate swaps are included within other
long-term liabilities and are valued using a discounted cash flow analysis based
on the terms of the contract and observable market inputs (i.e. LIBOR,
Eurodollar forward rates, and swap spreads). Refer to Note 14, Derivative Financial
Instruments, for further discussion of our derivatives.
Columbia
Strategic Cash Portfolio Fund
The
Columbia Strategic Cash Portfolio Fund was an enhanced cash fund that included
investments in certain asset-backed securities and structured investment
vehicles that are collateralized by sub-prime mortgage securities or related to
mortgage securities, among other assets. In December 2007, the fund began an
orderly liquidation that was completed by December 31, 2009. Our initial
investment was $25.0 million and subsequently we received redemptions of $5.3
million, $16.8 million and $2.3 million during 2009, 2008 and 2007,
respectively. The cumulative loss on this investment was $0.6 million during the
same three-year period.
63
The fair
value of the fund was based on the value of the underlying securities as
determined by fund management using a market approach, which employs various
indications of value including, but not limited to, broker-dealer quotations and
other widely available market data.
Other
Financial Instruments
Cash and
cash equivalents, accounts receivable and short-term debt are held at carrying
amounts that approximate fair value due to their near term maturities. Quoted
market prices are used to estimate the fair value of publicly traded long-term
debt. Debt that is not quoted on an exchange is valued using a discounted cash
flow method based on interest rates that are currently available to us for debt
issuances with similar terms and maturities. At December 31, 2009, the estimated
fair value of long-term debt was $345.4 million compared to a carrying amount of
$379.1 million. At December 31, 2008, the estimated fair value of long-term debt
was $315.1 million and the carrying amount was $382.1 million.
Note
16: Benefit Plans
Certain
of our U.S. and international subsidiaries sponsor defined benefit pension
plans. In addition, we provide minimal life insurance benefits for certain U.S.
retirees and pay a portion of healthcare costs for retired U.S. salaried
employees and their dependents. Benefits for participants are coordinated with
Medicare and the plan mandates Medicare risk (“HMO”) coverage wherever possible
and caps the total contribution for non-HMO coverage. We also sponsor a defined
contribution savings plan for certain salaried and hourly U.S. employees. Our
401(k) plan contributions were $3.4 million, $2.5 million and $2.3 million for
2009, 2008 and 2007, respectively. In addition, we provide certain
post-employment benefits for terminated and disabled employees, including
severance pay, disability-related benefits and healthcare benefits. These costs
are accrued over the employee's active service period or, under certain
circumstances, at the date of the event triggering the benefit.
Pension
and Other Retirement Benefits
The
components of net periodic benefit cost and other amounts recognized in other
comprehensive income were as follows:
|
Pension
benefits
|
Other
retirement benefits
|
|||||||||||||||||||||||
|
($
in millions)
|
2009
|
2008
|
2007
|
2009
|
2008
|
2007
|
||||||||||||||||||
|
Net
periodic benefit cost:
|
||||||||||||||||||||||||
|
Service
cost
|
$ | 7.8 | $ | 7.7 | $ | 7.7 | $ | 0.8 | $ | 0.8 | $ | 1.0 | ||||||||||||
|
Interest
cost
|
14.9 | 14.2 | 13.3 | 0.9 | 0.8 | 0.9 | ||||||||||||||||||
|
Expected
return on assets
|
(11.9 | ) | (16.6 | ) | (16.2 | ) | - | - | - | |||||||||||||||
|
Amortization
of prior service (credit) cost
|
(1.1 | ) | (1.1 | ) | (1.2 | ) | 0.1 | 0.1 | 0.1 | |||||||||||||||
|
Amortization
of transition obligation
|
0.1 | 0.1 | 0.1 | - | - | - | ||||||||||||||||||
|
Recognized
actuarial losses
|
7.0 | 1.6 | 2.6 | - | - | - | ||||||||||||||||||
|
Net
periodic benefit cost
|
$ | 16.8 | $ | 5.9 | $ | 6.3 | $ | 1.8 | $ | 1.7 | $ | 2.0 | ||||||||||||
|
Pension
benefits
|
Other
retirement benefits
|
|||||||||||||||||||||||
|
($
in millions)
|
2009
|
2008
|
2007
|
2009
|
2008
|
2007
|
||||||||||||||||||
|
Other
changes in plan assets and benefit obligations recognized in other
comprehensive income, pre-tax:
|
||||||||||||||||||||||||
|
Net
(gain) loss arising during period
|
$ | (2.9 | ) | $ | 56.8 | $ | (7.8 | ) | $ | 1.8 | $ | (0.3 | ) | $ | (2.0 | ) | ||||||||
|
Prior
service cost arising during period
|
- | - | 1.9 | - | - | - | ||||||||||||||||||
|
Amortization
of prior service credit (cost)
|
1.1 | 1.1 | 1.2 | (0.1 | ) | (0.1 | ) | (0.1 | ) | |||||||||||||||
|
Amortization
of transition obligation
|
(0.1 | ) | (0.1 | ) | (0.1 | ) | - | - | - | |||||||||||||||
|
Amortization
of actuarial loss
|
(7.0 | ) | (1.6 | ) | (2.6 | ) | - | - | - | |||||||||||||||
|
Total
recognized in other comprehensive income
|
$ | (8.9 | ) | $ | 56.2 | $ | (7.4 | ) | $ | 1.7 | $ | (0.4 | ) | $ | (2.1 | ) | ||||||||
|
Total
recognized in net periodic benefit cost and other comprehensive
income
|
$ | 7.9 | $ | 62.1 | $ | (1.1 | ) | $ | 3.5 | $ | 1.3 | $ | (0.1 | ) | ||||||||||
64
Net
periodic benefit cost by geographic location is as follows:
|
Pension
benefits
|
Other
retirement benefits
|
|||||||||||||||||||||||
|
($
in millions)
|
2009
|
2008
|
2007
|
2009
|
2008
|
2007
|
||||||||||||||||||
|
U.S.
plans
|
$ | 14.9 | $ | 4.3 | $ | 4.1 | $ | 1.8 | $ | 1.7 | $ | 2.0 | ||||||||||||
|
International
plans
|
1.9 | 1.6 | 2.2 | - | - | - | ||||||||||||||||||
|
Net
periodic benefit cost
|
$ | 16.8 | $ | 5.9 | $ | 6.3 | $ | 1.8 | $ | 1.7 | $ | 2.0 | ||||||||||||
The
following tables present the changes in the projected benefit obligation and the
fair value of plan assets, as well as the funded status of the
plans:
|
Pension
benefits
|
Other
retirement benefits
|
|||||||||||||||
|
($
in millions)
|
2009
|
2008
|
2009
|
2008
|
||||||||||||
|
Change
in benefit obligation:
|
||||||||||||||||
|
Benefit
obligation, January 1
|
$ | (225.2 | ) | $ | (231.7 | ) | $ | (15.0 | ) | $ | (14.1 | ) | ||||
|
Service
cost
|
(7.8 | ) | (7.7 | ) | (0.8 | ) | (0.8 | ) | ||||||||
|
Interest
cost
|
(14.9 | ) | (14.2 | ) | (0.9 | ) | (0.8 | ) | ||||||||
|
Participants’
contributions
|
- | - | (0.5 | ) | (0.4 | ) | ||||||||||
|
Actuarial
(loss) gain
|
(23.2 | ) | 11.4 | (1.8 | ) | 0.4 | ||||||||||
|
Amendments/transfers
in
|
(0.3 | ) | (0.4 | ) | - | - | ||||||||||
|
Benefits/expenses
paid
|
11.2 | 10.1 | 0.9 | 0.7 | ||||||||||||
|
Foreign
currency translation
|
(2.4 | ) | 7.3 | - | - | |||||||||||
|
Benefit
obligation, December 31
|
$ | (262.6 | ) | $ | (225.2 | ) | $ | (18.1 | ) | $ | (15.0 | ) | ||||
|
Change
in plan assets:
|
||||||||||||||||
|
Fair
value of assets, January 1
|
$ | 152.2 | $ | 216.9 | $ | - | $ | - | ||||||||
|
Actual
return on assets
|
38.9 | (52.2 | ) | - | - | |||||||||||
|
Employer
contribution
|
12.3 | 2.4 | 0.4 | 0.3 | ||||||||||||
|
Participants’
contribution
|
- | - | 0.5 | 0.4 | ||||||||||||
|
Benefits/expenses
paid
|
(11.2 | ) | (10.1 | ) | (0.9 | ) | (0.7 | ) | ||||||||
|
Foreign
currency translation
|
1.3 | (4.8 | ) | - | - | |||||||||||
|
Fair
value of plan assets, December 31
|
$ | 193.5 | $ | 152.2 | $ | - | $ | - | ||||||||
|
Funded
status at end of year
|
$ | (69.1 | ) | $ | (73.0 | ) | $ | (18.1 | ) | $ | (15.0 | ) | ||||
International
pension plan assets, at fair value, included in the preceding table were $17.2
million and $13.4 million at December 31, 2009 and 2008,
respectively.
Amounts
recognized in the balance sheet are as follows:
|
Pension
benefits
|
Other
retirement benefits
|
|||||||||||||||
|
($
in millions)
|
2009
|
2008
|
2009
|
2008
|
||||||||||||
|
Current
liabilities
|
$ | (1.0 | ) | $ | (0.9 | ) | $ | (1.1 | ) | $ | (1.1 | ) | ||||
|
Noncurrent
liabilities
|
(68.1 | ) | (72.1 | ) | (17.0 | ) | (13.9 | ) | ||||||||
| $ | (69.1 | ) | $ | (73.0 | ) | $ | (18.1 | ) | $ | (15.0 | ) | |||||
The
amounts in accumulated other comprehensive loss, pre-tax, consist
of:
|
Pension
benefits
|
Other
retirement benefits
|
|||||||||||||||
|
($
in millions)
|
2009
|
2008
|
2009
|
2008
|
||||||||||||
|
Net
actuarial loss (gain)
|
$ | 88.5 | $ | 98.5 | $ | (0.1 | ) | $ | (1.9 | ) | ||||||
|
Transition
obligation
|
0.6 | 0.7 | - | - | ||||||||||||
|
Prior
service (credit) cost
|
(8.4 | ) | (9.6 | ) | 0.3 | 0.4 | ||||||||||
|
Accumulated
other comprehensive income
|
$ | 80.7 | $ | 89.6 | $ | 0.2 | $ | (1.5 | ) | |||||||
65
The
actuarial net loss, transition obligation and prior service credit for the
defined benefit pension plans that will be amortized from accumulated other
comprehensive income into net pension expense over the next fiscal year are $5.1
million, $0.1 million and $(1.1) million, respectively. The prior service cost
for the other retirement benefit plan that will be amortized from accumulated
other comprehensive income into expense over the next fiscal year is $0.1
million.
The
accumulated benefit obligation for all defined benefit pension plans was $260.0
million and $223.3 million at December 31, 2009 and 2008, respectively,
including $38.9 million and $27.9 million, respectively, for international
pension plans.
The
aggregate projected benefit obligation and fair value of plan assets for pension
plans with projected benefit obligations in excess of plan assets were $262.6
million and $193.5 million, respectively, as of December 31, 2009 and $225.2
million and $152.2 million, respectively, as of December 31, 2008. The aggregate
accumulated benefit obligation and fair value of plan assets for pension plans
with accumulated benefit obligations in excess of plan assets were $260.0
million and $193.5 million, respectively, as of December 31, 2009 and $223.3
million and $152.2 million, respectively, as of December 31, 2008.
Benefit
payments expected to be paid under our defined benefit pension plans in the next
ten years are as follows:
|
($
in millions)
|
Domestic
Plans
|
International
Plans
|
Total
|
|||||||||
|
2010
|
$ | 13.4 | $ | 1.1 | $ | 14.5 | ||||||
|
2011
|
14.6 | 2.3 | 16.9 | |||||||||
|
2012
|
16.4 | 1.3 | 17.7 | |||||||||
|
2013
|
17.8 | 1.6 | 19.4 | |||||||||
|
2014
|
19.4 | 1.5 | 20.9 | |||||||||
|
2015
to 2019
|
122.2 | 10.4 | 132.6 | |||||||||
| $ | 203.8 | $ | 18.2 | $ | 222.0 | |||||||
In 2010,
we expect to contribute $10.5 million to pension plans, of which $1.9 million is
for international plans. Included in this amount is a minimum ERISA (Employee
Retirement Income Security Act) funding requirement for the U.S. qualified
pension plan of $8.0 million. We also expect to contribute $1.2 million to other
retirement plans in 2010. We periodically consider additional, voluntary
contributions depending on the investment returns generated by pension plan
assets, changes in benefit obligation projections and other
factors.
Weighted
average assumptions used to determine net periodic benefit cost are as
follows:
|
Pension
benefits
|
Other
retirement benefits
|
|||||||||||||||||||||||
|
2009
|
2008
|
2007
|
2009
|
2008
|
2007
|
|||||||||||||||||||
|
Discount
rate
|
6.38 | % | 6.22 | % | 5.86 | % | 6.25 | % | 6.00 | % | 5.70 | % | ||||||||||||
|
Rate
of compensation increase
|
4.37 | % | 4.85 | % | 4.73 | % | - | - | - | |||||||||||||||
|
Long-term
rate of return on assets
|
7.66 | % | 7.79 | % | 7.86 | % | - | - | - | |||||||||||||||
Weighted
average assumptions used to determine the benefit obligations are as
follows:
|
Pension
benefits
|
Other
retirement benefits
|
|||||||||||||||
|
2009
|
2008
|
2009
|
2008
|
|||||||||||||
|
Discount
rate
|
5.94 | % | 6.46 | % | 5.25 | % | 6.25 | % | ||||||||
|
Rate
of compensation increase
|
4.37 | % | 4.85 | % | - | - | ||||||||||
66
The
discount rate used to determine the benefit obligations for U.S. pension plans
was 6.00% and 6.50% as of December 31, 2009 and 2008,
respectively. The weighted average discount rate used to determine
the benefit obligations for all international plans was 5.64% and 6.17% as of
December 31, 2009 and 2008, respectively. The rate of compensation increase for
U.S. plans was 4.50% for 2009 and 5.00% for 2008, while the weighted average
rate for all international plans was 2.71% for 2009 and 2.66% for 2008. Other
retirement benefits were only available to U.S. employees. The long-term rate of
return for U.S. plans, which accounts for 91% of global plan assets, was 7.75%
for 2009 and 8.00% for both 2008 and 2007.
The
assumed healthcare cost trend rate used to determine benefit obligations was
8.00% for all participants in 2009, decreasing to 5.00% by 2016. Increasing the
assumed healthcare cost trend rate by one percentage point would result in a
$1.0 million increase in the postretirement obligation, whereas a decrease of
one percentage point would result in a $0.9 million decrease in the
postretirement obligation. The assumed healthcare cost trend rate used to
determine net periodic benefit cost was 8.50% for all participants in 2009,
decreasing to 5.00% by 2014. The effect of a one percentage point change in the
rate would be a $0.1 million increase or decrease in the aggregate service and
interest cost components.
The
weighted average asset allocations by asset category for our pension plans, at
December 31, are as follows:
|
2009
|
2008
|
|||||||
|
Equity
securities
|
69 | % | 61 | % | ||||
|
Debt
securities
|
31 | % | 39 | % | ||||
| 100 | % | 100 | % | |||||
Our U.S.
pension plan is managed as a balanced portfolio comprised of two components:
equity and fixed income debt securities. Equity investments are used to maximize
the long-term real growth of fund assets, while fixed income investments are
used to generate current income, provide for a more stable periodic return, and
to provide some protection against a prolonged decline in the market value of
equity investments. Temporary funds may be held as cash. We maintain a long-term
strategic asset allocation policy which provides guidelines for ensuring that
the fund's investments are managed with the short-term and long-term financial
goals of the fund, while allowing the flexibility to react to unexpected changes
in capital markets.
The
following are our target asset allocations and acceptable allocation
ranges:
|
Target
allocation
|
Allocation
range
|
|||||||
|
Equity
securities
|
65 | % | 60%-70 | % | ||||
|
Debt
securities
|
35 | % | 30%-40 | % | ||||
|
Other
|
0 | % | 0%-5 | % | ||||
Diversification
across and within asset classes is the primary means by which we mitigate risk.
We maintain guidelines for all asset and sub-asset categories in order to avoid
excessive investment concentrations. Fund assets are monitored on a regular
basis. If at any time the fund asset allocation is not within the acceptable
allocation range, funds will be reallocated. We also review the fund on a
regular basis to ensure that the investment returns received are consistent with
the short-term and long-term goals of the fund and with comparable market
returns. We are prohibited from pledging fund securities and from investing
pension fund assets in the following: our own stock, securities on margin and
derivative securities.
67
The fair
values of our pension plan assets at December 31, 2009, utilizing the fair value
hierarchy discussed in Note 15, Fair Value of Financial
Instruments, are:
|
Basis
of Fair Value Measurements
|
||||||||||||||||
|
($
in millions)
|
Level
1
|
Level
2
|
Level
3
|
Total
|
||||||||||||
|
Cash
|
$ | 0.4 | $ | - | $ | - | $ | 0.4 | ||||||||
|
Cash
Equivalents:
|
||||||||||||||||
|
Bank
pooled fund
|
- | 0.1 | - | 0.1 | ||||||||||||
|
Equity
securities:
|
||||||||||||||||
|
Indexed
mutual funds
|
96.2 | - | - | 96.2 | ||||||||||||
|
International
mutual funds
|
36.9 | - | - | 36.9 | ||||||||||||
|
Fixed
income securities:
|
||||||||||||||||
|
Mutual
funds
|
58.1 | - | - | 58.1 | ||||||||||||
|
Insurance
contract
|
- | 1.8 | - | 1.8 | ||||||||||||
| $ | 191.6 | $ | 1.9 | $ | - | $ | 193.5 | |||||||||
Note
17: Stock-Based Compensation
At
December 31, 2009, there were approximately 2,040,198 shares remaining in the
2007 Omnibus Incentive Compensation Plan (the “2007 Plan”) for future grants.
The 2007 Plan provides for the granting of stock options, stock appreciation
rights, performance-vesting share awards, performance-vesting unit awards, and
other stock awards to employees and non-employee directors. The terms and
conditions of awards to be granted are determined by our Board’s nominating and
compensation committees. Vesting requirements vary by award.
Stock
options and stock appreciation rights reduce the number of shares available for
grant by one share for each share granted. All other awards under the 2007 Plan
will reduce the total number of shares available for grant by an amount equal to
2.5 times the number of shares awarded.
The
following table summarizes our stock-based compensation expense for the years
ended December 31:
|
($
in millions)
|
2009
|
2008
|
2007
|
|||||||||
|
Stock
option and appreciation rights
|
$ | 3.7 | $ | 3.3 | $ | 3.0 | ||||||
|
Performance-vesting
shares
|
1.8 | 1.8 | 3.2 | |||||||||
|
Performance-vesting
units
|
- | 0.1 | 0.1 | |||||||||
|
Performance-vesting
shares/units dividend equivalents
|
0.2 | 0.1 | 0.1 | |||||||||
|
Employee
stock purchase plan
|
0.3 | 0.4 | 0.4 | |||||||||
|
Deferred
compensation plans
|
1.5 | 0.7 | (1.7 | ) | ||||||||
|
Total
stock-based compensation expense
|
$ | 7.5 | $ | 6.4 | $ | 5.1 | ||||||
The
amount of unrecognized compensation expense for all nonvested awards as of
December 31, 2009, was approximately $7.2 million, which is expected to be
recognized over a weighted average period of 1.6 years.
Stock
Options
Stock
options granted to employees vest in equal annual increments over 4 years of
continuous service. All awards expire ten years from the date of grant. Upon the
exercise of stock options, shares are issued in exchange for the exercise price
of the options.
68
The
following table summarizes changes in outstanding options:
|
(in
millions, except per share data)
|
2009
|
2008
|
2007
|
|||||||||
|
Options
outstanding, January 1
|
2.6 | 2.7 | 2.7 | |||||||||
|
Granted
|
0.4 | 0.5 | 0.3 | |||||||||
|
Exercised
|
(0.3 | ) | (0.5 | ) | (0.2 | ) | ||||||
|
Forfeited
|
- | (0.1 | ) | (0.1 | ) | |||||||
|
Options
outstanding, December 31
|
2.7 | 2.6 | 2.7 | |||||||||
|
Options
exercisable, December 31
|
1.7 | 1.6 | 1.9 | |||||||||
|
Weighted
Average Exercise Price
|
2009 | 2008 | 2007 | |||||||||
|
Options
outstanding, January 1
|
$ | 26.91 | $ | 21.89 | $ | 18.32 | ||||||
|
Granted
|
32.12 | 42.50 | 44.96 | |||||||||
|
Exercised
|
13.70 | 14.09 | 15.10 | |||||||||
|
Forfeited
|
37.43 | 39.87 | 17.81 | |||||||||
|
Options
outstanding, December 31
|
$ | 29.09 | $ | 26.91 | $ | 21.89 | ||||||
|
Options
exercisable, December 31
|
$ | 24.52 | $ | 20.64 | $ | 17.02 | ||||||
As of
December 31, 2009, the weighted average remaining contractual life of options
outstanding and of options exercisable was 5.7 years and 4.4 years,
respectively.
As of
December 31, 2009, the aggregate intrinsic value of total options outstanding
was $26.9 million, of which $25.7 million represented vested
options.
The fair
value of the options was estimated on the date of grant using a Black-Scholes
option valuation model that used the following weighted average assumptions in
2009, 2008 and 2007: a risk-free interest rate of 1.9%, 3.0% and 4.5%,
respectively; stock volatility of 27.0%, 24.5% and 30.3%, respectively; and
dividend yields of 1.9%, 1.3% and 1.2%, respectively. Stock volatility is
estimated based on historical data and the impact from expected future
trends. Expected lives, which are based on prior experience, averaged
5 years for 2009, 2008 and 2007. The weighted average grant date fair value of
options granted in 2009, 2008 and 2007 was $6.98, $9.94 and $13.93,
respectively.
For the
years ended December 31, 2009, 2008 and 2007, the intrinsic value of options
exercised was $7.1 million, $18.0 million and $9.0 million, respectively. The
grant date fair value of options vested during those same periods was $3.7
million, $3.0 million and $2.5 million, respectively.
Stock
Appreciation Rights
Stock
appreciation rights (“SARs”) granted to eligible international employees vest in
equal annual increments over 4 years of continuous service. All awards expire
ten years from the date of grant. The fair value of each SAR is adjusted at the
end of each reporting period with the resulting change reflected in expense.
Upon exercise of a SAR, the employee receives cash for the difference between
the grant date price and the fair market value of the Company’s stock on the
date of exercise. As a result of the cash settlement feature, SAR awards are
recorded within other long-term liabilities.
The
following table summarizes changes in outstanding SARs:
|
2009
|
2008
|
2007
|
||||||||||
|
SARs
outstanding, January 1
|
56,012 | 40,339 | 22,154 | |||||||||
|
Granted
|
22,500 | 24,062 | 20,413 | |||||||||
|
Exercised
|
- | (4,208 | ) | (557 | ) | |||||||
|
Forfeited
|
- | (4,181 | ) | (1,671 | ) | |||||||
|
SARs
outstanding, December 31
|
78,512 | 56,012 | 40,339 | |||||||||
|
SARs
exercisable, December 31
|
24,861 | 10,196 | 4,979 | |||||||||
69
|
Weighted
Average Exercise Price
|
2009
|
2008
|
2007
|
|||||||||
|
SARs
outstanding, January 1
|
$ | 40.43 | $ | 38.85 | $ | 32.59 | ||||||
|
Granted
|
32.09 | 41.70 | 44.97 | |||||||||
|
Exercised
|
- | 32.59 | 32.59 | |||||||||
|
Forfeited
|
- | 40.39 | 32.59 | |||||||||
|
SARs
outstanding, December 31
|
$ | 38.04 | $ | 40.43 | $ | 38.85 | ||||||
|
SARs
exercisable, December 31
|
$ | 39.22 | $ | 37.98 | $ | 32.59 | ||||||
Performance
Awards
In
addition to stock options and SAR awards, we grant performance vesting share
(“PVS”) awards and performance vesting unit (“PVU”) awards to eligible
employees. These awards are earned based on the Company’s performance against
pre-established targets, including annual growth rate of revenue and return on
invested capital (“ROIC”), over a specified performance period. Depending on the
achievement of the targets, recipients of PVS awards are entitled to receive a
certain number of shares of common stock, whereas, recipients of PVU awards are
entitled to receive a payment in cash per unit based on the fair market value of
a share of our common stock at the end of the performance period.
The
following table summarizes changes in our outstanding PVS awards:
|
2009
|
2008
|
2007
|
||||||||||
|
Non-vested
PVS awards, January 1
|
330,458 | 261,131 | 275,145 | |||||||||
|
Granted
at target level
|
125,600 | 158,795 | 94,571 | |||||||||
|
Adjustments
above/(below) target
|
(5,112 | ) | 45,015 | 66,391 | ||||||||
|
Vested
and converted
|
(80,083 | ) | (123,891 | ) | (171,891 | ) | ||||||
|
Forfeited
|
(43,365 | ) | (10,592 | ) | (3,085 | ) | ||||||
|
Non-vested
PVS awards, December 31
|
327,498 | 330,458 | 261,131 | |||||||||
|
Weighted
Average Grant Date Fair Value
|
2009
|
2008
|
2007
|
|||||||||
|
Non-vested
PVS awards, January 1
|
$ | 40.62 | $ | 34.81 | $ | 25.35 | ||||||
|
Granted
at target level
|
32.12 | 42.45 | 44.96 | |||||||||
|
Adjustments
above/(below) target
|
32.69 | 24.86 | 19.41 | |||||||||
|
Vested
and converted
|
32.69 | 25.14 | 19.41 | |||||||||
|
Forfeited
|
39.10 | 40.28 | 28.79 | |||||||||
|
Non-vested
PVS awards, December 31
|
$ | 39.63 | $ | 40.62 | $ | 34.81 | ||||||
The
actual payout of PVS and PVU awards may vary from 0% to 200% of an employee’s
targeted amount. The fair value of PVS awards is based on the market price of
our stock at the grant date and is recognized as expense over the performance
period. The weighted average grant date fair value of PVS awards granted during
the years 2009, 2008 and 2007 was $32.12, $42.45 and $44.96, respectively. We
expect that the PVS awards will vest at 47% of their target award amounts,
converting to 154,556 shares to be issued over an average remaining term of 1.2
years.
The fair
value of PVU awards is also based on the market price of our stock at the grant
date. These awards are revalued at the end of each quarter based on changes in
our stock price. As a result of the cash settlement feature, PVU awards are
recorded within other long-term liabilities.
70
The
following table summarizes our PVU awards outstanding as of December 31, 2009,
and changes during the year then ended:
|
PVU
awards
|
Weighted
Average Grant Date Fair Value per award
|
|||||||
|
Non-vested
PVU awards, January 1
|
19,346 | $ | 39.85 | |||||
|
Granted
at target level
|
7,200 | 32.09 | ||||||
|
Adjustments
above/(below) target
|
(345 | ) | 32.59 | |||||
|
Vested
and converted
|
(5,409 | ) | 32.59 | |||||
|
Forfeited
|
- | - | ||||||
|
Non-vested
PVU awards, December 31
|
20,792 | $ | 35.87 | |||||
Employee
Stock Purchase Plan
We also
offer an Employee Stock Purchase Plan (“ESPP”) which provides for the sale of
our common stock to eligible employees at 85% of the current market price on the
last trading day of each quarterly offering period. Payroll deductions are
limited to 25% of the employee's base salary, not to exceed $25 thousand in any
one calendar year. In addition, employees may not buy more than 1,000 shares
during any offering period (4,000 shares per year). Purchases under the ESPP
were 58,606 shares, 53,029 shares and 50,181 shares for the years 2009, 2008 and
2007, respectively. At December 31, 2009, there were approximately
2.3 million shares available for issuance under the ESPP.
Deferred
Compensation Plans
Our
deferred compensation programs include a Non-Qualified Deferred Compensation
Plan for Non-Employee Directors, under which non-employee directors may defer
all or part of their annual cash retainers and meeting fees. The deferred fees
may be credited to a stock-equivalent account. Amounts credited to this account
are converted into deferred stock units based on the fair market value of one
share of our common stock on the last day of the quarter. Deferred stock units
are ultimately paid in cash at an amount determined by multiplying the number of
units by the fair market value of our common stock at the date of termination.
Similarly, a non-qualified deferred compensation plan for designated executive
officers provides for the conversion of compensation into deferred stock units.
As of December 31, 2009, the two deferred compensation plans held a total of
314,170 deferred stock units, which, due to their cash settlement feature, are
recorded within other long-term liabilities. The liabilities are valued at the
closing market price of our stock at the end of each period with the resulting
change in value recorded in our income statement for the respective period. The
Non-Qualified Deferred Compensation Plan for Non-Employee Directors also holds
57,346 deferred stock awards.
Management
Incentive Plan
Under our
management incentive plan, participants are paid bonuses on the attainment of
certain financial goals, which they can elect to receive in either cash or
shares of our common stock. If the employee elects payment in shares, they are
also given a restricted incentive stock award equal to one share for each four
bonus shares issued. The incentive stock awards vest at the end of four years
provided that the participant has not made a disqualifying disposition of their
bonus shares. Incentive stock award grants were 3,700 shares, 5,700 shares and
4,800 shares in 2009, 2008 and 2007, respectively. Incentive stock forfeitures
of 400 shares, 600 shares and 1,200 shares occurred in 2009, 2008 and 2007,
respectively. Compensation expense is recognized over the vesting period based
on the fair market value of common stock on the award date: $32.09 per share
granted in 2009, $41.70 per share granted in 2008 and $44.97 per share granted
in 2007.
71
Note
18: Commitments and Contingencies
At
December 31, 2009, we were obligated under various operating lease agreements
with terms ranging from one month to 20 years. Net rental expense in 2009, 2008
and 2007 was $12.9 million, $11.2 million and $10.6 million, respectively, and
is net of sublease income of $0.7 million annually for the same
years.
At
December 31, 2009, future minimum rental payments under non-cancelable operating
leases were:
|
Year
|
($
in millions)
|
|||
|
2010
|
$ | 10.8 | ||
|
2011
|
9.2 | |||
|
2012
|
8.6 | |||
|
2013
|
4.1 | |||
|
2014
|
4.0 | |||
|
Thereafter
|
18.9 | |||
|
Total
|
55.6 | |||
|
Less
sublease income
|
1.9 | |||
| $ | 53.7 | |||
At
December 31, 2009, outstanding unconditional contractual commitments for the
purchase of raw materials, utilities and equipment amounted to $14.9 million, of
which, $6.7 million is due to be paid in 2010.
We have
letters of credit totaling $2.1 million supporting the reimbursement of workers’
compensation and other claims paid on our behalf by insurance carriers and to
guarantee the payment of equipment leases in Ireland and sales tax liabilities
in the U.S. Our accrual for insurance obligations was $5.2 million at December
31, 2009.
During
2007, a detailed review was performed of several related tax cases pending in
the Brazilian courts, which indicated that it was probable that the positions
taken on our previous tax filings, some of which date back to the late 1990’s,
would not be sustained. During the fourth quarter of 2007 and the first quarter
of 2008, we made total cash payments of $24.4 million for tax obligations and
judicial deposits to the government of Brazil. During 2009, we enrolled in a tax
amnesty program offered by the Brazilian government which provided for reduced
penalties and interest on certain of our tax obligations. This matter is
currently awaiting final disposition in the Brazilian court system. Our total
accrual at December 31, 2009 related to these matters and adjusted for expected
amnesty benefit, was $7.3 million.
We have
accrued, within other current liabilities, the estimated cost of environmental
remediation expenses related to soil or ground water contamination at current
and former manufacturing facilities. We believe the accrual of $0.3
million at December 31, 2009 is sufficient to cover the future costs of these
remedial actions.
Note
19: New Accounting Standards
Recently
Adopted Standards
In
December 2007, the FASB revised the authoritative guidance regarding
business combinations. This new guidance establishes principles and requirements
for how the acquirer recognizes and measures assets acquired and liabilities
assumed in a business combination, as well as, goodwill acquired and determines
what information to disclose to enable users of the financial statements to
evaluate the nature and financial effects of a business combination. In April
2009, the FASB issued a staff position, which requires that contingent assets
acquired and liabilities assumed be recognized at fair value on the acquisition
date if the fair value can be reasonably estimated. If the fair value cannot be
reasonably estimated, the contingent asset or liability should be measured in
accordance with the relevant guidance that addresses accounting for
contingencies. Both of these standards were effective for us as of January 1,
2009 and will be applied prospectively to business combinations entered into on
or after that date.
72
In
December 2007, the FASB issued authoritative guidance requiring a
noncontrolling interest in a subsidiary be reported as equity and that the
amount of consolidated net income attributable to the parent and to the
noncontrolling interest should be separately identified in the consolidated
financial statements. We have applied these provisions prospectively, as of
January 1, 2009, except for the presentation and disclosure requirements, which
were applied retrospectively for all periods presented. The adoption did not
have a material impact on our financial statements.
On
January 1, 2009, we adopted new guidance that requires enhanced disclosures
regarding derivatives and hedging activities, including information about how:
(a) an entity uses derivative instruments; (b) derivative instruments and
related hedged items are accounted for; and (c) derivative instruments and
related hedged items affect an entity’s financial position, financial
performance and cash flows. Refer to Note 14, Derivative Financial
Instruments, for further information and disclosures.
In April
2009, the FASB issued authoritative guidance requiring disclosures about fair
value of financial instruments in interim, as well as annual financial
statements. The guidance also requires those disclosures in summarized financial
information at interim reporting periods. We adopted this guidance as of June
30, 2009. The adoption did not have a material impact on our financial
statements. See Note 14, Derivative Financial
Instruments, and Note 15, Fair Value of Financial
Instruments, for additional information.
In April
2009, the FASB issued additional guidance to assist in determining whether a
market is active or inactive and whether a transaction is distressed. It is
applicable to all assets and liabilities that are measured at fair value and
requires enhanced disclosures. This guidance was effective for us as of June 30,
2009, on a prospective basis. We considered this guidance in our determination
of fair values in Note 15, Fair Value of Financial
Instruments.
In May
2009, the FASB issued authoritative guidance for subsequent events, which
establishes general standards of accounting for and disclosure of events or
transactions that occur after the balance sheet date but before financial
statements are issued or are available to be issued. This guidance also requires
disclosure of the date through which an entity has evaluated subsequent events
and the basis for that date. We adopted this guidance as of June 30, 2009. The
adoption did not have a material impact on our financial statements. See Note 1,
Summary of Significant
Accounting Policies, for additional information.
In June
2009, the FASB issued the FASB Accounting Standards Codification™ (the
“Codification”), which changes the referencing of financial standards. The
Codification is now the single source of authoritative accounting principles
recognized by the FASB to be applied in the preparation of financial statements
in conformity with U.S. GAAP. All other literature is considered
non-authoritative. The Codification does not change U.S. GAAP. This guidance was
effective for us as of September 30, 2009. The adoption did not have a material
impact on our financial statements.
On
December 31, 2009, we adopted new guidance that expands the disclosure
requirements relating to defined benefit pension and other postretirement plans
including how investment allocation decisions are made and the investment
policies and strategies that support those decisions, major categories of plan
assets, the input and valuation techniques used in measuring benefit plan assets
at fair value, and significant concentrations of risk within plan assets. The
adoption did not have a material impact on our financial statements. Refer to
Note 16, Benefit Plans,
for additional information.
Standards
Issued Not Yet Adopted
In June
2009, the FASB issued revised guidance which requires a qualitative approach to
identify the primary beneficiary of a variable interest entity (“VIE”), amends
guidance for determining whether an entity is a VIE and requires ongoing
assessment of whether an entity is the primary beneficiary of a VIE. This
guidance also requires enhanced disclosures about an entity’s involvement with a
VIE and is effective for annual periods beginning after November 15, 2009.
Management believes the adoption of this guidance will not have a material
impact on our financial statements.
73
In
September 2009, the FASB issued revised guidance for multiple-deliverable
revenue arrangements. The guidance requires companies to allocate revenue in
these types of arrangements based on an element’s estimated selling price if
vendor-specific or other third-party evidence is not available. This guidance
also expands required disclosures and is effective prospectively for revenue
arrangements entered into or materially modified in fiscal years beginning on or
after June 15, 2010. Management believes the adoption will not have a material
impact on our financial statements.
In
January 2010, the FASB issued guidance requiring new disclosures about recurring
or nonrecurring fair value measurements including significant transfers into and
out of Level 1 and Level 2 fair value measurements and information on purchases,
sales, issuances and settlements on a gross basis in the Level 3 reconciliation.
This guidance is effective for annual reporting periods beginning after December
15, 2009, except for Level 3 reconciliation disclosures which are effective for
annual periods beginning after December 15, 2010. Management does not expect
this adoption to have a material impact on our financial
statements.
74
Report
of Independent Registered Public Accounting Firm
To the
Shareholders and the Board of Directors of
West
Pharmaceutical Services, Inc.
In our
opinion, the consolidated financial statements listed in the index appearing
under Item 15 (a) (1), present fairly, in all material respects, the financial
position of West Pharmaceutical Services, Inc. and its subsidiaries at December
31, 2009 and 2008, and the results of their operations and their cash flows for
each of the three years in the period ended December 31, 2009 in conformity with
accounting principles generally accepted in the United States of
America. In addition, in our opinion, the financial statement
schedule appearing under Item 15 (a) (2) presents fairly, in all material
respects, the information set forth therein when read in conjunction with the
related consolidated financial
statements. Also in our opinion, the Company maintained, in all
material respects, effective internal control over financial reporting as of
December 31, 2009, based on criteria established in Internal Control - Integrated
Framework issued by the Committee of Sponsoring Organizations of the
Treadway Commission (COSO). The Company's management is responsible
for these financial statements and financial statement schedule, for maintaining
effective internal control over financial reporting and for its assessment of
the effectiveness of internal control over financial reporting, included in
Management's Report on Internal Control over Financial Reporting appearing under
Item 9A. Our responsibility is to express opinions on these financial
statements, on the financial statement schedule, and on the Company's internal
control over financial reporting based on our integrated audits. We
conducted our audits in accordance with the standards of the Public Company
Accounting Oversight Board (United States). Those standards require
that we plan and perform the audits to obtain reasonable assurance about whether
the financial statements are free of material misstatement and whether effective
internal control over financial reporting was maintained in all material
respects. Our audits of the financial statements included examining,
on a test basis, evidence supporting the amounts and disclosures in the
financial statements, assessing the accounting principles used and significant
estimates made by management, and evaluating the overall financial statement
presentation. Our audit of internal control over financial reporting
included obtaining an understanding of internal control over financial
reporting, assessing the risk that a material weakness exists, and testing and
evaluating the design and operating effectiveness of internal control based on
the assessed risk. Our audits also included performing such other
procedures as we considered necessary in the circumstances. We believe that our
audits provide a reasonable basis for our opinions.
As
discussed in Note 5 to the consolidated financial statements, the Company
changed the manner in which it accounts for uncertainty in income taxes in
2007.
A
company’s internal control over financial reporting is a process designed to
provide reasonable assurance regarding the reliability of financial reporting
and the preparation of financial statements for external purposes in accordance
with generally accepted accounting principles. A company’s internal
control over financial reporting includes those policies and procedures that
(i) pertain to the maintenance of records that, in reasonable detail,
accurately and fairly reflect the transactions and dispositions of the assets of
the company; (ii) provide reasonable assurance that transactions are
recorded as necessary to permit preparation of financial statements in
accordance with generally accepted accounting principles, and that receipts and
expenditures of the company are being made only in accordance with
authorizations of management and directors of the company; and
(iii) provide reasonable assurance regarding prevention or timely detection
of unauthorized acquisition, use, or disposition of the company’s assets that
could have a material effect on the financial statements.
75
Because
of its inherent limitations, internal control over financial reporting may not
prevent or detect misstatements. Also, projections of any evaluation
of effectiveness to future periods are subject to the risk that controls may
become inadequate because of changes in conditions, or that the degree of
compliance with the policies or procedures may deteriorate.
/s/PricewaterhouseCoopers
LLP
PricewaterhouseCoopers
LLP
Philadelphia,
Pennsylvania
February
25, 2010
76
Quarterly
Operating and Per Share Data (Unaudited)
|
($
in millions, except per share data)
|
First
Quarter
(1)
|
Second
Quarter
(2)
|
Third
Quarter
(3)
|
Fourth
Quarter
(4)
|
Full
Year
|
|||||||||||||||
|
2009
|
||||||||||||||||||||
|
Net
sales
|
$ | 242.4 | $ | 261.0 | $ | 258.9 | $ | 293.4 | $ | 1,055.7 | ||||||||||
|
Gross
profit
|
69.3 | 78.7 | 71.7 | 83.9 | 303.6 | |||||||||||||||
|
Net
income
|
$ | 15.4 | $ | 19.7 | $ | 17.2 | $ | 20.3 | $ | 72.6 | ||||||||||
|
Less:
net income attributable to noncontrolling interests
|
- | - | - | - | - | |||||||||||||||
|
Net
income attributable to common shareholders
|
$ | 15.4 | $ | 19.7 | $ | 17.2 | $ | 20.3 | $ | 72.6 | ||||||||||
|
Net
income per share:
|
||||||||||||||||||||
|
Basic
|
$ | 0.47 | $ | 0.60 | $ | 0.52 | $ | 0.62 | $ | 2.21 | ||||||||||
|
Diluted
|
$ | 0.46 | $ | 0.57 | $ | 0.50 | $ | 0.59 | $ | 2.12 | ||||||||||
|
2008
|
||||||||||||||||||||
|
Net
sales
|
$ | 270.7 | $ | 279.3 | $ | 256.2 | $ | 244.9 | $ | 1,051.1 | ||||||||||
|
Gross
profit
|
83.5 | 83.6 | 66.0 | 69.5 | 302.6 | |||||||||||||||
|
Net
income
|
$ | 26.4 | 28.9 | $ | 13.5 | $ | 17.8 | $ | 86.6 | |||||||||||
|
Less:
net income attributable to noncontrolling interests
|
0.2 | 0.2 | 0.2 | - | 0.6 | |||||||||||||||
|
Net
income attributable to common shareholders
|
$ | 26.2 | $ | 28.7 | $ | 13.3 | $ | 17.8 | $ | 86.0 | ||||||||||
|
Net
income per share:
|
||||||||||||||||||||
|
Basic
|
$ | 0.81 | $ | 0.89 | $ | 0.41 | $ | 0.54 | $ | 2.65 | ||||||||||
|
Diluted
|
$ | 0.76 | $ | 0.82 | $ | 0.40 | $ | 0.52 | $ | 2.50 | ||||||||||
The sum
of the individual per share amounts may not equal full year due to
rounding.
Factors
affecting the comparability of the information reflected in the quarterly
data:
|
(1)
|
First
quarter 2009 net income included $0.4 million of restructuring charges
($0.01 per diluted share) and $1.7 million of discrete tax benefits ($0.05
per diluted share). Net income in the first quarter of 2008 included $0.7
million ($0.02 per diluted share) of restructuring and related charges, a
net gain on contract settlement of $0.8 million ($0.03 per diluted share)
and discrete tax benefits of $1.1 million ($0.03 per diluted
share).
|
|
(2)
|
Net
income in the second quarter of 2009 included $0.2 million of
restructuring charges ($0.01 per diluted share). Second quarter 2008 net
income included $0.9 million ($0.02 per diluted share) of restructuring
and related charges in the second quarter of 2008 and a net gain on
contract settlement of $4.2 million ($0.11 per diluted
share).
|
|
(3)
|
Third
quarter 2009 net income included discrete tax benefits of $0.4 ($0.01 per
diluted share) and a gain on Brazilian tax amnesty benefits of $1.7
million ($0.04 per diluted share). In the third quarter of 2008, net
income from continuing operations included contract settlement costs of
$1.1 million ($0.03 per diluted share) and discrete tax benefits of $2.2
million ($0.06 per diluted share).
|
|
(4)
|
In
the fourth quarter of 2009, net income included $5.6 million of
restructuring and related charges ($0.16 per diluted share), discrete tax
benefits of $4.0 million ($0.11 per diluted share) and a $1.3 million
($0.03 per diluted share) charge relating to the Brazilian tax amnesty
program. Fourth quarter 2008 net income included $0.4 million ($0.01 per
diluted share) of restructuring and related charges, contract settlement
costs of $1.2 million ($0.04 per diluted share) and a discrete tax benefit
of $0.3 million ($0.01 per diluted
share).
|
77
ITEM 9. CHANGES IN AND DISAGREEMENTS WITH ACCOUNTANTS
ON ACCOUNTING AND FINANCIAL DISCLOSURE.
None.
ITEM
9A. CONTROLS AND
PROCEDURES.
Evaluation
of Disclosure Controls and Procedures
An
evaluation was performed under the supervision and with the participation of our
management, including our Chief Executive Officer and Chief Financial Officer,
of the effectiveness of our disclosure controls and procedures (as defined in
Rule 13a-15(e) under the Securities Exchange Act of 1934), as of the end of the
period covered by this annual report on Form 10-K. Based on this
evaluation, our Chief Executive Officer and Chief Financial Officer have
concluded that, as of December 31, 2009 our disclosure controls and procedures
are effective.
Management’s
Report on Internal Control over Financial Reporting
Our
management is responsible for establishing and maintaining adequate internal
control over financial reporting, as defined in Rule 13a-15(f) under the
Securities Exchange Act of 1934. Our internal control over financial
reporting is a process designed under the supervision of our principal executive
and principal financial officer to provide reasonable assurance regarding the
reliability of financial reporting and the preparation of our financial
statements for external reporting purposes in accordance with U.S. generally
accepted accounting principles.
Management
assessed the effectiveness of our internal control over financial reporting as
of December 31, 2009 based on the framework established in “Internal
Control-Integrated Framework” issued by the Committee of Sponsoring
Organizations of the Treadway Commission (COSO). Based on this
assessment, management has determined that our internal control over financial
reporting was effective as of December 31, 2009.
Because
of its inherent limitations, internal control over financial reporting may not
prevent or detect misstatements. Also projections of any evaluation
of effectiveness to future periods are subject to the risks that controls may
become inadequate because of changes in conditions, or that the degree of
compliance with policies or procedures may deteriorate.
The
effectiveness of our internal control over financial reporting as of December
31, 2009 has been audited by PricewaterhouseCoopers LLP, an independent
registered pubic accounting firm, as stated in their report, which is included
herein.
Changes
in Internal Controls
During
the second quarter of 2008, we successfully replaced our financial reporting,
cash disbursement and order-to-cash systems in our North American operations
with a new enterprise resource planning (“ERP”) system. Phase two of the
project, which focused on procurement and plant operations, as well as updates
to shop floor systems, commenced in late 2008 and was completed in the fourth
quarter of 2009. These implementations have resulted in certain changes to
business processes and internal controls impacting financial reporting. We have
evaluated the control environment as affected by this project and believe that
our controls remained effective.
During
the period covered by this report, there have been no other changes to our
internal control over financial reporting that have materially affected, or are
reasonably likely to materially affect, our internal control over financial
reporting.
ITEM 9B. OTHER INFORMATION.
None.
78
PART III
ITEM 10. DIRECTORS, EXECUTIVE OFFICERS AND CORPORATE
GOVERNANCE.
Information
about our directors is incorporated by reference from the discussion under the
heading Board of Directors
in our 2010 Proxy Statement. Information about our Code of Business
Conduct is incorporated by reference from the discussion under the heading Corporate Governance – Code of
Business Conduct in our 2010 Proxy Statement. Information regarding the
procedures by which our shareholders may recommend nominees to our Board of
Directors is incorporated by reference from the discussion under the heading
Corporate Governance –
Nomination of Directors in our 2010 Proxy Statement. Information about
our Audit Committee, including the members of the committee, and our Audit
Committee financial experts, is incorporated by reference from the discussion
under the headings Board and
Committee Membership, Audit Committee Membership and Audit Committee Financial Experts
in our 2010 Proxy Statement. The balance of the information required by
this item is contained in the discussion entitled Executive Officers of the Company
in Part I of this 2009 Form 10-K.
ITEM 11. EXECUTIVE COMPENSATION.
Information
about director and executive compensation is incorporated by reference from the
discussion under the headings Compensation of Non-Employee
Directors and Executive
Compensation in our 2010 Proxy Statement.
|
ITEM 12. SECURITY OWNERSHIP OF CERTAIN BENEFICIAL OWNERS
AND MANAGEMENT AND RELATED STOCKHOLDER
MATTERS.
|
Information
required by this Item is incorporated by reference from the discussion under the
headings Security Ownership of
Management and Certain Beneficial Owners in our 2010 Proxy
Statement.
Equity
Compensation Plan Information
The
following table sets forth information about the grants of stock options,
restricted stock or other rights under all of the Company’s equity compensation
plans as of the close of business on December 31, 2009. The table does not
include information about tax-qualified plans such as the West 401(k)
Plan.
|
Plan
Category
|
Number
of Securities
to
be Issued Upon
Exercise
of
Outstanding
Options,
Warrants
and Rights (a)
|
Weighted-Average
Exercise
Price of
Outstanding
Options,
Warrants
and Rights (b)
|
Number
of Securities
Remaining
Available for
Future
Issuance Under
Equity
Compensation
Plans
(Excluding Securities
Reflected
in Column (a)) (c)
|
|
Equity
compensation plans approved by security holders
|
3,044,260
(1)
|
$29.09
(2)
|
4,342,387
(3)
|
|
Equity
compensation plans not approved by security holders
|
-
|
-
|
-
|
|
Total
|
3,044,260
|
$29.09
|
4,342,387
|
|
(1)
|
Includes
812,300 outstanding stock options, 327,498 unvested restricted performance
share units and 57,346 deferred stock-equivalents units granted to
directors under the Non-Qualified Deferred Compensation Plan for
Non-Employee Directors under the 2007 Omnibus Incentive Compensation Plan.
Also includes 1,303,087 outstanding stock options under the 2004
Stock-Based Compensation Plan (which was terminated in 2007), 516,779
outstanding stock options under the 1998 Key Employee Incentive
Compensation Plan and 27,250 outstanding options under the 1999
Non-Qualified Stock Option Plan for Non-Employee Directors (which were
both terminated in 2004). No future grants or awards may be made
under the terminated plans. Does not include stock-equivalent units
granted or credited to directors under the Non-Qualified Deferred
Compensation Plan for Non-Employee Directors to be settled only in
cash.
|
79
|
(2)
|
Restricted
performance share and deferred stock-equivalent units are excluded when
determining the weighted-average exercise price of outstanding
options.
|
|
(3)
|
Represents
2,302,189 shares reserved under the Company’s Employee Stock Purchase Plan
and 2,040,198 shares remaining available for issuance under the 2007
Omnibus Incentive Compensation Plan. The estimated number of shares
that could be issued for the current period from the Employee Stock
Purchase Plan is 802,074. This number of shares is calculated by
multiplying the 678 share per offering period per participant limit by
1,183, the number of current participants in the
plan.
|
|
ITEM 13. CERTAIN RELATIONSHIPS AND RELATED
TRANSACTIONS, AND DIRECTOR
INDEPENDENCE.
|
Information
called for by this Item is incorporated by reference from the discussion under
the heading Review of Related
Person Transactions in our 2010 Proxy Statement. Information about
director independence is incorporated by reference from the discussion under the
heading Director
Independence in our 2010 Proxy Statement.
ITEM 14. PRINCIPAL ACCOUNTANT FEES AND SERVICES.
Information
about the fees for professional services rendered by our independent auditors in
2009 and 2008 is incorporated by reference from the discussion under the heading
Fees Paid to
PricewaterhouseCoopers LLP in Item 2 of our 2010 Proxy Statement. Our
Audit Committee’s policy on pre-approval of audit and permissible non-audit
services of our independent auditors is incorporated by reference from the
section captioned Audit
Committee Policy on Pre-Approval of Audit and Permissible Non-Audit
Services in Item 2 of our 2010 Proxy Statement.
80
PART IV
ITEM 15. EXHIBITS AND FINANCIAL STATEMENT
SCHEDULES.
(a)
1. Financial Statements
The
following documents are included in Part II, Item 8:
Consolidated
Statements of Income for the years ended December 31, 2009, 2008 and
2007
Consolidated
Statements of Comprehensive Income for the years ended December 31, 2009, 2008
and 2007
Consolidated
Balance Sheets at December 31, 2009 and 2008
Consolidated
Statements of Changes in Equity for the years ended December 31, 2009, 2008 and
2007
Consolidated
Statements of Cash Flows for the years ended December 31, 2009, 2008 and
2007
Notes to
Consolidated Financial Statements
Report of
Independent Registered Public Accounting Firm
(a)
2. Financial Statement Schedules
Schedule
II - Valuation and Qualifying Accounts
|
($
in millions)
|
Balance
at
beginning
of
period
|
Charged
to
costs
and
expenses
|
Deductions
(1)
|
Balance
at
end
of
period
|
||||||||||||
|
For
the year ended December 31, 2009
|
||||||||||||||||
|
Allowances
deducted from assets
|
||||||||||||||||
|
Deferred
tax asset valuation allowance
|
$ | 23.4 | $ | 1.3 | $ | (0.4 | ) | $ | 24.3 | |||||||
|
Allowance
for doubtful accounts receivable
|
0.7 | (0.2 | ) | 0.2 | 0.7 | |||||||||||
|
Total
allowances deducted from assets
|
$ | 24.1 | $ | 1.1 | $ | (0.2 | ) | $ | 25.0 | |||||||
|
For
the year ended December 31, 2008
|
||||||||||||||||
|
Allowances
deducted from assets
|
||||||||||||||||
|
Deferred
tax asset valuation allowance
|
$ | 27.0 | $ | 0.2 | $ | (3.8 | ) | $ | 23.4 | |||||||
|
Allowance
for doubtful accounts receivable
|
0.6 | 0.3 | (0.2 | ) | 0.7 | |||||||||||
|
Total
allowances deducted from assets
|
$ | 27.6 | $ | 0.5 | $ | (4.0 | ) | $ | 24.1 | |||||||
|
For
the year ended December 31, 2007
|
||||||||||||||||
|
Allowances
deducted from assets
|
||||||||||||||||
|
Deferred
tax asset valuation allowance
|
$ | 25.3 | $ | 4.9 | $ | (3.2 | ) | $ | 27.0 | |||||||
|
Allowance
for doubtful accounts receivable
|
0.9 | - | (0.3 | ) | 0.6 | |||||||||||
|
Total
allowances deducted from assets
|
$ | 26.2 | $ | 4.9 | $ | (3.5 | ) | $ | 27.6 | |||||||
__________________________
|
(1)
|
Includes
accounts receivable written off, translation adjustments and reversals of
prior year valuation allowances.
|
All other
schedules are omitted because they are either not applicable, not required or
because the information required is contained in the consolidated financial
statements or notes thereto.
|
(a)
3.
|
Exhibits
- An index of the exhibits included in this Form 10-K Report or
incorporated by reference is contained on pages F-1 through
F-5. Exhibit numbers 10.1 through 10.59 are management
contracts or compensatory plans or
arrangements.
|
|
(b)
|
See
subsection (a) 3. above.
|
|
(c)
|
Financial
Statements of affiliates are omitted because they do not meet the tests of
a significant subsidiary at the 20%
level.
|
81
SIGNATURES
Pursuant
to the requirements of Section 13 or 15(d) of the Securities Exchange Act of
1934, West Pharmaceutical Services, Inc. has duly caused this report to be
signed on its behalf by the undersigned, thereunto duly authorized.
WEST
PHARMACEUTICAL SERVICES, INC.
(Registrant)
By: /s/ William J.
Federici
William
J. Federici
Vice
President and Chief Financial Officer
February
25, 2010
82
Pursuant
to the requirements of the Securities Exchange Act of 1934, this report has been
signed below by the following persons in the capacities and on the dates
indicated.
|
Signature
|
Title
|
Date
|
|
/s/ Donald E. Morel, Jr.,
Ph.D
|
Director,
Chief Executive Officer and Chairman
|
February
19, 2010
|
|
Donald
E. Morel, Jr., Ph.D
|
of
the Board, (Principal Executive Officer)
|
|
|
/s/ Joseph E. Abbott
|
Vice
President and Corporate Controller
|
February
19, 2010
|
|
Joseph
E. Abbott
|
(Principal
Accounting Officer)
|
|
|
/s/ William J. Federici
|
Vice
President and Chief Financial Officer
|
February
19, 2010
|
|
William
J. Federici
|
(Principal
Financial Officer)
|
|
|
/s/ Thomas W. Hofmann
|
Director
|
February
19, 2010
|
|
Thomas
W. Hofmann*
|
||
|
/s/ L. Robert Johnson
|
Director
|
February
19, 2010
|
|
L.
Robert Johnson*
|
||
|
/s/ Paula A. Johnson
|
Director
|
February
19, 2010
|
|
Paula
A. Johnson*
|
||
|
/s/ John P. Neafsey
|
Director
|
February
19, 2010
|
|
John
P. Neafsey*
|
||
|
/s/ John H. Weiland
|
Director
|
February
19, 2010
|
|
John
H. Weiland*
|
||
|
/s/ Anthony Welters
|
Director
|
February
19, 2010
|
|
Anthony
Welters*
|
||
|
/s/ Geoffrey F. Worden
|
Director
|
February
19, 2010
|
|
Geoffrey
F. Worden*
|
||
|
/s/ Robert C. Young
|
Director
|
February
19, 2010
|
|
Robert
C. Young*
|
||
|
/s/ Patrick J. Zenner
|
Director
|
February
19, 2010
|
|
Patrick
J. Zenner*
|
* By John
R. Gailey III pursuant to a power of attorney.
83
EXHIBIT
INDEX
|
Exhibit
Number
|
Description
|
|
3.1
|
Our
Amended and Restated Articles of Incorporation effective December 17, 2007
are incorporated by reference from our Form 8-K dated December 17,
2007.
|
|
3.2
|
Our
Bylaws, as amended effective October 14, 2008 are incorporated by
reference from our Form 8-K dated October 20, 2008.
|
|
4.1
|
Form
of stock certificate for common stock is incorporated by reference from
our 1998 10-K report.
|
|
4.2
|
Article
5, 6, 8(c) and 9 of our Amended and Restated Articles of Incorporation are
incorporated by reference from our Form 8-K dated December 17,
2007.
|
|
4.3
|
Article
I and V of our Bylaws, as amended through October 14, 2008, are
incorporated by reference from our Form 8-K dated October 20,
2008.
|
|
4.4
(1)
|
Instruments
defining the rights of holders of long-term debt securities of West and
its subsidiaries have been omitted.
|
|
10.1
|
Lease
dated as of December 31, 1992 between Lion Associates, L.P. and us
relating to the lease of our headquarters in Lionville, Pa. is
incorporated by reference from our 1992 10-K report.
|
|
10.2
|
First
Addendum to Lease dated as of May 22, 1995 between Lion Associates, L.P.
and us is incorporated by reference from our 1995 10-K
report.
|
|
10.3
|
Lease
dated as of December 14, 1999 between White Deer Warehousing &
Distribution Center, Inc. and us relating to the lease of our site in
Montgomery, Pa. is incorporated by reference from our 2002 10-K
report.
|
|
10.4 (2)
|
1999
Non-Qualified Stock Option Plan for Non-Employee Directors, effective as
of April 27, 1999 (now terminated) is incorporated by reference from our
10-Q report for the quarter ended June 30, 1999.
|
|
10.5 (2)
|
Amendment
No. 1 to 1999 Non-Qualified Stock Option Plan for Non-Employee Directors,
effective October 30, 2001, is incorporated by reference from our 2001
10-K report.
|
|
10.6 (2)
|
Form
of Second Amended and Restated Change-in-Control Agreement between us and
certain of our executive officers dated as of March 25, 2000 is
incorporated by reference from our 10-Q report for the quarter ended March
31, 2000.
|
|
10.7 (2)
|
Form
of Amendment No. 1 to Second Amended and Restated Change-in-Control
Agreement dated as of May 1, 2001 between us and certain of our executive
officers is incorporated by reference from our 2001 10-K
report.
|
|
10.8 (2)
|
Form
of Amendment No. 2 to Second Amended and Restated Change-in-Control
Agreement between us and certain of our executive officers, dated as of
various dates in December 2008, is incorporated by reference from our 2008
10-K report.
|
|
10.9 (2)
|
Schedule
of agreements with executive officers is incorporated by reference from
our 2008 10-K report.
|
|
10.10 (2)
|
Award
Letter dated July 28, 2008 between us and Matthew T. Mullarkey (relating
to the 2007-2009 performance period) is incorporated by reference from our
Form 8-K dated July 28, 2008.
|
F-1
|
Exhibit
Number
|
Description
|
|
10.11 (2)
|
Award
Letter dated July 28, 2008 between us and Matthew T. Mullarkey (relating
to the 2008-2010 performance period) is incorporated by reference from our
Form 8-K dated July 28, 2008.
|
|
10.12 (2)
|
Severance
and Non-Competition Agreement dated July 28, 2008 between us and Matthew
T. Mullarkey is incorporated by reference from our Form 8-K dated July 28,
2008.
|
|
10.13 (2)
|
Severance
Benefits Letter Agreement, dated as of December 22, 2009 between us and
Matthew T. Mullarkey.
|
|
10.14 (2)
|
Non-Competition
Agreement, dated as of October 5, 1994, between us and Steven A. Ellers,
is incorporated by reference from our 2007 10-K report.
|
|
10.15 (2)
|
Employment
Agreement, dated as of April 30, 2002, between us and Donald E. Morel, Jr.
is incorporated by reference from our 10-Q report for the quarter ended
September 30, 2002.
|
|
10.16 (2)
|
Amendment
#1 to the Employment Agreement between us and Donald E. Morel, Jr., dated
as of December 19, 2008, is incorporated by reference from our 2008 10-K
report.
|
|
10.17 (2)
|
Non-Qualified
Stock Option Agreement, dated as of April 30, 2002 between us and Donald
E. Morel, Jr. is incorporated by reference from our 10-Q report for the
quarter ended September 30, 2002.
|
|
10.18 (2)
|
Indemnification
Agreement, dated as of January 5, 2009 between us and Donald E. Morel, Jr.
is incorporated by reference from our Form 8-K dated January 6,
2009.
|
|
10.19 (2)
|
Supplemental
Employees' Retirement Plan, as amended and restated effective January 1,
2008, is incorporated by reference from our 2008 10-K
report.
|
|
10.20 (2)
|
Non-Qualified
Deferred Compensation Plan for Designated Employees, as amended and
restated effective January 1, 2008, is incorporated by reference from our
2008 10-K report.
|
|
10.21 (2)
|
Deferred
Compensation Plan for Outside Directors, as amended and restated effective
January 1, 2008, is incorporated by reference from our 2008 10-K
report.
|
|
10.22 (2)
|
1998
Key Employee Incentive Compensation Plan, dated March 10, 1998 (now
terminated) is incorporated by reference from our 1997 10-K
report.
|
|
10.23 (2)
|
Amendment
No. 1 to 1998 Key Employees Incentive Compensation Plan, effective October
30, 2001 is incorporated by reference from our 2001 10-K
report.
|
|
10.24 (2)
|
2007
Omnibus Incentive Compensation Plan effective as of May 1, 2007, is
incorporated by reference to Exhibit 99.1 of the Company’s Form 8-K dated
May 4, 2007.
|
|
10.25 (2)
|
2004
Stock-Based Compensation Plan (now terminated) is incorporated by
reference from our Proxy Statement for the 2004 Annual Meeting of
Shareholders.
|
|
10.26 (2)
|
Form
of Director 2004 Non-Qualified Stock Option Award Agreement, issued
pursuant to the 2004 Stock-Based Compensation Plan is incorporated by
reference from our 10-Q report for the quarter ended September 30,
2004.
|
F-2
|
Exhibit
Number
|
Description
|
|
||
|
10.27 (2)
|
Form
of Director 2004 Stock Unit Award Agreement, issued pursuant to the 2004
Stock-Based Compensation Plan is incorporated by reference from our 10-Q
report for the quarter ended September 30, 2004.
|
|||
|
10.28 (2)
|
Form
of Director 2004 Non-Qualified Stock Option Agreement, issued pursuant to
the 2004 Stock-Based Compensation Plan is incorporated by reference from
our 10-Q report for the quarter ended September 30, 2004.
|
|||
|
10.29 (2)
|
Form
of Executive 2005 Bonus and Incentive Share Award Notice is incorporated
by reference from our 10-Q report for the quarter ended September 30,
2005.
|
|||
|
10.30 (2)
|
Form
of Executive 2005 Non-Qualified Stock Option Award Notice is incorporated
by reference from our 10-Q report for the quarter ended September 30,
2005.
|
|||
|
10.31 (2)
|
Form
of Director 2005 Non-Qualified Stock Option Award Notice is incorporated
by reference from our 10-Q report for the quarter ended September 30,
2005.
|
|||
|
10.32 (2)
|
Form
of Director 2005 Stock Unit Share Award Notice is incorporated by
reference from our 10-Q report for the quarter ended September 30,
2005.
|
|||
|
10.33 (2)
|
Form
of Executive 2006 Bonus and Incentive Share Award is incorporated by
reference from our 10-Q report for the quarter ended March 31,
2006.
|
|||
|
10.34 (2)
|
Form
of Executive 2006 Non-Qualified Stock Option Award is incorporated by
reference from our 10-Q report for the quarter ended March 31,
2006.
|
|||
|
10.35 (2)
|
Form
of 2006 Performance-Vesting Restricted (“PVR”) Share Award is incorporated
by reference from our 10-Q report for the quarter ended March 31,
2006.
|
|||
|
10.36 (2)
|
Form
of Director 2006 Non-Qualified Stock Option Award Notice is incorporated
by reference from our 10-Q report for the quarter ended June 30,
2006.
|
|||
|
10.37 (2)
|
Form
of Director 2006 Stock Unit Award Notice is incorporated by reference from
our 10-Q report for the quarter ended June 30, 2006.
|
|||
|
10.38 (2)
|
Form
of 2007 Bonus and Incentive Share Award, issued pursuant to the 2004
Stock-Based Compensation Plan, is incorporated by reference from our 10-Q
report for the quarter ended March 31, 2007.
|
|||
|
10.39 (2)
|
Form
of 2007 Non-Qualified Stock Option and Performance-Vesting Share Unit
Award, issued pursuant to the 2004 Stock-Based Compensation Plan, is
incorporated by reference from our 10-Q report for the quarter ended March
31, 2007.
|
|||
|
10.40 (2)
|
Form
of Director 2007 Deferred Stock Award, issued pursuant to the 2007 Omnibus
Incentive Compensation Plan, is incorporated by reference from our 10-Q
report for the quarter ended June 30, 2007.
|
|||
|
10.41 (2)
|
Form
of 2008 Bonus and Incentive Share Award, issued pursuant to the 2007
Omnibus Incentive Compensation Plan, is incorporated by reference from our
10-Q report for the quarter ended March 31, 2008.
|
|||
F-3
|
Exhibit
Number
|
Description
|
|
10.42 (2)
|
Form
of 2008 Non-Qualified Stock Option and Performance-Vesting Share Unit
Award, issued pursuant to the 2007 Omnibus Incentive Compensation Plan, is
incorporated by reference from our 10-Q report for the quarter ended March
31, 2008.
|
|
10.43 (2)
|
Form
of Director 2008 Deferred Stock Award, issued pursuant to the 2007 Omnibus
Incentive Compensation Plan, is incorporated by reference from our 2008
10-K report.
|
|
10.44 (2)
|
Form
of 2009 Supplemental Long-Term Incentive Award, is incorporated by
reference from our 10-Q report for the quarter ended October 31,
2009.
|
|
10.45
|
Credit
Agreement, dated as of May 17, 2004 among us, certain of our subsidiaries,
the banks and other financial institutions from time to time parties
thereto and PNC Bank, National Association, as Agent is incorporated by
reference from our 8-K report dated May 28, 2004.
|
|
10.46
|
First
Amendment, dated as of May 18, 2005, between us, our direct and indirect
subsidiaries listed on the signature pages thereto, the several banks and
other financial institutions parties thereto, and PNC Bank, National
Association, as Agent for the Banks is incorporated by reference from our
8-K report dated May 25, 2005.
|
|
10.47
|
Third
Amendment, dated as of February 28, 2006, among us and certain of our
direct and indirect subsidiaries listed on the signature pages thereto,
the several banks and other financial institutions parties to the Credit
Agreement (as defined therein), and PNC Bank, National Association, as
Agent for the Banks, is incorporated by reference to Exhibit 10.1 of the
our Current Report on Form 8-K, dated March 3, 2006.
|
|
10.48
|
Multi-Currency
Note Purchase and Private Shelf Agreement, dated as of February 27, 2006,
among us and The Prudential Insurance Company of America, Prudential
Retirement Insurance and Annuity Company, Pruco Life Insurance Company,
Pruco Life Insurance Company of New Jersey, American Skandia Life
Assurance Corporation and Prudential Investment Management, Inc., is
incorporated by reference to Exhibit 10.2 of the Company’s Current Report
on Form 8-K, dated March 3, 2006.
|
|
10.49 (3)
|
Agreement,
effective as of January 1, 2005, between us and The Goodyear Tire &
Rubber Company is incorporated by reference from our 10-Q report for the
quarter ended June 30, 2005.
|
|
10.50 (3)
|
First
Agreement to Amend to Agreement, effective as of July 1, 2008, between us
and The Goodyear Tire & Rubber Company is incorporated by reference
from our 10-Q report for the quarter ended March 31,
2009.
|
|
10.51 (3)
|
Supply
Agreement, dated as of October 1, 2007, between us and Becton, Dickinson
and Company is incorporated by reference from our 2007 10-K
report.
|
|
10.52
|
Distributorship
Agreement, dated January 25, 2007, between Daikyo Seiko, Ltd. and us is
incorporated by reference from our 2006 10-K report.
|
|
10.53 (3)
|
Amended
and Restated Technology Exchange and Cross License Agreement, dated
January 25, 2007, between us and Daikyo Seiko, Ltd. is incorporated by
reference from our 2006 10-K
report.
|
F-4
|
Exhibit
Number
|
Description
|
|
10.54 (3)
|
2006-2010
Worldwide Butyl Polymer Supply/Purchase Agreement, entered into on October
6, 2006 and effective from January 1, 2006 through December 31, 2010,
between us and ExxonMobil Chemical Company is incorporated by reference
from our 2006 10-K report.
|
|
10.55 (2)
|
Amendment
to Letter Agreement, dated as of May 1, 2003, between us and Robert S.
Hargesheimer is incorporated by reference from our 2003 10-K
report.
|
|
10.56 (2)
|
Amendment
#2 to Letter Agreement, dated as of December 19, 2008, between us and
Robert S. Hargesheimer, is incorporated by reference from our 2008 10-K
report.
|
|
10.57 (2)
|
Letter
Agreement dated as of March 30, 2006 between us and Donald E.
Morel, Jr. is incorporated by reference from our 10-Q report for the
quarter ended June 30, 2006.
|
|
10.58
|
Note
Purchase Agreement, dated as of July 28, 2005, among us and each of the
purchasers listed on Schedule A thereto, is incorporated by reference from
our 8-K report dated August 3, 2005.
|
|
10.59
|
Indemnification
agreements between us and each of our directors in the form of Exhibit
10.1 to our Form 8-K report dated January 6, 2009, which is incorporated
by reference.
|
|
12.1
|
Computation
of Ratio of Earnings to Fixed Charges.
|
|
21.
|
Subsidiaries
of the Company.
|
|
23.
|
Consent
of Independent Registered Public Accounting Firm.
|
|
24.
|
Powers
of Attorney.
|
|
31.1
|
Certification
by the Chief Executive Officer Pursuant to Section 302 of the
Sarbanes-Oxley Act of 2002.
|
|
31.2
|
Certification
by the Chief Financial Officer Pursuant to Section 302 of the
Sarbanes-Oxley Act of 2002.
|
|
32.1
|
Certificatio
n by the Chief Executive Officer Pursuant to 18 U.S.C. Section 1350, as
Adopted Pursuant to Section 906 of the Sarbanes-Oxley Act of
2002.
|
|
32.2
|
Certification
by Chief Financial Officer Pursuant to 18 U.S.C. Section 1350, as Adopted
Pursuant to Section 906 of the Sarbanes-Oxley Act of
2002.
|
|
(1)
|
We
agree to furnish to the SEC, upon request, a copy of each instrument with
respect to issuances of long-term debt of the Company and its
subsidiaries.
|
|
(2)
|
Management
compensatory plan.
|
|
(3)
|
Certain
portions of this exhibit have been omitted pursuant to a confidential
treatment request submitted to the
SEC.
|
F-5