Attached files
| file | filename |
|---|---|
| 8-K - FORM 8-K - Jones Lang LaSalle Income Property Trust, Inc. | d389200d8k.htm |
| EX-99.1 - PRESS RELEASE - Jones Lang LaSalle Income Property Trust, Inc. | d389200dex991.htm |
 Supplemental Information
Second Quarter
Earnings Call
2012
Exhibit 99.2 |
 Market & Financial Overview |
 As of
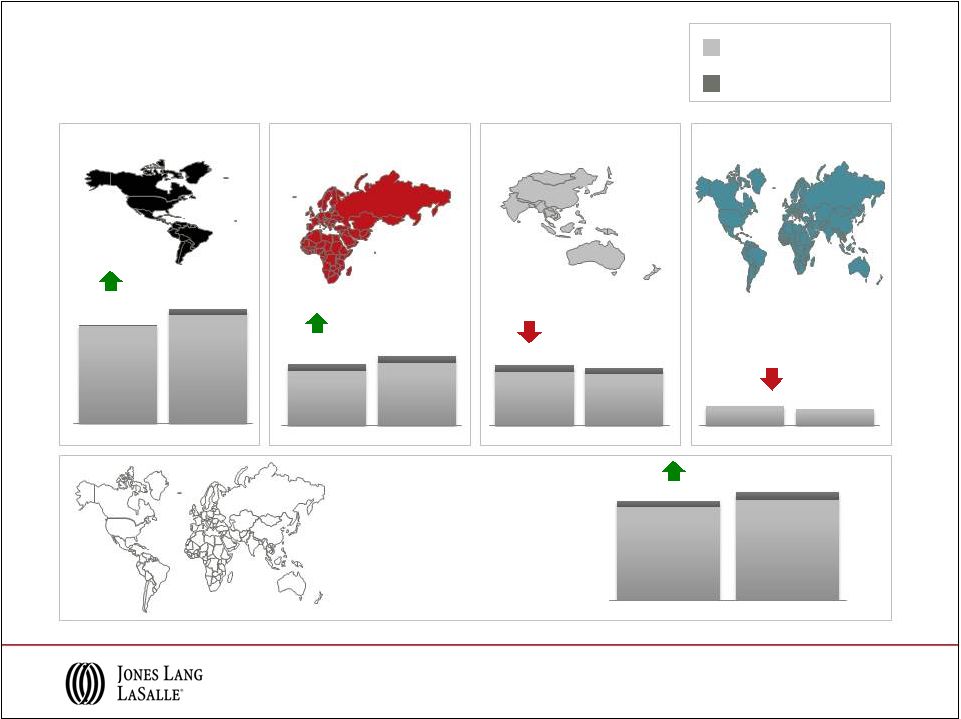
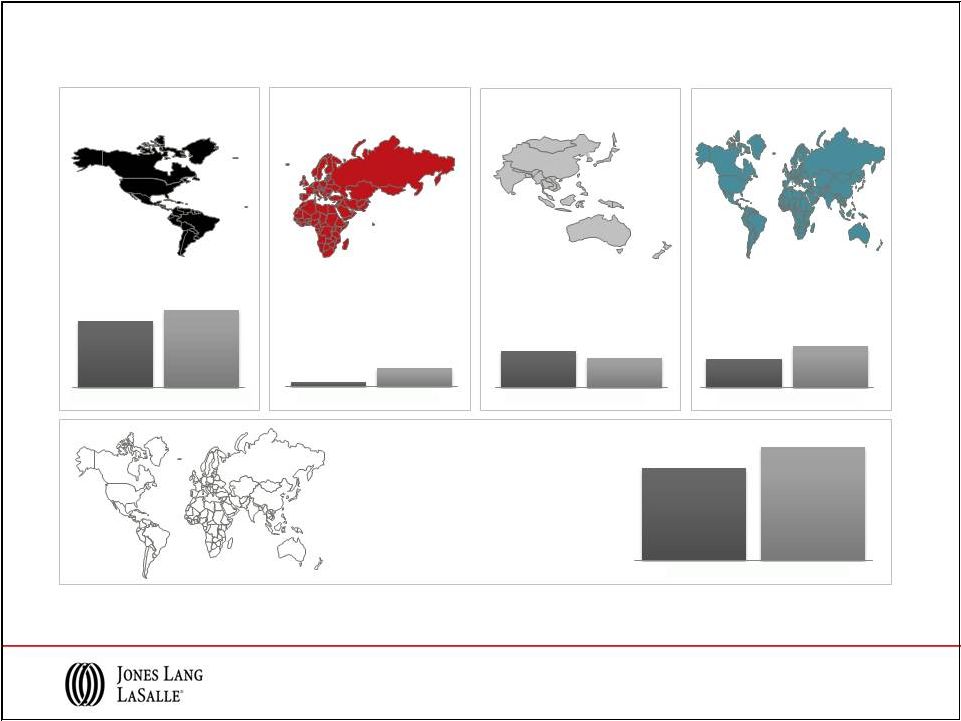
Q2 2012 The Jones Lang LaSalle Property Clocks
Notional capital values based on rents and yields for Grade A space in CBD or
equivalent. In local currency. 3
Americas
EMEA
Asia Pacific
Prime Offices -
Capital Value Clock, Q2 2011 v Q2 2012
Capital Value
growth slowing
Capital Value
growth
accelerating
Capital Values
bottoming out
Capital Values
falling
Q2 2011
Atlanta, Dallas
Chicago, Toronto
Beijing
Sao Paulo, Washington DC
Amsterdam
New York, Moscow
Singapore
San
Francisco
Los
Angeles
Berlin,
Stockholm Shanghai
Hong Kong
Brussels,
Seoul
Madrid,
Tokyo
Paris,
Sydney Mumbai
London
Frankfurt,
Milan Shanghai, Hong
Kong, Paris
Capital Value
growth slowing
Capital Value
growth
accelerating
Capital Values
bottoming out
Capital Values
falling
Q2 2012
Tokyo
Mumbai, Mexico
City
Sydney
Beijing
Singapore, Amsterdam,
Chicago, Washington
DC
Berlin,
Toronto
Madrid
Frankfurt
Moscow
Milan,
Sao
Paulo
London
New
York
Los
Angeles,
San
Francisco
Atlanta
Dallas
Seoul, Brussels, Detroit
Detroit, Mexico
City
SM
Stockholm |
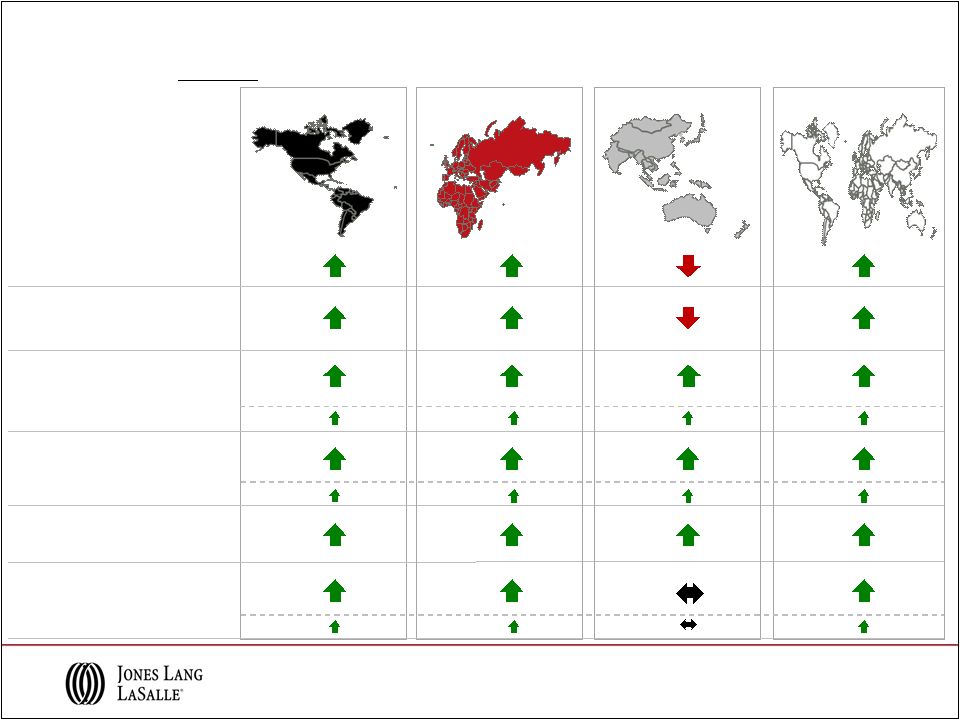
 Prime Offices –
Rental Clock, Q2 2011 v Q2 2012
Q2 2012
As of Q2 2012
The Jones Lang LaSalle Property Clocks
Based
on
rents
for
Grade
A
space
in
CBD
or
equivalent.
In
local
currency.
Q2 2011
4
Americas
EMEA
Asia Pacific
Rental Value
growth slowing
Rental Value
growth
accelerating
Rental Values
bottoming out
Rental Values
falling
Rental Value
growth slowing
Rental Value
growth
accelerating
Rental Values
bottoming out
Rental Values
falling
Dubai
Dallas
Frankfurt, Milan
Johannesburg
Detroit
San
Francisco
New
York,
Beijing Atlanta, Chicago
Rome, Tokyo
Los
Angeles, Brussels
Sao
Paulo,
Moscow
Mumbai
Mexico
City
Hong
Kong
Singapore
Shanghai
Sydney, Berlin, Paris
Seoul
London
Madrid
Amsterdam
Washington
DC
Stockholm
Toronto
Singapore
Hong
Kong
Seoul, Tokyo, Los
Angeles
Dallas
Beijing
Shanghai
Dubai
Madrid
Brussels, Detroit
Frankfurt, Milan, Rome
Chicago,
Atlanta Johannesburg,
Stockholm, Toronto
Berlin, Moscow
London, Sao
Paulo
Paris
Amsterdam
San
Francisco
New
York,
Mexico
City,
Mumbai Washington
DC
Sydney
SM |
 Q2 Selected Business Wins and Expansions
5
Americas
EMEA
Asia Pacific
Global
-
Bank of America –
39M sf
-
Education Management Corporation –
6.6M sf
-
EuroHypo
Portfolio,
U.S.
–
$760M
-
150
N.
Michigan,
Chicago
–
$102M
-
Sitex –
STRS Ohio JV, U.S. –
$140M
-
Hotel Lola, New York –
$116M
-
601
Lexington
Ave.,
New
York
–
490K
sf
-
2000
Duke
Street,
Alexandria,
Va.
–
208K
sf
-
Blackstone
Portfolio,
London
–
£415M
-
The
Rock,
Amsterdam
–
€132M
-
SEGRO
Industrial
Portfolio,
UK
–
£204M
-
AXA
Portfolio,
Germany
–
990K
sf
-
Beisheim Center, Berlin –
754K sf
-
Kievit Building, Antwerp –
118K sf
-
Kilcarberry, Dublin –
240K sf
-
Chiswick Park, UK –
215K sf
-
Pertamina, Indonesia –
2.8M sf
-
Centro
Retail
Trust,
Australia
–
AUD
690M
-
Hougang Plaza, Singapore –
SGD 119M
-
Movenpick
Phuket,
Thailand
–
$93M
-
Mirae
Asset
Tower,
Shanghai
–
932K
sf
-
Siam Commercial Bank, Bangkok –
4.4M sf
-
Johnson
Controls,
Hong
Kong
–
55K
sf
-
New
Zealand
Shopping
Centres
–
330K
sf
-
Procter & Gamble –
60 countries
-
BBVA Compass –
45M sf
-
Logica –
6M sf |
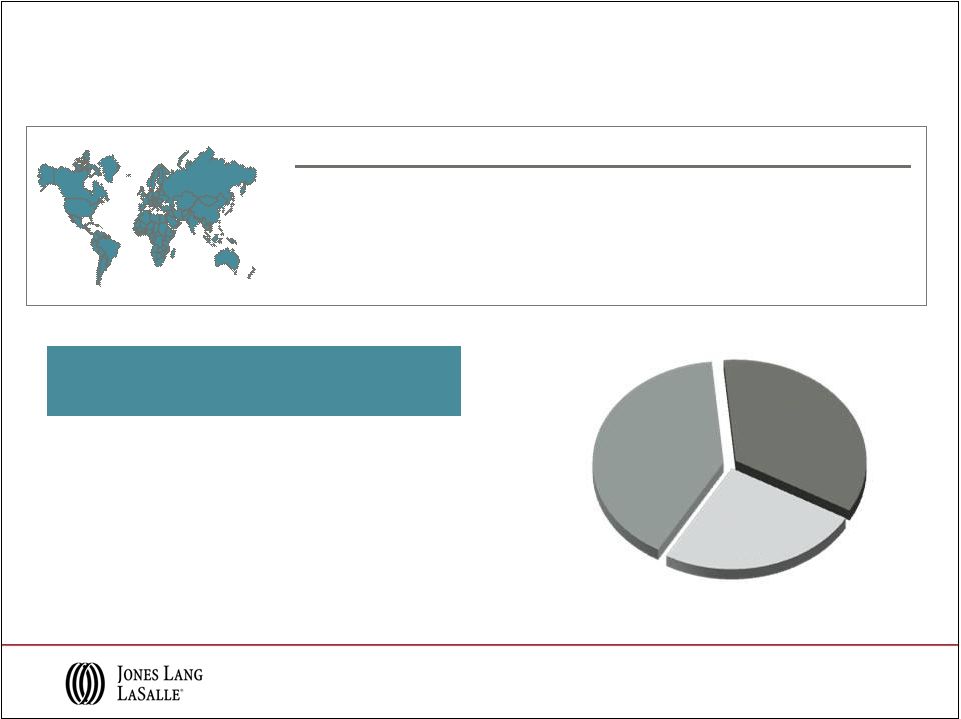
 ($ in
billions) Global Capital Flows for Investment Sales
* EMEA: In US$ terms, unchanged in Euro terms.
Source: Jones Lang LaSalle, July 2012
Direct Commercial Real Estate Investment, 2005-2012
2012 volumes expected to be approximately $400 billion, broadly in line with robust
2011 6
0
50
100
150
200
250
300
350
2005
2006
2007
2008
2009
2010
2011
2012 Projection
Q2 projection updates:
Americas:
down
10%
from
previous
forecast
EMEA:
unchanged
Asia
Pacific:
unchanged
Americas
EMEA
Asia Pacific |
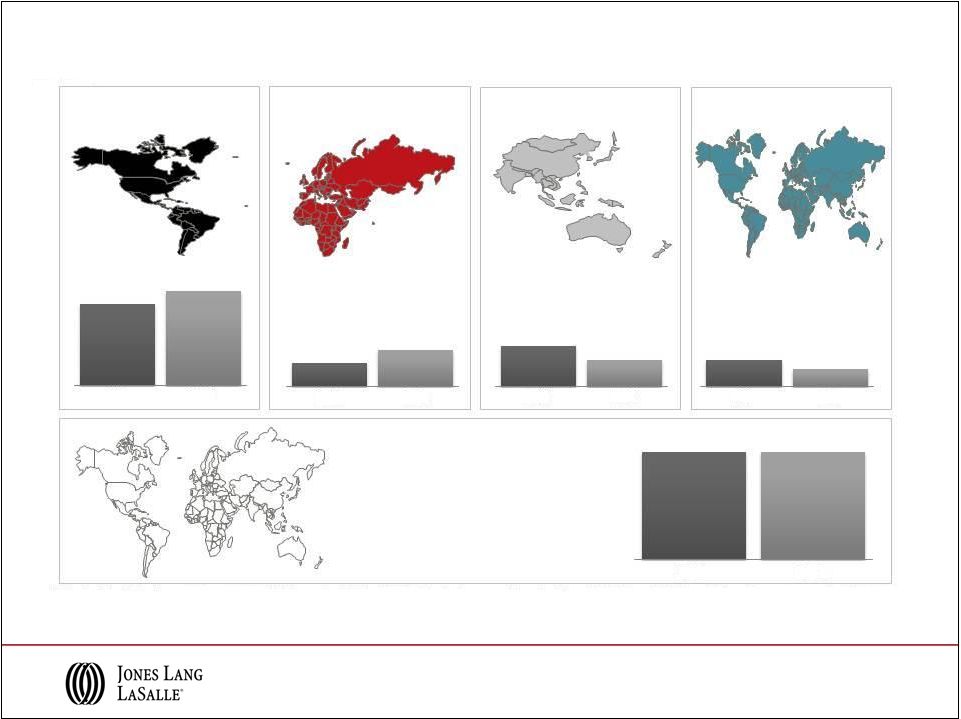
 +
10-20% Capital Values
Rental Values
+ 5-10%
+ 0-5%
-
0-5%
-
5-10%
Boston, Toronto
Shanghai, Tokyo, Moscow
Frankfurt, Stockholm, Paris*, London*
Chicago, Los Angeles, New York*
Sydney, Mumbai, Sao Paulo
+ 20%
Moscow, Toronto, Mexico City
Shanghai, Tokyo
Stockholm, Sao Paulo
Boston , Los Angeles
Frankfurt, Paris*, London*
Hong Kong, Sydney, Mumbai
Provisional. *New York –
Midtown, London –
West End, Paris -
CBD. Nominal rates in local currency.
Source: Jones Lang LaSalle, July 2012
-
10-20%
Madrid, Dubai
Washington DC, Brussels
New York*, Chicago
Washington DC, Brussels
Dubai, Singapore
Hong Kong, Singapore
Beijing, San Francisco
Madrid
Beijing, San Francisco
Mexico City
7
Prime Offices –
Projected Changes in Values, 2012 |
 Financial Information |
 9
Q2 2012 Revenue Performance
Note: Equity earnings of $4.1M in 2011 are included in segment results, however, are
excluded from Consolidated totals. There were no equity earnings in the
second quarter 2012. Year-over-year increases shown “fee”-based have been calculated using fee
revenue, which excludes gross contract costs.
Consolidated
($ in millions; % change in USD)
17% (12% fee)
14% (14% fee)
5% (3% fee)
14%
9% (7% fee)
$408.1
$348.4
$249.2
$218.0
$204.6
$214.5
$921.3
$845.3
Fee revenue
Gross contract costs
Americas
EMEA
Asia Pacific
LIM
$346.7
$386.6
$189.1
$183.6
$68.6
$59.3
$195.1
$222.6
$795.3
$852.2
2011
2012
2011
2012
2011
2012
2011
2012
2011
2012 |
 10
YTD 2012 Revenue Performance
Note: Equity earnings of $2.2M and $11.8M in 2011 and 2012, respectively, are included
in segment results, however, are excluded from Consolidated totals.
Year-over-year increases shown “fee”-based have been calculated using fee revenue, which
excludes gross contract costs.
Americas
EMEA
Asia Pacific
LIM
Consolidated
($ in millions; % change in USD)
19% (13% fee)
20% (19% fee)
3% (5% fee)
4%
13% (11% fee)
$754.4
$636.5
$462.4
$386.1
$391.0
$379.9
$1,734.7
$1,533.1
Fee revenue
Gross contract costs
2011
2012
2011
2012
2011
2012
2011
2012
2011
2012
$633.1
$715.7
$342.6
$409.4
$329.9
$345.1
$132.8
$138.6
$1,436.2
$1,597.1 |
 11
Q2 2012 Real Estate Services Revenue
Asia Pacific
($ in millions; % change in USD
over June QTD 2011)
Americas
EMEA
Leasing
Capital Markets &
Hotels
Property & Facility
Management
Fee Revenue
Project & Development
Services
Fee Revenue
Advisory, Consulting &
Other
Total RES Operating
Revenue
Fee Revenue
$187.0
$42.1
$107.4
$45.1
$26.8
9%
34%
38%
11%
8%
18%
$66.4
$49.8
$37.9
$52.4
$42.8
$249.3
10%
31%
10%
13%
9%
14%
$45.6
$23.8
$93.1
$19.2
$22.8
$204.5
7%
30%
5%
5%
1%
5%
$299.0
$115.7
$238.4
$116.7
$92.4
$862.2
6%
12%
19%
9%
7%
11%
Total RES
$86.1
13%
$75.0
$37.9
$199.0
10%
9%
11%
$44.9
$25.8
$87.0
11%
11%
10%
$386.9
12%
$183.5
$222.7
$793.1
14%
3%
8%
Note: Segment and Consolidated Real Estate Services (“RES”) operating
revenue exclude Equity earnings (losses). Fee revenue presentation of
Property & Facility Management, Project & Development Services and Total RES Operating Revenue excludes gross
contract costs.
10%
$408.4
$16.3 |
 12
Q2 2012 Real Estate Services Revenue
Asia Pacific
($ in millions; % change in local currency
over June QTD 2011)
Americas
EMEA
Leasing
Capital Markets &
Hotels
Property & Facility
Management
Fee Revenue
Project & Development
Services
Fee Revenue
Advisory, Consulting &
Other
Total RES Operating
Revenue
Fee Revenue
$187.0
$42.1
$107.4
$45.1
$26.8
$408.4
10%
37%
40%
12%
8%
19%
$66.4
$49.8
$37.9
$52.4
$42.8
$249.3
20%
39%
18%
25%
18%
24%
$45.6
$23.8
$93.1
$19.2
$22.8
$204.5
3%
27%
9%
2%
4%
1%
$299.0
$115.7
$238.4
$116.7
$92.4
$862.2
10%
17%
22%
16%
11%
15%
Total RES
$86.1
15%
$75.0
$37.9
$199.0
18%
12%
15%
$44.9
12%
$16.3
$25.8
$87.0
20%
18%
15%
$386.9
13%
$183.5
$222.7
$793.1
23%
1%
12%
Note: Segment and Consolidated Real Estate Services (“RES”) operating
revenue exclude Equity earnings (losses). Fee revenue presentation of
Property & Facility Management, Project & Development Services and Total RES Operating Revenue excludes gross
contract costs. |
 LaSalle Investment Management
Note: AUM data reported on a one-quarter lag.
H1 2012 Highlights
AUM by Fund type
($ in billions)
13
Product
Assets Under
Management
($ in billions)
Average
Performance
Private Equity
U.K.
$12.8
Above benchmark
Continental Europe
$4.4
Return: >1x equity
North America
$11.2
Above benchmark
Asia Pacific
$6.8
Return: >1x equity
Public Securities
$11.8
Above benchmark
Total Q2 2012 AUM
$47.0 B
•
Operating income margin of 26.8%, including equity earnings and
incentive fees
•
New fundraising activities in progress as vintage funds mature
•
$1.3 billion of capital invested year to date; good momentum with
strong pipelines versus 2011
Separate
Accounts
$18.9
Fund
Management
$16.3
Public
Securities
$11.8 |
 Solid Cash Flows and Balance Sheet Position
•
Healthy position entering
historically strong
second half
•
Low debt cost: H1 2012
net interest expense of
$15 million vs. $18
million in H1 2011
•
Investment grade
balance sheet; Baa2 /
BBB-
(Stable)
H1 2012 Highlights
14
2012
2011
Cash Flows
H1
H1
H2
Cash (used in) from Operations
($123)
($136)
$348
Primary Uses
Capital Expenses
($32)
($36)
($56)
Acquisitions & Deferred
Payment
Obligations
($46)
($235)
($181)
Co-Investment
$21
$0
($46)
Dividends
($9)
($7)
($7)
Net Cash Outflows
($66)
($278)
($290)
Net Share Activity & Other Financing
$9
($6)
($9)
Net Bank Debt (Borrowings) Repayments
($180)
($420)
$49
Balance Sheet
Cash
$115
$96
$184
Short Term Borrowings
$20
$45
$65
Credit Facility
$619
$444
$463
Net Bank Debt
$524
$393
$344
Deferred Business Obligations
$278
$439
$299
Total Net Debt
$802
$832
$643
($ in millions) |
 Appendix |
 Fee Revenue / Expense Reconciliation
•
Reimbursable vendor, subcontractor and out-of-pocket costs reported as revenue
and expense in JLL financial statements have been steadily increasing
•
Margins diluted as gross accounting requirements increase revenue and costs without
corresponding profit •
Business managed on a “fee”
basis to focus on margin expansion in the base business
16
($ in millions)
2012
2011
2012
2011
Consolidated Revenue
921.3
$
845.3
$
1,734.7
$
1,533.1
$
Consolidated Operating Expenses
846.7
773.6
1,636.4
1,449.4
Adjusted Operating Income Margin
8.3%
8.7%
5.9%
5.6%
Gross Contract Costs:
Property & Facility Management
21.3
1.7
38.4
3.3
Project & Development Services
0.2
-
0.3
0.1
Total Gross Contract Costs
21.5
1.7
38.7
3.4
Property & Facility Management
-
-
-
-
Project & Development Services
26.6
22.9
53.0
43.5
Total Gross Contract Costs
26.6
22.9
53.0
43.5
Property & Facility Management
18.1
19.9
40.3
38.6
Project & Development Services
2.9
5.5
5.6
11.4
Total Gross Contract Costs
21.0
25.4
45.9
50.0
Consolidated Fee Revenue
852.2
$
795.3
$
1,597.1
$
1,436.2
$
Consolidated Fee-based Operating Expenses
777.6
$
723.6
$
1,498.8
$
1,352.5
$
Adjusted Operating Income Margin ("fee"-based)
9.0%
9.2%
6.4%
5.9%
YTD
Asia Pacific
Americas
EMEA
Q2
Note: Consolidated revenue and fee revenue exclude equity earnings (losses).
Restructuring and acquisition charges are excluded from operating
expenses. Restructuring and acquisition charges as well as intangible amortization related to the King
Sturge acquisition are excluded from operating expenses when calculating adjusted
operating income margin. |
 17
Q2 2012 Adjusted EBITDA* Performance
Americas
EMEA
Asia Pacific
LIM
Consolidated
* Refer
to
slide
22
for
Reconciliation
of
GAAP
Net
Income
to
Adjusted
EBITDA
for
the
three
months
ended
June
30,
2011,
and
2012,
for
details
relative
to
these
adjusted
EBITDA
calculations. Segment EBITDA is calculated by adding the segment’s depreciation
and amortization to its reported operating income, which excludes restructuring and acquisition
charges. Consolidated adjusted EBITDA is the sum of the EBITDA of the four segments
less net income attributable to non-controlling interest. ($ in
millions) $42.0
$48.9
2011
2012
$93.9
$94.1
2011
2012
$24.7
$16.5
2011
2012
$16.4
$10.6
2011
2012
$12.0
$18.6
2011
2012 |
 18
YTD 2012 Adjusted EBITDA* Performance
Americas
EMEA
Asia Pacific
LIM
Consolidated
* Refer to slide 22 for Reconciliation of GAAP Net Income to Adjusted EBITDA for the
six months ended June 30, 2011, and 2012, for details relative to these adjusted EBITDA
calculations. Segment EBITDA is calculated by adding the segment’s depreciation
and amortization to its reported operating income, which excludes restructuring and acquisition
charges. Consolidated adjusted EBITDA is the sum of the EBITDA of the four segments
less net income attributable to non-controlling interest. ($ in
millions) $60.6
$70.6
2011
2012
$122.2
148.9
2011
2012
$3.8
$14.3
2011
2012
$33.2
$26.6
2011
2012
$26.0
$38.1
2011
2012 |
 19
YTD 2012 Real Estate Services Revenue
Asia Pacific
($ in millions; % change in USD
over June YTD 2011)
Americas
EMEA
Leasing
Capital Markets &
Hotels
Property & Facility
Management
Fee Revenue
Project & Development
Services
Fee Revenue
Advisory, Consulting &
Other
Total RES Operating
Revenue
Fee Revenue
$336.6
$70.0
$213.6
$84.7
$49.7
$754.6
7%
37%
43%
9%
27%
19%
$113.7
$89.1
$75.6
$103.0
$81.1
$462.5
16%
34%
16%
22%
12%
20%
$78.9
$45.4
$189.4
$36.6
$40.6
$390.9
0%
12%
10%
4%
5%
3%
$529.2
$204.5
$478.6
$224.3
$171.4
$1,608.0
8%
21%
24%
12%
14%
15%
Total RES
$175.2
20%
$149.1
$75.6
$399.9
16%
11%
16%
$84.4
$31.0
$50.0
$165.4
22%
15%
13%
$715.9
14%
$345.0
$409.5
$1,470.4
19%
5%
11%
Note: Segment and Consolidated Real Estate Services (“RES”) operating
revenue exclude Equity earnings (losses). Fee revenue presentation of
Property & Facility Management, Project & Development Services and Total RES Operating Revenue excludes gross
contract costs.
8% |
 20
YTD 2012 Real Estate Services Revenue
Asia Pacific
($ in millions; % change in local currency
over June YTD 2011)
Americas
EMEA
Leasing
Capital Markets &
Hotels
Property & Facility
Management
Fee Revenue
Project & Development
Services
Fee Revenue
Advisory, Consulting &
Other
Total RES Operating
Revenue
Fee Revenue
$336.6
$70.0
$213.6
$84.7
$49.7
$754.6
7%
39%
44%
10%
24%
20%
$113.7
$89.1
$75.6
$103.0
$81.1
$462.5
24%
40%
22%
30%
18%
27%
$78.9
$45.4
$189.4
$36.6
$40.6
$390.9
3%
11%
11%
0%
5%
5%
$529.2
$204.5
$478.6
$224.3
$171.4
$1,608.0
10%
24%
26%
16%
16%
18%
Total RES
$175.2
21%
$149.1
$75.6
$399.9
22%
12%
18%
$84.4
$31.0
$50.0
$165.4
29%
19%
17%
$715.9
14%
$345.0
$409.5
$1,470.4
26%
6%
14%
Note: Segment and Consolidated Real Estate Services (“RES”) operating
revenue exclude Equity earnings (losses). Fee revenue presentation of
Property & Facility Management, Project & Development Services and Total RES Operating Revenue excludes gross
contract costs.
9% |
 21
Reconciliation of GAAP Net Income to Adjusted Net Income
Three Months Ended
June 30,
Six Months Ended
June 30,
($ in millions)
2012
2011
2012
2011
GAAP Net income attributable to common
shareholders
$ 37.2
$ 43.9
$ 51.2
$ 45.4
Shares (in 000s)
44,847
44,473
44,726
44,391
GAAP earnings per share
$ 0.83
$ 0.99
$ 1.14
$ 1.02
GAAP Net income attributable to common
shareholders
$ 37.2
$ 43.9
$ 51.2
$ 45.4
Restructuring and acquisition charges, net
12.4
4.6
19.1
4.6
Intangible amortization, net
1.2
1.2
2.8
1.2
Adjusted net income
$ 50.8
$ 49.7
$ 73.1
$ 51.2
Shares (in 000s)
44,847
44,473
44,726
44,391
Adjusted earnings per share
$ 1.13
$ 1.12
$ 1.63
$ 1.15
and Earnings per Share |
 22
Reconciliation of GAAP Net Income to Adjusted EBITDA
Three Months Ended
June 30,
Six Months Ended
June 30,
($ in millions)
2012
2011
2012
2011
GAAP Net income attributable to
common shareholders
$ 37.2
$43.9
$ 51.2
$ 45.4
Interest expense, net of interest
income
7.5
9.6
14.9
17.5
Provision for income taxes
12.8
15.0
17.7
15.5
Depreciation and amortization
20.0
19.3
39.6
37.7
EBITDA
$ 77.5
$ 87.8
$ 123.4
$ 116.1
Restructuring and acquisition
charges
16.6
6.1
25.5
6.1
Adjusted EBITDA
$ 94.1
$ 93.9
$ 149.8
$ 122.2
|