Attached files
| file | filename |
|---|---|
| 8-K - HANMI FINANCIAL CORPORATION 8-K - HANMI FINANCIAL CORP | a50356029.htm |
Exhibit 99.1
13th Annual Investor Conference August 1, 2012 Hanmi Bank Keefe, Bruyette & Woods Specialists in Financial Services
Please read the following information before reviewing the information contained herein: This presentation contains forward‐looking statements, which are included in accordance with the “safe harbor” provisions of the Private Securities Litigation Reform Act of 1995. In some cases, you can identify forward-looking statements by terminology such as “may,” “will,” “should,” “could,” “expects,” “plans,” “intends,” “anticipates,” “believes,” “estimates,” “predicts,” “potential,” or “continue,” or the negative of such terms and other comparable terminology. Although we believe that the expectations reflected in the forward-looking statements are reasonable, we cannot guarantee future results, levels of activity, performance or achievements. All statements other than statements of historical fact are “forward –looking statements” for purposes of federal and state securities laws, including, but not limited to, statements about anticipated future operating and financial performance, financial position and liquidity, business strategies, regulatory and competitive outlook, investment and expenditure plans, capital and financing needs and availability, plans and objectives of management for future operations, developments regarding our capital plans and other similar forecasts and statements of expectation and statements of assumption underlying any of the foregoing. These statements involve known and unknown risks, uncertainties and other factors that may cause our actual results, levels of activity, performance or achievements to differ from those expressed or implied by the forward-looking statement. These factors include the following: failure to maintain adequate levels of capital and liquidity to support our operations; the effect of regulatory orders we have entered into and potential future supervisory action against us or Hanmi Bank; general economic and business conditions internationally, nationally and in those areas in which we operate; volatility and deterioration in the credit and equity markets; changes in consumer spending, borrowing and savings habits; availability of capital from private and government sources; demographic changes; competition for loans and deposits and failure to attract or retain loans and deposits; fluctuations in interest rates and a decline in the level of our interest rate spread; risks of natural disasters related to our real estate portfolio; risks associated with Small Business Administration loans; failure to attract or retain key employees; changes in governmental regulation, including, but not limited to, any increase in FDIC insurance premiums; ability to receive regulatory approval for Hanmi Bank to declare dividends to Hanmi Financial; ability to recapture DTA; adequacy of our allowance for loan losses; credit quality and the effect of credit quality on our provision for credit losses and allowance for loan losses; changes in the financial performance and/or condition of our borrowers and the ability of our borrowers to perform under the terms of their loans and other terms of credit agreements; our ability to control expenses; and changes in securities markets. In addition, we set forth certain risks in our reports filed with the U.S. Securities and Exchange Commission (“SEC”), including, in Item 1A of our Form 10K for the year ended December 31, 2011, our quarterly reports on Form 10Q, and in current and periodic reports that we will file with the SEC hereafter, which could cause actual results to differ from those projected. We undertake no obligation to update such forward-looking statements except as required by law. Forward Looking Statement disclaimer HAFC 2
Vision At Hanmi Bank, we want to be regarded as the "quality market leader in the banking industry, thereby becoming the first choice of employees, customers and shareholders." Established in 1982, Hanmi Bank was founded to serve the Korean‐American Community. Since then, we have grown into one of the largest, premier Korean‐ American Banks in the United States. "THE Bank of Choice" 3
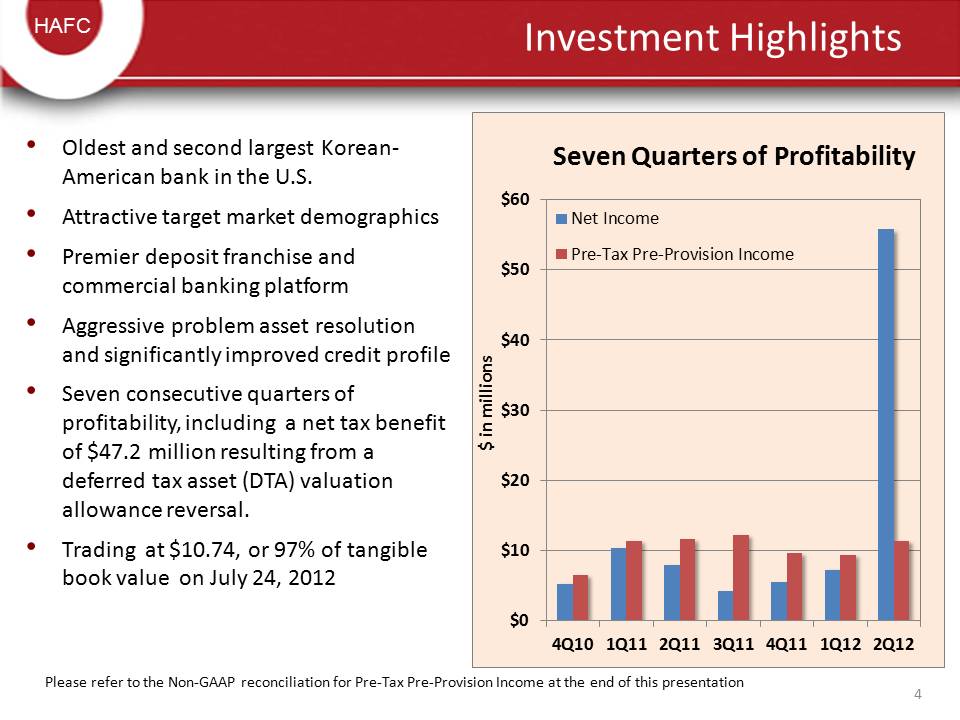
HAFC Investment Highlights • Oldest and second largest Korean‐ American bank in the U.S. • Attractive target market demographics • Premier deposit franchise and commercial banking platform • Aggressive problem asset resolution and significantly improved credit profile • Seven consecutive quarters of profitability, including a net tax benefit of $47.2 million resulting from a deferred tax asset (DTA) valuation allowance reversal. • Trading at $10.74, or 97% of tangible book value on July 24, 2012 $0 $10 $20 $30 $40 $50 $60 4Q10 1Q11 2Q11 3Q11 4Q11 1Q12 2Q12 $ in millions Seven Quarters of Profitability Net Income Pre‐Tax Pre‐Provision Income Please refer to the Non‐GAAP reconciliation for Pre‐Tax Pre‐Provision Income at the end of this presentation 4
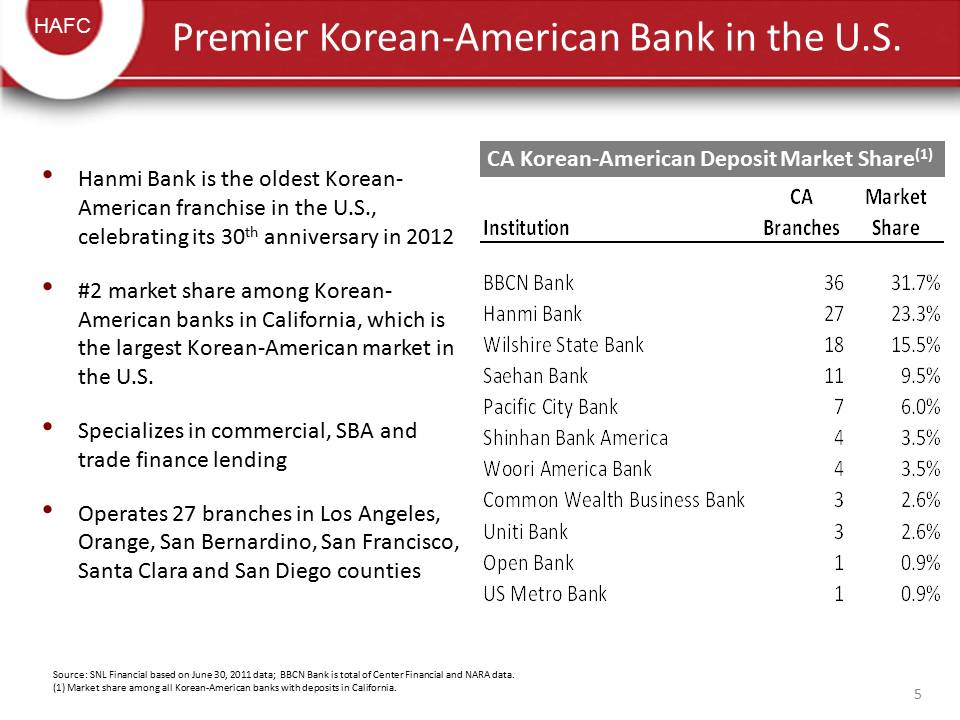
HAFC Premier Korean‐American Bank in the U.S. • Hanmi Bank is the oldest Korean‐ American franchise in the U.S., celebrating its 30th anniversary in 2012 • #2 market share among Korean‐ American banks in California, which is the largest Korean‐American market in the U.S. • Specializes in commercial, SBA and trade finance lending • Operates 27 branches in Los Angeles, Orange, San Bernardino, San Francisco, Santa Clara and San Diego counties CA Korean‐American Deposit Market Share(1) Source: SNL Financial based on June 30, 2011 data; BBCN Bank is total of Center Financial and NARA data. (1) Market share among all Korean‐American banks with deposits in California. CA Market Institution Branches Share BBCN Bank 36 31.7% Hanmi Bank 27 23.3% Wilshire State Bank 18 15.5% Saehan Bank 11 9.5% Pacific City Bank 7 6.0% Shinhan Bank America 4 3.5% Woori America Bank 4 3.5% Common Wealth Business Bank 3 2.6% Uniti Bank 3 2.6% Open Bank 1 0.9% US Metro Bank 1 0.9% 5
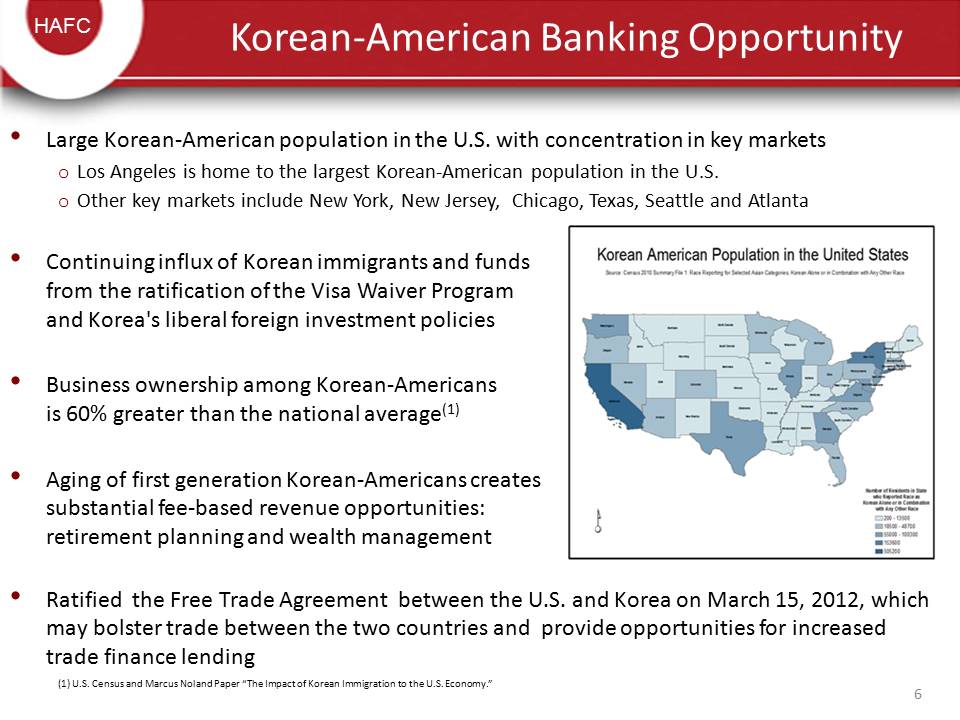
HAFC Korean‐American Banking Opportunity • Large Korean‐American population in the U.S. with concentration in key markets o Los Angeles is home to the largest Korean‐American population in the U.S. o Other key markets include New York, New Jersey, Chicago, Texas, Seattle and Atlanta • Continuing influx of Korean immigrants and funds from the ratification of the Visa Waiver Program and Korea's liberal foreign investment policies • Business ownership among Korean‐Americans is 60% greater than the national average(1) • Aging of first generation Korean‐Americans creates substantial fee‐based revenue opportunities: retirement planning and wealth management • Ratified the Free Trade Agreement between the U.S. and Korea on March 15, 2012, which may bolster trade between the two countries and provide opportunities for increased trade finance lending (1) U.S. Census and Marcus Noland Paper “The Impact of Korean Immigration to the U.S. Economy.” 6
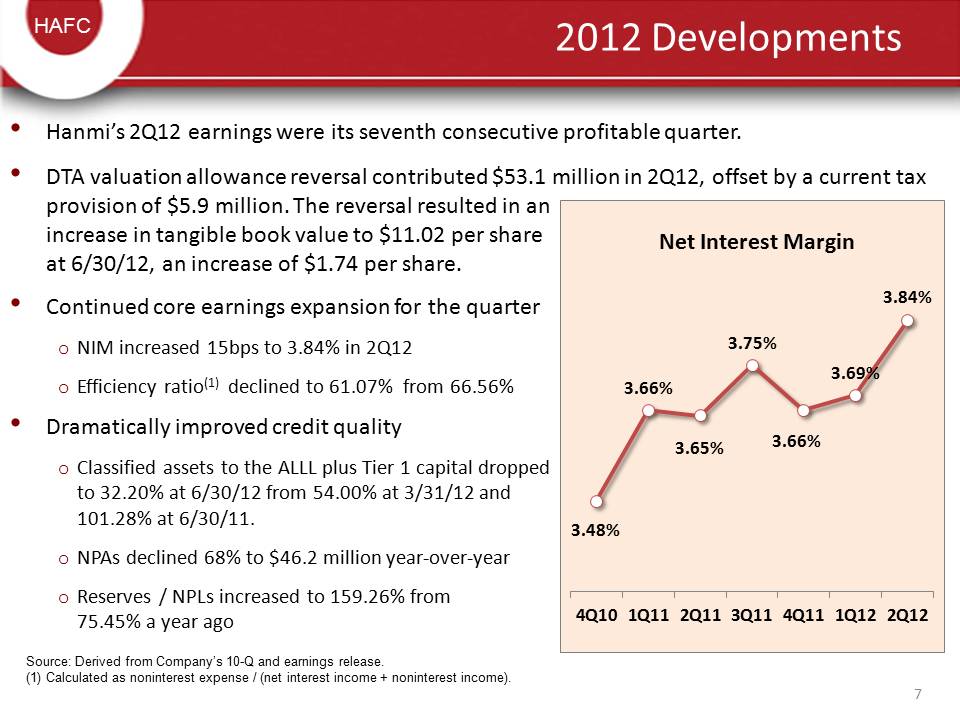
HAFC 2012 Developments • Hanmi’s 2Q12 earnings were its seventh consecutive profitable quarter. • DTA valuation allowance reversal contributed $53.1 million in 2Q12, offset by a current tax provision of $5.9 million. The reversal resulted in an increase in tangible book value to $11.02 per share at 6/30/12, an increase of $1.74 per share. • Continued core earnings expansion for the quarter o NIM increased 15bps to 3.84% in 2Q12 o Efficiency ratio(1) declined to 61.07% from 66.56% • Dramatically improved credit quality o Classified assets to the ALLL plus Tier 1 capital dropped to 32.20% at 6/30/12 from 54.00% at 3/31/12 and 101.28% at 6/30/11. o NPAs declined 68% to $46.2 million year‐over‐year o Reserves / NPLs increased to 159.26% from 75.45% a year ago Source: Derived from Company’s 10-Q and earnings release. (1) Calculated as noninterest expense / (net interest income + noninterest income). 3.48% 3.66% 3.65% 3.75% 3.66% 3.69% 3.84% 4Q10 1Q11 2Q11 3Q11 4Q11 1Q12 2Q12 Net Interest Margin 7
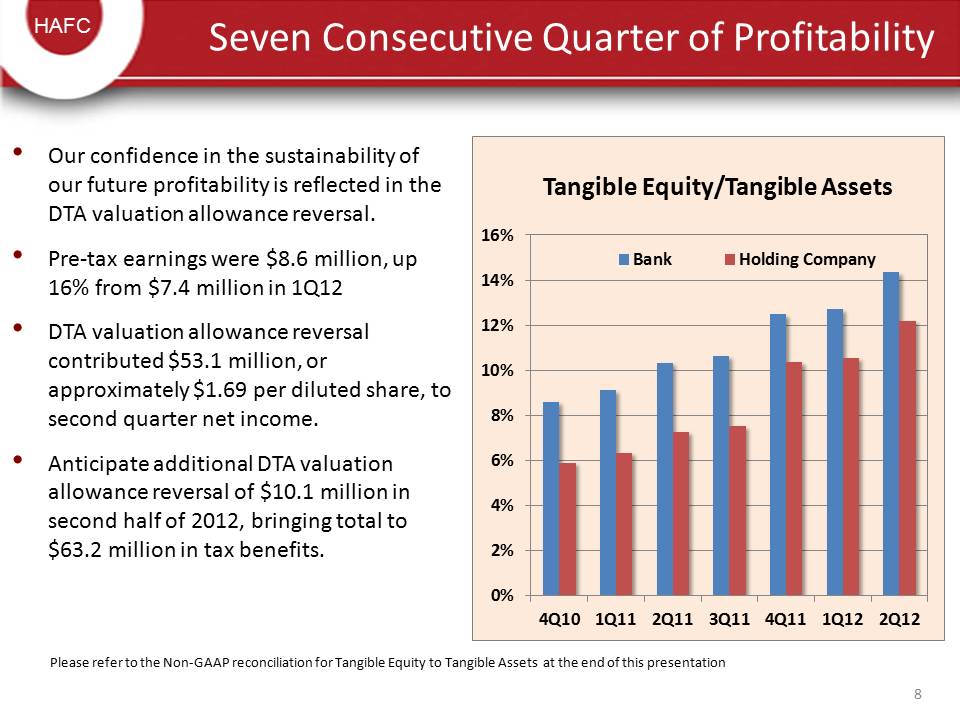
HAFC • Our confidence in the sustainability of our future profitability is reflected in the DTA valuation allowance reversal. • Pre‐tax earnings were $8.6 million, up 16% from $7.4 million in 1Q12 • DTA valuation allowance reversal contributed $53.1 million, or approximately $1.69 per diluted share, to second quarter net income. • Anticipate additional DTA valuation allowance reversal of $10.1 million in second half of 2012, bringing total to $63.2 million in tax benefits. Seven Consecutive Quarter of Profitability 0% 2% 4% 6% 8% 10% 12% 14% 16% 4Q10 1Q11 2Q11 3Q11 4Q11 1Q12 2Q12 Tangible Equity/Tangible Assets Bank Holding Company Please refer to the Non‐GAAP reconciliation for Tangible Equity to Tangible Assets at the end of this presentation 8
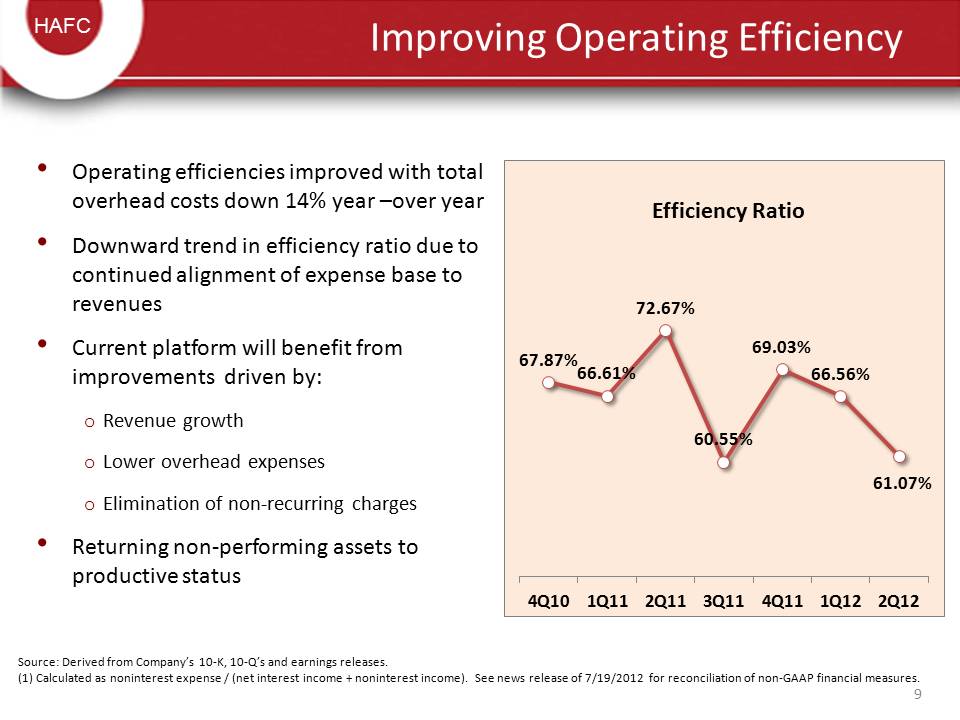
HAFC Improving Operating Efficiency Source: Derived from Company’s 10‐K, 10‐Q’s and earnings releases. (1) Calculated as noninterest expense / (net interest income + noninterest income). See news release of 7/19/2012 for reconciliation of non‐GAAP financial measures. 9 • Operating efficiencies improved with total overhead costs down 14% year –over year • Downward trend in efficiency ratio due to continued alignment of expense base to revenues • Current platform will benefit from improvements driven by: o Revenue growth o Lower overhead expenses o Elimination of non‐recurring charges • Returning non‐performing assets to productive status 67.87% 66.61% 72.67% 60.55% 69.03% 66.56% 61.07% 4Q10 1Q11 2Q11 3Q11 4Q11 1Q12 2Q12 Efficiency Ratio
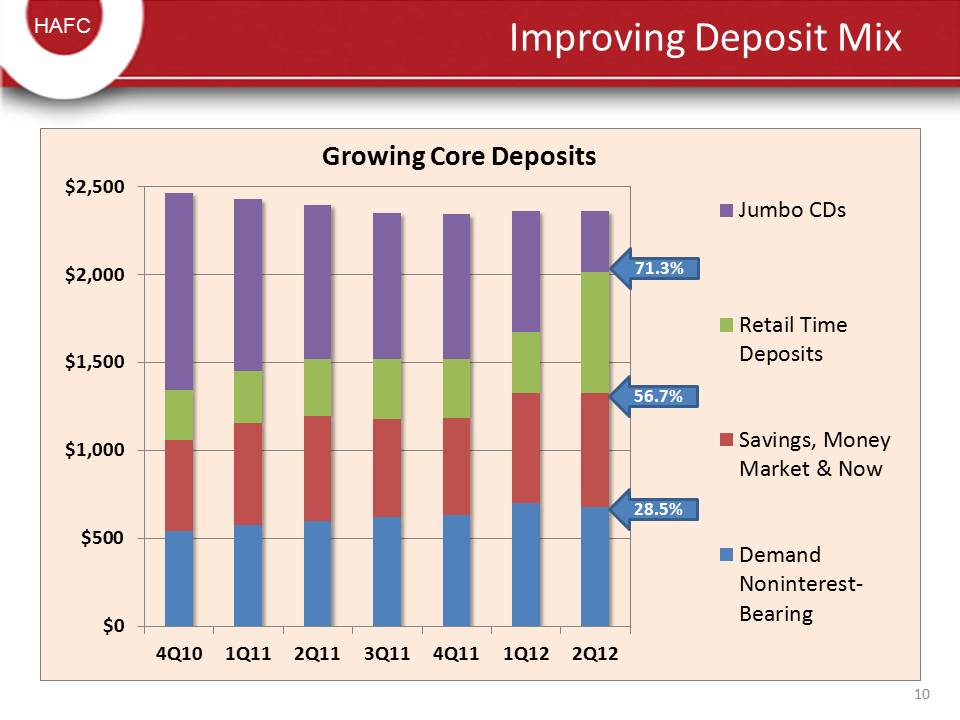
HAFC Improving Deposit Mix $0 $500 $1,000 $1,500 $2,000 $2,500 4Q10 1Q11 2Q11 3Q11 4Q11 1Q12 2Q12 Growing Core Deposits Jumbo CDs Retail Time Deposits Savings, Money Market & Now Demand Noninterest‐ Bearing 56.7% 71.3% 28.5% 10
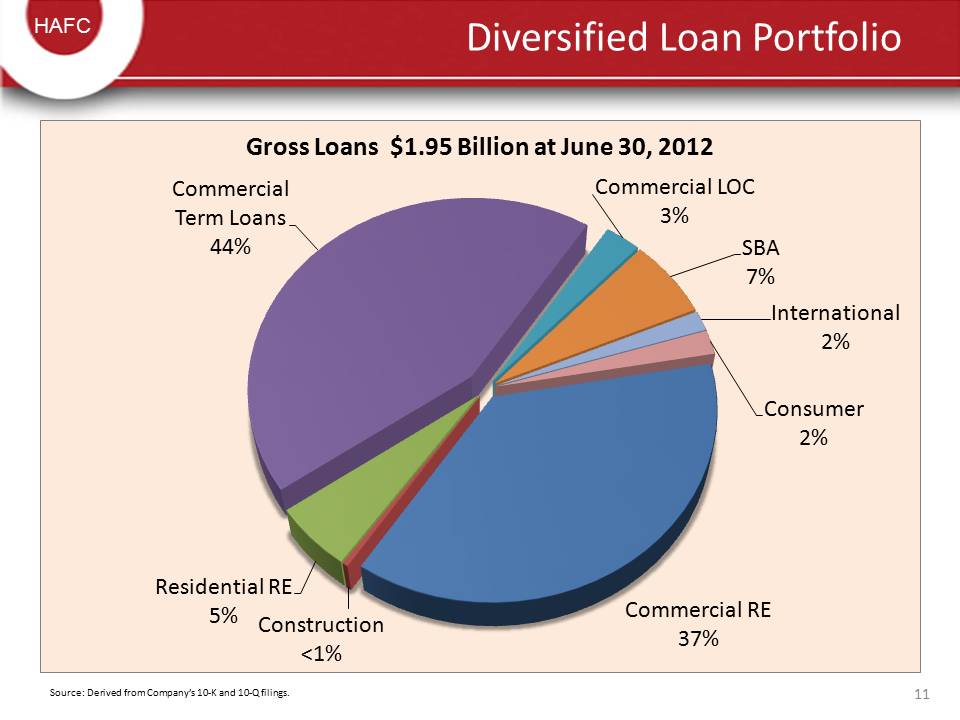
HAFC Diversified Loan Portfolio Source: Derived from Company’s 10‐K and 10‐Q filings. Commercial RE 37% Construction <1% Residential RE 5% Commercial Term Loans 44% Commercial LOC 3% SBA 7% International 2% Consumer 2% Gross Loans $1.95 Billion at June 30, 2012 11
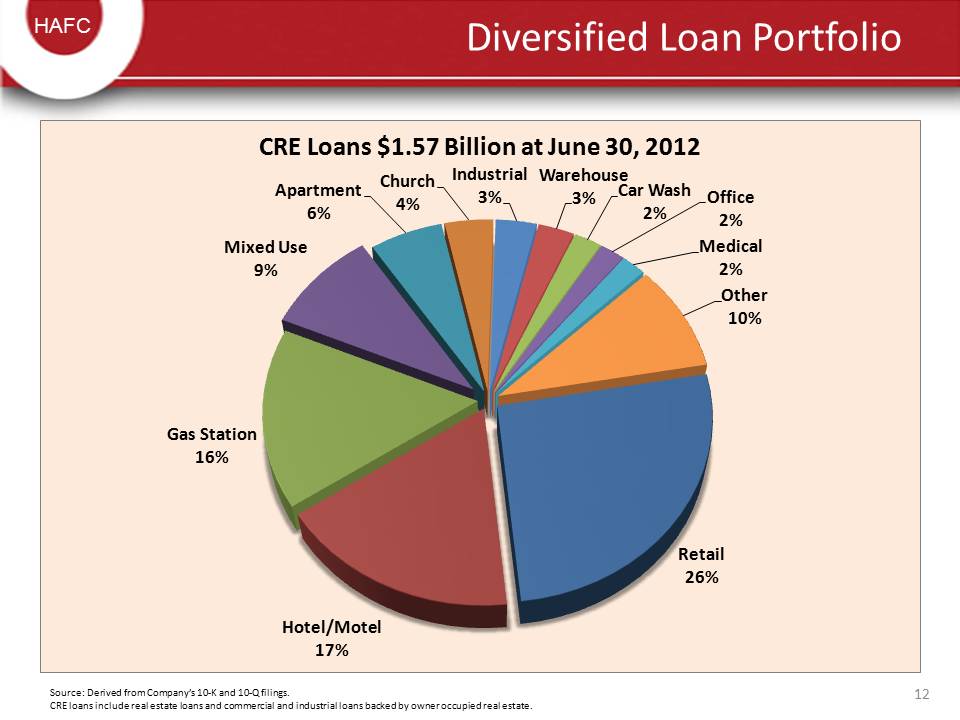
HAFC Diversified Loan Portfolio Source: Derived from Company’s 10‐K and 10‐Q filings. CRE loans include real estate loans and commercial and industrial loans backed by owner occupied real estate. Retail 26% Hotel/Motel 17% Gas Station 16% Mixed Use 9% Apartment 6% Church 4% Industrial 3% Warehouse 3% Car Wash 2% Office 2% Medical 2% Other 10% CRE Loans $1.57 Billion at June 30, 2012 12
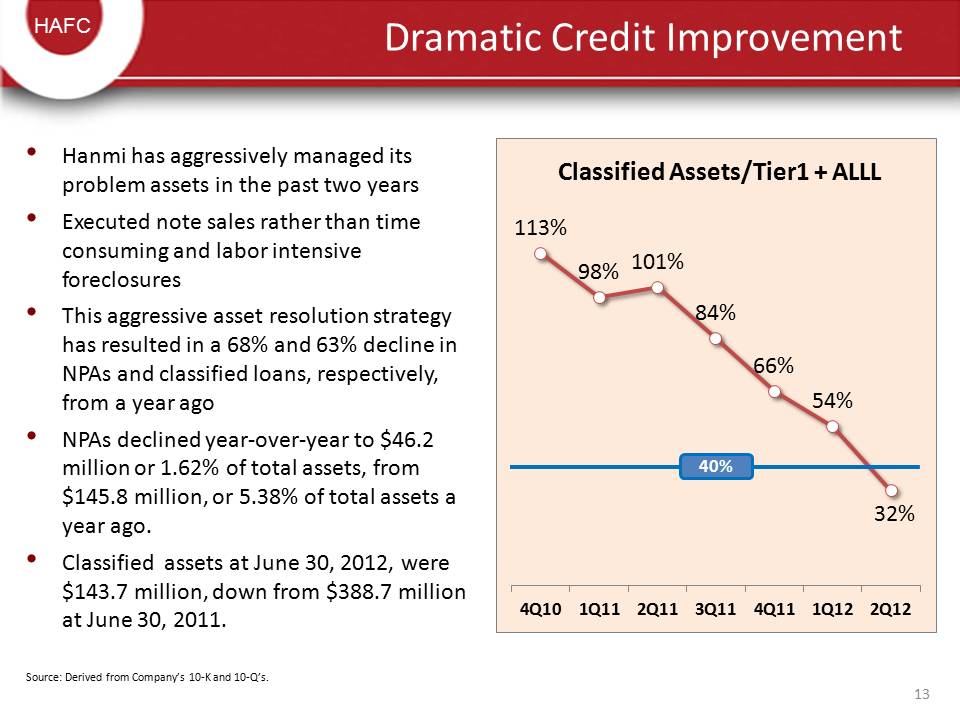
HAFC Dramatic Credit Improvement • Hanmi has aggressively managed its problem assets in the past two years • Executed note sales rather than time consuming and labor intensive foreclosures • This aggressive asset resolution strategy has resulted in a 68% and 63% decline in NPAs and classified loans, respectively, from a year ago • NPAs declined year‐over‐year to $46.2 million or 1.62% of total assets, from $145.8 million, or 5.38% of total assets a year ago. • Classified assets at June 30, 2012, were $143.7 million, down from $388.7 million at June 30, 2011. Source: Derived from Company’s 10‐K and 10‐Q’s. 113% 98% 101% 84% 66% 54% 32% 4Q10 1Q11 2Q11 3Q11 4Q11 1Q12 2Q12 Classified Assets/Tier1 + ALLL 40% 13
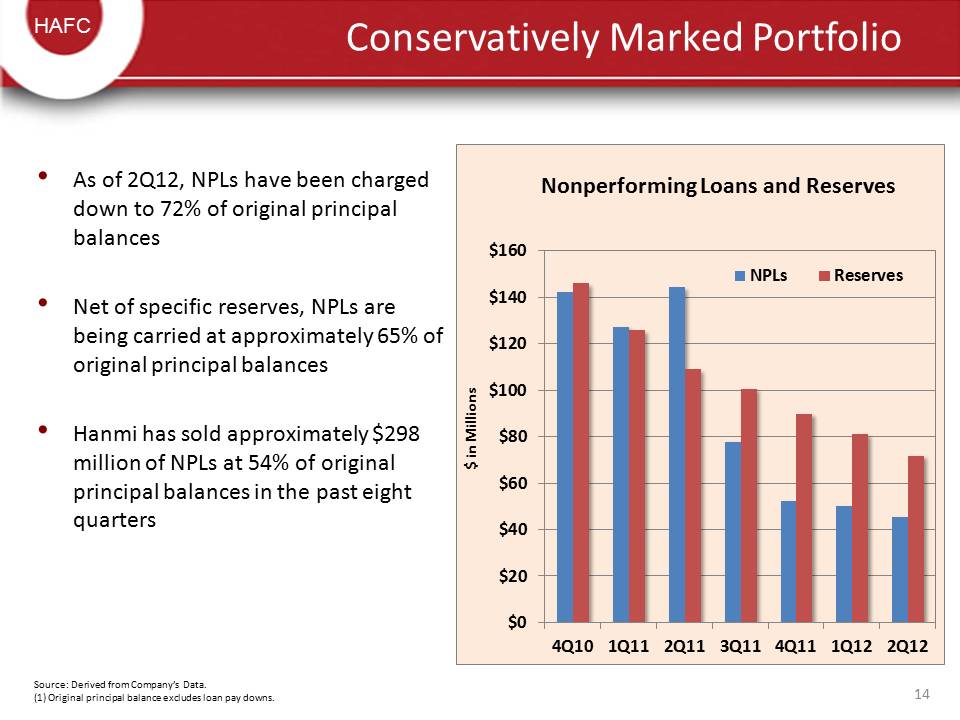
HAFC Conservatively Marked Portfolio • As of 2Q12, NPLs have been charged down to 72% of original principal balances • Net of specific reserves, NPLs are being carried at approximately 65% of original principal balances • Hanmi has sold approximately $298 million of NPLs at 54% of original principal balances in the past eight quarters Source: Derived from Company’s Data. (1) Original principal balance excludes loan pay downs. $0 $20 $40 $60 $80 $100 $120 $140 $160 4Q10 1Q11 2Q11 3Q11 4Q11 1Q12 2Q12 Nonperforming Loans and Reserves NPLs Reserves $ in Millions 14
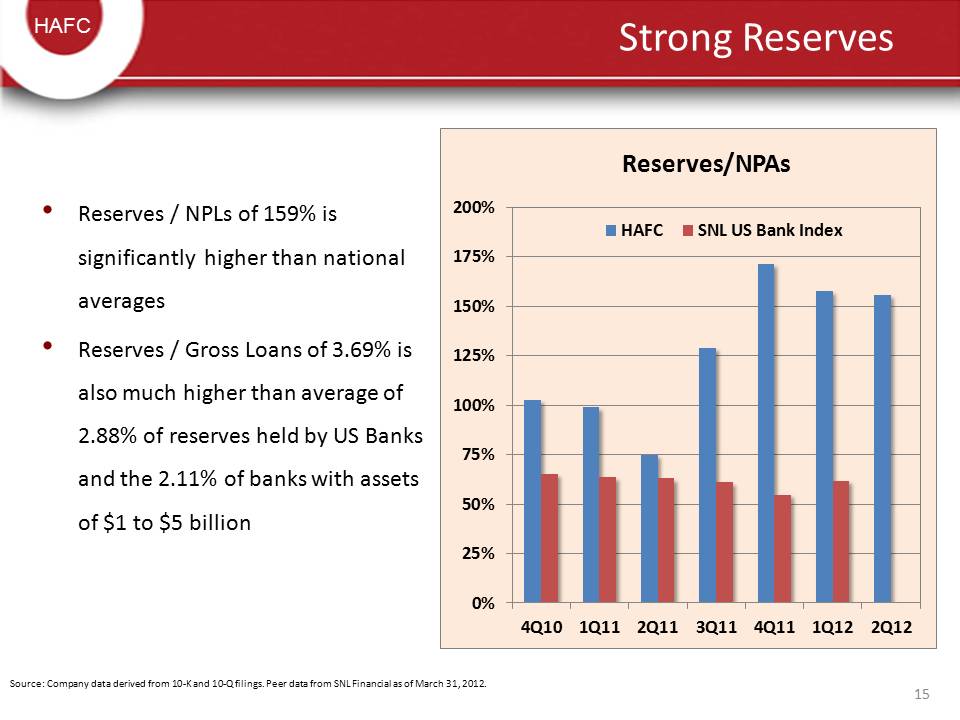
HAFC Strong Reserves Reserves / NPLs of 159% is significantly higher than national averages Reserves / Gross Loans of 3.69% is also much higher than average of 2.88% of reserves held by US Banks and the 2.11% of banks with assets of $1 to $5 billion Source: Company data derived from 10‐K and 10‐Q filings. Peer data from SNL Financial as of March 31, 2012. 15
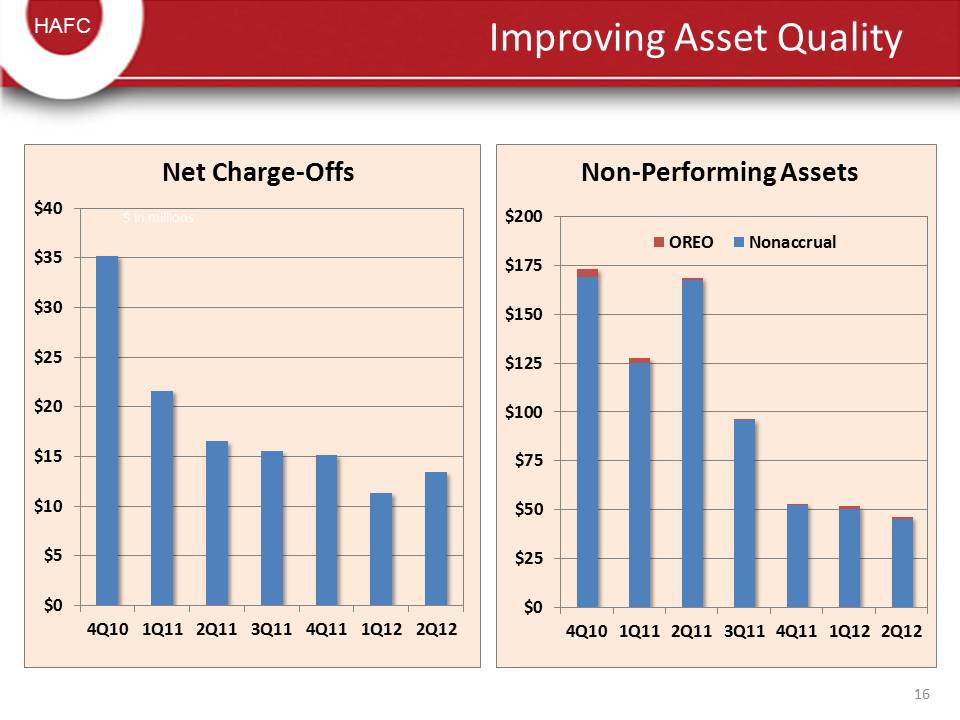
HAFC Improving Asset Quality $0 $5 $10 $15 $20 $25 $30 $35 $40 4Q10 1Q11 2Q11 3Q11 4Q11 1Q12 2Q12 Net Charge‐Offs $ in millions $0 $25 $50 $75 $100 $125 $150 $175 $200 4Q10 1Q11 2Q11 3Q11 4Q11 1Q12 2Q12 Non‐Performing Assets OREO Nonaccrual 16
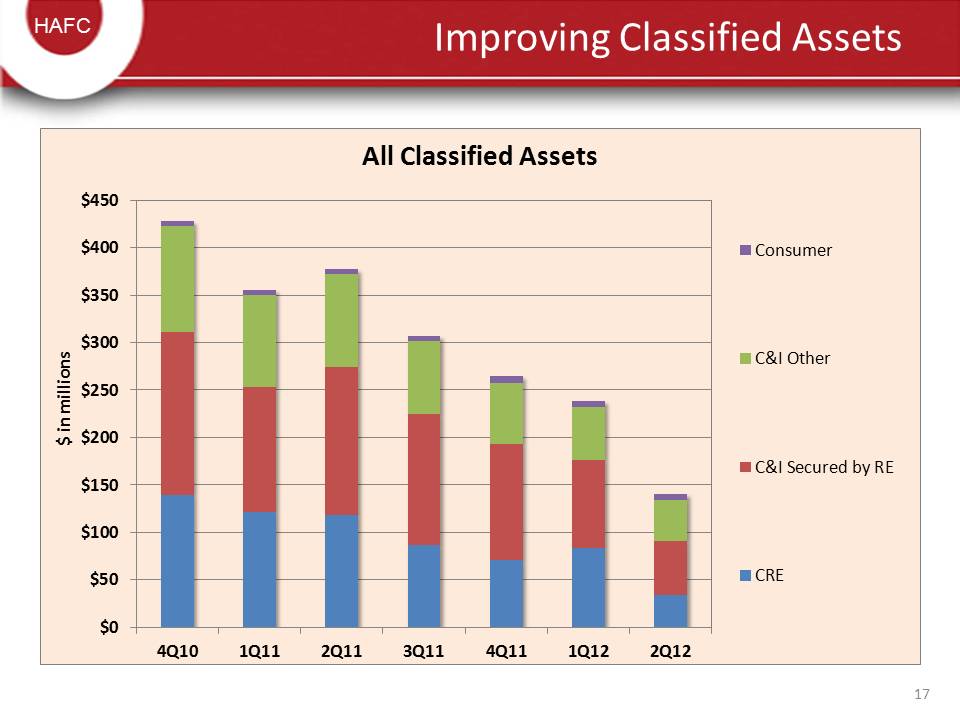
HAFC Improving Classified Assets $0 $50 $100 $150 $200 $250 $300 $350 $400 $450 4Q10 1Q11 2Q11 3Q11 4Q11 1Q12 2Q12 All Classified Assets Consumer C&I Other C&I Secured by RE CRE $ in millions 17
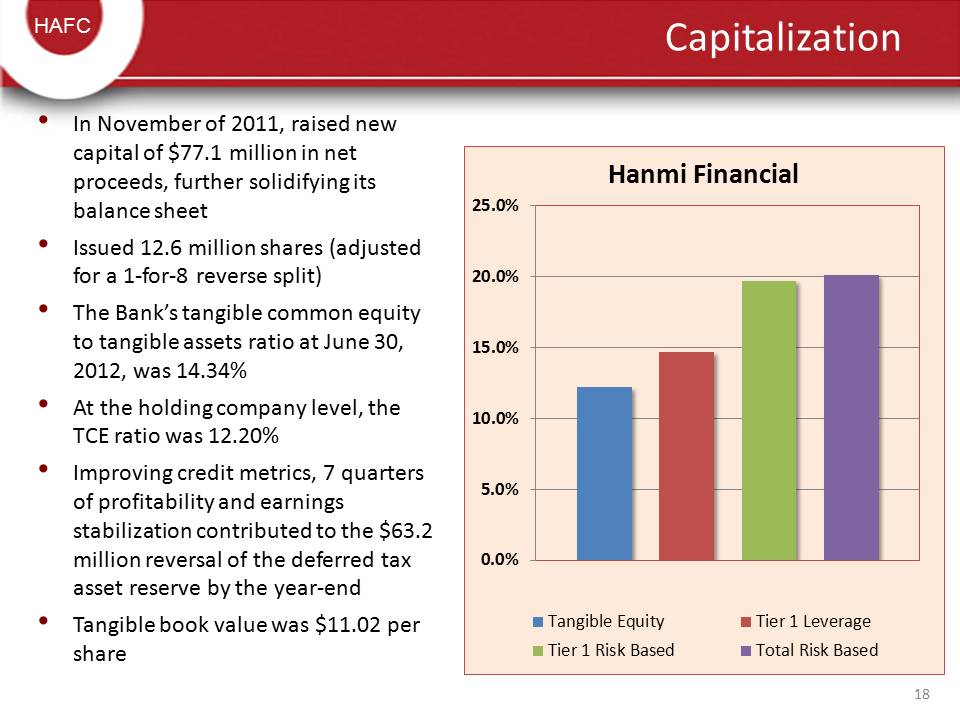
HAFC Capitalization • In November of 2011, raised new capital of $77.1 million in net proceeds, further solidifying its balance sheet • Issued 12.6 million shares (adjusted for a 1‐for‐8 reverse split) • The Bank’s tangible common equity to tangible assets ratio at June 30, 2012, was 14.34% • At the holding company level, the TCE ratio was 12.20% • Improving credit metrics, 7 quarters of profitability and earnings stabilization contributed to the $63.2 million reversal of the deferred tax asset reserve by the year‐end • Tangible book value was $11.02 per share 0.0% 5.0% 10.0% 15.0% 20.0% 25.0% Hanmi Financial Tangible Equity Tier 1 Leverage Tier 1 Risk Based Total Risk Based 18
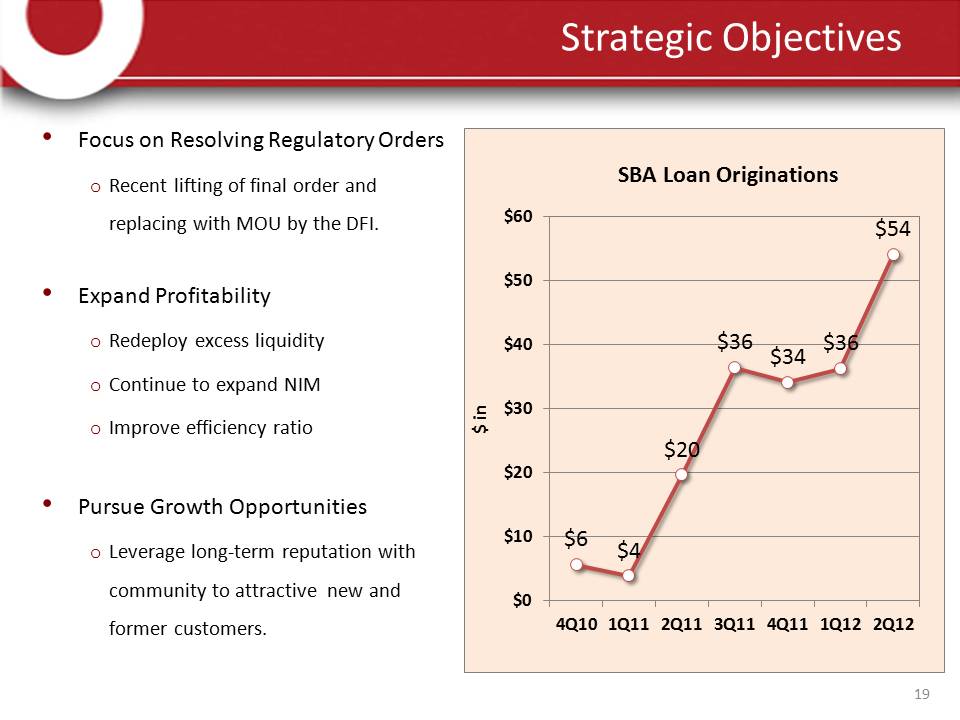
Strategic Objectives Focus on Resolving Regulatory Orders Recent lifting of final order and replacing with MOU by the DFI. Expand Profitability Redeploy excess liquidity Continue to expand NIM Improve efficiency ratio Pursue Growth Opportunities Leverage long‐term reputation with community to attractive new and former customers. $6 $4 $20 $36 $34 $36 $54 $0 $10 $20 $30 $40 $50 $60 4Q10 1Q11 2Q11 3Q11 4Q11 1Q12 2Q12 19
HAFC Investment Highlights • Oldest and second largest Korean American bank in the U.S. • Well positioned branch network in Southern California’s Korean American neighborhoods. • Premier deposit franchise and commercial banking platform • Aggressive problem asset resolution resulting in significantly improved credit profile • Substantial capital position and reserves • Seven consecutive quarters of profitability • Trading at $10.74, or 97% of tangible book value on July 24, 2012 Please refer to the Non‐GAAP reconciliation for Tangible Equity to Tangible Assets at the end of this presentation 20
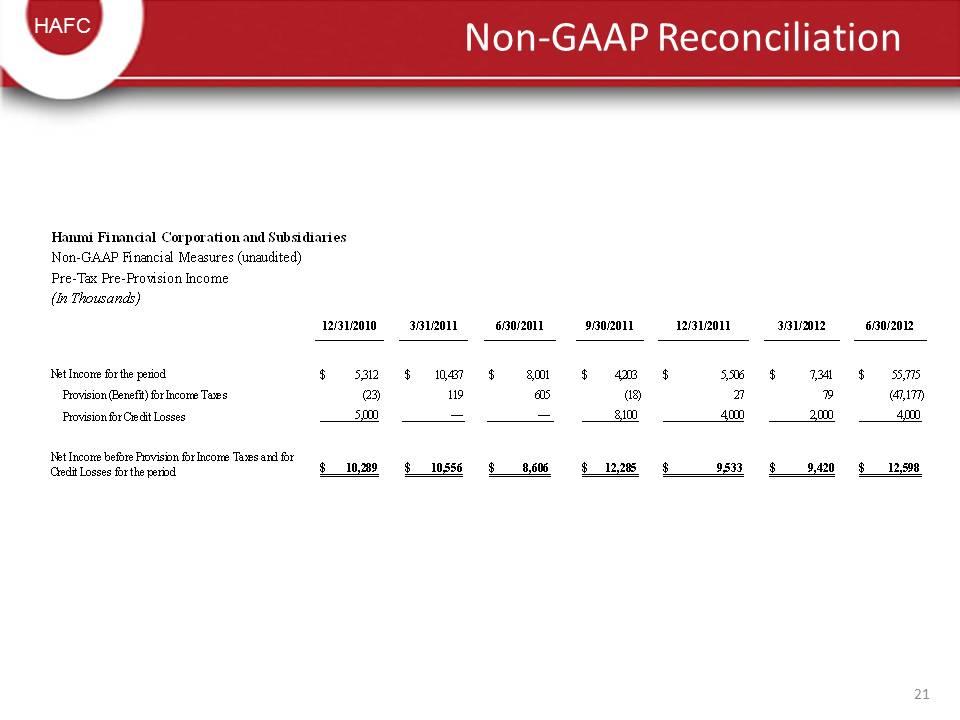
HAFC Non‐GAAP Reconciliation Hanmi Financial Corporation and Subsidiaries Non-GAAP Financial Measures (unaudited) Pre-Tax Pre-Provision Income 12/31/2010 3/31/2011 6/30/2011 9/30/2011 12/31/2011 3/31/2012 6/30/2012 Net Income for the period $ 5,312 $ 10,437 $ 8,001 $ 4,203 $ 5,506 $ 7,341 $ 55,775 Provision (Benefit) for Income Taxes (23) 119 605 (18) 27 79 (47,177) Provision for Credit Losses 5,000 8,100 4,000 2,000 4,000 Net Income before Provision for Income Taxes and for Credit Losses for the period $ 10,289 $ 10,556 $ 8,606 $ 12,285 $ 9,533 $ 9,420 $ 12,598 (In Thousands) 21
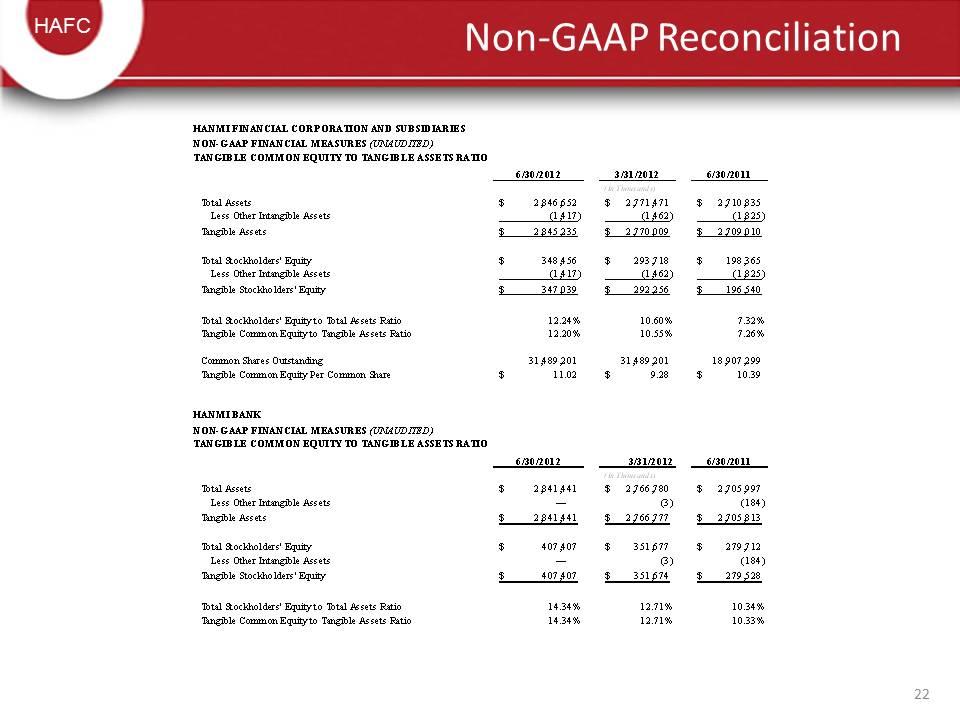
HAFC Non‐GAAP Reconciliation HANMI FINANCIAL CORPORATION AND SUBSIDIARIES NON-GAAP FINANCIAL MEASURES (UNAUDITED) TANGIBLE COMMON EQUITY TO TANGIBLE ASSETS RATIO 6/30/2012 3/31/2012 6/30/2011 Total Assets 2,846,652 $ 2,771,471 $ 2,710,835 $ Less Other Intangible Assets (1,417) (1,462) (1,825) Tangible Assets 2,845,235 $ 2,770,009 $ 2,709,010 $ Total Stockholders' Equity 348,456 $ 293,718 $ 198,365 $ Less Other Intangible Assets (1,417) (1,462) (1,825) Tangible Stockholders' Equity 347,039 $ 292,256 $ 196,540 $ Total Stockholders' Equity to Total Assets Ratio 12.24% 10.60% 7.32% Tangible Common Equity to Tangible Assets Ratio 12.20% 10.55% 7.26% Common Shares Outstanding 31,489,201 31,489,201 18,907,299 Tangible Common Equity Per Common Share 11.02 $ 9.28 $ 10.39 $ HANMI BANK NON-GAAP FINANCIAL MEASURES (UNAUDITED) TANGIBLE COMMON EQUITY TO TANGIBLE ASSETS RATIO 6/30/2012 3/31/2012 6/30/2011 Total Assets 2,841,441 $ 2,766,780 $ 2,705,997 $ Less Other Intangible Assets — (3) (184) Tangible Assets 2,841,441 $ 2,766,777 $ 2,705,813 $ Total Stockholders' Equity 407,407 $ 351,677 $ 279,712 $ Less Other Intangible Assets — (3) (184) Tangible Stockholders' Equity 407,407 $ 351,674 $ 279,528 $ Total Stockholders' Equity to Total Assets Ratio 14.34% 12.71% 10.34% Tangible Common Equity to Tangible Assets Ratio 14.34% 12.71% 10.33% (In Thousands) (In Thousands) 22