Attached files
| file | filename |
|---|---|
| 8-K - FORM 8-K - TOTAL SYSTEM SERVICES INC | d383345d8k.htm |
| EX-99.1 - EX-99.1 - TOTAL SYSTEM SERVICES INC | d383345dex991.htm |
 2012
Second Quarter Results July 24, 2012
Exhibit 99.2
©
2012 Total System Services, Inc.
®
All rights reserved worldwide. |
 Forward-Looking Statements
This presentation and comments made by management contain
forward-looking statements including, among others, statements
regarding the expected future operating results of TSYS. These
statements are based on management’s current expectations and
assumptions and are subject to risks, uncertainties and changes in
circumstances. Forward-looking statements include all statements
that are not historical facts and can be identified by the use of
forward- looking
terminology
such
as
the
words
“believe,”
“expect,”
“anticipate,”
“intend,”
“plan,”
“estimate”
or similar expressions. Actual results may
differ materially from those set forth in the forward-looking statements
due to a variety of factors. More information about these risks,
uncertainties
and
factors
may
be
found
in
TSYS’
2011
Annual
Report
on
Form
10-K,
Quarterly
Reports
on
Form
10-Q
and
Current
Reports
on Form 8-K. TSYS does not assume any obligation to update any
forward-looking statements as a result of new information, future
developments or otherwise.
2
©2012
Total
System
Services,
Inc.®
Proprietary.
All
rights
reserved worldwide. |
 Use of
Non-GAAP Financial Measures This slide presentation contains certain
non-GAAP financial measures determined by methods other than in
accordance with generally accepted accounting principles. Such non-GAAP
financial measures include the following: revenues before reimbursable
items; operating margin excluding reimbursable items; revenues measured on a
constant currency basis; free cash flow; and EBITDA. The most
comparable GAAP measures to these measures are revenues;
operating margin; revenues; cash flows from operating activities; and
net income, respectively. Management uses these non-GAAP financial
measures
to
assess
the
performance
of
TSYS’
core
business.
TSYS
believes that these non-GAAP financial measures provide meaningful
additional information about TSYS to assist investors in evaluating
TSYS’
operating results. These non-GAAP financial measures should
not be considered as a substitute for operating results determined in
accordance with GAAP and may not be comparable to other similarly
titled measures of other companies. The computations of the non-
GAAP financial measures used in this slide presentation are set forth in
the Appendix to this slide presentation.
3
©2012
Total
System
Services,
Inc.®
Proprietary.
All
rights
reserved worldwide. |
 Phil
Tomlinson Chairman and Chief Executive Officer
|
 Chief Financial Officer
Jim Lipham |
 Consolidated Selected Financial Highlights
6
©2012
Total
System
Services,
Inc.®
Proprietary.
All
rights
reserved worldwide.
$ 462,651
$ 447,554
3.4%
Total Revenues
$ 923,813
$ 876,985
5.3%
398,692
380,210
4.9
Revenues Before Reimbursable Items
793,870
742,854
6.9
92,096
78,529
17.3
Operating Income
176,927
151,557
16.7
66,710
53,747
24.1
Net Income Attributable to TSYS
Common Shareholders
123,106
102,537
20.1
2,440.2
2,135.7
14.3
Total Cardholder Transactions (in millions)
4,716.3
4,088.5
15.4
$0.35
$0.28
26.5
Earnings Per Share
Attributable to TSYS Common
Shareholders
$0.65
$0.53
22.7
YTD
2012
YTD
2011
Percent
Change
(in thousands, except per share data)
2
Qtr
2012
2
Qtr
2011
Percent
Change
nd
nd |
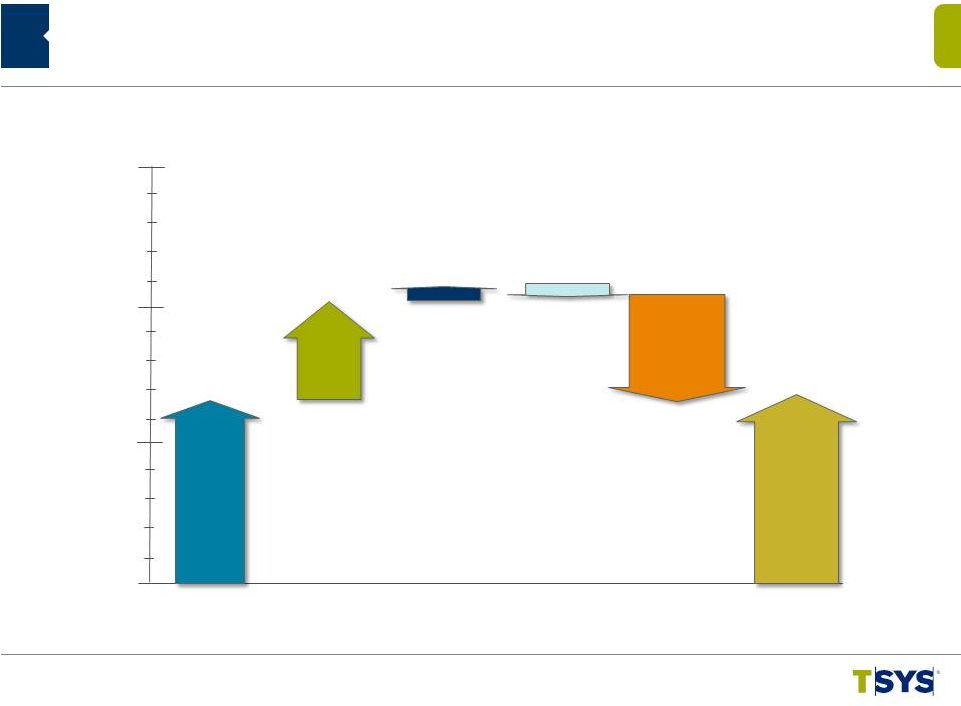 2012
YTD Revenue Change Revenues Before Reimbursable Items
7
©2012
Total
System
Services,
Inc.®
Proprietary.
All
rights
reserved worldwide.
10%
15%
5%
0%
6.4%
Internal
Growth
New
Clients
3.7%
Acquisitions
(3.7%)
Reported
6.9%
Currency
(0.5%)
1.0%
Lost
Business,
Non-recurring
Items and
Price
Compression |
 Consumer Credit
199.4
187.6
6.3
199.4
197.2
1.1
Government
Services
30.8
30.0
2.8
30.8
30.5
1.0
Retail
25.2
23.7
6.0
25.2
25.3
(0.5
)
Total Consumer
255.4
241.3
5.8
255.4
253.0
0.9
Commercial
36.1
32.7
10.4
36.1
35.5
1.7
Other
9.6
6.7
42.9
9.6
9.4
1.6
Subtotal
301.1
280.7
7.2
301.1
297.9
1.0
Prepaid /
Stored Value
105.4
72.8
44.6
105.4
88.5
19.1
Commercial Card
Single Use
34.0
22.5
51.2
34.0
29.5
15.4
Total AOF
440.5
376.0
17.1
440.5
415.9
5.9
Consolidated Accounts on
File Portfolio Summary
(in millions)
Jun
2012
Jun
2011
%
Change
Jun
2012
Mar
2012
%
Change
8
©2012
Total
System
Services,
Inc.®
Proprietary.
All
rights
reserved worldwide. |
 Key
Drivers 2Q 2012 Year Over Year
Segment Financial Highlights
•
Strong internal growth
•
Increased volumes
North America
Services
9
©2012
Total
System
Services,
Inc.®
Proprietary.
All
rights
reserved worldwide.
•
Accounts on file were 387.3 million, an increase
of 18.0%
•
Total cardholder transactions were 2,037.9
million, an increase of 13.5%
Volumes
Revenues
$239.6 million
Increase of 2.4%
Excluding Reimbursables
$205.6 million
Increase of 3.4%
Operating Income
$72.1 million
Increase of 12.5%
Operating Margin
30.1%
Excluding Reimbursables
35.1%
Same Client Transactions
2,010.0 million
Increase of 13.1% |
 2Q
2012 Year Over Year Segment Financial Highlights
•
Strong internal growth
•
Deconversion fee
•
Conversion of new clients
•
Dedication of more internal resources,
previously shared between our North America
and International segments
10
©2012
Total
System
Services,
Inc.®
Proprietary.
All
rights
reserved worldwide.
Key Drivers
International
Services
Volumes
•
Accounts on file were 53.1 million, an
increase of 11.1%
•
Total cardholder transactions were 402.3
million, an increase of 18.1%
Revenues
$103.4 million
Increase of 5.9%
Constant currency basis
$106.2 million
Excluding Reimbursables
$99.0 million
Increase of 5.6%
Operating Income
$9.4 million
Decrease of 6.8%
Operating Margin
9.1%
Excluding Reimbursables
9.5%
Same Client Transactions
374.8 million
Increase of 11.0% |
 Merchant
Services
2Q 2012 Year Over Year
Segment Financial Highlights
•
Upward trends in transaction volumes
•
Strong dollar volume growth in direct acquiring
11
©2012
Total
System
Services,
Inc.®
Proprietary.
All
rights
reserved worldwide.
Key Drivers
Volumes
•
Point-of-Sale Transactions were 1,279.7
million, an increase of 0.8%
•
Excluding deconverted clients, Point-of-Sale
Transactions increased 12.4%
Revenues
$124.9 million
Increase of 1.5%
Excluding Reimbursables
$97.7 million
Increase of 5.0%
Operating Income
$33.0 million
Increase of 28.2%
Operating Margin
26.4%
Excluding Reimbursables
33.7% |
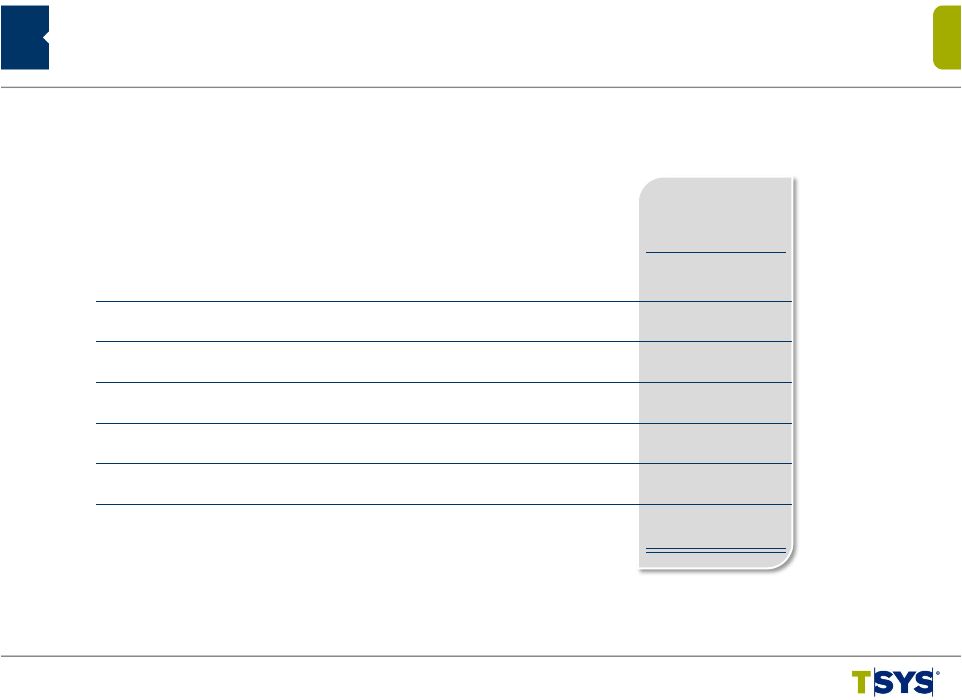
 Cash Flow Strength:
2012 TTM Consolidated Financial Highlights
$518
$440
$330
$244
$419
$0
$75
$150
$225
$300
$375
$450
$525
$600
(in millions)
12
TTM = Trailing Twelve Months
©2012
Total
System
Services,
Inc.®
Proprietary.
All
rights
reserved worldwide. |
 Closing Share Price
$ 23.93
$ 19.56
$4.37
$ 23.93
$ 18.58
$5.35
Dividends
$0.20
$0.37
Total return
$4.57
$5.72
Shareholder return
23.4%
30.8%
Shareholder Return
©
2012 Total System Services, Inc.
®
Proprietary. All rights reserved worldwide.
13
Jun 30,
2012
Dec 31,
2011
Jun 30,
2012
Jun 30,
2011
Shareholder
Return
Shareholder
Return
Six Months
Trailing
Twelve Months |
 Appendix |
 Total Revenues
$ 462,651
$ 447,554
$ 923,813 $ 876,985
Reimbursable Items
63,959
67,344
129,943
134,131
Revenues Before Reimbursable Items
$ 398,692
$ 380,210
$ 793,870
$ 742,854
Appendix Non-GAAP Reconciliation –
Revenues Before Reimbursable Items
(in thousands)
15
6/30/12
6/30/11
6/30/12
6/30/11
Three Months Ended
Twelve Months Ended
©2012
Total
System
Services,
Inc.®
Proprietary.
All
rights
reserved worldwide. |
 Operating Income (a)
$ 72,060
$ 9,438
$ 32,950
Total Revenues (b)
239,557
233,903
103,415
97,670
124,903
123,084
Reimbursable Items
33,992
35,128
4,368
3,892
27,202
30,043
Revenues Before
Reimbursable Items(c)
205,565
198,775
99,047
93,778
97,701
93,041
Operating Margin (a)/(b)
30.08%
27.39%
9.13%
10.36%
26.38%
20.89%
Operating Margin Excluding Reimbursables (a)/(c)
35.05%
32.23%
9.53%
10.79%
33.73%
27.63%
North America
International
Merchant
(in thousands)
16
Three Months Ended
Three Months Ended
Three Months Ended
6/30/12
6/30/11
6/30/11
6/30/12
6/30/12
6/30/11
$ 64,068
$ 10,122
$ 25,708
Appendix
Non-GAAP
Reconciliation
–
Segment
Operating Margin Excluding Reimbursable Items
©2012
Total
System
Services,
Inc.®
Proprietary.
All
rights
reserved worldwide. |
 Appendix Non-GAAP Reconciliation –
Constant Currency
(1) Reflects current period results on a non-GAAP basis as if foreign currency
rates did not change from the comparable prior year period. (2) Reflects the
impact of calculated changes in foreign currency rates from the comparable period.
(in thousands)
Consolidated:
Constant Currency (1)
$ 465,231
$ 447,554
3.9%
$ 927,482
$ 876,985
5.8%
Foreign Currency (2)
(2,580)
---
(3,669)
---
Total Revenues
462,651
447,554
3.4%
923,813
876,985
5.3%
International Services:
Constant Currency (1)
$ 106,186
$ 97,670
8.7%
$ 207,717
$188,380
10.3%
Foreign Currency (2)
(2,771)
---
(3,942)
---
Total Revenues
$103,415
$97,670
5.9%
$203,775
$188,380
8.2%
17
Percentage
Change
Percentage
Change
Months Ended
6/30/12 6/30/11
Three
6/30/12 6/30/11
Months Ended
Six
©2012
Total
System
Services,
Inc.®
Proprietary.
All
rights
reserved worldwide. |
 Trailing Twelve
Appendix Non-GAAP Reconciliation –
EBITDA
Net Income
$ 244,225
Adjusted for:
Deduct: Equity in Income of Equity Investments
(10,849)
Add: Income Taxes
107,890
Add: Nonoperating expense
6,560
Add: Depreciation and Amortization
170,216
EBITDA
$ 518,042
(in thousands)
18
Months Ended
6/30/2012
©2012
Total
System
Services,
Inc.®
Proprietary.
All
rights
reserved worldwide. |
 Appendix
Non-GAAP
Reconciliation
–
Free
Cash
Flow
(in thousands)
19
Cash Flows from Operating Activities
$ 440,429
Less:
Purchase of Property and Equipment
(28,205)
Additions to Licensed Computer Software from Vendors
(30,898)
Additions to Internally Developed Computer Software
(18,761)
Additions to Contract Acquisition Costs
(32,356)
Free Cash Flow
$ 330,209
6/30/2012
©2012
Total
System
Services,
Inc.®
Proprietary.
All
rights
reserved worldwide.
Months Ended
Trailing Twelve |