Attached files
| file | filename |
|---|---|
| 8-K - USA TECHNOLOGIES, INC. 8-K 6-28-2012 - CANTALOUPE, INC. | form8k.htm |
Exhibit 99.1

SHAREHOLDERS MEETING
June 28, 2012

COMPANY PRESENTATION
Stephen P. Herbert, Chairman and CEO

SAFE HARBOR STATEMENT
All statements other than statements of historical fact included in this presentation are forward
-looking statements. Actual results could differ materially from those contemplated by the
forward-looking statements as a result of certain factors, including but not limited to, business,
financial, market and economic conditions and the outcome of the pending proxy contest. A
detailed discussion of risks and uncertainties that could cause actual results and events to
differ materially from such forward-looking statements is included in USA’s most recent filings
with the Securities and Exchange Commission (the “SEC”), including the Form 10-Q report for
the quarter ended March 31, 2012, which you will find on our website, www.usatech.com,
under the “Investor Relations” tab and USAT’s Definitive Proxy Statement filed with the SEC on
May 18, 2012. Undue reliance should not be placed on any such forward looking statement,
which speak only as of the time they are made. The Company undertakes no obligation to
update any forward looking statement, whether as a result of new information, future events or
otherwise.
Non-GAAP Information: This presentation will include a discussion of Adjusted EBITDA which
is a non-GAAP financial measure which we believe is useful for an understanding of our
ongoing operations. This non-GAAP financial measure is supplemental to, and not a substitute
for, GAAP financial measures such as net income or loss. Details of these items and a
reconciliation of this non-GAAP financial measure to GAAP financial measures can be found in
this presentation and in our Form 10-Q report for the quarter ended March 31, 2012 which is
on our website, www.usatech.com, under the “Investor Relations” tab.

COMPANY OVERVIEW
DELIVERING ON SHAREHOLDER COMMITMENTS
STRATEGIC GROWTH PLAN
RESULTS/FINANCIALS

COMPANY OVERVIEW

Provide leading edge wireless
cashless payment services for
small ticket unattended retail.
cashless payment services for
small ticket unattended retail.
Connect remote, self-service retail
locations so owners and operators
can better manage their business.
locations so owners and operators
can better manage their business.
COMPANY OVERVIEW
USA Technologies is a service company.
Its ePort Connect service represents 80% of all revenue.
Its ePort Connect service represents 80% of all revenue.
$
$
$
$

A PCI compliant, end-to-end, suite of cashless
payment and telemetry services tailored to fit
the needs of self-service retail industries.
payment and telemetry services tailored to fit
the needs of self-service retail industries.
Card
Processing
Processing
Services
Wireless
Connectivity
Online Sales
Reporting
Over the Air
Updates &
Remote Data
Management
Updates &
Remote Data
Management
Data
Security
Health
Alerts
Consumer
Services
Settlement
COMPANY OVERVIEW

COMPANY OVERVIEW
The ePort Connect service is open and flexible
USAT PRODUCTS
G8
EDGE
THIRD PARTY
HARDWARE
HARDWARE
Coinco
MEI
Crane
THIRD PARTY SERVICES
(VEND MANAGEMENT
SYSTEMS)
SYSTEMS)

Sources:
US Department of Transportation, 2008, IHL Kiosk Study, 2010 (2011 projections)First Research, March
2011, June 2010, Automatic Merchandisers State of the Coffee Industry 2009Vending Times Census 2010,
Smart Card Alliance 2006
2011, June 2010, Automatic Merchandisers State of the Coffee Industry 2009Vending Times Census 2010,
Smart Card Alliance 2006
*Includes self-checkout systems, ticketing kiosks check-in
kiosks, food ordering kiosks, postal and other retail kiosks.
kiosks, food ordering kiosks, postal and other retail kiosks.
Kiosks $45B*
Vending $43B
Parking (not in total)
Commercial Laundry $11B
Tolls $8B
Automated Car Wash $4B
Amusement and Gaming $5B
Office Coffee $4B
$120 billion
The small ticket, self-serve market is largely untapped.
Market Opportunity is Vast
COMPANY OVERVIEW

• Leading provider of wireless, cashless payment and machine-to-machine solutions
for small ticket, self-serve retail industries such as vending & kiosk
for small ticket, self-serve retail industries such as vending & kiosk
• Provider of energy saving technology to the cold beverage industry
• Cashless and contactless small ticket, unattended market is largely untapped, having
traditionally relied on cash transactions
traditionally relied on cash transactions
• Millions of potential locations (connections)
• Existing customers have potential for 2.5 million connections (USAT est.)
• Growing and reliable revenue stream driven by value-added service model
(network service fees; transaction processing)
(network service fees; transaction processing)
• 80% of revenues 3Q FY12
• Working toward profitability; building scale and improving margins as connection
rates and customer wins grow
rates and customer wins grow
• Proprietary technology with a strong patent portfolio
• 79 patents, trade secrets and “know how”
• New leadership; new strategic plan capitalizes on market trends, geared towards
sustainable growth and profitability
sustainable growth and profitability
• Stronger board composition
COMPANY OVERVIEW
MARKET LEADERSHIP
LARGE, UNTAPPED
MARKET OPPORTUNITY
MARKET OPPORTUNITY
RECURRING REVENUES
FUELED BY SERVICE
MODEL
FUELED BY SERVICE
MODEL
IMPROVING
OPERATIONAL
PERFORMANCE
OPERATIONAL
PERFORMANCE
TECHNOLOGY
BARRIERS
BARRIERS
STRENGTHENED
LEADERSHIP AND
DIRECTION
LEADERSHIP AND
DIRECTION
(1) Based on expectations communicated on June 25, 2012 (2) Expectation communicated June 8, 2012, including financial assumptions

DELIVERING ON SHAREHOLDER COMMITMENTS

Turn Around Strategy: Four Defined Objectives
USAT’S COMMITMENT TO THESE FOUR AREAS WAS STATED IN THE CEO’S
LETTER TO SHAREHOLDERS IN JANUARY. USAT HAS MADE PROGRESS ON
EACH AND EVERY FRONT.
LETTER TO SHAREHOLDERS IN JANUARY. USAT HAS MADE PROGRESS ON
EACH AND EVERY FRONT.
Increased
Shareholder
Value
1. Path to sustainable profitability
2. Increased customer value
3. High standards of governance
4. Improved visibility, transparency
DELIVERING ON SHAREHOLDER COMMITMENTS

STRATEGIC GROWTH PLAN

The confluence of several compelling drivers
should further drive market adoption.
should further drive market adoption.
MARKET
(STAKEHOLDERS)
(STAKEHOLDERS)
• VISA supporting the drive for
more acceptance points
more acceptance points
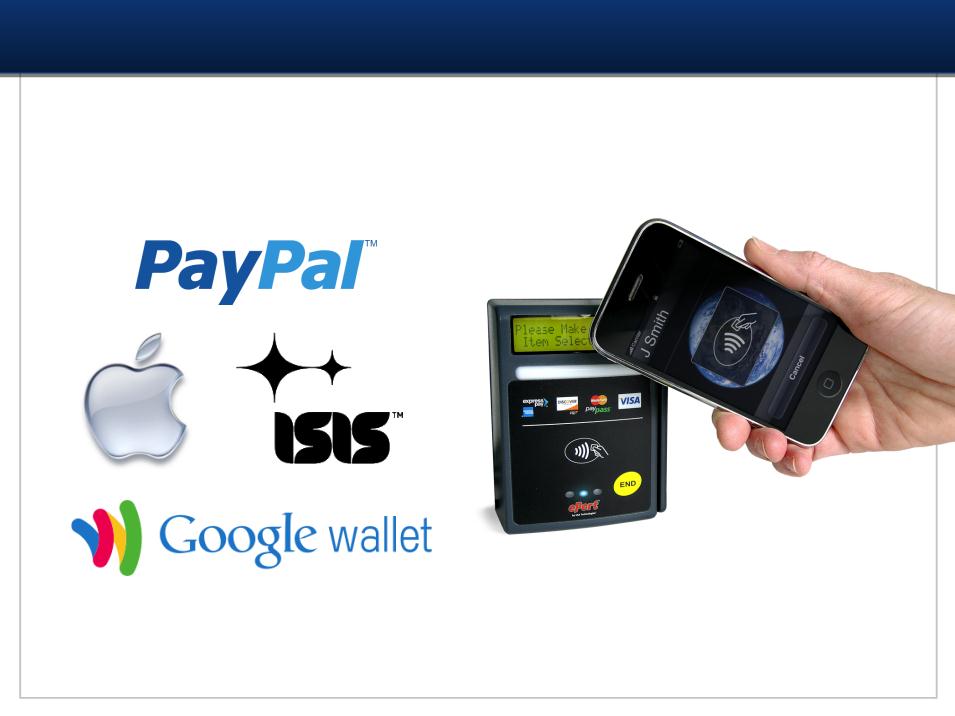
• Emerging mobile payments and
wallet providers (Google, ISIS,
PayPal)
wallet providers (Google, ISIS,
PayPal)
• Verizon driving M2M
CUSTOMERS
• Need for new or higher growth revenue
streams
streams
• Move toward new operating efficiency
opportunities through telemetry services
opportunities through telemetry services
• Overall need to improve net operating
profits
profits
TECHNOLOGY
• Cellular wireless reliability up,
costs down
costs down
• Migration to cloud/SAAS solution
• Significant manufacturing ramp
up of NFC-smart phones with bi-
directional communications
up of NFC-smart phones with bi-
directional communications
STRATEGIC GROWTH PLAN
CONSUMER
• Demand for convenience;
cashless preferred
cashless preferred
• Increasing reliance on mobile
phones
phones
• Small ticket
growthIncreasingly “social”
growthIncreasingly “social”
STRATEGIC GROWTH PLAN
CASH
DEBIT
CREDIT
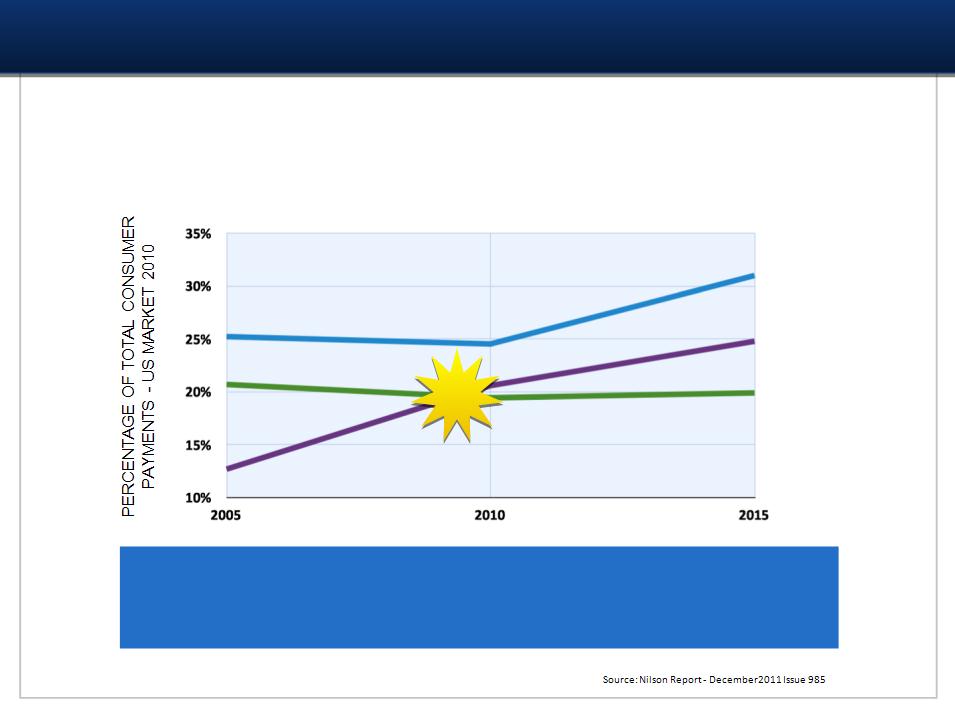
CONSUMER SPENDING BY PAYMENT TYPE
BETWEEN 2005 AND 2015, DEBIT CARD PAYMENTS ARE
PROJECTED TO INCREASE 95.3% WHILE CASH PAYMENTS
CONTINUE THEIR DECLINE.
PROJECTED TO INCREASE 95.3% WHILE CASH PAYMENTS
CONTINUE THEIR DECLINE.
Credit and debit cards have overtaken cash as a preferred
method of payment and continues to increase as a share of
consumer spending.
method of payment and continues to increase as a share of
consumer spending.

STRATEGIC GROWTH PLAN
Generation Y represents a paradigm
shift in how we buy-now and in the
future.
shift in how we buy-now and in the
future.
STRATEGIC GROWTH PLAN
Mobile payment is poised to further fuel
adoption and expand ePort Connect service
opportunities.
adoption and expand ePort Connect service
opportunities.
USAT already has over 75,000 NFC-enabled devices in the
field.
field.
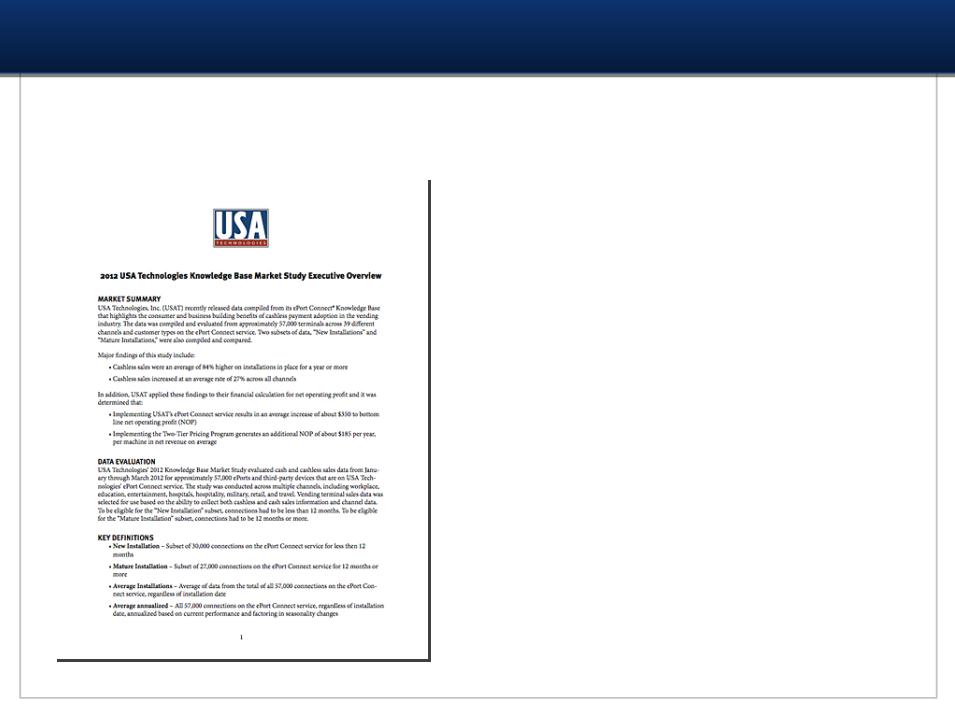
2012 Knowledge Base continues to validate benefits of cashless
STRATEGIC GROWTH PLAN
USAT Knowledge Base provides us
with a significant competitive
advantage that we continue to
leverage to drive more connections
to the ePort Connect service.
with a significant competitive
advantage that we continue to
leverage to drive more connections
to the ePort Connect service.

2012 Knowledge Base continues to validate benefits of cashless
STRATEGIC GROWTH PLAN
Cashless sales 84% higher in Mature
Installations compared to New Installation
group
Installations compared to New Installation
group
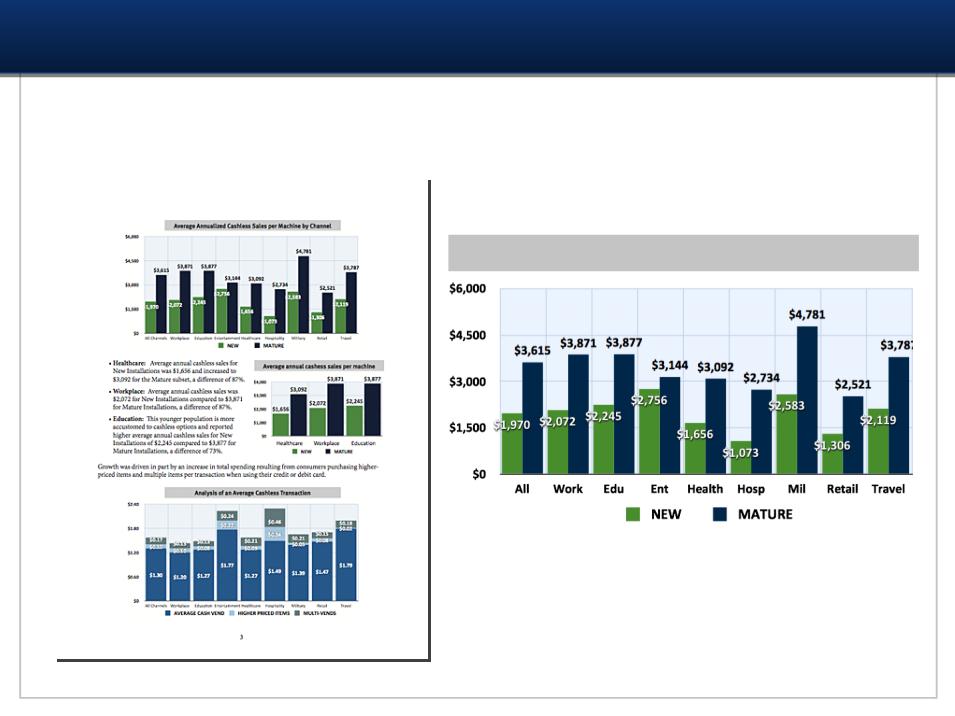
2012 Knowledge Base continues to validate benefits of cashless
STRATEGIC GROWTH PLAN
Avg Annualized Cashless Sales per Machine by Channel
Powerful intelligence to guide our customers
on how to best leverage our solution
on how to best leverage our solution
STRATEGIC GROWTH PLAN
• Leverage dominant market share and customer base to:
- Grow connections
- Grow revenue per each connection
CUSTOMER
FOCUSED MARKET
LEADERSHIP
FOCUSED MARKET
LEADERSHIP
CONTINUOUS
INNOVATION
LEVERAGE
INTELLECTUAL
PROPERTY
FINANCIAL
STABILITY/
STABILITY/
PERFORMANCE
STRATEGIC GROWTH PLAN
USAT Strategic Pillars

EXISTING BASE
STRATEGIC GROWTH PLAN
Customer Focused Market Leadership
Three key drivers of connections/market penetration
customers(1)
EXPANDED REACH
VERTICAL MARKETS
(1) USAT estimate for quarter ending 6/30/2012

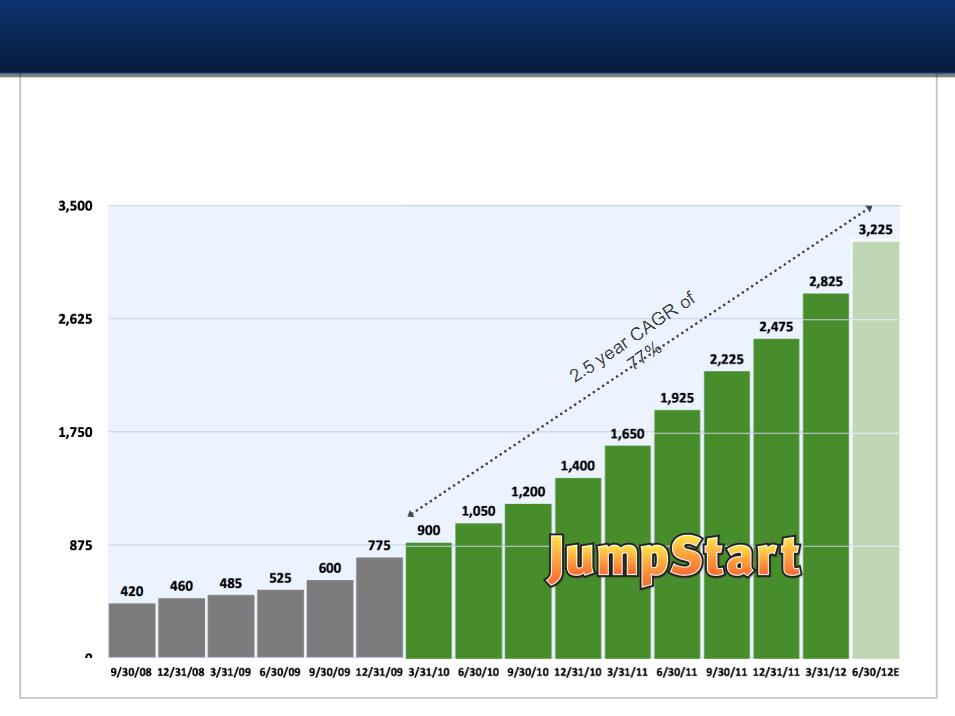
STRATEGIC GROWTH PLAN
100,000 added
over 10 quarters
25,000 added
over 7 quarters
Customer Focused Market Leadership
(1)
Our strategy has accelerated adoption, increased
revenues and created competitive advantage
revenues and created competitive advantage
TOTAL CONNECTED DEVICES
(1) USAT estimate for quarter ending 6/30/2012
STRATEGIC GROWTH PLAN
385 added
over 7 quarters
Customer Focused Market Leadership
Our ePort Connect customer base has increased 316% since 1/1/10
(1)
EPORT CONNECT CUSTOMERS
(1) USAT estimate for quarter ending 6/30/2012

Verizon Susie Ad
http://www.youtube.com/watch?v=KQnDK9tvb-Y

• Technology roadmap developed with customer input
• High ROI product development through internal
development and by leveraging suppliers/partners
development and by leveraging suppliers/partners
• Leverage dominant market share and customer base to:
- Grow connections
- Grow revenue per each connection
CUSTOMER
FOCUSED MARKET
LEADERSHIP
FOCUSED MARKET
LEADERSHIP
CONTINUOUS
INNOVATION
LEVERAGE
INTELLECTUAL
PROPERTY
FINANCIAL
STABILITY/
STABILITY/
PERFORMANCE
STRATEGIC GROWTH PLAN
USAT Strategic Pillars

Media
Services(2)
Services(2)
NEW SERVICES
STRATEGIC GROWTH PLAN
Mobile
Merchant(3)
Continuous Innovation
TRADITIONAL OFFERINGS
Services
Connectivity
Reporting
Data
Security
Machine
Health
Alerts
Services
Settlement
PLUS
Two-tier
Pricing(1)
(1) In market (2) Commercial launch anticipated quarter ending 12/31/12 (3) In development

STRATEGIC GROWTH PLAN
• Leverage dominant market share and customer base to:
- Grow connections
- Grow revenue per each connection
• Technology roadmap developed with customer input
• High ROI product development through internal
development and by leveraging suppliers/partners
development and by leveraging suppliers/partners
• Competitive advantage
• Block/slow competition
• Create revenue through licensing/avoid patent litigation
• Fundamental financial strength (profitability; healthy
balance sheet)
balance sheet)
• Leveraging key strategic partners (Verizon, Visa, Elavon)
• Access to lower cost financing to fund growth
CUSTOMER
FOCUSED MARKET
LEADERSHIP
FOCUSED MARKET
LEADERSHIP
CONTINUOUS
INNOVATION
LEVERAGE
INTELLECTUAL
PROPERTY
FINANCIAL
STABILITY/
STABILITY/
PERFORMANCE
USAT Strategic Pillars

FINANCIALS/RESULTS

FINANCIALS/RESULTS
(1)
Connections are driving total revenue
(1) USAT estimate for quarter ending 6/30/2012

COMPANY RESULTS
Quarterly Revenue Mix
55%
80%
Recurring service fees now 80% of our total revenue(1)
(1) USAT estimate for quarter ending 6/30/2012
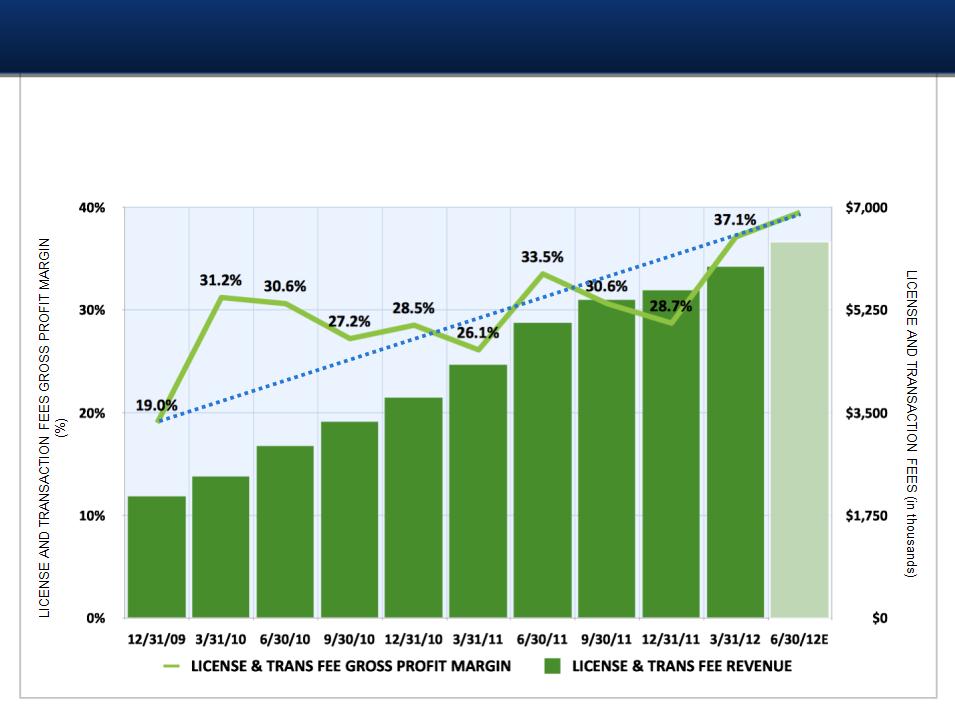
FINANCIALS/RESULTS
(1)
Scale and growth in recurring service fees is
delivering increased gross margins
delivering increased gross margins
(1) USAT estimate for quarter ending 6/30/2012

Growing Total Revenues While Controlling Operating Expenses
FINANCIALS/RESULTS
“Of particular note… The company has been able to achieve a reduction in costs
while growing the business. In particular, we note that while total revenue nearly
doubled, from $15.8 million in fiscal 2010 to $28.0 million in fiscal 2012, the company
reduced SG&A by $3 million (20 percent), from $14.9 million to $11.9 million, over the
same period.”
while growing the business. In particular, we note that while total revenue nearly
doubled, from $15.8 million in fiscal 2010 to $28.0 million in fiscal 2012, the company
reduced SG&A by $3 million (20 percent), from $14.9 million to $11.9 million, over the
same period.”
- Institutional Shareholders Services (ISS) Report on USAT dated 6/16/12
(1)
(1) USAT estimate for quarter ending 6/30/2012

ADJUSTED EBITDA(1)
3/31/12
Positive Adjusted
EBITDA; GAAP
net loss narrows
to $.9 million
EBITDA; GAAP
net loss narrows
to $.9 million
(1) See definition of Net Loss to Adjusted EBITDA included herein. (2) USAT estimate for quarter ending 6/30/2012
(3) Based on expectations communicated June 8, 2012 including related Financial Assumptions included herein.
(3) Based on expectations communicated June 8, 2012 including related Financial Assumptions included herein.
Path to Profitability Fueled by Growing Recurring Revenue Base
FINANCIALS/RESULTS
(1)
12/31/11
Actions taken to
accelerate path
to profitability
accelerate path
to profitability
6/30/12
Expect Adjusted EBITDA
to be higher than 3Q
FY2012, (excluding
proxy contest costs); Net
Loss, as a result, will be
higher than 3Q
FY2012(2)
to be higher than 3Q
FY2012, (excluding
proxy contest costs); Net
Loss, as a result, will be
higher than 3Q
FY2012(2)

Non-GAAP Reconciliation
ADJUSTED EBITDA
1. Adjusted EBITDA represents net income (loss) before interest income, interest expense, income taxes, depreciation,
amortization, and change in fair value of warrant liabilities and stock -based compensation expense. We have excluded the non-
operating item, change in fair value of warrant liabilities, because it represents a non-cash charge that is not related to USA
Technologies' (USAT) operations. We have excluded the non-cash expenses, stock-based compensation, as it does not reflect the
cash-based operations of USAT. Adjusted EBITDA is a non-GAAP financial measure which is not required by or defined under
GAAP (Generally Accepted Accounting Principles). The presentation of this financial measure is not intended to be considered in
isolation or as a substitute for the financial measured prepared and presented in accordance with GAAP, including the net
income or net loss of USAT or net cash used in operating activities. Management recognizes that non-GAAP financial measures
have limitations in that they do not reflect all of the items associated with USAT's net income or net loss as determined in
accordance with GAAP, and are not a substitute for or a measure of USAT's profitability or net earnings. Adjusted EBITDA is
presented because USAT believes it is useful to investors as a measure of comparative operating performance and liquidity, and
because it is less susceptible to variances in actual performance resulting from depreciation and amortization and non-cash
charges for changes in fair value of warrant liabilities and stock-based compensation expense.

1. Fair value of warrant liability: Assumes no increase in the fair value of USAT’s warrant liabilities at December 31, 2012 compared to
the fair value of the warrant liabilities at September 31, 2012. Changes in fair value of USAT’s warrant liabilities create a non-cash
expense and/or income in the Consolidated Statement of Operations.
the fair value of the warrant liabilities at September 31, 2012. Changes in fair value of USAT’s warrant liabilities create a non-cash
expense and/or income in the Consolidated Statement of Operations.
2. Connections: Assumes USAT is able to maintain its existing level of connections, which were approximately 155,000 as last reported
by USAT and that USAT adds new connections at a minimum level of approximately 8,000 per quarter.
by USAT and that USAT adds new connections at a minimum level of approximately 8,000 per quarter.
3. Margins and Expenses: Assumes USAT maintains or slightly improves gross margin percent and maintains the approximate same
level of SG&A expenses as the March 31, 2012 quarter.
level of SG&A expenses as the March 31, 2012 quarter.
4. Regulated debit interchange rates: Assumes (1) USAT renews its existing agreement with Visa expiring in October 2012 or (2)
regulated debit interchange rates promulgated by Visa and MasterCard return to rates that existed prior to the Durbin Amendment
or (3) in the event 1 or 2 do not occur, USAT is successful in implementing its Two-Tier Pricing Program with customers so any
increased interchange rates can be passed through by them to end users.
5. Proxy contest: Assumes there is no negative impact on customer retention, existing connections, rate of new connections to the
ePort Connect service, or costs or charges associated with the proxy contest incurred or accrued during the December 31, 2012
quarter.
ePort Connect service, or costs or charges associated with the proxy contest incurred or accrued during the December 31, 2012
quarter.
Financial Assumptions Related to December 31, 2012 Net Income Expectation
• Based upon our improved performance and visibility as a result of
efforts to increase recurring service revenues, reduce expenses and
enhance gross and operating margins
efforts to increase recurring service revenues, reduce expenses and
enhance gross and operating margins
We expect USAT will achieve quarterly net
income for the quarter ending December 31,
2012.
income for the quarter ending December 31,
2012.
FINANCIALS/RESULTS

Financial Improvements Scorecard
FINANCIALS/RESULTS
• Considerably improved.
• Reduced costs by leveraging growing connected base,
strategic partnerships, innovation
• Considerably Improved.
• Leveraging growing connected base, strategic
partnerships, innovation
• Healthy balance sheet
• First USAT credit line commitment letter due to
improved operational performance
Financial Improvements Scorecard
• Continued demonstrated growth
• Growth platforms that drive customer loyalty and
recurring revenue
REVENUES
GROSS
MARGINS
MARGINS
OPERATING
MARGINS
MARGINS
LIQUIDITY

• Positioned to capture benefits of market shift to cashless
• Growing recurring revenue customer & connection base
• Growth strategies building scale and closing in on profitability
• New verticals and expanded service opportunities
SUMMARY

IN THE NEWS
Visa London 2012 Olympic Games Trip For Life
Sweepstakes to be promoted on USA Technologies Network
Sweepstakes to be promoted on USA Technologies Network
Announced June 26, 2012

Visa Olympic Ad
http://www.youtube.com/watch?v=JodSbCX_tKw

Q & A

SHAREHOLDERS MEETING
June 28, 2012