Attached files
| file | filename |
|---|---|
| EX-10.30 - EXHIBIT 10.30 - CANTALOUPE, INC. | ex10-30.htm |
| EX-32 - EXHIBIT 32 - CANTALOUPE, INC. | ex32.htm |
| EX-31.2 - EXHIBIT 31.2 - CANTALOUPE, INC. | ex31-2.htm |
| EX-31.1 - EXHIBIT 31.1 - CANTALOUPE, INC. | ex31-1.htm |
| EX-23.1 - EXHIBIT 23.1 - CANTALOUPE, INC. | ex23-1.htm |
| EX-10.29 - EXHIBIT 10.29 - CANTALOUPE, INC. | ex10-29.htm |
| EX-10.31 - EXHIBIT 10.31 - CANTALOUPE, INC. | ex10-31.htm |
| EX-10.32 - EXHIBIT 10.32 - CANTALOUPE, INC. | ex10-32.htm |
| EX-10.23 - EXHIBIT 10.23 - CANTALOUPE, INC. | ex10-23.htm |
UNITED STATES
SECURITIES AND EXCHANGE COMMISSION
Washington, D.C. 20549
FORM 10-K
|
x
|
ANNUAL REPORT PURSUANT TO SECTION 13 OR 15(D) OF THE SECURITIES EXCHANGE ACT OF 1934
|
|
For the fiscal year ended June 30, 2011
|
|
OR
|
|
o
|
TRANSITION REPORT PURSUANT TO SECTION 13 OR 15 (d) OF THE EXCHANGE ACT OF 1934
|
|
For the transition period from ____________________ to _____________________
|
Commission file number 000-50054
|
USA Technologies, Inc.
|
|
|
|
(Exact name of registrant as specified in its charter)
|
||
|
Pennsylvania
|
|
23-2679963
|
|
|||
|
(State or other jurisdiction of incorporation or organization)
|
(I.R.S. Employer Identification No.)
|
|||||
|
100 Deerfield Lane, Suite 140, Malvern, Pennsylvania
|
|
19355
|
|
|||
|
(Address of principal executive offices)
|
(Zip Code)
|
|||||
|
(610) 989-0340
|
|
|||||
|
(Registrant’s telephone number, including area code)
|
||||||
|
Securities registered pursuant to Section 12(b) of the Act:
|
||||||
|
Title of Each Class
|
|
Name Of Each Exchange On Which Registered
|
|
|||
|
Common Stock, no par value
Series A Convertible Preferred Stock
Warrants to Purchase Common Stock
|
The NASDAQ Stock Market LLC
|
|||||
Securities registered pursuant to Section 12(g) of the Act: None
Indicate by check mark if the registrant is a well-known seasoned issuer, as defined in Rule 405 of the Securities Act.
Yes o No x
Indicate by check mark if the registrant is not required to file reports pursuant to Section 13 or Section 15(d) of the Act.
Yes o No x
Indicate by check mark whether the registrant has submitted electronically and posted on its corporate Web site, if any, every Interactive Data File required to be submitted and posted pursuant to Rule 405 of Regulation S-T (§232.405 of this chapter) during the preceding 12 months (or for such shorter period that the registrant was required to submit and post such files).
Yes o No o
Indicate by check mark whether the registrant (1) has filed all reports required to be filed by Section 13 or 15(d) of the Securities Exchange Act of 1934 during the preceding 12 months (or for such shorter period that the registrant was required to file such reports), and (2) has been subject to such filing requirements for the past 90 days.
Yes x No o
Indicate by check mark if disclosure of delinquent filers pursuant to Item 405 of Regulation S-K is not contained herein, and will not be contained, to the best of registrant’s knowledge, in definitive proxy or information statements incorporated by reference in Part III of this Form 10-K or any amendment to this Form 10-K. x
Indicate by check mark whether the registrant is a large accelerated filer, an accelerated filer, a non-accelerated filer, or a smaller reporting company. See the definitions of “large accelerated filer”, “accelerated filer”, and “smaller reporting company” in Rule 12b-2 of the Exchange Act.
Large accelerated filer o Accelerated filer o Non-accelerated filer o Smaller reporting company x
Indicate by check mark whether the registrant is a shell company (as defined in Rule 12b-2 of the Act).
Yes o No x
The aggregate market value of the voting common equity securities held by non-affiliates of the Registrant was $26,186,473 as of the last business day of the most recently completed second fiscal quarter, December 31, 2010, based upon the closing price of the Registrant’s Common Stock on that date.
As of August 31, 2011, there were 32,285,690 outstanding shares of Common Stock, no par value.
USA TECHNOLOGIES, INC.
TABLE OF CONTENTS
|
PAGE
|
||||||
|
4
|
||||||
|
20
|
||||||
|
28
|
||||||
|
28
|
||||||
|
29
|
||||||
|
31
|
||||||
|
32
|
||||||
|
40
|
||||||
|
41
|
||||||
|
42
|
||||||
|
42
|
||||||
|
42
|
||||||
|
43
|
||||||
|
46
|
||||||
|
60
|
||||||
|
62
|
||||||
|
63
|
||||||
|
64
|
||||||
2
SPECIAL NOTE REGARDING FORWARD-LOOKING STATEMENTS
This Form 10-K contains certain forward-looking statements within the meaning of Section 21E of the Securities Exchange Act of 1934, as amended, regarding, among other things, the anticipated financial and operating results of the Company. For this purpose, forward-looking statements are any statements contained herein that are not statements of historical fact and include, but are not limited to, those preceded by or that include the words, “estimate,” “could,” “should,” “would,” “likely,” “may,” “will,” “plan,” “intend,” “believes,” “expects,” “anticipates,”
“projected,” or similar expressions. Those statements are subject to known and unknown risks, uncertainties and other factors that could cause the actual results to differ materially from those contemplated by the statements. The forward looking information is based on various factors and was derived using numerous assumptions. Important factors that could cause the Company’s actual results to differ materially from those projected, include, for example:
|
|
●
|
general economic, market or business conditions;
|
|
|
●
|
the ability of the Company to generate sufficient sales to generate operating profits, or to sell products at a profit;
|
|
|
●
|
the ability of the Company to raise funds in the future through sales of securities;
|
|
|
●
|
the ability of the Company to obtain commercial acceptance of its products and services;
|
|
|
●
|
the ability of the Company to compete with its competitors to obtain market share;
|
|
|
●
|
whether the Company’s customers purchase or rent ePort devices or our other products in the future at levels currently anticipated by our Company, including our Jump Start Program;
|
|
|
●
|
whether the Company’s customers continue to operate or commence operating ePorts received under the Jump Start Program or otherwise at levels currently anticipated by the Company;
|
|
|
●
|
whether the Company’s customers continue to utilize the Company’s transaction processing and related services, as our customer agreements are generally cancelable by the customer on thirty to sixty days’ notices;
|
|
|
●
|
whether the recent significant increase in the interchange fees to be charged by Visa and MasterCard for small ticket debit card transactions would adversely affect our business, including our revenues, gross profits, and anticipated future connections to our network;
|
|
|
●
|
whether the Company would be able to pass along to its customers the recent significant increase in interchange fees charged by Visa and MasterCard for small ticket debit card transactions without those customers cancelling their contracts with us;
|
|
|
●
|
the ability of the Company to obtain sufficient funds through operations or otherwise to repay its debt obligations, or to fund development and marketing of its products;
|
|
|
●
|
the ability of the Company to satisfy its trade obligations included in accounts payable and accrued liabilities;
|
|
|
●
|
the ability of the Company to predict or estimate its future quarterly or annual revenues and expenses given the developing and unpredictable market for its products and the lack of established revenues;
|
|
|
●
|
the ability of the Company to retain key customers from whom a significant portion of its revenues is derived;
|
|
|
●
|
the ability of a key customer to reduce or delay purchasing products from the Company; and
|
|
|
●
|
as a result of the slowdown in the economy and/or the tightening of the capital and credit markets, our customers may modify, delay or cancel plans to purchase our products or services, and suppliers may increase their prices, reduce their output or change their terms of sale.
|
Although we believe that the expectations reflected in the forward-looking statements are reasonable, we cannot guarantee future results, levels of activity, performance, or achievements. Actual results or business conditions may differ materially from those projected or suggested in forward-looking statements as a result of various factors including, but not limited to, those described above and in the “Risk Factors” section of this Form 10-K. We cannot assure you that we have identified all the factors that create uncertainties. Moreover, new risks emerge from time to time and it is not possible for our management to predict all risks, nor can we assess the impact of all risks on our business or the
extent to which any risk, or combination of risks, may cause actual results to differ from those contained in any forward-looking statements. Readers should not place undue reliance on forward-looking statements.
Any forward-looking statement made by us in this Form 10-K speaks only as of the date of this Form 10-K. Unless required by law, we undertake no obligation to publicly revise any forward-looking statement to reflect circumstances or events after the date of this Form 10-K or to reflect the occurrence of unanticipated events.
3
USA TECHNOLOGIES, INC.
OVERVIEW
We are a provider of technology-enabled solutions that facilitate electronic payment transactions and value-added services within the unattended Point of Sale (“POS”) market and a leading provider in the small ticket, beverage and food vending industry. Since our founding in 1992, we have designed and marketed systems and solutions that facilitate electronic payment options, as well as the ability to remotely monitor, control and report on the results of distributed assets such as vending machines, kiosks, personal computers, photocopiers, and laundry equipment. Historically, these distributed assets have relied on cash for payment in the form of coins or bills, whereas, our systems
allow them to accept cashless payments such as through the use of a credit card. We derive revenues from the sale, lease and rental of our POS terminals, from license and/or service fees and transaction fees on installed POS terminals. As of June 30, 2011, the Company had approximately 119,000 devices connected to its network. The Company counts its ePort connections upon shipment of an active terminal to a customer under contract, at which time activation on its network is performed by the Company, and the terminal is capable of conducting business via the Company's network and related services. An ePort connection does not necessarily mean that the unit is actually installed
by the customer on a vending machine, or that the unit has begun processing transactions, or that the Company has begun receiving monthly service fees in connection with the unit. At the time of shipment of the ePort, the customer becomes obligated to pay the one-time activation fee, and is obligated to pay monthly service fees in accordance with the terms of the customer's contract with the Company. During the year ended June 30, 2011, the Company processed approximately 72 million cashless transactions totaling approximately $120 million, representing a 95% increase in transaction volume and a 76% increase in dollars processed from the 37 million cashless transactions
totaling over $68 million in the previous fiscal year ended June 30, 2010. Pursuant to its agreements with customers, the Company earns transaction processing fees equal to a percentage of the dollar volume processed by the Company, which are included as licensing and transaction processing revenues in its Consolidated Statements of Operations. The Company’s transaction processing volume is not indicative of the gross profit from license and transaction fees which is based upon the monthly service fees and transaction processing fees paid to us by our customers.
Our solutions consist predominately of POS electronic payment devices, proprietary operating systems, certified payment software and reporting and communication capabilities. Our solutions are able to process traditional magnetic stripe credit and debit cards, contactless credit and debit cards, as well as near-field communication (“NFC”) equipped mobile phones where consumers could make payments with their cell phones. Our proprietary POS solutions enable electronic micro-payments at unattended POS locations.
Our customers primarily consist of beverage and food vending machine owners and operators; commercial laundry operators servicing colleges, universities and multi-family housing; brand marketers wishing to provide their products or services via kiosks or vending machines; equipment manufacturers that would like to incorporate our networked devices (e.g., remote monitoring, reporting and control as well as cashless payments) into their products; and business center operators, which include hotels and audio visual companies. The functionality of our solutions includes the flexibility to execute a variety of payment applications on a single system, transaction security, connectivity options, compliance with
certification standards, and centralized, accurate, real-time sales and inventory data to manage distributed assets.
The Company also manufactures and sells energy management products which reduce the electrical power consumption of equipment, such as refrigerated vending machines and glass front coolers, thus reducing the electrical energy costs associated with operating this equipment. We derive equipment revenues from our energy management products through the sale of the product.
We have a nineteen year history in our industry, a recognized brand name, value proposition for our customers, and reputation of innovation in our product and services. We believe that the foregoing positions us to capitalize on industry trends.
THE INDUSTRY
We operate in the small ticket electronic payments industry and more specifically the unattended POS market. Our solutions facilitate electronic payments in industries that have traditionally relied on cash transactions. In addition, our solutions provide electronic monitoring and online reporting for distributed assets. We believe the following industry trends will drive growth in demand for electronic payment systems in general and more specifically within the markets we serve:
|
|
■
|
the shift toward electronic payment transactions and away from cash and checks;
|
|
|
■
|
the increase in both consumer and merchant/operator demand for electronic transaction functionality; and
|
|
|
■
|
improving POS technology and NFC equipped mobile phone payment technology.
|
4
Shift toward electronic payment transactions and away from cash and checks
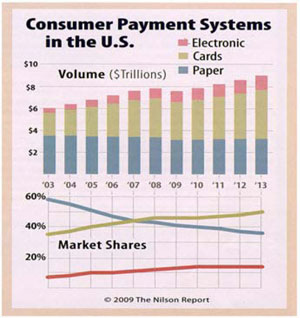
There has been a shift away from paper-based methods of payment, including cash and checks, towards electronic-based methods of payment. While consumers continue to use checks and cash to pay for goods and services, there is a migration towards the use of card-based payment to purchase items. According to The Nilson Report, a news and research publication on consumer payment systems, electronic payment transaction volume surpassed paper-based transaction volume for the first time in 2006, continuing the trend of migration of consumer transactions from paper-based to electronic payments. According to the December 2009 Nilson Report, the four card-based systems—credit, debit, prepaid, and electronic
benefits transfer—generated $3.59 trillion in the United States in 2009. The number of payment transactions using credit cards, debit cards, prepaid cards, and EBT cards totaled 66.74 billion in 2008—up 6.7% from 2007. By 2013, card-based purchases are projected to reach nearly $4.5 trillion, with over 89 billion transactions projected for this same period.
Increase in Consumer and Merchant/Operator Demand for Electronic Payments
Increase in Consumer Demand. The unattended, vending and kiosk POS market has historically been dominated by cash purchases. However, oftentimes, cash purchases at unattended POS locations represent a cumbersome transaction for the consumer because they do not have the correct monetary value (paper or coin), or the consumer does not have the ability to convert their bills into coins. We believe electronic payment system providers such as USA Technologies that can meet consumers’ demand within the unattended market will be able to offer retailers, card associations, card issuers and payment processors and business owners an expanding value
proposition at the POS.
Increase in Merchant/Operator Demand. Increasingly, merchants and operators of unattended payment locations (e.g., vending machines, car wash, tabletop games, etc.) are utilizing electronic payment alternatives. Several of the Company’s customers have been able to drive increased revenue of their distributed assets through this expanded market opportunity. Furthermore, owners have demonstrated the ability to increase the price of their goods with little to no decline in transaction volume. In addition, electronic payment systems provide merchants and operators real-time sales and inventory data utilized for back-office reporting and
forecasting, helping them to manage their business.
Increase in Demand for Networked Assets. M2M technology includes capturing value from wireless modules and electronic devices to improve business productivity and customer service. The term M2M describes any kind of 2-way communication system between geographically distributed devices through a centrally managed software application without human intervention. According to M2M Magazine (“Is it Touching Our Everyday Lives?”, M2M, November 18, 2008), there are over 50 billion machines capable of being networked.
Networked assets provide improved internal business processes such as energy management systems capable of collecting diagnostic information and communicating with the operator’s host information system to optimize energy consumption. Networked assets also have the ability to remotely monitor merchandise to maximize sales and track inventory in real-time. In addition, networked assets provide valuable information regarding consumers’ purchasing patterns and payment preferences allowing operators to more effectively reach and satisfy consumers. Networked assets allow information to be centralized and reported in electronic format enabling the data to be more accurately and thoroughly
analyzed and digitally presented and available online. According to the M2M Magazine article cited above, the networked asset industry is in its nascency, and electronic solution providers that can provide interconnectivity between distributed assets offer consumers, retailers, machine operators and manufacturers an expanded value proposition by optimizing the capabilities of a distributed asset.
5
POS Technology and NFC Equipped Mobile Phone Payment Improvements
Advances in Computing. History has shown that advances in microprocessing technology, storage capacity and software are enabling increasing complexity and functionality of electronic payment systems at unattended POS locations. Such advances are expanding the range of services and functionality offered by electronic payment systems, including credit and debit, prepaid cards, gift cards and loyalty card programs, electronic bill payment and electronic check truncation. In addition, advances in technology, computing and telecommunications over the past decade have reduced the cost of production and operations of more sophisticated electronic payment
systems, thereby reducing the barrier of adoption for merchants and operators.
Card Innovation at the POS. Recent industry developments such as the emergence of NFC or contactless equipped mobile phone payment have resulted in the POS becoming an important area of differentiation for card associations, card issuers and payment processors. As the market for issuing credit cards has become more saturated in the U.S., card associations and card issuers are differentiating their brands by expanding their offerings. Payment processors are also differentiating themselves by expanding their offerings as front-end authorization and back-end clearing and settlement have become more commoditized. Card associations, card issuers
and payment processors are differentiating their offerings, in part, by offering value-added applications and incorporating innovative technologies including contactless / NFC equipped mobile phone payment technology.
Payment Terminal Innovations at the POS. NFC and mobile payments are projected to continue on an upward trajectory, with 65% of total tablets and smartphones equipped with NFC payment capabilities and as many as 800 million consumers with NFC-enabled handsets by 2014 (Goldman Sachs Equity Research Report, June 9, 2011). This same report cites that Google believes that there are approximately 300,000 existing POS terminals worldwide that are compatible with the Google Wallet, with about 120,000 of those in the US. With approximately 50,000 NFC and mobile payments ready ePorts shipped to our customers, we believe that the continued increase in consumer
preferences towards contactless payments may represent a significant growth opportunity for the Company.
SPECIFIC MARKETS WE SERVE
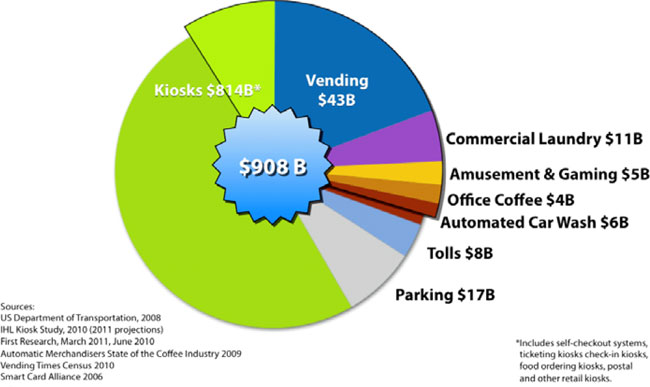
Our current customers are primarily in the self-serve, small ticket retail markets including beverage and food vending and kiosk, commercial laundry, car wash, amusement and gaming, and office coffee. While these industry sectors represent only a small fraction of our total market potential, as depicted below, these are the areas where we have gained the most traction. In addition to being our primary markets, these sectors serve as a proof-of-concept for other unattended POS industry applications.
6
Vending. According to Vending Times’ 2010 Census of the Industry, annual U.S. sales in the vending industry sector were estimated to be approximately $43 billion. The market segment can be addressed by our end-to-end solution consisting primarily of vended products retailing for $1.00 or greater. According to this census, the vending industry experienced a 6% decline in 2010 versus 2009, due in large part to the downturn in the economy and the decrease in serviceable locations such as manufacturing plants, but the contraction of growth prompted operators to look for additional ways to make up revenue. According to Automatic Merchandiser State of
the Industry Report 2011, operators increased their investment in technology to improve business efficiencies and increase margins. Among these technology investments, 3.5% of operators surveyed indicated that they had invested in cashless payments system while 1.7% indicated they had installed a remote monitoring system. With the continued shift to electronic payments and the advancement in mobile and POS technology, we believe the traditional beverage and food vending industry will continue to look to cashless payments systems to increase sales and margins and help growth.
Kiosk. According to IHL Consulting Group Market Study dated July 1, 2010, approximately $678 billion was transacted through self‐service kiosks in 2009, which represents an increase of 9.7% from the previous year. Furthermore, IHL projects that spending at self-service kiosks will grow approximately 10% during 2010 and that demand for self-service kiosks should push sales at these terminals to over $1 trillion by 2014. Kiosks are becoming increasingly popular as self-service “specialty” shops within larger retail environments. Value-added services, such as photo
enlargement and custom imaging are a prominent example, located within many major retailers. As merchants continue to seek new ways to reach their customers outside of retail locations and mobile and electronic payment technology make this expansion more plausible, we believe electronic payment system providers who can service the payment needs of kiosk-driven transactions will be able to offer retailers, card associations, card issuers and payment processors an expanding value proposition at the POS.
In 2008/2009, Single Cup/Office Coffee Service (“OCS”) sales posted a five percentage point decline from the prior 12-month period, marking the first setback since 2003/2004. OCS revenues totaled $3.73 billion in 2009/2010, according to the 2010 Automatic Merchandiser State of the Coffee Service Industry Report, September 2010. According to this same publication, the 4-year gain from 2003/2004 to 2007/2008 was the longest consistent growth trend in the industry’s history, driven by higher pricing and investment in better quality products and equipment, and the decline in sales was a direct result of declining worksite populations and employer cost cutting. According to the National Coffee
Association’s 2008 National Coffee Drinking Trends survey, 2007 was the first year that daily coffee consumption among adults surpassed soft drink consumption. The 2011 study listed 40% of the 18-24 year olds who responded as drinking coffee daily, up from 31% in 2010 with a total of 58% of the population surveyed saying they drank coffee in the past day, up from 56% in 2010 but down 60% in 2009. In October 2008, entered into a three year contract with Starbucks pursuant to which Starbucks will offer coffee in unattended kiosk locations using the ePort G-8 cashless payment system. As of the date hereof, there are a couple of hundred ePort devices being deployed in unattended kiosks pursuant to this agreement.
Commercial Laundry. According to a 2010 Report on Dry Cleaning and Laundry Services published by Anything Research, the current size of the laundry services market is $22.4 billion, and although the industry experienced a revenue decline of 5% in 2009 compared to 2008, long term forecasts for the industry project positive growth. The Dry Cleaning and Laundry Facilities Industry Profile published by First Research dated July 11, 2011, states that the laundry services industry includes about 30,000 companies with combined annual revenue of approximately $10 billion. Major companies include Coinmach Service, DRYCLEAN USA, Mac-Gray, and Martin Franchises. The
industry includes about 20,000 companies that provide retail laundry and dry cleaning services, and 10,000 that provide services through coin-operated laundromats. The coin-laundry segment is fragmented: the 50 largest firms generate about 40% of revenue. This segment of the business is made up of both coin-operated laundries and coin-operated machines located in multi-family housing developments such as apartments, condominiums and universities. The Coin Laundry Association’s website, www.coinlaundry.org, points out that “...coin laundries thrive in periods of both growth and recession. During periods of recession, when home ownership decreases, the self-service laundry market expands as more people are unable to afford to repair, replace or purchase new washers and dryers, or as they move to apartment housing with inadequate or nonexistent laundry facilities.” The
self-service laundry market consists of an estimated primary customer base of approximately 96 million people living in rental housing, as of the 2010 U.S. Census. A secondary customer base consists of the over 2 million resident college and university students in the US (U.S. Census Bureau, 2004). We reach our target market primarily via the seven largest laundry operators in the US.
Business Centers. According to the American Hotel & Lodging Association, the hotel and lodging industry was a nearly $134 billion industry with approximately 47,000 hotels in the United States and 300,000 worldwide in 2008. With the increased globalization of our economies and the increased need for travel for both personal and business reasons, there remains a demand for unattended business center availability in hotels, with ever-greater percentages of travelers needing and expecting use of computers, printers, fax machines, copiers, and other business services.
OUR COMPETITIVE STRENGTHS
We believe that we benefit from a number of advantages gained through our nineteen year history in our industry. They include:
Trusted Brand Name. The USA Technologies brand has a strong national reputation for quality, reliability and innovation. We believe that card associations, payment processors and merchants/operators trust our system solutions to handle financial transactions in a secure operating environment. Our trusted brand name is best exemplified through several one-way exclusive relationships, each averaging three years in duration, which we have solidified with several leading organizations within the unattended POS industry, including Merit/AMI Entertainment and Air-Serv.
7
Large Installed Base. We have a large installed base of unattended POS electronic payment systems. As of June 30, 2011, we had approximately 119,000 connections to our network. Our technology provides POS payment solutions as well as real-time POS and diagnostic data to our customers. Our customers maintain both the payment solution as well as the real-time data with one provider rather than through multiple providers. Our installed base supports our sales and marketing infrastructure by enhancing our ability to establish or expand our market position. Finally, our
installed base provides several opportunities for referrals for new business, either from the merchant or operator of the deployed asset or through one of our several strategic relationships.
Attractive Value Proposition for Our Customers. We believe that our solutions provide our customers an attractive value proposition. Our solutions make possible increased purchases by consumers who in the past were limited to the physical cash value on hand while making a purchase at an unattended terminal. Rather than search for coins or dollar bills to feed a vending machine, customers have the option of paying by card. We believe our solutions make possible increased convenience and a broader universe of potential customers – those with cash or electronic forms of payment. Furthermore, the cost of our solution continues to decrease
making it more economically attractive for our customers to install our devices in their machines. Our historical data demonstrates that approximately 26% of all of the transactions on traditional beverage and food vending machines utilizing our ePort® terminals consist of credit/debit card transactions.
Large and Increasing Scale. During the year ended June 30, 2011, we generated total licensing and processing fees of $16.4 million, successfully processed approximately 72 million transactions accounting for more than $120 million in purchases and, as of June 30, 2011 had approximately 119,000 connections to our network. We believe that our scale and footprint enable us to market and distribute our products more effectively and in more markets than most of our competitors, and to provide our customers with innovative, comprehensive and reliable system solutions.
Leading Research and Development. Our research and development initiatives focus on adding features and functionality to our system solutions through the development and utilization of our processing and reporting network and new technology. Since we began operations in 1992, we have been granted 81 patents and currently have 12 patent applications pending. We have developed innovative and reliable unattended POS electronic payment devices and solutions over the past several years. For example, our most recent cashless vending solution, the ePort EDGE™, was made available for sale to our customers during the fourth quarter of the 2009
fiscal year. Our ePortG-8 is an integrated one-piece design, combining the card-reader and processor while enabling magnetic swipe card transactions and NFC equipped mobile phone payment, and is 65% smaller than our previous G-7 model.
NFC Ready. USA Technologies’ ePort G series and ePort Connect service would accept and process NFC and/or mobile payments at the point of sale. The Company partnered with Visa, MasterCard and others for a significant rollout of these devices, resulting in approximately 50,000 NFC and mobile-ready ePort devices shipped to our customers. The Company continues to connect its current G-series model, the ePort G8 to its network, putting it in a position to benefit from any growth in consumer adoption of these payment methods.
One-Stop Shop, End-to-End Solution. We believe that our ability to bundle the services included in our cashless payment solution, as well as the ability to tailor them to individual customer needs, makes it easy and efficient for our customers to adopt and deploy our technology, and results in a service unmatched in the small ticket self-service retail vending market today. Other cashless payment solutions available in the market today require the operator to set up their own accounts for cashless processing, manage multiple service providers (i.e. hardware terminal manufacturer, wireless network provider and credit card processor), as well as to implement
their own cashless systems. Our solution provides all of the following, under one cohesive service umbrella;
|
|
●
|
A broad product line of devices or software, consisting of the ePort G8 which can accept multiple forms of cashless payment, from swipe and contactless and the 2010 National Automatic Merchandising Association (“NAMA”) -Innovation-Award-winning ePort EDGE.
|
|
|
●
|
Unique payment programs such as our JumpStart and leasing programs, which help operators acquire the ePort hardware without an up-front capital investment.
|
|
|
●
|
Our comprehensive end-to-end ePort Connect cashless payment service which includes merchant account set-up, wireless activation, merchant services, over-the-air updates, and 24x7 customer service and support.
|
|
|
●
|
Business deployment planning services to help operators successfully deploy cashless payment systems. This program is based on extensive market data, which helps guide operators to the locations where cashless vending machines would be most successful.
|
8
OUR GROWTH OPPORTUNITY
Our objective is to enhance our position as a leading provider of technology that enables electronic payment transactions and value-added services at small-ticket, self-service, retail locations such as traditional beverage and food vending, kiosks and commercial laundry. The key elements of our strategy are to:
Leverage Existing Customers/Partners. We have a solid base of key customers across multiple markets (vending, kiosk, etc.) that have deployed our solutions. We have worked to build these relationships, drive future deployments, and develop customized network interfaces. Our customers have seen the benefits of our products and services first-hand and represent the largest opportunity to scale our solution. These customers are a key component of our plan to drive sales.
Expand Distribution in Core Markets. We have worked to develop a strong market presence in the vending and energy markets. Increasing sales and distribution to our largest customers is important to the long-term success of the Company, but we are intently focused on building a broader base of customers within these core markets to drive long term revenue and value. Our efforts in this regard have led to the addition of approximately 900 new customers during the fiscal year 2011.
Further Penetrate Attractive Adjacent Markets. We plan to continue to increase the functionality of our system solutions to address the specific needs of various markets. We currently focus on specific segments of unattended POS markets, including traditional beverage and food vending, kiosk, commercial laundry and business center industry sectors. We believe we have the ability to penetrate a much larger addressable market by selling or licensing our technologies to equipment makers of everyday devices such as toll booths, tire inflation and vacuum equipment, car washes and countless other devices. Using wired and/or wireless networks and centralized,
server-based software applications, managers can remotely monitor, control, and optimize a network of devices regardless of where they are located. Networked devices enable cashless transactions, sales analysis, remote monitoring, and optimized machine maintenance.
New Product Innovation. We are a leading innovator of technology that enables electronic payment transactions and value-added services at the unattended POS locations. We will continue enhancing our solutions in order to satisfy our customers and the end-consumers relying on our products at the POS locations. Our product innovation team enhances the design, size, and speed of data transmission, as well as security and compatibility with other electronic payment solution providers’ technologies. We believe our continued product innovation will lead to further adoption in the unattended POS payments market. For example, our newer
ePort G-8™ solution is 65% smaller than our previous model, and the current retail cost of the ePort EDGE™ is $199 per device.
Leverage Intellectual Property. We have been granted 81 patents which assert various claims, including claims relating to unattended payment processing, networking and energy management devices. In addition, we own numerous trademarks, copyrights, design rights and trade secrets. We will continue to leverage this intellectual property to add value for customers, attain an increased share of the market, address competition and attempt to generate licensing revenues.
Capitalize on High Growth Opportunities in International Markets. We are currently focused on the U.S. and Canadian market for our ePort devices and related network but may seek to establish a presence in emerging, high growth electronic payment markets in Europe, Asia and Latin America. In order to do so, we would have to invest in additional sales and marketing and research and development resources targeted towards these regions. Our energy management devices have been shipped to customers located in the U.S., Canada, Mexico, United Kingdom, Germany, France, Japan, Australia, and the Philippines.
Capitalize on the growing NFC and mobile payments trends. NFC and mobile payments are projected to continue on an upward trajectory, with 65% of total tablets and smartphones equipped with NFC payment capabilities and as many as 800 million consumers with NFC-enabled handsets by 2014 (Goldman Sachs Equity Research Report, June 9, 2011). This same report cites that Google believes that there are approximately 300,000 existing POS terminals worldwide that are compatible with the Google Wallet, with about 120,000 of those in the U.S. With approximately 50,000 NFC and mobile payments ready ePorts shipped to our customers, the Company believes that the continued
increase in consumer preferences towards contactless payments represents a significant growth opportunity for the Company.
OUR PRODUCTS
Our products are available in several distinctive modular configurations, offering our customers flexibility to install a POS solution that best fits their needs and customer demands.
Intelligent Vending™ and Kiosk. As of June 30, 2011, we have approximately 110,000 ePort® and other cashless devices that are connected to our ePort Connect® solution for the vending and kiosks industries. Our ePort Connect® solution for the vending and kiosk industries enables cashless payments at unattended POS machines. ePort Connect® is an
end-to-end suite of cashless payment and telemetry services for the self service retail industries.
The Company counts its ePort connections upon shipment of an active terminal to a customer under contract, at which time activation on its network is performed by the Company, and the terminal is capable of conducting business via the Company’s network and related services. An ePort connection does not necessarily mean that the unit is actually installed by the customer on a vending machine, or that the unit has begun processing transactions, or that the Company has begun receiving monthly service fees in connection with the unit. At the time of shipment of the ePort, the customer becomes obligated to pay the one-time activation fee, and is
obligated to pay monthly service fees in accordance with the terms of the customer's contract with the Company.
9
Intelligent Vending™. Our latest improvement to Intelligent Vending™ is our ePort® G-8, which provides the same benefits as the G-7, plus important new features at a lower price. The G-8 solution is 65% smaller than the G-7 and combines traditional magnetic strip and NFC equipped mobile phone payment capabilities. In addition, our ePort Edge™ product became available for sale to customers during the fourth quarter of the 2009 fiscal year. The ePort Edge™ is a one-piece design and is intended for those in the vending industry who want a magnetic swipe-only cashless system at a current retail price of $199 per
device.
Kiosk. We provide an ePort® solution that utilizes our ePort® or software client, USALive®, and our comprehensive technology support and customer service to offer an electronic payment option and web-based remote monitoring and management for all kiosk types. Our ePort® solution enables kiosks to sell an increased variety of items and at a higher price point as compared to cash-only kiosks as consumers are
typically limited to the amount of available cash-on-hand. Kiosks permit a host of new services to become available at the point-of-demand, such as Sony’s self-service and Picture Station kiosks, where consumers can produce prints from their own digital media. In addition, our ePort® solution powers the POS solutions for unattended kiosk providers such as Merit Megatouch, Fantasy Photobooth and AIR-serv. In October 2008 Starbucks chose our ePort® mobile solution to deliver their product to customers through coffee kiosks.
eSuds™. eSuds™ is our solution developed for the commercial laundry industry. eSuds™ offers an e-mail alert system to notify users regarding machine availability, cycle completion, and other events and supports a variety of value-added services such as custom advertising or subscription-based payments.
Our eSuds™ system enables laundry operators to provide customers cashless transactions via the use of their credit cards, debit cards and other payment mediums such as student IDs. In addition, our eSuds™ service reduces operational costs through utilization of our remote monitoring technology, thereby maximizing the scheduling of service visits and increasing machine up-time. The system increases customer satisfaction through improved maintenance, higher machine availability, specialized services (i.e., e-mail alerts to indicate that laundry cycle is finished) and the convenience of non-cash transactions.
Installations of our eSuds™ product have been completed at 56 college and universities and are serviced on approximately 7,600 washer and dryer machines. For example, installations of our eSuds™ product have been completed at Carnegie Mellon University, Rutgers University, Case Western Reserve, Johns Hopkins University, Temple University and others. We are working with resellers and distributors, such as Caldwell & Gregory, to install eSuds™ at other colleges and universities. The Company also has a presence in the multi-family-housing laundry market through its relationship with CoinMach, a firm which has indicated that it operates approximately 850,000 laundry machines in North
America.
As of June 30, 2011, we had 830 eSuds™ room controllers servicing approximately 7,600 washer and dryer machines. We count an eSuds as a connection upon actual installation of our device on a washer or dryer or room controller.
Business Express®. We originally developed Business Express® to provide self-service business center solutions to the Hotel and Motel industry. With the introduction of the ePort® SDK and ePort® Transact® our target market has expanded to include printer and copier dealers and manufacturers. The Business Express® solution includes the ePort® SDK for computer-based transactions such as a Public PC®, and the ePort® Transact®, which enables printers and copiers to accept credit and debit cards for payment. These products are coupled with our customer
service support and ePort Connect® back-end system for payment processing and other value-added services.
ePort® Transact®, which became available in March 2010, is the latest version of our original payment technology system developed for self-service business center devices such as printers and copy machines. It is a cashless-transaction-enabling terminal that permits customers to use office equipment with a swipe of their credit or debit card. The ePort® Transact® can be sold as a stand-alone device to hotel, motel and other locations with business center needs, or to printer and copier dealers and manufacturers to be sold to their customers with the cashless option already installed.
As of June 30, 2011, we have several hundred Business Express® units installed nationwide with several of the major hotel chains.
Energy Management Products. Our Company offers energy conservation products (“Energy Misers” ®) that reduce the electrical power consumption of various types of existing equipment, such as vending machines, glass front coolers and other “always-on” appliances by allowing the equipment to selectively operate in a power saving mode when the full power mode is not necessary. Each of the Company’s Energy Miser® products utilizes occupancy sensing technology to determine when the surrounding area is vacant
or occupied. The Energy Miser® then utilizes occupancy data, room and product temperatures, and an energy saving algorithm to selectively control certain high-energy components (e.g. compressor and fan) to realize electrical power savings over the long-term use of the equipment. Customers of our VendingMiser® product benefit from reduced energy consumption costs, depending on regional energy costs, machine type, and utilization of the machine. Our Energy Misers® also reduce the overall stress loads on the equipment, helping to reduce associated maintenance costs.
10
The Energy Miser® family of energy-control devices includes:
VendingMiser® - installs in a cold drink vending machine and reduces the electrical power consumption of the vending machine.
CoolerMiser™ - reduces the electrical energy used by sliding glass or pull open glass-front coolers that contain non-perishable goods.
VM2IQ® and CM2IQ® - the second generation of the VendingMiser® and CoolerMiser™ devices that is installed directly inside the machine and has the capability to control the cooling system and the advertising lights separately.
SnackMiser® - reduces the amount of electricity used by non-refrigerated snack vending machines.
PlugMiser™ - reduces the amount of electricity used by all types of plug loads including those found in personal or modular offices (printers, personal heaters, and radios), video arcade games, and more.
We do not consider our energy management products as connections to our network.
OUR SERVICES
Through ePort Connect®, we offer end-to-end services to support our ePort devices and ePort SDK.
The ePort Connect® service includes card payment and processing services and M2M operational data such as:
Card Processing Services. Through our existing relationships with card processors and card associations, we provide merchant account and terminal ID set up, pre-negotiated discounted fees on small ticket purchases and direct electronic funds transfers EFTs to our customer’s bank account for all settled card transactions as well as ensure compliance with current processing regulations.
Wireless Connectivity. We manage the wireless SIM account activation, distribution, and the relationship with wireless providers for our customers.
Customer/Consumer Services. We support our installed base by providing 24-hour help desk support, repairs, and replacement of impaired system solutions. In addition, as the merchant of record on all transactions, all inbound billing inquiries are handled through a 24-hour help desk, thereby eliminating the need for merchants and operators to be bothered with customer billing inquiries and potential chargebacks.
Online Sales Reporting and Remote Management. Effective remote management is essential to cost effective deployment, maintenance and management of unattended POS locations. Via the USALive online reporting system, we provide reporting of credit and cash transactions, user configuration, reporting by machine and region, by date range and transaction type, data reports for operations and finance, graphical reporting for sales and to customers, and condition monitoring for equipment service as well as activation of new devices and location redeployments.
Over-the-Air Update Capabilities. Automatic over-the-air updates to software, settings, and security protocol from our network to our ePort card reader keep our customers’ hardware up-to-date and enable customers to benefit from any advancement made after their hardware or software purchase.
We enter into a processing and licensing agreement, or ePort Connect Services Agreement, with our customers pursuant to which we act as the exclusive provider of cashless financial services for the customer’s distributed asset, and the customer agrees to pay us an activation fee, monthly service fees, and transaction processing fees. Our agreements are generally cancelable by the customer upon thirty to sixty days notice to us.
OUR TECHNOLOGY-BASED SOLUTION
We believe that our ability to bundle our products and services, as well as the ability to tailor them to individual customer needs, makes it easy and efficient for our customers to adopt and deploy our technology, and results in a service unmatched in the vending market today. This one-stop-shop solution includes the ePort Connect® end-to-end payment and processing services and our cashless payment device or software for distributed assets such as vending machines, kiosks, laundry equipment, car wash, amusement and gaming, office coffee and other small-ticket, self-service industries.
The Client. The Company offers its customers several different devices or software to connect their distributed assets. These range from software to hardware devices consisting of control boards, magnetic strip card readers, and NFC readers. The devices or software can be embedded inside the host equipment, such as ePort SDK software residing in the central processing unit of a Kiosk or table-top game; it can be integrated as part of the host equipment, such as our ePort® G8 or EDGE hardware that can be attached to the door of a vending machine, at a payment hub in a self service car wash; or it
can be a peripheral, stand-alone terminal, such as our eTransAct® terminal for Copier Express.
ePort® is the Company’s core device, which is currently being utilized in vending and commercial laundry applications. Our ePort® product facilitates cashless payments by capturing the payment media and transmitting the information to our network for authorization with the payment system (e.g. credit card processors). Additional capabilities of our ePort® consist of control/access management by authorized users, collection of audit information (e.g. product or service sold, date and time of sale and sales amount), diagnostic
information of the host equipment, and transmission of this data back to our network for web-based reporting.
ePort TransAct® is the latest version of the Company’s original cashless, transaction-enabling device developed for self-service business center equipment such as PCs, fax machines and copiers. Similar to the ePort®, the ePort TransAct® capabilities include control/access management, collection of sales data (e.g. date and time of sale, sales amount and product or service purchased), and transmission back to our network for reporting to customers.
11
The Connectivity Mediums. Our solutions are interconnected for the transfer of our customers’ data through our USALive® network, providing multiple connectivity options such as phone line, ethernet or wireless. Increasing wireless connectivity options, coverage and reliability have allowed us to service a greater number of customer locations. Additionally, we make it easy for our customers to deploy wireless solutions by acting as a single point of contact. We have contracted with Verizon Wireless and AT&T in the United States and Rogers Wireless in Canada in order to supply our
customers with wireless network coverage.
The Network. Our USALive® network is responsible for transmitting payment information from our terminals for processing as well as transmitting sales and diagnostic data for storage and reporting to our customers. Also, the network, through server-based software applications, provides remote management information and enables control of the networked device’s functionality. Through our network we have the ability to upload software and update devices remotely enabling us to manage the devices (e.g., change protocol functionality, software upgrades, and change terminal display
messages).
USALive® is the enabler of turnkey cashless payment processing for our customers. The network is certified with several cashless payment systems, such as credit card processors and property management systems, facilitating the authorization and settlement of credit cards, debit cards, hotel room keys and student identification cards. The network also has the capability to act as its own payment processing system for other cashless payment media, such as on-line stored value or employee payroll deduction. The network authorizes transactions, occurring at the host equipment, with the appropriate payment system and sends approval or decline
responses back to the networked device to allow or terminate the transaction for the purchase of the product or service. The network consolidates successfully approved transactions from multiple devices, batches, and then transmits these batched transactions to the payment system for settlement.
Data Security. Visa has listed the Company as a PCI DSS Compliant Service Provider in the North American region as a result of validation conducted by a third party as of January 1, 2011. The USAT listing on Visa’s list of compliant companies can be found online at http://usa.visa.com/download/merchants/cisp-list-of-pcidss-compliant-service-providers.pdf.
SALES AND MARKETING
The Company’s sales strategy includes both direct sales and channel development, depending on the particular dynamics of each of our markets. Our marketing strategy is diversified and includes media relations, direct mail, conferences and client referrals. As of August 31, 2011, the Company was marketing and selling its products through its full time staff consisting of eleven people.
Direct Sales
We sell directly to the major operators in each of our target markets. Each of our target markets is dominated by a handful of large companies, and these companies comprise our primary customer base. In the small ticket beverage and food vending sector, approximately ten large operators dominate the sector; in the commercial laundry sector, seven operators currently control the majority of the market. We also work directly with hoteliers for our eTransAct® and Business Express® products.
Within the small ticket beverage and food vending industry, our customers include soft drink bottlers and independent vending operators throughout the United States and Canada. On the soft drink bottler side, we are attempting to secure additional distribution agreements and servicing our existing customer’s requirements for cashless locations and the related network services.
Indirect Sales/ Distribution
We have entered into agreements with resellers and distributors in connection with our energy management products. We also have agreements with select resellers in the car wash, amusement and gaming and vending markets in an effort of broaden our reach and subsidize direct sales efforts in these markets.
Marketing
Our marketing strategy consists of building our brand by creating a company and product presence at industry conferences and events in order to raise visibility within our industry, create opportunity to conduct product demonstrations, and consult with potential customers one-on-one; sponsoring educational workshops with trade associations such as National Automated Merchandiser Association (“NAMA”), to educate the industry on the importance and benefits of our solution and establish our position as the industry leader; develop several case studies to illustrate the value of our products; the use of direct mail campaigns; and advertising in vertically-oriented trade publications such as Vending Times,
Automatic Merchandiser and Energy User News.
12
IMPORTANT RELATIONSHIPS
AT&T Mobility
In November 2009, we signed an amendment to our existing agreement to use AT&T’s digital wireless wide area network for transport of data, including credit card transactions and inventory management data. The initial term of the amendment is three years, expiring November 2012. At the end of the initial term, the agreement automatically renews for successive one year terms unless terminated by either party. AT&T is a provider of advanced wireless voice and data services for consumers and businesses, operating the largest digital wireless network in North America and the fastest nationwide wireless data network in the United States. We offer AT&T’s wireless services in connection with our
ePort® devices which are utilized in the traditional small ticket beverage and food vending market in the United States.
Verizon Wireless
In April 2011, we signed an agreement to use Verizon’s digital wireless wide area network for transport of data, including credit card transactions and inventory management data. The initial term of the agreement is three years, expiring April 2014. At the end of the initial term, the agreement automatically renews for successive one month periods unless terminated by either party upon thirty day’s notice. Verizon Wireless operates the nation’s fastest, most advanced 4G network and largest, most reliable 3G network. The company serves 104 million total wireless connections, including more than 88 million retail customers. We offer Verizon’s wireless services in connection with our
ePort® devices which are utilized in the traditional small ticket beverage and food vending market in the United States.
On September 21, 2011, the Company and Verizon entered into a Joint Marketing Addendum (the “Verizon Agreement”) which amended the three year agreement described above. Pursuant to the Verizon Agreement, the Company and Verizon would work together to help identify business opportunities for the Company’s products and services. Verizon may introduce the Company to existing or potential Verizon customers that Verizon believes are potential purchasers of the Company’s products or services, and may attend sales calls with the Company made to these customers. The Company and Verizon would collaborate on marketing and communications materials that would be used by each of them to educate and
inform customers regarding their joint marketing work. Verizon has the right to list the Company’s products and services in its Data Solutions Guide for use by its sales and marketing employees and in its external website. The Company has agreed to pay to Verizon a one-time referral fee for each customer introduced to the Company by Verizon that would become a customer of the Company. The Verizon Agreement is terminable by either party upon 45 days notice after six months.
Crane Payment Solutions
In December 2010, Crane Payment Solutions (“Crane”), a business unit within the Merchandising Systems Segment of Crane Co. and the Company entered into a three-year Strategic Partnership Agreement to deliver a combined cashless vending solution to Crane customers in North America. Under the agreement, USA Technologies will become the lead provider and supplier of all card processing, wireless communications and data services for Crane’s customers in conjunction with the new Currenza® cashless bill validator card reader. In addition to the card processing capabilities of the Company, the Company will provide certain hardware solutions and grant Crane a license for designated USAT patents as a
part of the relationship.
VISA
On April 1, 2009 we entered into a Contactless Terminal Support Agreement with VISA U.S.A. INC. (“VISA”), pursuant to which VISA would pay us the amount of $200 for each ePort® that we deployed prior to December 31, 2009. The agreement covered up to a maximum of 4,000 ePorts®. These ePorts® would accept credit and debit cards utilizing VISA’s contactless technology as well as VISA’s magnetic stripe payment cards. In June 2009, the agreement was amended to provide funding for up to an additional 2,500
ePorts® which may be installed on vending machines owned by The Compass Group. VISA would pay us an aggregate of $800,000 if all 4,000 ePorts® were timely deployed. Our customer (i.e., the location owner) would enter into a three-year exclusive processing agreement with us in connection with the vending machine utilizing the ePort®. The Company deployed a total of 2,961 units, or $592,200, under this agreement during the period of July 1, 2009 through December 31, 2009.
On August 16, 2010, we entered into an Acceptance and Promotional Agreement with VISA. Pursuant to the agreement, VISA agreed, among other things, to pay to the Company up to $250,000 per year, for total payments of up to $750,000. The payments to the Company are to be used by the Company over the three year term of the agreement to support and promote the installation and deployment of at least 50,000 additional ePort®, or other payment terminals, in vending machines. If the Company does not install at least 50,000 ePorts®, or other payment terminals, over the term of the three year agreement, the Company would be required to refund a pro-rata portion of the funds. Through June 30, 2011, we have
installed and made operational approximately 33,000 units under this agreement.
Compass/Foodbuy
On June 30, 2009, we entered into a Master Purchase Agreement (“MPA”) with Foodbuy, LLC (“Foodbuy”), the procurement company for Compass Group USA, Inc. (“Compass”) and other customers. As per its website, Compass is a $9.9 billion organization with locations throughout the US, Mexico, and Canada, is the leader in vending, foodservice management and support services, is the largest national vending operating company, operating 200 branches, has 18,000 locations, and is one of the leading owners and operators of vending machines in the United States. Compass is a division of UK-based Compass Group PLC.
The MPA provides, among other things, that for a period of thirty-six months, Foodbuy on behalf of Compass shall utilize USAT as the sole credit or debit card vending system hardware and related software and connect services provider for not less than seventy-five percent of the vending machines of Compass utilizing cashless payments solutions. The MPA also provides that for a period of thirty-six months, USAT shall be a preferred supplier and provider to Foodbuy and its customers, including Compass, of USAT’s products and services. The MPA provides for initial pricing for the ePort hardware and monthly service and DEX telemetry fees at USAT’s standard pricing. Foodbuy’s customers have the right
under the MPA to acquire USAT’s G-8 or Edge ePort devices through USAT’s Quick Start Program. The MPA also provides for the ability of the customer to obtain DEX telemetry services from USAT in connection with vending machines utilizing the ePort devices.
13
On July 1, 2009, USAT and Compass, in conjunction with the MPA described above, entered into a Quick Start Master Lease Agreement pursuant to which Compass could purchase USAT’s G-8 or Edge ePort devices utilizing USAT’s Quick Start Program. The Quick Start Program enables Compass to acquire USAT’s ePort through a 36 month non-cancellable lease. Under the Quick Start Program, Compass will pay USAT a monthly amount, per terminal, that includes the lease of the ePort hardware and activation fee. The total monthly payment due under the Quick Start Program would be deducted by USAT directly out of the gross revenues generated from the Compass vending machines. Compass would be able to utilize the
Quick Start Program to acquire ePorts during the three year term of the Master Purchase Agreement referred to above.
On July 1, 2009, USAT and Compass, in conjunction with the MPA described above, also entered into a new three year ePort Connect Services Agreement pursuant to which USAT will provide Compass with all card processing, data, network, communications and financial services, and DEX telemetry data services required in connection with all Compass vending machines utilizing ePorts.
Merit/AMI Entertainment
In October of 2008, we entered into an exclusive three-year agreement for the supply of ePort® devices and ePort Connect® cashless services with Merit Entertainment (“Merit”). Merit is the provider of Megatouch countertop entertainment systems and selected the ePort® software and ePort Connect® Services to help give Megatouch players the ability to pay with their debit or credit cards. Under this agreement every newly manufactured Megatouch system will
include our ePort Connect® software. Merit has indicated to us that it currently has an installed base of over 250,000 touch screen games.
JUMP START PROGRAM
In December 2009, the Company commenced a program for its customers referred to as the Jump Start Program (“Jump Start”). Pursuant to the Jump Start Program, the Company would continue to own the ePort device utilized by its customer. At the time of the shipment of the ePort device, the customer is obligated to pay to the Company the standard one-time activation fee, is obligated to pay monthly service fees in accordance with the terms of the customer's contract with the Company, and the Company receives transaction processing fees generated from the device. The Jump Start Program also includes the ePort Connect® services package for wireless connectivity, card processing, consumer
services, online reporting, and over-the-air machine alerts.
Because Jump Start is designed to help vending operators and bottlers acquire the ePort cashless terminal at no upfront cost, paying only a low monthly service fee, and avoiding the need to make a major upfront capital investment, the Company anticipates that the Jump Start Program will accelerate adoption in the marketplace of its ePort technology as well as increase its license and transaction fee revenues.
When the program was commenced, the Company anticipated that the Jump Start Program would consist of at least 15,000 ePort Edge devices. In May 2010, the Company expanded the program to include the ePort G8 terminal. In July 2010, the Company expanded the program to an aggregate of 35,000 ePort terminals and the program terminated in December 2010. During the Spring of 2011, the Company reintroduced the Jump Start Program and anticipates approximately 40,000 Jump Start units to be connected during the 2012 fiscal year.
MANUFACTURING
The Company utilizes independent third party companies for the manufacturing of its products. The Company purchases other components of its business center (computers, printers, fax and copy machines) through various manufacturers and resellers. Our manufacturing process mainly consists of quality assurance of materials and testing of finished goods received from our contract manufacturers. We have not entered into a long-term contract with our contract manufacturers, nor have we agreed to commit to purchase certain quantities of materials or finished goods beyond those submitted under routine purchase orders, typically covering short-term forecasts.
COMPETITION
The cashless vending, remote business service and energy conservation industries are competitive markets. While the Company offers unique products and services within smaller niche markets of these industries, a number of competitors in the broader market may offer products and services within our niche market in the future. In the cashless vending market, we are not aware of any direct competitor that provides a complete end-to-end solution, offering a cashless/remote monitoring device and turnkey service, which includes card processing services. We are aware of four competitors that offer a cashless hardware device, MEI, Coin Acceptors Inc. (Coinco), Cantaloupe Systems, Inc. and InOne Technology,
LLC. We are aware of four competitors that offer a remote monitoring device, MEI, Cantaloupe Systems, Inc, InOne Technology, LLC, and Crane Streamware. We are aware of one direct competitor that offers a wireless service for cashless processing, Apriva. In addition, there are numerous credit card processors that offer card processing services to traditional retail establishments that could decide to offer similar services to the industries that we serve.
14
In May 2010, NAMA, an association serving the vending, coffee service and foodservice management industries, announced a cashless vending program for their members. As described by NAMA on their website, the goal of the program is to enable NAMA members to offer their customers the convenience of cashless payments at a reasonable cost across small and large average transaction pricing in a variety of industry segments. They further describe the NAMA Cashless Solution program as a networked end-to-end solution that is hardware neutral, works with qualified communication suppliers and card associations for payment reconciliation and account management. In addition, NAMA states they are working to provide members
with a broad range of preferential financial services. This program includes one or more of the competitors to the Company referred to in the preceding paragraph.
In the cashless laundry market, we are aware of one direct competitor, Mac-Gray Corporation. In the automated business center market, we are aware of three direct competitors. In the energy management market, we are aware of one direct competitor for our Energy Miser products in the United States of America; and, we are aware of one competitor for energy management products in Europe. The businesses which have developed unattended, credit card activated control systems currently in use in non-vending machine applications (e.g., gasoline dispensing, public telephones, prepaid telephone cards and ticket dispensing machines), might be capable of
developing products or utilizing their existing products in direct competition with our ePort® control systems targeted to the vending industry. The Company is also aware of several businesses that make available use of the Internet and use of personal computers to hotel guests in their hotel rooms. Such services might compete with the Company’s Business Express, and the locations may not order the Business Express, or if ordered, the hotel guest may not use it. Finally, the production of highly efficient vending machines and glass front coolers or alternative energy conservation products may reduce or replace the need for our energy management products.
The Company’s key competitive factors include our unique products, our integrated services, product performance and price. In addition, it includes our ability to deliver these as a one-stop-shop, which we believe makes our technology easier to adopt and deploy for the operator. Our competitors are well established, have substantially greater resources than the Company and have established reputations for success in the development, sale and service of high quality products. Any increase in competition in the future may result in reduced sales and/or lower percentages of gross revenues being retained by the Company, or otherwise may reduce potential profits or result in a loss of some or all of its
customer base.
CUSTOMER CONCENTRATIONS
Financial instruments that subject the Company to a concentration of credit risk consist principally of cash and cash equivalents and accounts and finance receivables. The Company maintains cash and cash equivalents with various financial institutions. Approximately 22% and 52% of the Company’s accounts and finance receivables at June 30, 2011 and 2010, respectively, were concentrated with one and two (28% with one and 24% with another) customer(s), respectively. Approximately 48%, 52%, and 44% of the Company’s license and transaction processing revenues for the years ended June 30, 2011, 2010, and 2009, respectively, were concentrated with two (25% with one and 23% with another), two (35% with one and
17% with another), and one customer(s), respectively. There was no concentration of equipment sales revenue for the year ended June 30, 2011. For each of the years ended June 30, 2010 and 2009 approximately 11% of the Company’s equipment sales revenue was concentrated with one customer. The Company’s customers are principally located in the United States.
TRADEMARKS, PROPRIETARY INFORMATION AND PATENTS
The Company received federal registration approval of the following trademarks: Blue Light Sequence®, CM2iQ®, EnergyMiser®, ePort®, ePort Connect®, ePort Edge®, Intelligent Vending®, PC Express®, Public PC®, SnackMiser®, The Office That Never Sleeps®, TransAct®, USA Technologies & Design®, USALive®, VendingMiser®, and VM2iQ®. The Company has three trademarks pending registration, Pay Dot™, Creating Value Through Innovation™ and eSuds™.
Much of the technology developed or to be developed by the Company is subject to trade secret protection. To reduce the risk of loss of trade secret protection through disclosure, the Company has entered into confidentiality agreements with its key employees. There can be no assurance that the Company will be successful in maintaining such trade secret protection, that they will be recognized as trade secrets by a court of law, or that others will not capitalize on certain aspects of the Company’s technology.
Through June 30, 2011, 73 United States patents and 8 foreign patents have been issued to the Company, and 5 United States and 7 foreign patent applications are pending.
The list of issued patents that remain in force is as follows:
|
|
●
|
U.S. Patent No. 6,856,820 entitled “An in-vehicle device for wirelessly connecting a vehicle to the internet and for transacting e-commerce and e-business”;
|
|
|
●
|
U.S. Patent No. 5,844,808 entitled “Apparatus and methods for monitoring and communicating with a plurality of networked vending machines”;
|
15
|
|
●
|
U.S. Patent No. 7,690,495 entitled “Card reader assembly”;
|
|
|
●
|
U.S. Patent No. 7,076,329 entitled “Cashless vending transaction management by a Vend Assist mode of operation”;
|
|
|
●
|
U.S. Patent No. 7,464,867 entitled “Cashless vending transaction management by a Vend Assist mode of operation”;
|
|
|
●
|
U.S. Patent No. 7,131,575 C1 entitled “Cashless vending transaction management by a Vend Assist mode of operation”;
|
|
|
●
|
U.S. Patent No. 7,693,602 entitled “Cashless vending transaction management by a vend assist mode of operation”;
|
|
|
●
|
U.S. Patent No. 6,615,186 entitled “Communicating interactive digital content between vehicles and internet based data processing resources for the purpose of transacting e-commerce or conducting e-business”;
|
|
|
●
|
U.S. Patent No. 7,003,289 entitled “Communication interface device for managing wireless data transmission between a vehicle and the internet”;
|
|
|
●
|
Canadian Patent No. 2,207,603 entitled “Credit and debit card operated vending machine”;
|
|
|
●
|
U.S. Patent No. 5,637,845 entitled “Credit Card and Bank Issued Debit Card Operated System and Method for Controlling a Prepaid Card Encoding/Dispensing Machine”;
|
|
|
●
|
U.S. Patent No. 6,119,934 entitled “Credit Card and Bank Issued Debit Card Operated System and Method for Controlling a Prepaid Card Encoding/Dispensing Machine”;
|
|
|
●
|
U.S. Patent No. 6,152,365 entitled “Credit Card and Bank Issued Debit Card Operated System and Method for Controlling a Vending Machine (as Amended)”;
|
|
|
●
|
U.S. Patent No. 5,619,024 entitled “Credit Card and Bank Issued Debit Card Operated System and Method for Controlling and Monitoring Access of Computer and Copy Equipment”;
|
|
|
●
|
U.S. Patent No. D423,474 entitled “Dataport”;
|
|
|
●
|
U.S. Patent No. 6,754,641 entitled “Dynamic identification interchange method for exchanging one form of identification for another”;
|
|
|
●
|
U.S. Patent No. D428,444 entitled “Electronic Commerce Terminal Enclosure for a Vending Machine”;
|
|
|
●
|
U.S. Patent No. D437,890 entitled “Electronic Commerce Terminal Enclosure for a Vending Machine”;
|
|
|
●
|
U.S. Patent No. D441,401 entitled “Electronic Commerce Terminal Enclosure with Brackets”;
|
|
|
●
|
U.S. Patent No. D428,047 entitled “Electronic Commerce Terminal Enclosure”;
|
|
|
●
|
U.S. Patent No. 6,243,626 entitled “External power management device with current monitoring precluding shutdown during high current”;
|
|
|
●
|
U.S. Patent No. D415,742 entitled “Laptop Data Port Enclosure”;
|
|
|
●
|
U.S. Patent No. 7,286,907 entitled “Method and Apparatus for Conserving Power Consumed by a Refrigerated Appliance Utilizing Audio Signal Detection”;
|
|
|
●
|
U.S. Patent No. 6,021,626 entitled “Method and Apparatus for Forming, Packaging, Storing, Displaying and Selling Clothing Articles”;
|
|
|
●
|
U.S. Patent No. 6,975,926 entitled “Method and Apparatus for Power Management Control of a Compressor-Based Appliance that Reduces Electrical Power Consumption of an Appliance”;
|
|
|
●
|
U.S. Patent No. 7,200,467 entitled “Method and Apparatus for Power Management Control of a Compressor-Based Appliance that Reduces Electrical Power Consumption of an Appliance”;
|
16
|
|
●
|
U.S. Patent No. 6,622,124 entitled “Method of transacting an electronic mail, an electronic commerce, and an electronic business transaction by an electronic commerce terminal operated on a transportation vehicle”;
|
|
|
●
|
U.S. Patent No. 6,606,605 entitled “Method to obtain customer specific data for public access electronic commerce services”;
|
|
|
●
|
U.S. Patent No. D480,948 entitled “Mounting bracket for mounting a cashless payment terminal to a vending machine”;
|
|
|
●
|
U.S. Patent No. D475,750 entitled “Paper guide for a point of sale terminal”;
|
|
|
●
|
U.S. Design Patent No. D543,588 entitled “Point of Sale Terminal Mountable on a Vending Machine’;
|
|
|
●
|
U.S. Patent No. 6,801,836 entitled “Power-conservation based on indoor/outdoor and ambient-light”;
|
|
|
●
|
European Patent No. 1419425 entitled “Power-Conservation System based on Indoor/Outdoor and Ambient-Light” (validated in Germany, Spain, France, the United Kingdom, and Italy);
|
|
|
●
|
U.S. Patent No. 5,477,476 entitled “Power conservation system for computer peripherals”;
|
|
|
●
|
U.S. Patent No. D475,414 entitled “Printer bracket for point of sale terminal”;
|
|
|
●
|
U.S. Patent No. D476,036 entitled “Printer bracket for point of sale terminal”;
|
|
|
●
|
Australian Patent No. 2001263356 entitled “Refrigerated vending machine exploiting expanded temperature variance during power-conservation mode”;
|
|
|
●
|
Mexican Patent No. 234363 entitled “Refrigerated vending machine exploiting expanded temperature variance during power-conservation mode”;
|
|
|
●
|
U.S. Patent No. 6,389,822 entitled “Refrigerated vending machine exploiting expanded temperature variance during power-conservation mode”;
|
|
|
●
|
U.S. Patent No. 6,581,396 entitled “Refrigerated vending machine exploiting expanded temperature variance during power-conservation mode”;
|
|
|
●
|
U.S. Patent No. 6,898,942 entitled “Refrigerated vending machine exploiting expanded temperature variance during power-conservation mode”;
|
|
|
●
|
U.S. Patent No. 6,931,869 entitled “Refrigerated vending machine exploiting expanded temperature variance during power-conservation mode”;
|
|
|
●
|
U.S. Patent No. D418,878 entitled “Sign Holder”;
|
|
|
●
|
U.S. Patent No. 7,630,939 entitled “System and method for locally authorizing cashless transactions at point of sale”;
|
|
|
●
|
U.S. Patent No. 6,056,194 entitled “System and Method for Networking and Controlling Vending Machines”;
|
|
|
●
|
U.S. Patent No. 6,321,985 entitled “System and Method for Networking and Controlling Vending Machines”;
|
|
|
●
|
U.S. Patent No. 6,505,095 entitled “System for Providing Remote Audit, Cashless Payment, and Interactive Transaction Capabilities in a Vending Machine” (Stitch);
|
|
|
●
|
Canadian Patent No. 2,409,228 entitled “Temperature controller for a refrigerated vending machine”;
|
|
|
●
|
U.S. Patent No. 6,389,337 entitled “Transacting E-commerce and Conducting E-business Related to Identifying and Procuring Automotive Service and Vehicle Replacement Parts” (Stitch);
|
|
|
●
|
U.S. Patent No. D478,577 entitled “Transceiver base unit”;
|
|
|
●
|
U.S. Patent No. 6,609,102 entitled “Universal interactive advertising and payment system for public access electronic commerce and business related products and services”;
|
17
|
|
●
|
U.S. Patent No. 6,604,085 entitled “Universal interactive advertising and payment system network for public access electronic commerce and business related products and services”;
|
|
|
●
|
U.S. Patent No. 6,601,038 entitled “Universal interactive advertising and payment system network for public access electronic commerce and business related products and services”;
|
|
|
●
|
U.S. Patent No. 6,604,086 entitled “Universal interactive advertising and payment system network for public access electronic commerce and business related products and services”;
|
|
|
●
|
U.S. Patent No. 6,601,037 entitled “Universal interactive advertising and payment system network for public access electronic commerce and business related products and services”;
|
|
|
●
|
U.S. Patent No. 6,611,810 entitled “Universal interactive advertising and payment system network for public access electronic commerce and business related products and services”;
|
|
|
●
|
U.S. Patent No. 6,606,602 entitled “Universal interactive advertising and payment system network for public access electronic commerce and business related products and services”;
|
|
|
●
|
U.S. Patent No. 6,601,039 entitled “Universal interactive advertising and payment system network for public access electronic commerce and business related products and services”;
|
|
|
●
|
U.S. Patent No. 6,604,087 entitled “Universal interactive advertising and payment system network for public access electronic commerce and business related products and services”;
|
|
|
●
|
U.S. Patent No. 6,615,183 entitled “Universal interactive advertising and payment system network for public access electronic commerce and business related products and services”;
|
|
|
●
|
U.S. Patent No. 6,601,040 entitled “Universal interactive advertising and payment system network for public access electronic commerce and business related products and services”;
|
|
|
●
|
U.S. Patent No. 6,609,103 entitled “Universal interactive advertising and payment system network for public access electronic commerce and business related products and services”;
|
|
|
●
|
U.S. Patent No. 6,629,080 entitled “Universal interactive advertising and payment system network for public access electronic commerce and business related products and services”;
|
|
|
●
|
U.S. Patent No. 7,089,209 entitled “Universal interactive advertising and payment system network for public access electronic commerce and business related products and services”;
|
|
|
●
|
U.S. Patent No. 6,643,623 entitled “Universal interactive advertising and payment system network for public access electronic commerce and business related products and services”;
|
|
|
●
|
U.S. Patent No. 6,684,197 entitled “Universal interactive advertising and payment system network for public access electronic commerce and business related products and services”;
|
|
|
●
|
U.S. Patent No. 6,807,532 entitled “Universal interactive advertising and payment system network for public access electronic commerce and business related products and services”;
|
|
|
●
|
U.S. Patent No. 6,763,336 entitled “Universal interactive advertising and payment system network for public access electronic commerce and business related products and services”;
|
|
|
●
|
Canadian Patent No. 2,291,015 entitled “Universal interactive advertising and payment system for public access electronic commerce and business related products and services”;
|
|
|
●
|
U.S. Patent No. D475,751 entitled “User interface bracket for a point of sale terminal”;
|
|
|
●
|
U.S. Patent No. D476,037 entitled “User interface bracket for a point of sale terminal”;
|
|
|
●
|
U.S. Patent No. 6,895,310 entitled “Vehicle related wireless scientific instrumentation telematics”;
|
|
|
●
|
U.S. Patent No. 6,853,894 entitled “Vehicle related wireless scientific instrumentation telematics”;
|
|
|
●
|
U.S. Patent No. D477,030 entitled “Vending machine cashless payment terminal”;
|
|
|
●
|
U.S. Patent No. 7,593,897 entitled “Wireless system for communicating cashless vending transaction data and vending machine audit data to remote locations”;
|
18
|
|
●
|
U.S. Patent No. 7,502,672 entitled “Wireless Vehicle Diagnostics Device and Method with Service and Part Determination Capabilities (as amended)”;
|
|
|
●
|
U.S. Patent No. 7,805,338 entitled “Method of constructing a digital content play list for transmission and presentation on a public access electronic terminal”;
|
|
|
●
|
U.S. Patent No. 7,856,289 entitled “Method and apparatus for conserving power consumed by a vending machine utilizing audio signal detection”; and
|
|
|
●
|
U.S. Patent No. 7,865,430 entitled “Cashless transaction payment module”.
|
The Company believes that one or more of its patents, including U.S. Patent No. 6,505,095 entitled “System for providing remote audit, cashless payment, and interactive transaction capabilities in a vending machine” and U.S. Patent No. 7.131.575 entitled “MDB Transaction String Effectuated Cashless Vending”, are important in protecting its intellectual property used in its e-Port® control system targeted to the vending industry. The aforesaid patent expires in July 2021.
The Company filed for reexamination of U.S. Patent No. 7,131,575 (Reexamination Control No. 90/008,437) and for reexamination of U.S. Patent No. 6,505,095 (Reexamination Control No. 90/008,448). On January 6, 2009, the U.S. Patent Office issued an Ex Parte Reexamination Certificate in connection with U.S. Patent No. 7.131.575 confirming patentability without any amendment to the claims. On August 11, 2009, the U.S. Patent Office issued an Ex Parte Reexamination Certificate in connection with U.S. Patent No. 6,505,095 which, among other things, approved amendments to certain of the prior claims and approved twelve new claims, for a total of 43 claims.
RESEARCH AND DEVELOPMENT
Research and development expenses, which are included in selling, general and administrative expense in the Consolidated Statements of Operations, were approximately $997,000, $1,864,000, and $2,691,000, for the years ended June 30, 2011, 2010, and 2009, respectively.
EMPLOYEES
On August 31, 2011, the Company had 42 full-time employees and three part-time employees.
19
Risks Relating to Our Business
We have a history of losses since inception and if we continue to incur losses, the price of our shares can be expected to fall.
We have experienced losses since inception. We expect to continue to incur losses for the foreseeable future as we expend substantial resources on sales, marketing, and research and development of our products. From our inception through June 30, 2011, our cumulative losses from operations are approximately $194 million. For our fiscal years ended June 30, 2011, 2010, and 2009, we have incurred net losses of $6,457,067, $11,571,495, and $13,731,818, respectively. Our revenues have not been sufficient to sustain our operations. If we continue to incur losses, the price of our common stock can be expected to fall. No assurances can be given that we will ever be profitable.
We may require additional financing to sustain our operations and without it we may not be able to continue operations.
At June 30, 2011, we had working capital of $11,546,502. We had an operating cash flow deficit of $5,171,529, $12,347,182, and $8,477,680, for the fiscal years ended June 30, 2011, 2010, and 2009, respectively. Based upon past business operations, we may not currently have sufficient financial resources to fund our operations after July 1, 2012. Therefore, we may need additional funds to continue these operations. Should the financing we require to sustain our working capital needs be unavailable or prohibitively expensive when we require it, the consequences could be a material adverse effect on our business, operating results, financial condition and prospects.
Our existence is dependent on our ability to raise capital that may not be available.
There can be no assurance that our business will prove financially profitable or generate sufficient revenues to cover our expenses. From inception, we have generated funds primarily through the sale of securities. Although we believe that we have adequate existing resources to provide for our funding requirements through at least July 1, 2012, there can be no assurances that we will be able to continue to generate sufficient funds thereafter. We expect to raise funds in the future through sales of our debt or equity securities until such time, if ever, as we are able to operate profitably. Subsequent to July 1, 2012, our inability to obtain needed funding can be expected to have a material adverse effect on our
operations and our ability to achieve profitability. If we fail to generate increased revenues or fail to sell additional securities, you may lose all or a substantial portion of your investment.
Our products may fail to gain widespread market acceptance. As a result, we may not generate sufficient revenues or profit margins to become successful.
There can be no assurances that demand for our products will be sufficient to enable us to generate sufficient revenue or become profitable. Likewise, no assurance can be given that we will be able to achieve a sufficient number of ePorts® connected to our network or sell equipment utilizing our network or our energy management products to enough locations to achieve significant revenues or that our operations can be conducted profitably. Alternatively, the locations which would utilize the network may not be successful locations and our revenues would be adversely affected. We may in the future lose locations utilizing our products to competitors, or
may not be able to install our products at competitors’ locations, or may not obtain future locations which would be obtained by our competitors. In addition, there can be no assurance that our products could evolve or be improved to meet the future needs of the marketplace.
We may be required to incur further debt to meet future capital requirements of our business. Should we be required to incur additional debt, the restrictions imposed by the terms of such debt could adversely affect our financial condition and our ability to respond to changes in our business.
If we incur additional debt, we may be subject to the following risks:
|
|
●
|
our vulnerability to adverse economic conditions and competitive pressures may be heightened;
|
|
|
●
|
our flexibility in planning for, or reacting to, changes in our business and industry may be limited;
|
|
|
●
|
our debt covenants may affect our flexibility in planning for, and reacting to, changes in the economy and in our industry;
|
|
|
●
|
a high level of debt may place us at a competitive disadvantage compared to our competitors that are less leveraged and therefore, may be able to take advantage of opportunities that our indebtedness would prevent us from pursuing;
|
|
|
●
|
the covenants contained in the agreements governing our outstanding indebtedness may limit our ability to borrow additional funds, dispose of assets, pay dividends and make certain investments;
|
20
|
|
●
|
a significant portion of our cash flows could be used to service our indebtedness;
|
|
|
●
|
we may be sensitive to fluctuations in interest rates if any of our debt obligations are subject to variable interest rates; and
|
|
|
●
|
our ability to obtain additional financing in the future for working capital, capital expenditures, acquisitions, general corporate purposes or other purposes may be impaired.
|
We cannot assure you that our leverage and such restrictions will not materially and adversely affect our ability to finance our future operations or capital needs or to engage in other business activities. In addition, we cannot assure you that additional financing will be available when required or, if available, will be on terms satisfactory to us.
Current conditions in the global financial markets and the distressed economy may materially adversely affect our business, results of operations and ability to raise capital.
Our business and results of operations may be materially adversely affected by the continued adverse conditions in the financial markets and the economy generally. Declining business and consumer confidence and the risks of increased or continued unemployment, have precipitated an economic slowdown and ongoing recession. These events and the continuing market upheavals may have an adverse effect on us, our suppliers and our customers. The demand for our products could be adversely affected in an economic downturn and our revenues may decline under such circumstances.
We rely on the equity markets for funding our business by issuing equity securities. We may find it difficult, or we may not be able, to access the equity markets, or we may experience higher funding costs as a result of the current adverse market conditions. Continued instability in these markets may limit our ability to access the capital we may require to fund and grow our business.
The loss of one or more of our key customers could significantly reduce our revenues and profits.
We have derived, and believe we may continue to derive, a significant portion of our revenues from a limited number of large customers. Approximately 22% and 52% of the Company’s accounts and finance receivables at June 30, 2011 and 2010, respectively, were concentrated with one and two (28% with one customer and 24% with another customer) customer(s), respectively. Approximately 48%, 52%, and 44% of the Company’s license and transaction processing revenues for the years ended June 30, 2011, 2010, and 2009, respectively, were concentrated with two (25% with one and 23% with another), two (35% with one and 17% with another), and one customer(s), respectively. There was no concentration of equipment
sales revenue for the year ended June 30, 2011. For each of the years ended June 30, 2010 and 2009 approximately 11% of the Company’s equipment sales revenue was concentrated with one customer. The Company’s customers are principally located in the United States.
Our customers may buy less of our products or services depending on their own technological developments, end-user demand for our products and internal budget cycles. A major customer in one year may not purchase any of our products or services in another year, which may negatively affect our financial performance. If any of our large customers significantly reduce or delay purchases from us or if we are required to sell products to them at reduced prices or unfavorable terms, our results of operations and revenue could be materially adversely affected.
We depend on our key personnel and if they would leave us, our business could be adversely affected.
We are dependent on key management personnel, particularly the Chairman and Chief Executive Officer, George R. Jensen, Jr. The loss of services of Mr. Jensen or other executive officers would dramatically affect our business prospects. Certain of our employees are particularly valuable to us because:
|
|
●
|
they have specialized knowledge about our company and operations;
|
|
|
●
|
they have specialized skills that are important to our operations; or
|
|
|
●
|
they would be particularly difficult to replace.
|
We have entered into an employment agreement with Mr. Jensen that expires on June 30, 2014. We have also entered into employment agreements with other executive officers, each of which contain confidentiality and non-compete agreements. We have obtained a key man life insurance policy in the amount of $1,000,000 on Mr. Jensen and a key man life insurance policy in the amount of $1,000,000 on our President, Stephen P. Herbert. We do not have and do not intend to obtain key man life insurance coverage on any of our other executive officers. As a result, we are exposed to the costs associated with the death of these key employees.
We also may be unable to retain other existing senior management, sales personnel and development and engineering personnel critical to our ability to execute our business plan, which could result in harm to key customer relationships, loss of key information, expertise or know-how and unanticipated recruitment and training costs.
21
Our dependence on proprietary technology and limited ability to protect our intellectual property may adversely affect our ability to compete.
Challenge to our ownership of our intellectual property could materially damage our business prospects. Our technology may infringe upon the proprietary rights of others. Our ability to execute our business plan is dependent, in part, on our ability to obtain patent protection for our proprietary products, maintain trade secret protection and operate without infringing the proprietary rights of others.
Through June 30, 2011, we had 12 pending United States and foreign patent applications, and intend to file applications for additional patents covering our future products, although there can be no assurance that we will do so. In addition, there can be no assurance that we will maintain or prosecute these applications. The United States Government and other countries have granted us 81 patents as of June 30, 2011. There can be no assurance that:
|
|
●
|
any of the remaining patent applications will be granted to us;
|
|
|
●
|
we will develop additional products that are patentable or do not infringe the patents of others;
|
|
|
●
|
any patents issued to us will provide us with any competitive advantages or adequate protection for our products;
|
|
|
●
|
any patents issued to us will not be challenged, invalidated or circumvented by others; or
|
|
|
●
|
any of our products would not infringe the patents of others.
|
If any of the products are found to have infringed any patent, there can be no assurance that we will be able to obtain licenses to continue to manufacture and license such product or that we will not have to pay damages as a result of such infringement. Even if a patent application is granted for any of our products, there can be no assurance that the patented technology will be a commercial success or result in any profits to us.
If we are unable to adequately protect our proprietary technology, third parties may be able to compete more effectively against us, which could result in the loss of customers and our business being adversely affected. Patent and proprietary rights litigation entails substantial legal and other costs, and diverts Company resources as well as the attention of our management. There can be no assurance we will have the necessary financial resources to appropriately defend or prosecute our rights in connection with any such litigation.
Competition from others could prevent the Company from increasing revenue and achieving profitability.
Competition from other companies, including those that are well established and have substantially greater resources may reduce our profitability or reduce our business opportunities. Many of our competitors have established reputations for success in the development, sale and service of high quality products. We face competition from the following groups:
|
|
●
|
companies offering automated, credit card activated control systems in connection with facsimile machines, personal computers, debit card purchase/revalue stations, vending machines, and use of the Internet and e-mail which directly compete with our products;
|
|
|
●
|
companies which have developed unattended, credit card activated control systems currently used in connection with public telephones, prepaid telephone cards, gasoline dispensing machines, or vending machines and are capable of developing control systems in direct competition with the Company;
|
|
|
●
|
businesses which provide access to the Internet and personal computers to hotel guests. Although these services are not credit card activated, such services would compete with the Company’s Business Express®; and
|
|
|
●
|
two direct competitors, Elstat Electronics Ltd. and Automatic Retailing Ltd., in the energy management industry.
|
In addition, it is also possible that a company not currently engaged in any of the businesses described above could develop services and products that compete with our services and products. Competition may result in lower profit margins on our products or may reduce potential profits or result in a loss of some or all of our customer base. To the extent that our competitors are able to offer more attractive technology, our ability to compete could be adversely affected. As stated above under “Business-Competition”, The National Automatic Merchandising Association (‘NAMA”), an association serving the vending, coffee service, and food service management industries has announced a cashless
vending program for their members which offers the products and services of one or more of the Company’s current competitors.
22
The termination of any of our relationships with third parties upon whom we rely for supplies and services that are critical to our products could adversely affect our business and delay achievement of our business plan.
We depend on arrangements with third parties for a variety of component parts used in our products. We have contracted with various suppliers to assist us to develop and manufacture our ePort® products and with various suppliers to manufacture our Energy Miser® products. For other components, we do not have supply contracts with any of our third-party suppliers and we purchase components as needed from time to time. We have contracted with DBSi to host our network in a secure, 24/7 environment to ensure the reliability of our network services. We also have contracted with multiple land-based telecommunications providers to ensure the reliability of
our land-based network. If these business relationships are terminated, the implementation of our business plan may be delayed until an alternative supplier or service provider can be retained. If we are unable to find another source or one that is comparable, the content and quality of our products could suffer and our business, operating results and financial condition could be harmed.
A disruption in the manufacturing capabilities of our third-party manufacturers, suppliers or distributors would negatively impact our ability to meet customer requirements.
We depend upon third-party manufacturers, suppliers and distributors to deliver components free from defects, competitive in functionality and cost, and in compliance with our specifications and delivery schedules. Since we generally do not maintain large inventories of our products or components, any termination of, or significant disruption in, our manufacturing capability or our relationship with our third-party manufacturers or suppliers may prevent us from filling customer orders in a timely manner.
We have occasionally experienced, and may in the future experience, delays in delivery of products and delivery of products of inferior quality from third-party manufacturers. Although alternate manufacturers and suppliers are generally available to produce our products and product components, the number of manufacturers or suppliers of some of our products and components is limited, and a qualified replacement manufacturer or supplier could take several months. In addition, our use of third-party manufacturers reduces our direct control over product quality, manufacturing timing, yields and costs. Disruption of the manufacture or supply of our products and components, or a third-party manufacturer’s or
supplier’s failure to remain competitive in functionality, quality or price, could delay or interrupt our ability to manufacture or deliver our products to customers on a timely basis, which would have a material adverse effect on our business and financial performance.
Substantially all of the network service contracts with our customers are terminable for any or no reason upon 30 to 60 days’ advance notice.
Substantially all of our customers may terminate their network service contracts with us for any or no reason upon providing us with 30 or 60-days’ advance notice. Accordingly, consistent demand for and satisfaction with our products by our customers is critical to our financial condition and future success. Problems, defects or dissatisfaction with our products or services could cause us to lose a substantial number of our customers with minimal notice. If a substantial number of our customers were to exercise their termination rights, it would result in a material adverse effect to our business, operating results, and financial condition.
Our reliance on our wireless telecommunication service provider exposes us to a number of risks over which we have no control, including risks with respect to increased prices and termination of essential services.
The operation of our wirelessly networked devices depends upon the capacity, reliability and security of services provided to us by our wireless telecommunication services providers, AT&T Mobility and Verizon Wireless. We have no control over the operation, quality or maintenance of these services or whether the vendor will improve its services or continue to provide services that are essential to our business. In addition, subject to our existing contracts with them, our wireless telecommunication services providers may increase their prices, which would increase our costs. If our wireless telecommunication services providers were to cease to provide essential services or to significantly increase prices, we
could be required to find alternative vendors for these services. With a limited number of vendors, we could experience significant delays in obtaining new or replacement services, which could lead to slowdowns or failures of our network. In addition, we may have to replace our existing ePort® devices that are already installed in the marketplace and which are utilizing the existing vendor’s services. This could significantly harm our reputation and could cause us to lose customers and revenues.
Our products may contain defects that may be difficult or even impossible to correct, which could result in lost sales, additional costs and customer erosion.
We offer technically complex products which, when first introduced or released in new versions, may contain software or hardware defects that are difficult to detect and correct. The existence of defects and delays in correcting them could result in negative consequences, including the following:
|
|
●
|
delays in shipping products;
|
|
|
●
|
cancellation of orders;
|
23
|
|
●
|
additional warranty expense;
|
|
|
●
|
delays in the collection of receivables;
|
|
|
●
|
product returns;
|
|
|
●
|
the loss of market acceptance of our products;
|
|
|
●
|
diversion of research and development resources from new product development; and
|
|
|
●
|
inventory write-downs.
|
Even though we test all of our products, defects may continue to be identified after products are shipped. In past periods, we have experienced various issues in connection with product launches, including the need to rework certain products and stabilize product designs. Correcting defects can be a time-consuming and difficult task. Software errors may take several months to correct, and hardware errors may take even longer.
We may accumulate excess or obsolete inventory that could result in unanticipated price reductions and write downs and adversely affect our financial results.
Managing the proper inventory levels for components and finished products is challenging. In formulating our product offerings, we have focused our efforts on providing products with greater capability and functionality, which requires us to develop and incorporate the most current technologies in our products. This approach tends to increase the risk of obsolescence for products and components we hold in inventory and may compound the difficulties posed by other factors that affect our inventory levels, including the following:
|
|
●
|
the need to maintain significant inventory of components that are in limited supply;
|
|
|
●
|
buying components in bulk for the best pricing;
|
|
|
●
|
responding to the unpredictable demand for products;
|
|
|
●
|
responding to customer requests for short lead-time delivery schedules;
|
|
|
●
|
failure of customers to take delivery of ordered products; and
|
|
|
●
|
product returns.
|
If we accumulate excess or obsolete inventory, price reductions and inventory write-downs may result, which could adversely affect our results of operation and financial condition.
We may not be able to adapt to changing technology and our customers’ technology needs.
We face rapidly changing technology and frequent new service offerings by competitors that can render existing services obsolete or unmarketable. Our future depends, in part, on our ability to enhance existing services and to develop, introduce and market, on a timely and cost effective basis, new services that keep pace with technological developments and customer requirements. Developing new products and technologies is a complex, uncertain process requiring innovation and accurate anticipation of technological and market trends. When changes to the product line are announced, we will be challenged to manage possible shortened life cycles for existing products, continue to sell existing products and prevent
customers from returning existing products. Our inability to respond effectively to any of these challenges may have a material adverse effect on our business and financial success.
Security is vital to our customers and therefore breaches in the security of transactions involving our products or services could adversely affect our reputation and results of operations.
Protection against fraud is of key importance to purchasers and end-users of our products. We incorporate security features, such as encryption software and secure hardware, into our products to protect against fraud in electronic payment transactions and to ensure the privacy and integrity of consumer data. Our products may be vulnerable to breaches in security due to defects in the security mechanisms, the operating system and applications or the hardware platform. Security vulnerabilities could jeopardize the security of information transmitted or stored using our products. In general, liability associated with security breaches of a certified electronic payment system belongs to the institution that acquires
the financial transaction. In addition, we have not experienced any material security breaches affecting our business. However, if the security of the information in our products is compromised, our reputation and marketplace acceptance of our products will be adversely affected, which would adversely affect our results of operations, and subject us to potential liability. If our security applications are breached and sensitive data is lost or stolen, we could incur significant costs to not only assess and repair any damage to our systems, but also to reimburse customers for losses that occur from the fraudulent use of the data. We may also be subject to fines and penalties from the credit card associations in the event of the loss of confidential card information. Adverse publicity raising concerns about the safety or privacy of electronic transactions, or widely reported breaches of
our or another provider’s security, have the potential to undermine consumer confidence in the technology and could have a materially adverse effect on our business.
24
Our products and services may be vulnerable to security breach.
Credit card issuers have promulgated credit card security guidelines as part of their ongoing efforts to battle identity theft and credit card fraud. We continue to work with credit card issuers to assure that our products and services comply with these rules. There can be no assurances, however, that our products and services are invulnerable to unauthorized access or hacking. When there is unauthorized access to credit card data that results in financial loss, there is the potential that parties could seek damages from us.
If we fail to adhere to the standards of the Visa and MasterCard credit card associations, our registrations with these associations could be terminated and we could be required to stop providing payment processing services for Visa and MasterCard.
Substantially all of the transactions handled by our network involve Visa or MasterCard. If we fail to comply with the applicable requirements of the Visa and MasterCard credit card associations, Visa or MasterCard could suspend or terminate our registration with them. The termination of our registration with them or any changes in the Visa or MasterCard rules that would impair our registration with them could require us to stop providing payment processing services through our network.
We rely on other card payment processors and service providers; if they fail or no longer agree to provide their services, our customer relationships could be adversely affected and we could lose business.
We rely on agreements with other large payment processing organizations, primarily Elavon, Inc. (“Elavon”), to enable us to provide card authorization, data capture, settlement and merchant accounting services and access to various reporting tools for the customers we serve. Many of these organizations and service providers are our competitors and our agreements are subject to termination by them.
The termination by our service providers of their arrangements with us or their failure to perform their services efficiently and effectively may adversely affect our relationships with the customers whose accounts we serve and may cause those customers to terminate their processing agreements with us.
We are subject to laws and regulations that affect the products, services and markets in which we operate. Failure by us to comply with these laws or regulations would have an adverse effect on our business, financial condition, or results of operations.
We are, among other things, subject to banking regulations and credit card association regulations. Failure to comply with these regulations may result in the suspension or revocation of our business, the limitation, suspension or termination of service, and/or the imposition of fines that could have an adverse effect on our financial condition. Additionally, changes to legal rules and regulations, or interpretation or enforcement thereof, could have a negative financial effect on us or our product offerings. The payment processing industry may become subject to regulation as a result of recent data security breaches that have exposed consumer data to potential fraud. To the extent this occurs, we could be subject
to additional technical, contractual or other requirements as a condition of our continuing to conduct our payment processing business. These requirements could cause us to incur additional costs, which could be significant, or to lose revenues to the extent we do not comply with these requirements.
New legislation could be enacted regulating the basis upon which interchange rates are charged for debit or credit card transactions, which could increase the debit or credit card interchange fees charged by bankcard networks. An example of such legislation is the so-called “Durbin Amendment,” to the Dodd Frank Wall Street Reform and Consumer Protection Act of 2010. The Durbin Amendment was recently enacted and regulates the basis upon which interchange rates for debit card transactions are made to ensure that interchange rates are “reasonable and proportionate to costs.” As discussed elsewhere in this Form 10-K,
pursuant to regulations that were recently promulgated by the Federal Reserve, our credit and debit card processor has notified us that effective October 1, 2011, Visa and MasterCard are significantly increasing their interchange fees for small ticket debit card transactions. During the 2011 fiscal year, debit card transactions represented 82% of the number of transactions handled by our network. At the present time, the impact on our business is still uncertain. We anticipate that these significant increases would be passed on to our customers or we would cease to accept debit cards in our ePort and other devices. In either such event, there is the possibility that our customers would cancel their agreements with us resulting in a significant reduction in our licensing and transaction fee revenues. In addition, there is the possibility that customers would not order ePorts or other
devices in the future at the levels currently anticipated by us.
Increases in card association and debit network interchange fees could increase our operating costs or otherwise adversely affect our operations. If we do not pass along to our customers any increases in credit or debit card interchange fees, assessments and transaction fees, our gross profits would be reduced.
We are obligated to pay interchange fees and other network fees set by the bankcard networks to the card issuing bank and the bankcard networks for each transaction we process through our network. From time to time, card associations and debit networks increase the organization and/or processing fees, known as interchange fees that they charge. Under our processing agreements with our customers, we are permitted to pass along these fee increases to our customers through corresponding increases in our processing fees. Passing along such increases could result in some of our customers canceling their contracts with us. Consequently, it is possible that competitive pressures will result in our Company absorbing some
or all of the increases in the future, which would increase our operating costs, reduce our gross profit and adversely affect our business.
25
Visa and MasterCard have indicated that, effective October 1, 2011, their interchange fees for small ticket category transactions paid for through debit cards issued by regulated banks would increase from 1.55% of a transaction plus 4 cents, to 0.5% of a transaction plus 22 cents, which represents an increase of approximately 247% based on a transaction of $1.67, which was the average transaction experienced by the Company during fiscal year 2011. During the fiscal year ended June 30, 2011, approximately 82% of the transactions handled by our network consisted of small ticket debit card transactions. If we are not able to pass
along such interchange fee increase to our customers or take steps to recover these increased fees, our gross profit from license and transaction fee revenues and our financial performance would be materially adversely affected.
Risks Related to Our Common Stock
We do not expect to pay cash dividends in the foreseeable future and therefore investors should not anticipate cash dividends on their investment.
The holders of our common stock and series A convertible preferred stock are entitled to receive dividends when, and if, declared by our board of directors. Our board of directors does not intend to pay cash dividends in the foreseeable future, but instead intends to retain any and all earnings to finance the growth of the business. To date, we have not paid any cash dividends on our common stock or our series A convertible preferred stock and there can be no assurance that cash dividends will ever be paid on our common stock.
In addition, our articles of incorporation prohibit the declaration of any dividends on our common stock unless and until all unpaid and accumulated dividends on the series A convertible preferred stock have been declared and paid. Through August 31, 2011, the unpaid and cumulative dividends on the series A convertible preferred stock are $10,599,646. Each share of series A convertible preferred stock is convertible into 1/100th of a share of common stock at the option of the holder. The unpaid and cumulative dividends on the series A convertible preferred stock are convertible into shares of our common stock at the rate of $1,000 per share at the option of the holder. During the years ended June 30, 2011, a total
of 1,500 shares of our series A convertible preferred stock and $33,000 worth of cumulative preferred dividends were converted into 15 and 33 shares of common stock, respectively.
We may issue additional shares of our common stock, which could depress the market price of our common stock and dilute your ownership.
As of August 31, 2011, we had issued and outstanding options to purchase 90,666 shares of our common stock and warrants to purchase 15,562,649 shares of our common stock. The shares underlying none of these options, and 14,595,432 of these warrants have been registered and may be freely sold. From inception, we have financed our business primarily through the sale of our common stock. Market sales of large amounts of our common stock, or the potential for those sales even if they do not actually occur, may have the effect of depressing the market price of our common stock. In addition, if our future financing needs require us to issue additional shares of common stock or securities convertible into common stock,
the supply of common stock available for resale could be increased which could stimulate trading activity and cause the market price of our common stock to drop, even if our business is doing well. Furthermore, the issuance of any additional shares of our common stock including those pursuant to the exercise of warrants by the holders thereof, or securities convertible into our common stock could be substantially dilutive to holders of our common stock if they do not invest in future offerings.
Our stock price may be volatile.
The trading price of our common stock is expected to be subject to significant fluctuations in response to various factors including, but not limited to, the following:
|
|
●
|
quarterly variations in operating results and achievement of key business metrics;
|
|
|
●
|
changes in earnings estimates by securities analysts, if any;
|
|
|
●
|
any differences between reported results and securities analysts’ published or unpublished expectations;
|
|
|
●
|
announcements of new contracts, service offerings or technological innovations by us or our competitors;
|
|
|
●
|
market reaction to any acquisitions, joint ventures or strategic investments announced by us or our competitors;
|
|
|
●
|
demand for our services and products;
|
|
|
●
|
shares being sold pursuant to Rule 144 or upon exercise of warrants;
|
|
|
●
|
regulatory matters;
|
26
|
|
●
|
concerns about our financial position, operating results, litigation, government regulation, developments or disputes relating to agreements, patents or proprietary rights;
|
|
|
●
|
potential dilutive effects of future sales of shares of common stock by shareholders and by the Company, and subsequent sale of common stock by the holders of warrants and options;
|
|
|
●
|
our ability to obtain working capital financing; and
|
|
|
●
|
general economic or stock market conditions unrelated to our operating performance.
|
The securities market in recent years has from time to time experienced significant price and volume fluctuations that are unrelated to the operating performance of particular companies. These market fluctuations, as well as general economic conditions, may also materially and adversely affect the market price of our common stock.
The substantial market overhang of our shares will tend to depress the market price of our shares.
The substantial number of our shares currently eligible for sale in the open market will tend to depress the market price of our shares. As of August 31, 2011, these shares consisted of the following:
|
|
●
|
32,285,690 shares of common stock;
|
|
|
●
|
442,968 shares of series A convertible preferred stock;
|
|
|
●
|
10,600 shares issuable upon conversion of the accrued and unpaid dividends on the series A convertible preferred stock;
|
|
|
●
|
15,562,649 shares underlying common stock warrants;
|
|
|
●
|
190,082 shares issuable under our 2010 Stock Incentive Plan; and
|
|
|
●
|
300,000 shares issuable under our 2011 Stock Incentive Plan.
|
Director and officer liability is limited.
As permitted by Pennsylvania law, our by-laws limit the liability of our directors for monetary damages for breach of a director’s fiduciary duty except for liability in certain instances. As a result of our by-law provisions and Pennsylvania law, shareholders may have limited rights to recover against directors for breach of fiduciary duty. In addition, our by-laws and indemnification agreements entered into by the Company with each of the officers and directors provide that we shall indemnify our directors and officers to the fullest extent permitted by law.
Our publicly-filed reports are reviewed by the SEC from time to time and any significant changes required as a result of any such review may result in material liability to us, and have a material adverse impact on the trading price of our common stock.
The reports of publicly-traded companies are subject to review by the SEC from time to time for the purpose of assisting companies in complying with applicable disclosure requirements and to enhance the overall effectiveness of companies’ public filings, and comprehensive reviews of such reports are now required at least every three years under the Sarbanes-Oxley Act of 2002. SEC reviews may be initiated at any time. While we believe that our previously filed SEC reports comply, and we intend that all future reports will comply in all material respects with the published SEC rules and regulations, we could be required to modify or reformulate information contained in prior filings as a result of an SEC
review. Any modification or reformulation of information contained in such reports could be significant and result in material liability to us and have a material adverse impact on the trading price of our common stock.
27
The Company conducts its operations from various facilities under operating leases. The Company leases 17,249 square feet of space located in Malvern, Pennsylvania for its principal executive office and used for general administrative functions, sales activities, and product development. The lease term expires on April 30, 2016. As of June 30, 2011, the Company’s rent payment for this facility is $29,000 per month.
The Company also leases 13,377 square feet of space, located in Malvern, Pennsylvania for its product warehousing, shipping and customer support. The lease term expires December 31, 2011. As of June 30, 2011, the Company’s rent payment for this facility is $14,500 per month with escalating rental payments through the remainder of the lease.
The Company is not a party to any legal proceedings.
28
The common stock of the Company trades on The NASDAQ Global Market under the symbol USAT. The high and low bid prices on The NASDAQ Global Market for the common stock were as follows:
|
Year ended June 30, 2011
|
High
|
Low
|
||||||
|
First Quarter (through September 30, 2010)
|
1.50 | 0.46 | ||||||
|
Second Quarter (through December 31, 2010)
|
1.60 | 0.97 | ||||||
|
Third Quarter (through March 31, 2011)
|
2.75 | 1.04 | ||||||
|
Fourth Quarter (through June 30, 2011)
|
3.74 | 1.93 | ||||||
|
Year ended June 30, 2010
|
High
|
Low
|
||||||
|
First Quarter (through September 30, 2009)
|
3.01 | 1.35 | ||||||
|
Second Quarter (through December 31, 2009)
|
1.82 | 1.50 | ||||||
|
Third Quarter (through March 31, 2010)
|
1.77 | 1.04 | ||||||
|
Fourth Quarter (through June 30, 2010)
|
1.29 | 0.48 | ||||||
On August 31, 2011, there were 632 record holders of the Common Stock and 364 record holders of the Preferred Stock.
The holders of the Common Stock are entitled to receive such dividends as the Board of Directors of the Company may from time to time declare out of funds legally available for payment of dividends. Through the date hereof, no cash dividends have been declared on the Company’s Common Stock or Preferred Stock. No dividend may be paid on the Common Stock until all accumulated and unpaid dividends on the Preferred Stock have been paid. As of August 31, 2011, such accumulated unpaid dividends amounted to $10,599,646.
As of June 30, 2011, equity securities authorized for issuance by the Company with respect to compensation plans were as follows:
|
Number of
|
Weighted
|
Number of
|
|||||||||||
|
Securities to be
|
average exercise
|
securities remaining
|
|||||||||||
|
issued upon
|
price of
|
available for future
|
|||||||||||
|
exercises of
|
outstanding
|
issuance (excluding
|
|||||||||||
|
outstanding options
|
options and
|
securities reflected
|
|||||||||||
|
and warrants
|
warrants
|
in column(a)
|
|||||||||||
|
Plan category
|
(a)
|
(b)
|
(c)
|
||||||||||
|
Equity compensation plans approved by security holders
|
- | - | 490,082 | (3) | |||||||||
|
Equity compensation plans not approved by security holders
|
90,666 | (1) | 7.53 | 140,000 | (2) | ||||||||
|
Total
|
90,666 | 7.53 | 630,082 | ||||||||||
1) Represents stock options outstanding as of June 30, 2011 for the purchase of shares of Common Stock of the Company expiring at various times from March 2012 through June 2013. All such options were granted to then current employees and directors of the Company. Exercise prices for all the options outstanding were at prices that were either equal to or greater than the market price of the Company’s Common Stock on the dates the options were granted. Shareholder approval of these options was not required because the options were granted prior to the Company’s shares being listed on The NASDAQ Stock Market LLC.
2) Represents shares of Common Stock issuable to the Company’s Chief Executive Officer under the terms of his employment agreement. Shareholder approval of the foregoing was not required because the employment agreement was entered into by the Company prior to the Company’s shares being listed on The NASDAQ Stock Market LLC.
3) Represents 190,082 shares of Common Stock issuable under the Company’s 2010 Stock Incentive Plan as approved by shareholders on June 15, 2010 and 300,000 shares of Common Stock issuable under the Company’s 2011 Stock Incentive Plan as approved by shareholders on June 13, 2011 for use in compensating employees, officers and directors. The shares either have been, or will be registered with the Securities and Exchange Commission as an employee benefit plan under Form S-8.
29
As of August 31, 2011, shares of Common Stock reserved for future issuance were as follows:
| - | 90,666 shares issuable upon the exercise of stock options at exercise prices ranging from $7.50 to $8.00 per share; |
| - | 15,562,649 shares issuable upon the exercise of common stock warrants at exercise prices ranging from $1.13 to $7.70 per share; 11,298,649 of which were exercisable as of August 31, 2011 at prices ranging from $1.13 to $7.70 per share; and 4,264,000 will be exercisable beginning on September 18, 2011 at $2.6058 per share; |
| - | 15,030 shares issuable upon the conversion of outstanding Preferred Stock and cumulative Preferred Stock dividends; |
| - | 190,082 shares issuable under the 2010 Stock Incentive Plan; |
| - | 300,000 shares issuable under the 2011 Stock Incentive Plan; and |
| - | 140,000 shares issuable to Mr. Jensen under his employment agreement upon the occurrence of a USA Transaction. |
PERFORMANCE GRAPH
The following graph shows a comparison of the 5-year cumulative total shareholder return for our common stock with The NASDAQ Composite Index and the S&P 500 Information Technology Index for small cap companies in the United States. The graph assumes a $100 investment on June 30, 2006 in our common stock and in the NASDAQ Composite Index and the S&P 500 Information Technology Index, including reinvestment of dividends.
COMPARISON OF 5-YEAR CUMULATIVE TOTAL RETURN
Among USA Technologies, Inc., The NASDAQ Composite Index and The S&P 500 Information Technology Index
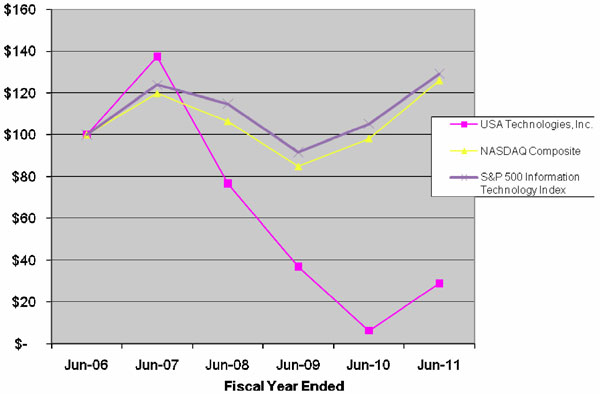
|
Total Return For:
|
Jun-06
|
Jun-07
|
Jun-08
|
Jun-09
|
Jun-10
|
Jun-11
|
||||||||||||||||||
|
USA Technologies, Inc.
|
$ | 100 | $ | 137 | $ | 77 | $ | 37 | $ | 6 | $ | 29 | ||||||||||||
|
NASDAQ Composite
|
100 | 120 | 106 | 85 | 98 | 126 | ||||||||||||||||||
|
S&P 500 Information Technology Index
|
100 | 124 | 115 | 92 | 105 | 129 | ||||||||||||||||||
The information in the performance graph is not deemed to be “soliciting material” or to be “filed” with the Securities and Exchange Commission or subject to Regulation 14A or 14C under the Securities Exchange Act of 1934, as amended, or to the liabilities of Section 18 of the Securities Exchange Act of 1934, as amended, and will not be deemed to be incorporated by reference into any filing under the Securities Act of 1933, as amended, or the Securities Exchange Act of 1934, as amended, except to the extent that we specifically incorporate it by reference into such a filing. The stock price performance included in this graph is not necessarily indicative of future stock price
performance.
30
The following selected financial data for the five years ended June 30, 2011 are derived from the audited consolidated financial statements of USA Technologies, Inc. The data should be read in conjunction with the consolidated financial statements, related notes, and other financial information.
|
Year ended June 30
|
||||||||||||||||||||||||
|
2011
|
2010
|
2009
|
2008
|
2007
|
2006
|
|||||||||||||||||||
|
OPERATIONS DATA
|
||||||||||||||||||||||||
|
Revenues
|
$ | 22,868,789 | $ | 15,771,106 | $ | 12,020,123 | $ | 16,103,546 | $ | 9,158,012 | $ | 6,414,803 | ||||||||||||
|
Net loss
|
$ | (6,457,067 | ) | $ | (11,571,495 | ) | $ | (13,731,818 | ) | $ | (16,417,893 | ) | $ | (17,782,458 | ) | $ | (14,847,076 | ) | ||||||
|
Cumulative preferred dividends
|
(665,577 | ) | (735,139 | ) | (772,997 | ) | (780,588 | ) | (781,451 | ) | (783,289 | ) | ||||||||||||
|
Loss applicable to common shares
|
$ | (7,122,644 | ) | $ | (12,306,634 | ) | $ | (14,504,815 | ) | $ | (17,198,481 | ) | $ | (18,563,909 | ) | $ | (15,630,365 | ) | ||||||
|
Loss per common share (basic and diluted)
|
$ | (0.26 | ) | $ | (0.55 | ) | $ | (0.95 | ) | $ | (1.21 | ) | $ | (2.13 | ) | $ | (3.15 | ) | ||||||
|
Cash dividends per common share
|
- | - | - | - | - | - | ||||||||||||||||||
|
BALANCE SHEET DATA
|
||||||||||||||||||||||||
|
Total assets
|
$ | 36,004,005 | $ | 29,848,424 | $ | 25,980,378 | $ | 40,055,651 | $ | 34,491,497 | $ | 23,419,466 | ||||||||||||
|
Long-term debt
|
$ | 253,061 | $ | 596,155 | $ | 820,059 | $ | 967,518 | $ | 1,029,745 | $ | 7,780,853 | ||||||||||||
|
Shareholders’ equity
|
$ | 26,125,531 | $ | 22,812,172 | $ | 19,972,272 | $ | 32,576,549 | $ | 28,084,206 | $ | 11,177,064 | ||||||||||||
31
USA Technologies, Inc. provides wireless networking, cashless transactions, asset monitoring and energy management products and services. The Company markets and sells its products and services principally to the vending, hospitality, retail and laundry industries. Our technology, ePort® and ePort SDK™, can be installed and/or embedded into everyday devices such as vending machines, kiosks and copiers, as well as our eSuds™ technology for washer and dryers. Our associated network service, ePort Connect®, provides wireless connectivity that facilitates cashless transaction
processing and remote monitoring of assets, through the collection of financial/sales and machine diagnostic data, which is made accessible to our customers via our USALive® website. In addition, the Company provides energy management products, such as its VendingMiser® and CoolerMiser™, which reduce energy consumption in vending machines and coolers.
The Company generates revenue in multiple ways. The Company generates revenue through the sale or rental of equipment and/or through the licensing of its technology. In addition, we generate recurring revenues through our associated services. The Company charges a monthly network service fee for each device that is connected to the Company’s network. In addition, we charge a transaction processing fee for cashless transactions we process. Since our energy management products are a stand-alone, non-networked device, we only generate revenue through the sale of equipment.
CRITICAL ACCOUNTING POLICIES
GENERAL
The preparation of consolidated financial statements in conformity with accounting principles generally accepted in the United States requires management to make estimates and assumptions that affect the amounts reported in the financial statements and the accompanying notes. Actual results could differ from those estimates. We believe the policies and estimates related to revenue recognition, software development costs, impairment of long-lived assets, goodwill and intangible assets, and investments represent our critical accounting policies and estimates. Future results may differ from our estimates under different assumptions or conditions.
REVENUE RECOGNITION
Revenue from the sale of equipment is recognized on the terms of freight-on-board shipping point, or upon installation and acceptance of the equipment if installation services are purchased for the related equipment. Activation fee revenue is recognized when the Company’s cashless payment device is initially activated for use on the Company network. Transaction processing revenue is recognized upon the usage of the Company’s cashless payment and control network. License fees for access to the Company’s devices and network services are recognized on a monthly basis. In all cases, revenue is only recognized when persuasive evidence of an arrangement exists, delivery has occurred or services have
been rendered, the price is fixed and determinable, and collection of the resulting receivable is reasonably assured. The Company estimates an allowance for product returns at the date of sale.
IMPAIRMENT OF LONG LIVED ASSETS
In accordance with the Financial Accounting Standards Board Accounting Standards Codification® ("ASC") Topic 360 “Impairment or Disposal of Long-lived Assets”, the Company reviews its long-lived assets whenever events or changes in circumstances indicate that the carrying amount of such assets may not be recoverable. If the carrying amount of an asset or group of assets exceeds its net realizable value, the asset will be written down to its fair value. In the period when the plan of sale criteria of ASC 360 are met, long-lived assets are reported as held for sale, depreciation and amortization cease, and the assets
are reported at the lower of carrying value or fair value less costs to sell.
GOODWILL AND INTANGIBLE ASSETS
Goodwill represents the excess of cost over fair value of the net assets purchased in acquisitions. The Company accounts for goodwill in accordance with ASC 350, “Intangibles – Goodwill and Other”. Under ASC 350, goodwill is not amortized to earnings, but instead is subject to periodic testing for impairment. The Company tests goodwill for impairment using a two-step process. The first step screens for potential impairment, while the second step measures the amount of impairment. The Company uses a discounted cash flow analysis to complete the first step in this process. We also give consideration to our market capitalization. Testing for impairment is to be done at least annually and at other
times if events or circumstances arise that indicate that impairment may have occurred. The Company has selected April 1 as its annual test date. The Company has concluded there has been no impairment of goodwill as a result of its testing on April 1, 2011, April 1, 2010 and April 1, 2009.
32
The Company trademarks with an indefinite economic life are not being amortized. The trademarks, not subject to amortization, are related to the miser asset group and consist of the following trademarks: 1) VendingMiser, 2) CoolerMiser, 3) PlugMiser and 4) SnackMiser. The Company tests indefinite-lived intangible assets for impairment using a two-step process. The first step screens for potential impairment, while the second step measures the amount of impairment. The Company uses a discounted cash flow analysis to complete the first step in this process. Testing for impairment is to be done at least annually and at other times if events or circumstances arise that indicate that impairment may have occurred. The
Company has selected April 1 as its annual test date for its indefinite-lived intangible assets. The Company has concluded there was an impairment of its indefinite-lived trademarks as a result of its testing and has recorded a $581,900 impairment expense in fourth quarter of the fiscal year ended June 30, 2011 (see Note 5 to the Consolidated Financial Statements). There was no impairment expense recorded during fiscal years ended June 30, 2010 or 2009.
Patents and trademarks, with an estimated economic life, are carried at cost less accumulated amortization, which is calculated on a straight-line basis over their estimated economic life. The Company reviews intangibles, subject to amortization, for impairment whenever events or changes in circumstances indicate that the carrying amount may not be recoverable. An asset is considered to be impaired when the sum of the undiscounted future net cash flows resulting from the use of the asset and its eventual disposition is less than its carrying amount. The amount of the impairment loss, if any, is measured as the difference between the net book value of the asset and its estimated fair value. Other than described
above, as of June 30, 2011 and 2010, the Company has concluded there has been no impairment of its other patents or trademarks that are subject to amortization.
33
RESULTS OF OPERATIONS
We were recently notified by Elavon, our United States credit and debit card processor, that effective October 1, 2011, Visa and MasterCard will significantly raise their interchange fees for small ticket category transactions paid for through debit cards issued by regulated banks as defined under the “Durbin Amendment” to the Dodd Frank Wall Street Reform and Consumer Protection Act of 2010. If the Company continues to accept debit cards, then pursuant to our contract with Elavon, we are obligated to pay to Elavon the increases in these interchange rates. The interchange rate would increase from 1.55% of a transaction plus 4 cents, to 0.5% of a transaction plus 22 cents, which represents an increase
of approximately 247% based on a transaction of $1.67, which was the average transaction experienced by the Company during fiscal year 2011. During the fiscal year ended June 30, 2011, approximately 82% of the transactions handled by our network consisted of small ticket debit card transactions. Of such debit card transactions, it is estimated that 70% of those were debit transactions from regulated banks. Therefore, we anticipate that approximately 57% of all our transactions handled would be affected by the new rate.
The Company, and its card processor (Elavon), are currently in discussions with the card associations to analyze the impact of the rate increases, in order to attempt to negotiate a viable rate structure.
In addition to these discussions, the Company has formulated steps that it is contemplating to enact, as it does not intend to incur the increase in these costs. Although we have not taken any definitive action at this time, one of these steps includes not accepting debit cards, so long as the rates remain at the newly announced level. At the present time, we cannot predict how not accepting debit cards, or other steps we are contemplating would affect our business.
We believe that if debit cards are not accepted, the reduction in debit card volume could be replaced by credit card use due to the number of credit cards in circulation in the United States. The number of credit cards and debit cards in circulation at the end of the 2010 calendar year in the United States was approximately 489 million and 520 million, respectively, according to www.CREDITCARDS.com. However, we cannot estimate at this time, if or to what extent the reduction in debit card volume would be replaced by credit cards.
If the amount of cashless volume handled by the Company decreases as a result of the steps taken by the Company, our license and transaction revenue would decline by an amount equal to the transaction processing rate the Company charges our customer per cashless transaction. In addition, the rate of future connections, and/or current connections to our network could be materially adversely affected. If connections are negatively impacted, we could experience a reduction in license and transaction fee revenue as a result of fewer network services fees collected as a result of reduced connections to our network. We cannot estimate a dollar amount at this time that a reduction in cashless processing volume or
connections would have on our revenues, nor the future acceptance of the Company’s cashless products and services.
FISCAL YEAR ENDED JUNE 30, 2011 COMPARED TO FISCAL YEAR ENDED JUNE 30, 2010
Revenues for the year ended June 30, 2011 were $22,868,789, consisting of $6,426,304 of equipment sales and $16,442,485 of license and transactions fees, compared to $15,771,106, consisting of $6,464,006 of equipment sales and $9,307,100 of license and transaction fees for the year ended June 30, 2010. The increase in total revenue of $7,097,683, or 45%, was primarily due to an increase in license and transaction fees of $7,135,385, or 77%, from the prior period, offset by a decrease in equipment sales of $37,702 or 1%, from the prior period. The increase in license and transaction fees was primarily due to the increase in the number of ePort® units
connected to our USALive® network, and the associated fees generated by these connected units. License and transaction fee revenues consist of service fees and transaction processing fees. We anticipate that our license and transaction fee revenues would continue to increase if the number of connections to our network would continue to increase.
As of June 30, 2011, the Company had approximately 119,000 connections to our USALive® network (including approximately 13,000 third party devices, which are predominantly MEI devices purchased by customers) as compared to approximately 82,000 connections to our USALive® network (including approximately 7,000 third party devices, which are predominantly MEI devices purchased by customers) as of June 30, 2010. During the year ended June 30, 2011, the Company added approximately 37,000 connections to our network. The Jump Start program
units represented slightly above 60% and 45% of connections added during the June 2011 and June 2010 fiscal years, respectively.
During the year ended June 30, 2011, the Company processed approximately 72 million transactions totaling approximately $120 million of transaction processing volume compared to approximately 37 million transactions totaling approximately $68 million of transaction processing volume during the year ended June 30, 2010, an increase of approximately 95% in the number of transactions and approximately 76% in dollars processed. During the fiscal year ended June 30, 2011, approximately 82% of the transactions handled by our network consisted of small ticket debit card transactions. Pursuant to its agreements with customers, the Company earns transaction processing fees equal to a percentage of the dollar volume
processed by the Company, which are included as licensing and transaction processing revenues in its Consolidated Statements of Operations. The Company’s transaction processing volume is not indicative of the gross profit from license and transaction fees which is based upon the monthly service fees and transaction processing fees paid to us by our customers.
In addition, our customer base increased with approximately 875 new ePort customers added to its USALive® network during the year ended June 30, 2011 bringing the total number of such customers to approximately 1,925 as of June 30, 2011. The Company added approximately 300 new ePort customers in the year ended June 30, 2010. By comparison, the Company had approximately 1,050 ePort customers as of June 30, 2010, representing an 83% increase during the past fiscal year. We count a customer as a new ePort customer upon shipment of the first ePort unit to the customer. When a reseller sells our ePort, we count a customer as a new ePort customer upon the signing of the applicable services agreement with the
customer.
The $37,702 decrease in equipment sales was a result of an increase of approximately $365,000 related to Energy Miser products offset by a net decrease of approximately $157,000 in sales of ePort® products and fees and a decrease of approximately $246,000 in sales of the Business Center and eSuds® product lines combined. The net decrease in ePort® related sales revenue of $157,000 is attributable to reduced hardware sales of approximately $683,000, offset by increases of approximately $526,000 in revenue associated with other aspects of our ePort business described below. The decrease in hardware sale revenue is due mainly to a significant portion of the ePort® units shipped during the year
ended June 30, 2011were part of the Jump Start Program, for which the Company records a one-time activation fee, but does not record an equipment (hardware) sale. The Jump Start Program began in December 2009, therefore most ePort® units shipped during the year ended June 30, 2010 were sold to our customers and an equipment (hardware) sale was recorded. Pursuant to the Jump Start Program, the Company is entitled to receive a one-time activation fee upon shipment of the device, a monthly service fee, generally commencing the month after shipment, and transactional processing fees due in connection with the cashless activity generated by the device. The decrease in hardware sales was offset by increases of (1) approximately $228,000 in activation related fees related to Jump Start Program units, (2) $225,000 of Visa support funding for installation and making operational Visa
accepting ePorts, and (3) approximately $73,000 of revenue recognized under our May 2008 agreement with a customer.
The Company entered into an Acceptance and Promotional Agreement with Visa USA, Inc. on August 16, 2010. Under the first program year of the agreement, the Company is entitled to receive up to $225,000 to be used to support the installation and making operational of up to 9,000 terminals, which accept the Visa brand, by no later than December 31, 2010. During the year ended June 30, 2011, the Company recorded $225,000 of revenue related to the support funding for installation and making operational of Visa accepting terminals. As required by the Visa agreement, the Company supported the installation and made operational at least 9,000 terminals by December 31, 2010.
34
Cost of sales consisted of equipment costs of $3,468,993 and $4,049,433 and network and transaction services related costs of $11,651,138 and $6,861,642 for the year ended June 30, 2011 and 2010, respectively. The increase in total cost of sales of $4,209,056 over the prior fiscal year was due to a decrease in equipment costs of $580,440, offset by an increase in network and transaction services of $4,789,496. The decrease in equipment costs was a direct result of shipping more units under the Jump Start Program. The costs associated with the Jump Start units were recorded to Property and Equipment on the Consolidated Balance Sheets. The Jump Start Program started in December 2009. The increase in network and
transaction services costs was directly related to increases in units connected to the network and increases in processing volume, offset by decreases in third party supplier costs due to an amendment to a contract which occurred in the quarter ended March 31, 2010.
Gross profit (“GP”) for the year ended June 30, 2011 was $7,748,658 compared to gross profit of $4,860,031 for the previous fiscal year, an increase of $2,888,627, of which $542,738 is attributable to equipment sales and $2,345,889 is attributable to license and transaction fees. The increase in GP from equipment sales is predominately due to the increase in activation fees on Jump Start connections as compared to the prior fiscal year as well as the Visa support funding recorded during the year ended June 30, 2011. The increase in GP dollars from license and transaction fees was generated by additional devices connected to our network and a decrease in third party supplier costs related to the
contract amendment referred to above. GP increased overall from 31% to 34%, equipment sales GP increased from 37% to 46% due mainly to (1) approximately $228,000 increase in activation related fees related to Jump Start Program units added during the fiscal year 2011 compared to the Jump Start Program units added during the year ended June 30, 2010, (2) $225,000 of Visa support funding for installation and making operational Visa accepting ePorts during the year ended June 30, 2011 and $0 during the year ended June 30, 2010, and (3) approximately $73,000 of revenue recognized under our May 2008 agreement with a customer during the year ended June 30, 2011, and license and transaction fees GP increased from 26% to 29% due mainly to the decrease in third party supplier costs related to the contract amendment referred to above.
Selling, general and administrative expenses (“SG&A”) of $11,430,610 for the year ended June 30, 2011, decreased by $3,455,075 or 23%, from the prior fiscal year, due to an approximate $2,300,000 decrease as a result of the Company’s expense reduction efforts and an approximate $1,156,000 decrease in proxy contest, litigation and settlement expenses. The Company’s expense reduction of $2,300,000 consisted of decreases in consulting and other professional services of approximately $1,511,000, compensation expenses of approximately $581,000, facility expenses of approximately $128,000, product development material costs of approximately $127,000, offset by net increases of approximately
$47,000.
The consulting and other professional services decrease of approximately $1,511,000 was primarily due to $522,000 of reductions in costs of information technology, as well as reductions in costs of research and development of approximately $496,000, legal costs of approximately $220,000, accounting charges of approximately $116,000 and expenses for other services of approximately $156,000, net. The compensation expense net decrease of approximately $581,000 was due to a decrease of approximately $664,000 in salaries, severances and commissions, as well as a decrease of approximately $143,000 in benefit costs, offset by an increase of approximately $226,000 related to non-cash compensation
expenses.
During the fiscal year ended June 30, 2011, the Company recorded an impairment charge of $581,900 on an intangible asset. The intangible asset impaired is related to the Miser energy products and consists of the trademarks: 1) VendingMiser, 2) CoolerMiser, 3) PlugMiser and 4) SnackMiser. This asset is unrelated to the Company’s core operations related to the ePort wireless, cashless products. The Company believes the impairment of this non-core asset, and the factors surrounding its impairment do not in any way effect the ongoing operations of the Company.
The year ended June 30, 2011 resulted in a net loss of $6,457,067 (including approximately $4.6 million of non-cash charges) compared to a net loss of $11,571,495 (including approximately $2 million of non-cash charges) for the year ended June 30, 2010, an improvement of $5,114,428, or 44%. Net loss for the year ended June 30, 2011 was the lowest net loss of any fiscal year since our shares became listed on The NASDAQ Stock Market in March 2007. For the year ended June 30, 2011, the loss per common share was $.26 as compared to a loss per common share of $.55 for the prior fiscal year.
35
FISCAL YEAR ENDED JUNE 30, 2010 COMPARED TO FISCAL YEAR ENDED JUNE 30, 2009
Total revenues for the year ended June 30, 2010 were $15,771,106, consisting of $6,464,006 of equipment sales and $9,307,100 of license and transaction fees, compared to $12,020,123, consisting of $6,158,017 of equipment sales and $5,862,106 of license and transaction fees for the year ended June 30, 2009. The increase in total revenue of $3,750,983, or 31%, was primarily due to an increase in license and transaction fees of $3,444,994, or 59% from the prior period, and an increase in equipment sales of $305,989. The increase in license and transaction fees was primarily due to the increase in the number of ePort® units connected to our
USALive® network as well as increased revenue on those connected units. As of June 30, 2010, the Company had approximately 82,000 devices connected to our USALive® network generating license fee revenue as compared to approximately 52,000 devices connected to our USALive network as of June 30, 2009. During the year ended June 30, 2010, the Company processed approximately 36.9 million transactions totaling approximately $67.6 million compared to approximately 22.4 million transactions totaling over $47.1 million during the year ended June 30, 2009, an increase of approximately 65% in transaction volume and approximately 44% in dollars processed. During the fiscal year ended June 30, 2010, approximately 80% of the transactions handled by our network consisted of small ticket debit card transactions. Pursuant to its
agreements with customers, the Company earns transaction processing fees equal to a percentage of the dollar volume processed by the Company, which are included as licensing and transaction processing revenues in its Consolidated Statements of Operations. The Company’s transaction processing volume is not indicative of the GP from license and transaction fees which is based upon the monthly service fees and transaction processing fees paid to us by our customers.
The $305,989 increase in equipment sales was derived from increases in sales of ePort® and Energy Miser products of $488,545 and $234,888, respectively, offset by decreases in business center and other equipment sales of $359,339 and $58,105, respectively.
Cost of sales for the 2010 fiscal year consisted of equipment costs of $4,049,433 and network and transaction services related costs of $6,861,642. The increase in total cost of sales of $1,740,469 or 19% over the prior fiscal year was due to increases in network and transaction services of $2,181,555 offset by a decrease in equipment costs of $441,086. The increase in network and transaction services costs was directly related to increases in units connected to the network, processing volume, as well as increases in costs from third party transaction suppliers for the first six months of the 2010 fiscal year. The decrease in equipment costs was due to a decrease of approximately $331,000 in equipment costs
related to lower equipment sales volume, and a decrease of approximately $110,000 related to our estimate for product warranty liabilities.
GP for the year ended June 30, 2010 was $4,860,031 compared to GP of $2,849,517 for the previous fiscal year, an increase of $2,010,514, of which $747,075 is attributable to equipment sales and $1,263,439 from license and transaction fees. The increase in equipment sales GP of approximately $750,000 was a result of an approximate $640,000 increase in GP on higher equipment sales and approximately $110,000 related to a reduction in product warranty liabilities. The approximate $1.26 million increase in GP related to license and transaction fee revenue was generated by additional devices connected to our network, offset by increased transaction supplier charges incurred during the first six months of the 2010 fiscal
year. The reduction in supplier costs associated with a recently negotiated amendment to a supplier contract took effect in December 2009. Therefore, the full impact of the new negotiated agreement was not realized until the second half of the 2010 fiscal year. Percentage based total GP increased overall from 24% to 31%, equipment sales GP increased from 27% to 37%, and license and transaction fees GP increased from 20% to 26%. Considering the reduction for product warranty liabilities and for comparability purposes, GP would have been as follows for the year ended June 30, 2010 had the change not been made – total GP would have increased to 30%, equipment sales GP would have increased to 36%, and license and transaction fees GP would have remained at 24% as it was not affected by the reduction.
Selling, general and administrative expense of $14,885,685, decreased by $298,162 or 2%, primarily due to a decrease in compensation and benefit expenses of approximately $1,042,000 and decreases in other professional services of approximately $635,000, travel and entertainment of approximately $137,000 and product development of approximately $186,000, offset by an increase in professional services related to the proxy contest and related litigation of approximately $1,579,000 (net of insurance carrier contribution). Of the approximate $1,579,000 in proxy contest and litigation costs (net of insurance carrier contribution), approximately $710,000 (net of insurance carrier contribution) was for the legal
settlement, approximately $200,000 (net of insurance carrier contribution) was for legal expenses of the Company related to the litigation, and approximately $669,000 was for proxy contest costs. Selling, general and administrative expense excluding the proxy contest and litigation costs was $13,306,685 a decrease of $1,877,162 or 12% as compared to the prior fiscal year, primarily due to cost reduction measures taken by the Company during the third quarter of fiscal 2009.
Compensation expense decreased by approximately $1,042,000 primarily due to a decrease of approximately $1,486,000 in salaries and benefits as well as an increase of $419,000 in non-cash charges related to the Long-Term Equity Incentive Program (“LTIP” or “LTIP Program”).
The year ended June 30, 2010 resulted in a net loss of $11,571,495 (including approximately $2 million of non-cash charges) compared to a net loss of $13,731,818 (including approximately $2.6 million of non-cash charges) for the year ended June 30, 2009. As of June 30, 2010, net loss for the 2010 fiscal year was the lowest fiscal year net loss since our shares became listed on The NASDAQ Stock Market in March 2007.
36
FISCAL QUARTER ENDED JUNE 30, 2011 COMPARED TO FISCAL QUARTER ENDED JUNE 30, 2010
Revenues for the quarter ended June 30, 2011 were $6,888,630 compared to $4,479,106 for the quarter ended June 30, 2010. This $2,409,524 or 54% increase was primarily due to an increase in license and transaction fees of $2,099,046 and an increase in equipment sales of $310,478. The increase in license and transaction fees was primarily due to the increase in the number of ePort® units connected to our USALive® network, and the associated fees generated by these connected units. License and transaction fee revenues consist of service fees and transaction processing fees. We anticipate that
our license and transaction fee revenues will continue to increase as the number of connections to our network continues to increase.
As of June 30, 2011, the Company had approximately 119,000 connections to our USALive® network (including approximately 13,000 third party devices, which are predominantly MEI devices purchased by customers) as compared to approximately 82,000 connections to our USALive® network (including approximately 7,000 third party devices, which are predominantly MEI devices purchased by customers) as of June 30, 2010. During the quarter ended June 30, 2011, the Company added approximately 7,000 connections to our network.
During the quarter ended June 30, 2011, the Company processed approximately 22.5 million transactions totaling approximately $37.4 million of transaction processing volume compared to approximately 11.7 million transactions totaling approximately $20.8 million of transaction processing volume during the quarter ended June 30, 2010, an increase of approximately 92% in the number of transactions and approximately 80% in dollars processed. During the quarter ended June 30, 2011, approximately 82% of the transactions handled by our network consisted of small ticket debit card transactions. Pursuant to its agreements with
customers, the Company earns transaction processing fees equal to a percentage of the dollar volume processed by the Company, which are included as licensing and transaction processing revenues in its Consolidated Statements of Operations. The Company’s transaction processing volume is not indicative of the GP from license and transaction fees which is based upon the monthly service fees and transaction processing fees paid to us by our customers.
In addition, our customer base increased with approximately 275 new ePort customers added to its USALive® network during the quarter ended June 30, 2011 bringing the total number of such customers to approximately 1,925 as of June 30, 2011. Last year, the Company added approximately 75 new ePort customers in the quarter ended June 30, 2010. We count a customer as a new ePort customer upon shipment of the ePort unit to the customer. When a reseller sells our ePort, we count a customer as a new ePort customer upon the signing of the applicable services agreement with the customer.
The $310,478 increase in equipment sales was a result of an increases of approximately $348,000 in sales of ePort® products and approximately $131,000 in sales of Energy Miser products, offset by a decrease of approximately $169,000 in other equipment sales.
Cost of sales consisted of equipment costs of $1,194,168 and $920,767 and network and transaction services related costs of $3,342,526 and $2,033,420 for the quarters ended June 30, 2011 and 2010, respectively. The increase in total cost of sales of approximately $1,583,000 over the prior fiscal quarter was due to an increase in equipment costs of approximately $273,000, and an increase in network and transaction services of approximately $1,309,000. The increase in equipment costs was a result of selling more units in the quarter ended June 30, 2011 than the same quarter in the prior fiscal year. The costs associated with the JumpStart units shipped in the quarters ended June 30, 2011 and 2010 were recorded to
Property and Equipment on the Consolidated Balance Sheets. The increase in network and transaction service costs was related to increases in units connected to the network and increases in processing volume.
GP for the quarter ended June 30, 2011 was $2,351,936 compared to GP of $1,524,919 for the same quarter in the previous fiscal year, an increase of $827,017, of which $789,940 is attributable to license and transaction fees and $37,077 is from equipment sales. The increase in GP related to license and transaction fee revenue was generated by additional devices connected to our network as well as an increase in the average number of transactions per unit in the quarter ended June 30, 2011. Percentage based total GP stayed the same overall, while equipment sales GP decreased from 41% to 36% and license and transaction fee GP increased from 31% to 34%.
Selling, general and administrative expense of $3,394,072, increased by $132,268 or 4%, primarily due to non-cash increases in bad debt expense of approximately $138,000 and increased losses on disposal of property and equipment of approximately $102,000 offset by net decreases in compensation and benefit expenses of approximately $141,000 and other net increases of approximately $33,000.
During the quarter ended June 30, 2011, the Company recorded an impairment charge of $581,900 on an intangible asset. The intangible asset impaired is related to the Miser energy products and consists of the trademarks: 1) VendingMiser, 2) CoolerMiser, 3) PlugMiser and 4) SnackMiser. This asset is unrelated to the Company’s core operations related to the ePort wireless, cashless products. The Company believes the impairment of this non-core asset, and the factors surrounding its impairment do not in any way effect the ongoing operations of the Company.
The quarter ended June 30, 2011 resulted in a net loss of $1,923,055 (including approximately $1.8 million of non-cash charges) compared to a net loss of $2,089,801 (including approximately $0.5 million of non-cash charges) for the quarter ended June 30, 2010.
37
LIQUIDITY AND CAPITAL RESOURCES
For the year ended June 30, 2011, net cash of $5,171,529 was used by operating activities, primarily due to cash used related to changes in the Company’s operating assets and liabilities of $3,265,590 and the net loss of $6,457,067 offset by non-cash charges totaling $4,551,128, representing the change in fair value of common stock warrants, vesting and issuance of common stock for employee and director compensation, bad debt expense, loss on disposal of equipment, impairment on an intangible asset and the depreciation and amortization of assets.
The $3,265,590 change in the Company’s operating assets and liabilities was primarily the result of $4,263,302 of inventory used in the Jump Start Program during the fiscal year, offset by a $1,067,631 increase in accounts payable.
During the year ended June 30, 2011, the Company used $291,390 in investing activities related to the purchase of network equipment and had $10,850,106 of net cash provided by financing activities mainly due to proceeds from stock issuances, which includes $1,390,006 from the exercise of warrants, less repayment of long-term debt.
The Company has incurred losses since inception. Our accumulated deficit through June 30, 2011 is composed of cumulative losses amounting to approximately $196,785,123, preferred dividends converted to common stock of approximately $2,723,000, and charges incurred for the open-market purchases of preferred stock of approximately $150,000. The Company has historically raised capital through equity offerings in order to fund operations.
In March 2011, the Company received net cash proceeds of $9,894,095 from the issuance of restricted common stock and common stock warrants (see Note 11 and Note 12 to the Consolidated Financial Statements) to accredited, institutional investors. Due largely to this cash infusion, and the $1,390,006 cash received from the exercise of warrants, the Company had $12,991,511 of cash and cash equivalents on hand, of which approximately $410,000 was cash received by the Company for transaction processing services which is payable to customers.
The proceeds from the March 2011 offering will be used primarily to support the continuation of the Company’s Jump Start Program which was reintroduced to our customers in April 2011.
During the 2012 fiscal year, the Company anticipates incurring capital expenditures of approximately $7,500,000 in connection with ePort units expected to be used in the Jump Start Program and additional capital expenditures of approximately $1,200,000 for property and equipment.
As a result of the connections added during the fiscal year 2011, recurring revenue from license and transaction fees increased from approximately $2,930,000 for the three months ended June 30, 2010 to approximately $5,029,000 for the three months ended June 30, 2011, an increase of 72%. In addition, total GP has increased from $1,525,000 for the three months ended June 30, 2010 to approximately $2,352,000 for the three months ended June 30, 2011, an increase of 54%.
Our average monthly SG&A expenses during the quarter ended June 30, 2011 were approximately $1,131,000. This included non-cash charges of approximately $106,000 for the loss on the disposal of property and equipment and approximately $293,000 of stock-based compensation, as well as cash expenses of approximately $180,000 related to legal expenses as a result of issues arising under the Settlement Agreement dated February 4, 2010 between the Company and Shareholders Advocates for Value Enhancement, which are not expected to continue in fiscal year 2012. Excluding these charges, our average monthly cash-based SG&A expenses during the quarter ended June 30, 2011 were approximately $938,000.
For fiscal year 2012, and subject to the unknown effects of the recent significant interchange fee increase by Visa and MasterCard for small ticket debit card transactions, we expect revenues from license and transaction fees, as well as GP, to continue to increase as the Company’s connections to its network grow. Therefore, assuming our average monthly cash-based SG&A expenses incurred in the June 30, 2011 quarter continues, the Company believes its existing cash and cash equivalents as of June 30, 2011, will provide sufficient funds to meet its cash requirements, including capital for the Jump Start Program and capital expenditures, described above, and repayment of long-term
debt, through at least July 1, 2012.
38
Reconciliation of net loss to Adjusted EBITDA loss for the years ended June 30, 2011, 2010 and 2009:
|
Year ended June 30,
|
||||||||||||
|
2011
|
2010
|
2009
|
||||||||||
|
Net loss
|
$ | (6,457,067 | ) | $ | (11,571,495 | ) | $ | (13,731,818 | ) | |||
|
Less interest income
|
(82,234 | ) | (85,144 | ) | (282,930 | ) | ||||||
|
Plus interest expense
|
35,953 | 60,942 | 96,992 | |||||||||
|
Plus income tax expense
|
- | - | - | |||||||||
|
Plus depreciation expense
|
1,553,978 | 783,415 | 632,408 | |||||||||
|
Plus amortization expense
|
1,034,400 | 1,034,400 | 1,040,379 | |||||||||
|
Plus (less) change in fair value of warrant liabilities
|
815,131 | - | - | |||||||||
|
Plus stock-based compensation
|
356,866 | 130,525 | 948,777 | |||||||||
|
Plus intangible asset impairment
|
581,900 | - | - | |||||||||
|
Adjusted EBITDA loss
|
$ | (2,161,073 | ) | $ | (9,647,357 | ) | $ | (11,296,192 | ) | |||
Reconciliation of net loss to Adjusted EBITDA loss for the quarters ended June 30, 2011 and 2010:
|
Three months ended
|
||||||||
|
June 30,
|
||||||||
|
2011
|
2010
|
|||||||
|
Net loss
|
$ | (1,923,055 | ) | $ | (2,089,801 | ) | ||
|
Less interest income
|
(25,519 | ) | (48,281 | ) | ||||
|
Plus interest expense
|
3,529 | 12,184 | ||||||
|
Plus income tax expense
|
- | - | ||||||
|
Plus depreciation expense
|
480,703 | 264,273 | ||||||
|
Plus amortization expense
|
258,600 | 258,600 | ||||||
|
Less change in fair value of warrant liabilities
|
(35,609 | ) | - | |||||
|
Plus (less) stock-based compensation
|
293,381 | (19,351 | ) | |||||
|
Plus intangible asset impairment
|
581,900 | - | ||||||
|
Adjusted EBITDA loss
|
$ | (366,070 | ) | $ | (1,622,376 | ) | ||
As used herein, Adjusted EBITDA represents net income (loss) before interest income, interest expense, income taxes, depreciation, amortization, and change in fair value of warrant liabilities, stock-based compensation expense and impairment expense on intangible assets. We have excluded the non-operating item, change in fair value of warrant liabilities, because it represents a non-cash charge that is not related to the Company’s operations. We have excluded the non-cash expenses, stock-based compensation and impairment expense on intangible assets, as they do not reflect the cash-based operations of the Company. Adjusted EBITDA is a non-GAAP financial measure which is not required by or defined under GAAP
(Generally Accepted Accounting Principles). The presentation of this financial measure is not intended to be considered in isolation or as a substitute for the financial measures prepared and presented in accordance with GAAP, including the net income or net loss of the Company or net cash used in operating activities. Management recognizes that non-GAAP financial measures have limitations in that they do not reflect all of the items associated with the Company’s net income or net loss as determined in accordance with GAAP, and are not a substitute for or a measure of the Company’s profitability or net earnings. Adjusted EBITDA is presented because we believe it is useful to investors as a measure of comparative operating performance and liquidity, and because it is less susceptible to variances in actual
performance resulting from depreciation and amortization and non-cash charges for changes in fair value of warrant liabilities, stock-based compensation expense and impairment expense on intangible assets.
39
CONTRACTUAL OBLIGATIONS
As of June 30, 2011, the Company had certain contractual obligations due over a period of time as summarized in the following table:
|
Payments due by period
|
||||||||||||||||||||
|
Less Than
|
More than
|
|||||||||||||||||||
|
Contractual Obligations
|
Total
|
1 year
|
1-3 years
|
3-5 years
|
5 years
|
|||||||||||||||
|
Long-Term Debt Obligations
|
$ | 182,774 | $ | 87,680 | $ | 95,094 | $ | - | $ | - | ||||||||||
|
Capital Lease Obligations
|
88,136 | 79,331 | 8,805 | - | - | |||||||||||||||
|
Operating Lease Obligations
|
1,867,203 | 439,848 | 1,106,092 | 321,263 | - | |||||||||||||||
|
Purchase Obligations
|
- | - | - | - | - | |||||||||||||||
|
Other Long-Term Liabilities Reflected on the Registrant’s Balance Sheet under GAAP
|
- | - | - | - | - | |||||||||||||||
|
Total
|
$ | 2,138,113 | $ | 606,859 | $ | 1,209,991 | $ | 321,263 | $ | - | ||||||||||
The Company’s exposure to market risks for interest rate changes is not significant. Interest rates on its long-term debt are generally fixed and its investments in cash equivalents are not significant. The Company has no exposure to market risks related to Available-for-sale securities. Market risks related to fluctuations of foreign currencies are not significant and the Company has no derivative instruments.
40
USA TECHNOLOGIES, INC.
INDEX TO CONSOLIDATED FINANCIAL STATEMENTS
|
Financial Statements:
|
||||
|
Report of Independent Registered Public Accounting Firm
|
F-1 | |||
|
Consolidated Balance Sheets
|
F-2 | |||
|
Consolidated Statements of Operations
|
F-3 | |||
|
Consolidated Statements of Shareholders’ Equity
|
F-4 | |||
|
Consolidated Statements of Cash Flows
|
F-7 | |||
|
Notes to Consolidated Financial Statements
|
F-9 | |||
41
Report of Independent Registered Public Accounting Firm
To the Board of Directors and Shareholders
USA Technologies, Inc.
We have audited the accompanying consolidated balance sheets of USA Technologies, Inc. and subsidiaries as of June 30, 2011 and 2010, and the related consolidated statements of operations, shareholders' equity, and cash flows for each of the three years in the period ended June 30, 2011. Our audits also included the financial statement schedule of USA Technologies, Inc. listed in Item 15(a). These financial statements and financial statement schedule are the responsibility of the Company's management. Our responsibility is to express an opinion on these financial statements based on our audits.
We conducted our audits in accordance with the standards of the Public Company Accounting Oversight Board (United States). Those standards require that we plan and perform the audit to obtain reasonable assurance about whether the financial statements are free of material misstatement. The Company is not required to have, nor were we engaged to perform an audit of its internal control over financial reporting. Our audit included consideration of internal control over financial reporting as a basis for designing audit procedures that are appropriate in the circumstances, but not for the purpose of expressing an opinion on the effectiveness of the Company’s internal control
over financial reporting. Accordingly, we express no such opinion. An audit also includes examining, on a test basis, evidence supporting the amounts and disclosures in the financial statements, assessing the accounting principles used and significant estimates made by management, as well as evaluating the overall financial statement presentation. We believe that our audits provide a reasonable basis for our opinion.
In our opinion, the consolidated financial statements referred to above presents fairly, in all material respects, the financial position of USA Technologies, Inc. and subsidiaries as of June 30, 2011 and 2010, and the results of their operations and their cash flows for each of the three years in the period ended June 30, 2011, in conformity with U.S. generally accepted accounting principles. Also, in our opinion, the related financial statement schedule, when considered in relation to the basic consolidated financial statements taken as a whole, presents fairly in all material respects the information set forth therein.
|
/s/ McGladrey & Pullen, LLP
|
New York, NY
September 27, 2011
F-1
USA Technologies, Inc.
Consolidated Balance Sheets
|
June 30
|
||||||||
|
2011
|
2010
|
|||||||
|
Assets
|
||||||||
|
Current assets:
|
||||||||
|
Cash and cash equivalents
|
$ | 12,991,511 | $ | 7,604,324 | ||||
|
Accounts receivable, less allowance for uncollectible accounts of $113,000 and $41,000, respectively
|
1,634,719 | 2,048,421 | ||||||
|
Finance receivables
|
285,786 | 242,452 | ||||||
|
Inventory
|
2,670,332 | 2,633,971 | ||||||
|
Prepaid expenses and other current assets
|
846,033 | 847,344 | ||||||
|
Total current assets
|
18,428,381 | 13,376,512 | ||||||
|
Finance receivables, less current portion
|
$ | 195,601 | $ | 339,341 | ||||
|
Property and equipment, net
|
7,395,775 | 4,511,889 | ||||||
|
Intangibles, net
|
2,194,353 | 3,810,653 | ||||||
|
Goodwill
|
7,663,208 | 7,663,208 | ||||||
|
Other assets
|
126,687 | 146,821 | ||||||
|
Total assets
|
$ | 36,004,005 | $ | 29,848,424 | ||||
|
Liabilities and shareholders’ equity
|
||||||||
|
Current liabilities:
|
||||||||
|
Accounts payable
|
$ | 5,638,361 | $ | 4,570,730 | ||||
|
Accrued expenses
|
1,088,090 | 1,869,367 | ||||||
|
Current obligations under long-term debt
|
155,428 | 344,652 | ||||||
|
Total current liabilities
|
6,881,879 | 6,784,749 | ||||||
|
Long-term liabilities:
|
||||||||
|
Long-term debt, less current portion
|
97,633 | 251,503 | ||||||
|
Accrued expenses, less current portion
|
166,709 | - | ||||||
|
Warrant liabilities, non-current
|
2,732,253 | - | ||||||
|
Total long-term liabilities
|
2,996,595 | 251,503 | ||||||
|
Total liabilities
|
9,878,474 | 7,036,252 | ||||||
|
Commitments and contingencies (Note 15)
|
||||||||
|
Shareholders’ equity:
|
||||||||
|
Preferred stock, no par value:
|
||||||||
|
Authorized shares- 1,800,000 Series A convertible preferred shares- 900,000 Issued and outstanding shares- 442,968 and 444,468, respectively (liquidation preference of $14,697,100 and $14,079,523, respectively)
|
3,138,056 | 3,148,676 | ||||||
|
Common stock, no par value: Authorized shares- 640,000,000 Issued and outstanding shares- 32,281,140 and 25,497,155, respectively
|
219,772,598 | 209,958,552 | ||||||
|
Accumulated deficit
|
(196,785,123 | ) | (190,295,056 | ) | ||||
|
Total shareholders’ equity
|
26,125,531 | 22,812,172 | ||||||
|
Total liabilities and shareholders’ equity
|
$ | 36,004,005 | $ | 29,848,424 | ||||
See accompanying notes.
F-2
USA Technologies, Inc.
Consolidated Statements of Operations
|
Year ended June 30
|
||||||||||||
|
2011
|
2010
|
2009
|
||||||||||
|
Revenues:
|
||||||||||||
|
Equipment sales
|
$ | 6,426,304 | $ | 6,464,006 | $ | 6,158,017 | ||||||
|
License and transaction fees
|
16,442,485 | 9,307,100 | 5,862,106 | |||||||||
|
Total revenues
|
22,868,789 | 15,771,106 | 12,020,123 | |||||||||
|
Cost of equipment
|
3,468,993 | 4,049,433 | 4,490,519 | |||||||||
|
Cost of services
|
11,651,138 | 6,861,642 | 4,680,087 | |||||||||
|
Gross profit
|
7,748,658 | 4,860,031 | 2,849,517 | |||||||||
|
Operating expenses:
|
||||||||||||
|
Selling, general and administrative
|
11,430,610 | 14,885,685 | 15,183,847 | |||||||||
|
Depreciation and amortization
|
1,424,365 | 1,570,043 | 1,583,426 | |||||||||
|
Impairment of intangible asset
|
581,900 | - | - | |||||||||
|
Total operating expenses
|
13,436,875 | 16,455,728 | 16,767,273 | |||||||||
|
Operating loss
|
(5,688,217 | ) | (11,595,697 | ) | (13,917,756 | ) | ||||||
|
Other income (expense):
|
||||||||||||
|
Interest income
|
82,234 | 85,144 | 282,930 | |||||||||
|
Interest expense
|
(35,953 | ) | (60,942 | ) | (96,992 | ) | ||||||
|
Change in fair value
|
(815,131 | ) | - | - | ||||||||
|
Total other income (expense), net
|
(768,850 | ) | 24,202 | 185,938 | ||||||||
|
Net loss
|
(6,457,067 | ) | (11,571,495 | ) | (13,731,818 | ) | ||||||
|
Cumulative preferred dividends
|
(665,577 | ) | (735,139 | ) | (772,997 | ) | ||||||
|
Loss applicable to common shares
|
$ | (7,122,644 | ) | $ | (12,306,634 | ) | $ | (14,504,815 | ) | |||
|
Loss per common share (basic and diluted)
|
$ | (0.26 | ) | $ | (0.55 | ) | $ | (0.95 | ) | |||
|
Weighted average number of common shares outstanding (basic and diluted)
|
27,665,345 | 22,370,068 | 15,263,788 | |||||||||
|
See accompanying notes.
|
||||||||||||
F-3
USA Technologies, Inc.
Consolidated Statements of Shareholders’ Equity
|
Series A
|
||||||||||||||||
|
Convertible
|
||||||||||||||||
|
Preferred
|
Common
|
Accumulated
|
||||||||||||||
|
Stock
|
Stock
|
Deficit
|
Total
|
|||||||||||||
|
Balance, June 30, 2008
|
$ | 3,686,218 | $ | 193,733,104 | $ | (164,842,773 | ) | $ | 32,576,549 | |||||||
|
Retirement of 162,599 shares of common stock
|
- | (375,584 | ) | - | (375,584 | ) | ||||||||||
|
Retirement of 10,122 shares of preferred stock
|
(71,664 | ) | - | (16,384 | ) | (88,048 | ) | |||||||||
|
Issuance of 56,487 fully-vested shares of common stock to employees and vesting of shares granted under the 2007-A Stock Compensation Plan
|
- | 284,117 | - | 284,117 | ||||||||||||
|
Issuance of 239,253 fully-vested shares of common stock to officers and employees and vesting of shares granted under the 2008 Stock Incentive Plan
|
- | 1,040,526 | - | 1,040,526 | ||||||||||||
|
Issuance of 134,611 net shares of common stock for settlement of the Long-Term Equity Incentive Program liability for Fiscal Year 2008
|
- | 266,530 | - | 266,530 | ||||||||||||
|
Net loss
|
- | - | (13,731,818 | ) | (13,731,818 | ) | ||||||||||
|
Balance, June 30, 2009
|
$ | 3,614,554 | $ | 194,948,693 | $ | (178,590,975 | ) | $ | 19,972,272 | |||||||
|
See accompanying notes.
|
||||||||||||||||
F-4
USA Technologies, Inc.
Consolidated Statements of Shareholders’ Equity (Continued)
|
Series A
|
||||||||||||||||
|
Convertible
|
||||||||||||||||
|
Preferred
|
Common
|
Accumulated
|
||||||||||||||
|
Stock
|
Stock
|
Deficit
|
Total
|
|||||||||||||
|
Retirement of 5,113 shares of common stock
|
$ | - | $ | (9,668 | ) | $ | - | $ | (9,668 | ) | ||||||
|
Retirement of 65,802 shares of preferred stock
|
(465,878 | ) | - | (132,586 | ) | (598,464 | ) | |||||||||
|
Issuance of 40,000 fully-vested shares of common stock to officers and employees and vesting of shares granted under the 2008 Stock Incentive Plan
|
- | 87,354 | - | 87,354 | ||||||||||||
|
Issuance of 7,285,792 shares of common stock at $2.00 per share, less issuance costs of $1,613,425
|
- | 12,958,159 | - | 12,958,159 | ||||||||||||
|
Issuance of 2,753,454 shares of common stock at $0.90 per share, less issuance costs of $504,095
|
- | 1,974,014 | - | 1,974,014 | ||||||||||||
|
Net loss
|
- | - | (11,571,495 | ) | (11,571,495 | ) | ||||||||||
|
Balance, June 30, 2010
|
$ | 3,148,676 | $ | 209,958,552 | $ | (190,295,056 | ) | $ | 22,812,172 | |||||||
|
See accompanying notes.
|
||||||||||||||||
F-5
USA Technologies, Inc.
Consolidated Statements of Shareholders’ Equity (Continued)
|
Series A
|
||||||||||||||||
|
Convertible
|
||||||||||||||||
|
Preferred
|
Common
|
Accumulated
|
||||||||||||||
|
Stock
|
Stock
|
Deficit
|
Total
|
|||||||||||||
|
Conversion of 1,500 shares of preferred stock into 15 shares of common stock
|
$ | (10,620 | ) | $ | 10,620 | $ | - | $ | - | |||||||
|
Conversion of $33,000 of preferred dividends into 33 shares of common stock at $1,000 per share
|
- | 33,000 | (33,000 | ) | - | |||||||||||
|
Issuance of 261,953 shares of common stock at $0.90 per share less issuance cost of $230,087
|
- | 5,671 | - | 5,671 | ||||||||||||
|
Retirement of 2,217 shares of common stock
|
- | (2,261 | ) | - | (2,261 | ) | ||||||||||
|
Issuance of 20,747 fully-vested shares of common stock to employees and vesting of shares granted under the 2008 Stock Incentive Plan
|
- | 10,208 | - | 10,208 | ||||||||||||
|
Issuance of 109,918 fully-vested shares of common stock to employees and directors and vesting of shares granted under the 2010 Stock Incentive Plan
|
- | 292,263 | - | 292,263 | ||||||||||||
|
Issuance of 150,000 shares of common stock to Lincoln Park Capital
|
- | - | - | - | ||||||||||||
|
Issuance of 5,200,000 shares of common stock at $2.064 per share less the fair value of warrants issued of $1,917,122 and less cash issuance costs of $838,705
|
- | 7,976,973 | - | 7,976,973 | ||||||||||||
|
Exercise of 497,367 warrants at $1.13 resulting in the issuance of 497,367 shares of Common Stock
|
- | 562,025 | - | 562,025 | ||||||||||||
|
Exercise of 376,355 warrants at $2.20 resulting in the issuance of 376,355 shares of Common Stock
|
- | 827,981 | - | 827,981 | ||||||||||||
|
Cashless exercise of 127,497 warrants resulting in the issuance of 83,472 shares of Common Stock
|
- | - | - | - | ||||||||||||
|
Issuance of 86,342 shares of common stock for settlement of the Long-Term Equity Incentive Program for Fiscal Year 2010
|
- | 97,566 | - | 97,566 | ||||||||||||
|
Net loss
|
- | - | (6,457,067 | ) | (6,457,067 | ) | ||||||||||
|
Balance, June 30, 2011
|
$ | 3,138,056 | $ | 219,772,598 | $ | (196,785,123 | ) | $ | 26,125,531 | |||||||
|
See accompanying notes.
|
||||||||||||||||
F-6
USA Technologies, Inc.
Consolidated Statements of Cash Flows
|
Year ended June 30
|
||||||||||||
|
2011
|
2010
|
2009
|
||||||||||
|
OPERATING ACTIVITIES:
|
||||||||||||
|
Net loss
|
$ | (6,457,067 | ) | $ | (11,571,495 | ) | $ | (13,731,818 | ) | |||
|
Adjustments to reconcile net loss to net cash used in operating activities:
|
||||||||||||
|
Charges incurred in connection with the vesting and issuance of common stock for employee and director compensation
|
302,471 | 87,354 | 1,324,643 | |||||||||
|
Charges incurred (reduced) in connection with the Long-term Equity Incentive Program
|
54,395 | 43,171 | (375,866 | ) | ||||||||
|
Charges incurred for change in fair value of warrants
|
815,131 | - | - | |||||||||
|
Loss on disposal of property and equipment
|
116,828 | 25,059 | - | |||||||||
|
Depreciation, $1,164,013, $247,772, and $89,361, respectively, of which is allocated to cost of services
|
1,553,978 | 783,415 | 632,408 | |||||||||
|
Amortization
|
1,034,400 | 1,034,400 | 1,040,379 | |||||||||
|
Impairment of intangible asset
|
581,900 | - | - | |||||||||
|
Bad debt expense (recovery)
|
92,025 | (506 | ) | (17,158 | ) | |||||||
|
Changes in operating assets and liabilities:
|
||||||||||||
|
Accounts receivable
|
321,677 | (579,863 | ) | 2,032,772 | ||||||||
|
Finance receivables
|
100,406 | (247,241 | ) | 489,211 | ||||||||
|
Inventory
|
(4,299,663 | ) | (3,468,027 | ) | 627,776 | |||||||
|
Prepaid expenses and other assets
|
115,756 | 337,672 | 181,114 | |||||||||
|
Accounts payable
|
1,067,631 | 776,039 | (210,858 | ) | ||||||||
|
Accrued expenses
|
(571,397 | ) | 432,840 | (470,283 | ) | |||||||
|
Net cash used in operating activities
|
(5,171,529 | ) | (12,347,182 | ) | (8,477,680 | ) | ||||||
|
INVESTING ACTIVITIES:
|
||||||||||||
|
Purchase of property and equipment, net
|
(291,390 | ) | (520,835 | ) | (264,863 | ) | ||||||
|
Net proceeds from redemption/sale of available-for-sale securities
|
- | - | 6,875,000 | |||||||||
|
Net cash provided by (used in) investing activities
|
(291,390 | ) | (520,835 | ) | 6,610,137 | |||||||
|
See accompanying notes.
|
||||||||||||
F-7
USA Technologies, Inc.
Consolidated Statements of Cash Flows (Continued)
|
Year ended June 30
|
||||||||||||
|
2011
|
2010
|
2009
|
||||||||||
|
FINANCING ACTIVITIES:
|
||||||||||||
|
Net proceeds from the issuance (payments for retirement) of common stock
|
$ | 11,287,511 | $ | 14,922,505 | $ | (375,584 | ) | |||||
|
Payments for retirement of preferred stock
|
- | (598,464 | ) | (88,048 | ) | |||||||
|
Proceeds from the issuance of long-term debt
|
- | 7,500 | - | |||||||||
|
Repayment of long-term debt
|
(437,405 | ) | (607,462 | ) | (891,254 | ) | ||||||
|
Net cash provided by (used in) financing activities
|
10,850,106 | 13,724,079 | (1,354,886 | ) | ||||||||
|
Net increase (decrease) in cash and cash equivalents
|
5,387,187 | 856,062 | (3,222,429 | ) | ||||||||
|
Cash and cash equivalents at beginning of year
|
7,604,324 | 6,748,262 | 9,970,691 | |||||||||
|
Cash and cash equivalents at end of year
|
$ | 12,991,511 | $ | 7,604,324 | $ | 6,748,262 | ||||||
|
Supplemental disclosures of cash flow information:
|
||||||||||||
|
Cash paid for interest
|
$ | 37,962 | $ | 63,883 | $ | 97,385 | ||||||
|
Equipment and software acquired under capital lease
|
$ | - | $ | 17,337 | $ | 424,612 | ||||||
|
Equipment and software financed with long-term debt
|
$ | - | $ | 195,000 | $ | - | ||||||
|
Conversion of convertible preferred stock to common stock
|
$ | (10,620 | ) | $ | - | $ | - | |||||
|
Conversion of cumulative preferred dividends to common stock
|
$ | (33,000 | ) | $ | - | $ | - | |||||
|
Prepaid insurance financed with long-term debt
|
$ | 94,311 | $ | - | $ | 225,785 | ||||||
|
Prepaid software licenses and maintenance financed with long-term debt
|
$ | - | $ | - | $ | 93,398 | ||||||
|
Disposal of property and equipment
|
$ | - | $ | 581,124 | $ | - | ||||||
|
Reclass of inventory to fixed assets for rental units
|
$ | 4,263,302 | $ | 2,505,282 | $ | - | ||||||
|
Fair value of warrants at issuance
|
$ | 1,917,122 | $ | - | $ | - | ||||||
|
See accompanying notes.
|
||||||||||||
F-8
USA Technologies, Inc.
Notes to Consolidated Financial Statements
1. BUSINESS
USA Technologies, Inc. (the “Company”) was incorporated in the Commonwealth of Pennsylvania in January 1992. The Company is a leading supplier of cashless, remote management, reporting and energy management solutions serving the unattended Point of Sale market. Our networked devices and associated services enable the owners and operators of everyday, stand-alone, distributed assets, such as vending machines, kiosks, personal computers, photocopiers, and laundry equipment, the ability to remotely monitor, control and report on the results of these distributed assets, as well as the ability to offer their customers cashless payment options. As part of our Intelligent Vending™ solution, our Company
also manufactures and sells energy management products which reduce the electrical power consumption of various existing equipment, such as refrigerated vending machines and glass front coolers, thus reducing the electrical energy costs associated with operating this equipment. The Company’s customers are principally located in the United States.
The Company has incurred losses from its inception through June 30, 2011 and losses have continued through August 2011 and are expected to continue during fiscal year 2012. The Company’s ability to meet its future obligations is dependent upon the success of its products and services in the marketplace and the available capital resources. Until the Company’s products and services can generate sufficient operating revenues, the Company will be required to use its cash and cash equivalents on hand, as well as raise capital to meet its cash flow requirements including the issuance of Common Stock and the exercise of outstanding Common Stock warrants.
2. ACCOUNTING POLICIES
CONSOLIDATION
The accompanying consolidated financial statements include the accounts of the Company and its wholly-owned subsidiaries, Stitch Networks Corporation (“Stitch”) and USAT Capital Corp LLC (“USAT Capital”). All significant intercompany accounts and transactions have been eliminated in consolidation.
USE OF ESTIMATES
The preparation of the financial statements in conformity with U.S. generally accepted accounting principles requires management to make estimates and assumptions that affect the amounts reported in the financial statements and accompanying notes. Actual results could differ from those estimates.
CASH EQUIVALENTS
Cash equivalents represent all highly liquid investments with original maturities of three months or less. Cash equivalents are comprised of money market funds. The Company maintains its cash in bank deposit accounts, which may exceed federally insured limits at times.
Included in cash and cash equivalents at June 30, 2011 and 2010 was approximately $410,000 and $1,020,000, respectively, of cash received by the Company for transaction processing services which is payable to our customers. Included in accounts receivable are amounts for transactions processed with our card processers for which cash has not been received by the Company and included in accounts payable are amounts for transactions processed with our card processers and due to our customers, which are recorded net of fees due to the Company. Generally, contractual terms require us to remit amounts owed to our customers on a weekly basis.
ACCOUNTS RECEIVABLE
Accounts receivable are reported at their outstanding unpaid principal balances reduced by an allowance for doubtful accounts. The Company estimates doubtful accounts for accounts receivable and finance receivables based on historical bad debts, factors related to specific customers’ ability to pay and current economic trends. The Company writes off accounts receivable against the allowance when management determines the balance is uncollectible and the Company ceases collection efforts. Management believes that the allowance accrued is adequate to provide for its estimated credit losses.
F-9
USA Technologies, Inc.
Notes to Consolidated Financial Statements
2. ACCOUNTING POLICIES (CONTINUED)
FINANCE RECEIVABLES
The Company offers extended payment terms to certain customers for equipment sales. Through June 30, 2009 payment terms consisted of fixed term notes. During the year ended June 30, 2010 the Company started offering customers its Quick Start Program. In accordance with the Financial Accounting Standards Board Accounting Standards Codification® ("ASC") Topic 840, “Leases”, agreements under the Quick Start Program qualify for sales-type lease accounting. Accordingly, the future minimum lease payments are classified as finance receivables in the Company’s consolidated balance sheets. Notes receivable or Quick Start leases are
generally for a 36 month term. Finance receivables are carried at their contractual amount and charged off against the allowance for credit losses when management determines that recovery is unlikely and the Company ceases collection efforts. The Company recognizes a portion of the note or lease payments as interest income in the accompanying consolidated financial statements based on the effective interest rate method.
INVENTORY
Inventory consists of finished goods and packaging materials. The Company’s inventory is stated at the lower of cost (average cost basis) or market.
FAIR VALUE OF FINANCIAL INSTRUMENTS
In September 2009, the Financial Accounting Standards Board (“FASB”) issued Accounting Standards Update (“ASU”) 2010-06, “Fair Value Measurements and Disclosures (“Topic 820”): Improving Disclosures about Fair Value Measurements.” ASU 2009-06 amends certain disclosure requirements of Subtopic 820-10. This ASU provides additional disclosures for transfers in and out of Levels 1 and 2 and for activity in Level 3. This ASU also clarifies certain other existing disclosure requirements including level of desegregation and disclosures around inputs and valuation techniques.
The Company’s financial assets and liabilities are measured using inputs from the three levels of the fair value hierarchy. The three levels are as follows:
Level 1- Inputs are unadjusted quoted prices in active markets for identical assets or liabilities that the Company has the ability to access at the measurement date.
Level 2- Inputs are other than quoted prices included within Level 1 that are observable for the asset or liability, either directly or indirectly. Level 2 inputs include quoted prices for similar assets and liabilities in active markets, quoted prices for identical or similar assets or liabilities in markets that are not active, inputs other than quoted prices that are observable for the asset or liability (i.e., interest rates, yield curves, etc.), and inputs that are derived principally from or corroborated by observable market data by correlation or other means (market corroborated inputs).
Level 3- Inputs are unobservable and reflect the Company’s assumptions that market participants would use in pricing the asset or liability. The Company develops these inputs based on the best information available.
The Company’s financial instruments, principally cash equivalents, accounts receivable, finance receivables, prepaid expenses and other assets, accounts payable and accrued expenses, are carried at cost which approximates fair value due to the short-term maturity of these instruments. The fair value of the Company’s obligations under its long-term debt and credit agreements approximates their carrying value as such instruments are at market rates currently available to the Company.
PROPERTY AND EQUIPMENT
Property and equipment are recorded at cost. Property and equipment are depreciated on the straight-line basis over the estimated useful lives of the related assets. Leasehold improvements are amortized on the straight-line basis over the lesser of the estimated useful life of the asset or the respective lease term.
GOODWILL AND INTANGIBLE ASSETS
Goodwill represents the excess of cost over fair value of the net assets purchased in acquisitions. The Company accounts for goodwill in accordance with ASC 350, “Intangibles – Goodwill and Other”. Under ASC 350, goodwill is not amortized to earnings, but instead is subject to periodic testing for impairment. The Company tests goodwill for impairment using a two-step process. The first step screens for potential impairment, while the second step measures the amount of impairment. The Company uses a discounted cash flow analysis to complete the first step in this process. We also give consideration to our market capitalization. Testing for impairment is to be done at least annually and at other
times if events or circumstances arise that indicate that impairment may have occurred. The Company has selected April 1 as its annual test date. The Company has concluded there has been no impairment of goodwill as a result of its testing on April 1, 2011, April 1, 2010 and April 1, 2009.
F-10
USA Technologies, Inc.
Notes to Consolidated Financial Statements
2. ACCOUNTING POLICIES (CONTINUED)
GOODWILL AND INTANGIBLE ASSETS (CONTINUED)
The Company trademarks with an indefinite economic life are not being amortized. The trademarks, not subject to amortization, are related to the miser asset group and consist of the following trademarks: 1) VendingMiser, 2) CoolerMiser, 3) PlugMiser and 4) SnackMiser. The Company tests indefinite-lived intangible assets for impairment using a two-step process. The first step screens for potential impairment, while the second step measures the amount of impairment. The Company uses a discounted cash flow analysis to complete the first step in this process. Testing for impairment is to be done at least annually and at other times if events or circumstances arise that indicate that impairment may have occurred. The
Company has selected April 1 as its annual test date for its indefinite-lived intangible assets. The Company has concluded there was an impairment of its indefinite-lived trademarks as a result of its testing and has recorded a $581,900 impairment expense in the fourth quarter of the fiscal year ended June 30, 2011 (see Note 5). There were no impairment expenses recorded during fiscal years ended June 30, 2010 and 2009.
Patents and trademarks, with an estimated economic life, are carried at cost less accumulated amortization, which is calculated on a straight-line basis over their estimated economic life. The Company reviews intangibles, subject to amortization, for impairment whenever events or changes in circumstances indicate that the carrying amount may not be recoverable. An asset is considered to be impaired when the sum of the undiscounted future net cash flows resulting from the use of the asset and its eventual disposition is less than its carrying amount. The amount of the impairment loss, if any, is measured as the difference between the net book value of the asset and its estimated fair value. Other than impairment
described above, as of June 30, 2011 and 2010, the Company has concluded there has been no impairment of its other patents or trademarks that are subject to amortization.
IMPAIRMENT OF LONG LIVED ASSETS
In accordance with ASC 360, “Impairment or Disposal of Long-Lived Assets”, the Company reviews its long-lived assets whenever events or changes in circumstances indicate that the carrying amount of such assets may not be recoverable. If the carrying amount of an asset or group of assets exceeds its net realizable value, the asset will be written down to its fair value. In the period when the plan of sale criteria of ASC 360 are met, long-lived assets are reported as held for sale, depreciation and amortization cease, and the assets are reported at the lower of carrying value or fair value less costs to sell. The Company has concluded that the carrying amount of long-lived assets is recoverable as of
June 30, 2011 and 2010.
CONCENTRATION OF CREDIT RISK
Financial instruments that subject the Company to a concentration of credit risk consist principally of cash and cash equivalents and accounts and finance receivables. The Company maintains cash and cash equivalents with various financial institutions. Approximately 22% and 52% of the Company’s accounts and finance receivables at June 30, 2011 and 2010, respectively, were concentrated with one and two (28% with one and 24% with another) customer(s), respectively. Approximately 48%, 52%, and 44% of the Company’s license and transaction processing revenues for the years ended June 30, 2011, 2010, and 2009, respectively, were concentrated with two (25% with one and 23% with another), two (35% with one and
17% with another), and one customer(s), respectively. There was no concentration of equipment sales revenue for the year ended June 30, 2011. For each of the years ended June 30, 2010 and 2009 approximately 11% of the Company’s equipment sales revenue was concentrated with one customer. The Company’s customers are principally located in the United States.
REVENUE RECOGNITION
Revenue from the sale of equipment is recognized on the terms of freight-on-board shipping point. Activation fee revenue is recognized when the Company’s cashless payment device is initially activated for use on the Company network. Transaction processing revenue is recognized upon the usage of the Company’s cashless payment and control network. License fees for access to the Company’s devices and network services are recognized on a monthly basis. In all cases, revenue is only recognized when persuasive evidence of an arrangement exists, delivery has occurred or services have been rendered, the price is fixed and determinable, and collection of the resulting receivable is reasonably assured. The
Company estimates an allowance for product returns at the date of sale.
F-11
USA Technologies, Inc.
Notes to Consolidated Financial Statements
2. ACCOUNTING POLICIES (CONTINUED)
EQUIPMENT RENTAL
During the year ended June 30, 2010, the Company commenced a rental program, Jump Start, for its ePort equipment devices. In accordance with ASC 840, “Leases”, the Company classifies the rental agreements as operating leases. For the years ended June 30, 2011 and 2010, there was approximately $597,000 and $369,000 of activation fee revenue related to Jump Start equipment included in equipment sales in the Consolidated Statements of Operations. There was also approximately $2,725,000 and $433,000 of service fee revenue related to Jump Start equipment included in license and transaction fees in the Consolidated Statements of Operations for the years ended June 30, 2011 and 2010,
respectively. Cost for the Jump Start revenues, which consists of depreciation expense on the Jump Start equipment, approximated $933,000 and $105,000 for the years ended June 30, 2011 and 2010, and was included in cost of services in the Consolidated Statements of Operations. At June 30, 2011 and 2010, $5,735,000 and $2,400,000 of ePort equipment utilized by the Jump Start Program was included in property and equipment, net on the consolidated balance sheet (see Note 4).
WARRANTY COSTS
The Company generally warrants its products for one to three years. Warranty costs are estimated and recorded at the time of sale based on historical warranty experience, if available.
SHIPPING AND HANDLING
Shipping and handling fees billed to our customers in connection with sales are recorded as revenue. The costs incurred for shipping and handling of our product are recorded as cost of sales.
RESEARCH AND DEVELOPMENT EXPENSES
Research and development expenses are expensed as incurred. Research and development expenses, which are included in general and administrative and compensation expense in the consolidated statements of operations, were approximately $997,000, $1,864,000, and $2,691,000, for the years ended June 30, 2011, 2010, and 2009, respectively. Our research and development initiatives focus on adding features and functionality to our system solutions through the development and utilization of our processing and reporting network and new technology.
ACCOUNTING FOR EQUITY AWARDS
In accordance with ASC 718 the cost of employee services received in exchange for an award of equity instruments is based on the grant-date fair value of the award and allocated over the vesting period of the award.
There were no common stock options granted during the year ended June 30, 2011, 2010, or 2009, and no related expense respectively. The Company recorded stock compensation expense of $302,471, $87,354 and $1,324,643 related to common stock grants and vesting of shares previously granted to employees, excluding the Long-Term Equity Incentive Program (“LTIP” or the “LTIP Program”) during the years ended June 30, 2011, 2010 and 2009, respectively. The Company recorded stock compensation expense of $54,395 and $43,171 related to the vesting of shares under the fiscal year 2010 LTIP Program during the years ended June 30, 2011 and 2010, respectively and during the year ended June
30, 2009 the Company recorded a reduction to stock compensation expense of $375,866 related to the final settlement of the fiscal year 2008 award under the LTIP Program (see Note 11).
INCOME TAXES
The Company follows the provisions of FASB ASC 740, “Accounting for Uncertainty in Income Taxes which provides detailed guidance for the financial statement recognition, measurement and disclosure of uncertain tax positions recognized in the financial statements. Tax positions must meet a “more-likely-than-not” recognition threshold at the effective date to be recognized upon the adoption of ASC 740 and in subsequent periods. Upon the adoption of ASC 740, the Company had no unrecognized tax benefits.
Income taxes are computed using the asset and liability method of accounting. Under the asset and liability method, a deferred tax asset or liability is recognized for estimated future tax effects attributable to temporary differences and carryforwards. The measurement of deferred income tax assets is adjusted by a valuation allowance, if necessary, to recognize future tax benefits only to the extent, based on available evidence it is more likely than not such benefits will be realized. The Company recognizes interest and penalties, if any, related to uncertain tax positions in selling, general and administrative expenses. No interest and penalties related to uncertain tax positions were accrued or incurred during
the years ended June 30, 2011, 2010, and 2009.
We file income tax returns in the United States federal jurisdiction and various state jurisdictions. The tax years ended June 30, 2008 through June 30, 2011 remain open to examination by taxing jurisdictions to which we are subject. As of June 30, 2011 we did not have any income tax examinations in process.
F-12
USA Technologies, Inc.
Notes to Consolidated Financial Statements
2. ACCOUNTING POLICIES (CONTINUED)
LOSS PER COMMON SHARE
Basic earnings per share is calculated by dividing income (loss) applicable to common shares by the weighted average common shares outstanding for the period. Diluted earnings per share is calculated by dividing income (loss) applicable to common shares by the weighted average common shares outstanding for the year plus the effect of potential common shares (approximately 15,673,000, 13,787,000 and 3,524,000 shares as of June 30, 2011, 2010 and 2009, respectively) unless such effect is anti-dilutive. No exercise of stock options (90,666); or stock purchase warrants (15,567,199); or the conversion of preferred stock (4,430) or cumulative preferred dividends (10,267) was assumed during the fiscal year ended June 30,
2011 because the result would be anti-dilutive. No exercise of stock options (160,000) or stock purchase warrants (13,526,748); or the conversion of preferred stock (4,445) or cumulative preferred dividends (9,635); or the issuance of shares granted under LTIP (86,342) was assumed during the fiscal year ended June 30, 2010 because the result would be anti-dilutive. No exercise of stock options (160,000) or stock purchase warrants (3,030,863); or the conversion of preferred stock (5,103) or cumulative preferred dividends (10,349); or the issuance of shares granted under the LTIP (317,433) was assumed during the fiscal year ended June 30, 2009 because the result would be anti-dilutive.
RECENT ACCOUNTING PRONOUCEMENTS
The Company does not believe that any other recently issued, but not yet effective accounting standards will have a material effect on the Company’s consolidated financial position, results of operations, or cash flows.
3. FINANCE RECEIVABLES
Finance Receivables consist of the following:
|
June 30
|
||||||||
|
2011
|
2010
|
|||||||
|
Notes receivable
|
$ | - | $ | 56,962 | ||||
|
Lease receivables
|
481,387 | 524,831 | ||||||
|
Total finance receivables
|
481,387 | 581,793 | ||||||
|
Less current portion
|
285,786 | 242,452 | ||||||
|
Non-current portion of finance receivables
|
$ | 195,601 | $ | 339,341 | ||||
As of June 30, 2011, and 2010, there was no allowance for credit losses of finance receivables. As the Company collects monthly payments of the receivables from the customers’ transaction funds the risk of loss was determined to be remote.
|
Credit Quality Indicators
|
||||||||||||
|
As of June 30, 2011
|
||||||||||||
|
Credit risk profile based on payment activity:
|
||||||||||||
|
Notes
|
Leases
|
Total
|
||||||||||
|
Performing
|
$ | - | $ | 481,387 | $ | 481,387 | ||||||
|
Nonperforming
|
- | - | - | |||||||||
|
Total
|
$ | - | $ | 481,387 | $ | 481,387 | ||||||
|
Age Analysis of Past Due Finance Receivables
|
||||||||||||||||||||||||
|
As of June 30, 2011
|
||||||||||||||||||||||||
|
31 – 60
Days Past Due |
61 – 90
Days Past Due |
Greater than
90 DaysPast Due |
Total
Past Due |
Current
|
Total
FinanceReceivables |
|||||||||||||||||||
|
Leases
|
- | - | - | - | $ | 481,387 | $ | 481,387 | ||||||||||||||||
|
Total
|
$ | - | $ | - | $ | - | $ | - | $ | 481,387 | $ | 481,387 | ||||||||||||
F-13
USA Technologies, Inc.
Notes to Consolidated Financial Statements
4. PROPERTY AND EQUIPMENT
Property and equipment, at cost, consist of the following:
|
Useful
|
June 30
|
||||||||
|
Lives
|
2011
|
2010
|
|||||||
|
Computer equipment and purchased software
|
3-7 years
|
$ | 4,335,163 | $ | 4,330,645 | ||||
|
Lessor Equipment
|
5 years
|
6,768,584 | 2,505,282 | ||||||
|
Furniture and equipment
|
3-7 years
|
785,960 | 921,445 | ||||||
|
Leasehold improvements
|
Lesser of
|
||||||||
|
life or lease term
|
271,759 | 271,759 | |||||||
|
Vehicles
|
5 years
|
29,066 | 29,066 | ||||||
| 12,190,532 | 8,058,197 | ||||||||
|
Less accumulated depreciation
|
(4,794,757 | ) | (3,546,308 | ) | |||||
| $ | 7,395,775 | $ | 4,511,889 | ||||||
Assets under capital lease totaled approximately $1,459,000 as of June 30, 2011 and 2010. Capital lease amortization of approximately $277,000, $263,000, and $204,000, is included in depreciation expense for the years ended June 30, 2011, 2010, and 2009, respectively.
ePort equipment utilized by the Jump Start Program is identified as Lessor Equipment in the above table. Accumulated depreciation attributable to the Lessor Equipment is approximately $1,034,000 and $105,000 as of June 30, 2011 and 2010, respectively and is included in accumulated depreciation for the respective years in the above table.
5. INTANGIBLE ASSETS
Amortization expense relating to all acquired intangible assets was approximately $1,034,000, $1,034,000, and $1,040,000 during each of the years ended June 30, 2011, 2010 and 2009, respectively. The intangible asset balance and related accumulated amortization consisted of the following:
|
June 30, 2011
|
||||||||||||
|
Gross
|
||||||||||||
|
Carrying
|
Accumulated
|
Net Carrying
|
||||||||||
|
Amount
|
Amortization |
Value
|
||||||||||
|
Intangible assets:
|
||||||||||||
|
Trademarks
|
$ | 1,482,100 | $ | (949,375 | ) | $ | 532,725 | |||||
|
Patents
|
9,294,000 | (7,632,372 | ) | 1,661,628 | ||||||||
|
Total
|
$ | 10,776,100 | $ | (8,581,747 | ) | $ | 2,194,353 | |||||
|
June 30, 2010
|
||||||||||||
|
Gross
|
||||||||||||
|
Carrying
|
Accumulated
|
Net Carrying
|
||||||||||
|
Amount
|
Amortization |
Value
|
||||||||||
|
Intangible assets:
|
||||||||||||
|
Trademarks
|
$ | 2,064,000 | $ | (853,125 | ) | $ | 1,210,875 | |||||
|
Patents
|
9,294,000 | (6,694,222 | ) | 2,599,778 | ||||||||
|
Total
|
$ | 11,358,000 | $ | (7,547,347 | ) | $ | 3,810,653 | |||||
F-14
USA Technologies, Inc.
Notes to Consolidated Financial Statements
5. INTANGIBLE ASSETS (CONTINUED)
The Company’s test for impairment of its indefinite-lived trademarks, consisting of the trademarks: 1) VendingMiser, 2) CoolerMiser, 3) PlugMiser and 4) SnackMiser, determined that the sum of the expected discounted cash flows attributable to the trademarks was less than its carrying value of $1,014,000, and that an impairment write-down was required. The primary driver behind the decrease in the value was a decrease in the revenue expectations for the trademarks from the time the trademarks were acquired in July 2003 to when the impairment assessment was prepared. Accordingly, the Company performed a valuation of the trademark’s fair value with the assistance an independent valuation specialist. The
fair value of the trademarks was determined by a method known as “relief from royalty”, in which the fair value is determined by reference to the amount of royalty income the intangible would generate if it were licensed in an arm’s-length transaction. The essential assumptions in a valuation via an income approach are as follows:
|
●
|
The related dollar sales volume;
|
|
●
|
The percentage royalty on sales;
|
|
●
|
The adjustment for taxes;
|
|
●
|
The remaining useful economic life;
|
|
●
|
The percentage return on investment; and,
|
|
●
|
The tax amortization benefit.
|
During the fourth quarter of the fiscal year ended June 30, 2011, the fair value of the trademarks was determined to be $432,100. This assessment resulted in an impairment write-down during the fourth fiscal quarter of $581,900, which is included in “Impairment of intangible asset” in the Consolidated Statement of Operations for the fiscal year ended June 30, 2011.
The trademark described above, is not related to the Company’s core operations consisting of its ePort wireless, cashless products and services.
At June 30, 2011, the expected amortization of the intangible assets is as follows: $998,000 in fiscal year 2012, $742,000 in fiscal year 2013 and $22,000 in fiscal year 2014. The weighted average useful life of these amortized intangible assets is 1.9 years at June 30, 2011. At June 30, 2011 and 2010, $432,100 and $1,014,000, respectively of trademarks has an indefinite life and is included in the intangible assets tables above.
6. ACCRUED EXPENSES
Accrued expenses consist of the following:
|
June 30
|
||||||||
|
2011
|
2010
|
|||||||
|
Accrued compensation and related sales commissions
|
$ | 269,335 | $ | 922,741 | ||||
|
Accrued professional fees
|
197,964 | 374,288 | ||||||
|
Accrued taxes and filing fees
|
302,147 | 222,249 | ||||||
|
Advanced customer billings
|
100,398 | 55,773 | ||||||
|
Accrued share-based payment liability
|
- | 43,171 | ||||||
|
Accrued other
|
384,955 | 251,145 | ||||||
| $ | 1,254,799 | $ | 1,869,367 | |||||
F-15
USA Technologies, Inc.
Notes to Consolidated Financial Statements
7. LONG-TERM DEBT
Long-term debt consists of the following:
|
June 30
|
||||||||
|
2011
|
2010
|
|||||||
|
Capital lease obligations
|
$ | 84,043 | $ | 280,261 | ||||
|
Loan agreement
|
169,018 | 315,894 | ||||||
| 253,061 | 596,155 | |||||||
|
Less current portion
|
155,428 | 344,652 | ||||||
| $ | 97,633 | $ | 251,503 | |||||
The maturities of long-term debt as of June 30, 2011 are as follows:
|
2012
|
$ | 155,428 | ||
|
2013
|
74,067 | |||
|
2014
|
16,990 | |||
|
2015
|
6,576 | |||
| $ | 253,061 |
During July 2010, the Company financed a portion of the premiums for various insurance policies totaling $94,331 due in nine monthly installments at an interest rate of 4.93%.
During May 2010, the company financed software licenses totaling $77,730, due in 12 monthly installments of $6,833 at an interest rate of 3.3%.
During March 2010, the Company financed the purchase of computer equipment totaling $195,000 due in 36 monthly installments at an interest rate of 4.95%. An amount of restricted cash equal to the outstanding principal balance of the loan serves as security for this loan. Accordingly, $65,754 and $51,492 of restricted cash is classified as current and non-current other assets, respectively, on the Consolidated Balance Sheet at June 30, 2011 and $62,585 and $117,246 of restricted cash is classified as current and non-current other assets, respectively, on the Consolidated Balance Sheet at June 30, 2010.
During July 2009, the Company financed a portion of the premiums for various insurance policies totaling $85,991 due in nine monthly installments at an interest rate of 5.1%. In the same month the Company also entered into a capital lease for office equipment totaling $24,836, due in 46 monthly installments of $677 at an interest rate of 12.1%.
During May 2009, the Company financed a software license agreement totaling approximately $56,000, due in four quarterly installments of $14,747 each, at an interest rate of 9%.
During November 2008, the Company entered into various capital leases for network equipment and maintenance contracts on the equipment totaling $462,041, due in 24 to 36 monthly installments at interest rates from 3.75% to 12.35%.
During August and November 2008, the Company financed a portion of the premiums for various insurance policies totaling $90,798 and $134,987, due in 11 and 10 monthly installments, at an interest rate of 5.95% and 6.25%, respectively.
During February, March, and April 2008, the Company entered into various capital leases for network equipment totaling approximately $199,000, due in 36 monthly installments at interest rates from 3.78% to 12.35%.
During November 2007, the Company entered into a long-term debt agreement for $93,000 with a financial institution bearing interest at 8.25%, which is collateralized by the assets of the Company, which requires 84 monthly payments of $1,467, including interest and principal.
F-16
USA Technologies, Inc.
Notes to Consolidated Financial Statements
7. LONG-TERM DEBT (CONTINUED)
During July 2007, the Company entered into loan agreements for $239,740 with a financial institution bearing interest at 12% that was collateralized by $274,494 of the Finance Receivables. The Company agreed to make 32 monthly payments of $9,104, which include interest and principal, from the proceeds received from the Finance Receivables. During October 2006, the Company entered into a loan agreement with a financial institution bearing interest at 18% and collateralized by $470,000 of the Finance Receivables. The Company received $470,000 in proceeds and agreed to make 12 monthly payments of $25,000 followed by 18 monthly payments of $15,000, which include interest and principal, from the proceeds received from
the Finance Receivables. These loan agreements were satisfied by June 30, 2010.
During May 2007, the Company entered into a capital lease agreement in connection with office equipment for approximately $305,000, due in thirty-six equal monthly payments of $9,456 through April 2010 at an interest rate of 7.13%.
During March 2007, the Company entered into a capital lease agreement in connection with software licensing for approximately $290,000, due in sixteen equal monthly installments of $17,769 through July 2008 followed by two equal monthly payments of $19,787 through September 2008 at an interest rate of 14.27%.
During March 2007, the Company entered into a capital lease agreement in connection with office equipment for approximately $146,000, due in sixty equal monthly payments of $2,965 through March 2012 at an interest rate of 7.83%.
8. FAIR VALUE OF FINANCIAL INSTRUMENTS
In accordance with the fair value hierarchy described in Note 1, the following table shows the fair value of the Company’s financial instruments that are required to be measured at fair value as of June 30, 2011 and 2010:
|
June 30, 2011
|
Level 1
|
Level 2
|
Level 3
|
Total
|
||||||||||||
|
Cash equivalents
|
$ | 83,267 | $ | - | $ | - | $ | 83,267 | ||||||||
|
Common stock warrant liability, warrants exercisable at $2.6058 from September 18, 2011 through September 18, 2016
|
$ | - | $ | - | $ | 2,638,629 | $ | 2,638,629 | ||||||||
|
Common stock warrant liability, warrants exercisable at $5.90 through September 14, 2013
|
$ | - | $ | - | $ | 93,624 | $ | 93,624 | ||||||||
|
June 30, 2010
|
Level 1
|
Level 2
|
Level 3
|
Total
|
||||||||||||
|
Cash equivalents
|
$ | 2,972,026 | $ | - | $ | - | $ | 2,972,026 | ||||||||
|
Common stock warrant liability
|
$ | - | $ | - | $ | - | $ | - | ||||||||
As of June 30, 2011 and 2010, the fair values of the Company’s Level 1 financial instruments were $83,267 and $2,972,026, respectively. These financial instruments consist of cash equivalents, including certificates of deposit and money market accounts. As of June 30, 2011 and 2010, the Company held no Level 2 financial instruments.
As of June 30, 2011 and 2010, the fair values of the Company’s Level 3 financial instruments totaled $2,732,253 and $0, respectively. The Level 3 financial instruments consist of common stock warrants issued by the Company in March 2011 and March 2007, which include features requiring liability treatment of the warrants. The fair value of warrants issued in March 2011 (see Notes 11 and 12) to purchase 3.9 million shares of the Company’s common stock is based on valuations performed by an independent third party valuation firm. The fair value was determined using proprietary valuation models using the quality of the underlying securities of the warrants, restrictions on the warrants and security
underlying the warrants, time restrictions and precedent sale transactions completed in the secondary market or in other private transactions. The fair value of warrants issued in March 2007 to purchase 903,955 shares of the Company’s common stock was estimated by the Company using the Black-Scholes model and applying an estimated fair value adjustment primarily related to the illiquidity of the warrants. Prior to March 31, 2011, the fair value of these warrants was determined to be de minimus and was not included on the Company’s consolidated balance sheets.
F-17
USA Technologies, Inc.
Notes to Consolidated Financial Statements
8. FAIR VALUE OF FINANCIAL INSTRUMENTS (CONTINUED)
There were no transfers of assets or liabilities between level 1, level 2 or level 3 during the years ended June 30, 2011 and 2010.
The following table summarizes the changes in fair value of the Company’s Level 3 financial instruments for the year ended:
|
June 30
|
||||||||
|
2011
|
2010
|
|||||||
|
Beginning balance at June 30, 2011 and 2010
|
$ | - | - | |||||
|
Issuance of common stock warrants, exercisable at $2.6058 per share
|
(1,917,122 | ) | - | |||||
|
Recognize liability of warrants, exercisable at $5.90 per share; attributed to loss due to change in fair value
|
(151,631 | ) | - | |||||
|
Loss due to change in fair value of warrant liabilities, net
|
(663,500 | ) | - | |||||
|
Ending balance
|
$ | (2,732,253 | ) | $ | - | |||
9. INCOME TAXES
At June 30, 2011 the Company had net operating loss carryforwards of approximately $166,189,000 to offset future taxable income expiring through approximately 2031. In addition, the Company had capital loss carryforwards of approximately $5,000 as of June 30, 2011.
The timing and extent to which the Company can utilize future tax deductions in any year may be limited by provisions of the Internal Revenue Code regarding changes in ownership of corporations (i.e. IRS Code Section 382). The changes in ownership limitations under IRS Code Section 382 have had the effect of limiting the maximum amount of net operating loss carryforwards as of June 30, 2011 and 2010 available for use to offset future years’ taxable income to approximately $121,667,000 and $116,712,000, respectively. Those net operating loss carryforwards start to expire June 30, 2022. Stitch had net operating loss carryforwards of approximately $11,800,000 at the acquisition date. Such net operating loss
carryforwards are limited under the same provisions as to the amount available to offset future taxable income and to the extent used in any given year, will result in decreases to goodwill as opposed to income tax expense. As of June 30, 2011 and 2010 the capital loss carryforwards were not limited in use under IRS Code Section 382.
At June 30, 2011 and 2010 the Company recorded net deferred tax assets of approximately $48,974,000 and $46,782,000, respectively, which were reduced by a valuation allowance of the same amount as the realization of the deferred tax asset is not likely, principally due to the lack of earnings history.
The net deferred tax assets arose primarily from net operating loss and capital loss carryforwards, as well as the use of different accounting methods for financial statement and income tax reporting purposes as follows:
|
June 30
|
||||||||
|
2011
|
2010
|
|||||||
|
Deferred tax assets:
|
||||||||
|
Net operating loss and capital loss carryforwards
|
$ | 46,695,000 | $ | 44,774,000 | ||||
|
Deferred research and development costs
|
219,000 | 271,000 | ||||||
|
Software development costs
|
- | 216,000 | ||||||
|
Intangibles
|
1,003,000 | 721,000 | ||||||
|
Stock-based compensation
|
476,000 | 396,000 | ||||||
|
Other
|
686,000 | 628,000 | ||||||
| 49,079,000 | 47,006,000 | |||||||
|
Deferred tax liabilities:
|
||||||||
|
Intangibles
|
(105,000 | ) | (224,000 | ) | ||||
|
Deferred tax assets, net
|
48,974,000 | 46,782,000 | ||||||
|
Valuation allowance
|
(48,974,000 | ) | (46,782,000 | ) | ||||
|
Deferred tax assets, net of allowance
|
$ | - | $ | - | ||||
F-18
USA Technologies, Inc.
Notes to Consolidated Financial Statements
10. PREFERRED STOCK
The authorized Preferred Stock may be issued from time to time in one or more series, each series with such rights, preferences or restrictions as determined by the Board of Directors. Each share of Series A Preferred Stock shall have the right to one-hundredth of a vote and is convertible at any time into one-hundredth of a share of Common Stock. Each share of Common Stock entitles the holder to one voting right. Series A Preferred Stock provides for an annual cumulative dividend of $1.50 per share, payable when, as and if declared by the Board of Directors, to the shareholders of record in equal parts on February 1 and August 1 of each year. Any and all accumulated and unpaid cash dividends on the Series A
Preferred Stock must be declared and paid prior to the declaration and payment of any dividends on the Common Stock.
Cumulative unpaid dividends at June 30, 2011 and 2010 amounted to $10,267,420 and $9,634,843, respectively. Cumulative unpaid dividends are convertible into common shares at $1,000 per common share at the option of the shareholder. During the year ended June 30, 2011, 1,500 shares of Preferred Stock and $33,000 cumulative preferred dividends were converted into 15 shares and 33 shares of common stock, respectively. During the years ended June 30, 2010 and 2009 no Preferred Stock or cumulative preferred dividends were converted into shares of Common Stock. The Series A Preferred Stock may be called for redemption at the option of the Board of Directors for a price of $11.00 per share plus payment of all accrued and
unpaid dividends. No such redemption has occurred as of June 30, 2011. In the event of any liquidation, the holders of shares of Series A Preferred Stock issued shall be entitled to receive $10.00 for each outstanding share plus all cumulative unpaid dividends. If funds are insufficient for this distribution, the assets available will be distributed ratably among the preferred shareholders.
During the year ended June 30, 2009, the Company retired 10,122 shares of its Preferred Stock it purchased on the open market at prices ranging from $8.00 to $9.50 per share for a total of $88,048. During the year ended June 30, 2010, the Company retired 65,802 shares of its Preferred Stock it purchased on the open market at prices ranging from $8 to $9 per share for a total of $598,464. During the year ended June 30, 2011, the Company did not purchase any shares of its Preferred Stock on the open market.
11. COMMON STOCK
The Company’s Board of Directors has authorized various Common Stock public and private placement offerings. Activity for these offerings during the years ended June 30, 2011, 2010 and 2009 are as follows:
On September 25, 2006, the Company entered into a Common Stock Purchase Agreement with Steve Illes, an accredited investor. The Agreement was terminated August 30, 2009 and there were no shares issued under this agreement during the years ended June 30, 2010 and 2009.
On May 22, 2009, the Company filed a registration statement with the Securities and Exchange Commission for a rights offering relating to transferable subscription rights to purchase up to $15 million of common stock and warrants (the “2009 Rights Offering”). The Company engaged William Blair & Company and Maxim Group LLC to act as the dealer-managers for the 2009 Rights Offering and MacKenzie Partners, Inc. to act as the information agent.
The 2009 Rights Offering commenced on July 13, 2009 and expired on July 31, 2009. On August 7, 2009, the closing date of the rights offering, the Company received $14,571,584 of gross proceeds. The net cash proceeds, after deduction of fees and expenses, including dealer-manager fees, was $12,958,159. In addition, the Company issued a total of 291,432 warrants to the dealer-managers to purchase the Company’s Common Stock at $2.20 per share at any time through August 6, 2012.
In accordance with the terms of the 2009 Rights Offering, the Company issued an aggregate of 7,285,792 shares of common stock for $2.00 per share and 7,285,792 warrants, entitling the holder to purchase one share of common stock at the exercise price of $2.20 per share of common stock commencing January 1, 2010 and through December 31, 2011. The warrants commenced trading on August 7, 2009, on The NASDAQ Global Market under the symbol USATW. During the years ended June 30, 2010 no USATW warrants were exercised to purchase shares of Common Stock. During the year ended June 30, 2011, 376,355 USATW warrants were exercised at $2.20 per share resulting in the issuance of 376,355 shares of Common Stock, generating cash
proceeds of $827,981.
On March 16, 2010, the Company filed a registration statement with the Securities and Exchange Commission for a public offering of up to $3,000,000 of our common stock and warrants to purchase common stock (the “2010 Public Offering”). The proceeds from the offering are to be used for general corporate purposes, including working capital and providing financing for the manufacture by us of our ePort cashless payment products anticipated to be used by our customers participating in our JumpStart Program. The Company engaged Source Capital Group, Inc. to act as the placement agent for the offering.
F-19
USA Technologies, Inc.
Notes to Consolidated Financial Statements
11. COMMON STOCK (CONTINUED)
The offering closed on May 12, 2010 and we sold an aggregate of 2,753,454 shares and related warrants to purchase up to 2,753,454 shares. As compensation for its services related to the offering, Source received warrants to purchase up to 165,207 shares at $1.13 per share, exercisable at any time through May 12, 2013. The warrants contain provisions for one demand registration of the sale of the underlying shares of common stock for a period of five years at our expense, and piggyback registration rights for a period of five years at our expense, and one demand registration right at the placement agent’s expense for a period of five years. The offer and sale of the warrants was exempt from registration under
Section 4(2) of the Act. The investors are accredited investors. The offer and sale thereof did not involve any general advertising or solicitation and the securities contained appropriate restrictive legends under the Act. The warrants commenced trading on May 24, 2010 on The NASDAQ Global Market under the symbol USATZ. During the years ended June 30, 2010 no USATZ warrants were exercised to purchase shares of Common Stock. During the year ended June 30, 2011, 497,367 USATZ warrants were exercised at $1.13 per share resulting in the issuance of 497,367 shares of Common Stock, generating cash proceeds of $562,025.
On July 7, 2010, we sold an aggregate of 261,953 shares and related warrants to purchase up to 261,953 shares pursuant to a subscription rights offering which concluded on July 6, 2010. In connection with the offering, Source Capital Group, Inc. (“Source”) acted as dealer manager. As compensation for its services, Source received warrants to purchase up to 15,717 shares at $1.13 per share at any time through July 7, 2013. The warrants contain provisions for one demand registration of the sale of the underlying shares of common stock for a period of five years at our expense, and piggyback registration rights for a period of five years at our expense, and one demand registration right at the dealer
manager’s expense for a period of five years. The Company received $235,757 of gross proceeds; after deductions for fees and expenses, net cash proceeds were $5,671.
During the year ended June 30, 2011, Source elected a cashless exercise of 127,497 warrants received from acting as dealer manager for the offerings described above, resulting in the issuance of 83,472 shares of Common Stock.
On July 27, 2010, we executed a purchase agreement and a registration rights agreement (the “LPC Agreement”) with Lincoln Park Capital, LLC (“LPC”). On March 16, 2011, the Company gave written notice to LPC that it had terminated the LPC Agreement. The Company had the right under the LPC Agreement to terminate the LPC Agreement for any or no reason and without any liability whatsoever of any party to any other party under the LPC Agreement. The Company was required to terminate the LPC Agreement as a condition precedent to the closing of the March 14, 2011 Securities Purchase Agreement described below. Under the LPC Agreement, we had the right to sell to LPC up to 4,851,408 shares of our
common stock at our option for an aggregate purchase price of up to $5,000,000. During the year ended June 30, 2011 we issued 150,000 shares of our common stock to LPC as a commitment fee for entering into the purchase agreement.
On March 14, 2011, the Company entered into a Securities Purchase Agreement with seven institutional investors (the “Buyers”). Pursuant thereto, on March 17, 2011 the Company sold to the Buyers 5,200,000 shares of the Company’s common stock at a price of $2.064 per share for an aggregate purchase price of $10,732,800. On March 17, 2011 the Company also issued warrants to the Buyers to purchase up to 3,900,000 shares of common stock at an exercise price of $2.6058 per share. The Buyers are accredited investors and the offer and sale of the shares and the warrants was exempt from registration under Rule 506 promulgated under Section 4(2) of the Act. The Company has agreed to register
the shares and the shares underlying the warrants for resale under the Act until the earlier of (i) the date as of which the Buyers may sell all of the securities covered by such registration statement without restriction pursuant to Rule 144 promulgated under the Act, or (ii) the date on which the Buyers shall have sold all of the securities covered by such registration statement. The Company is obligated to use its best efforts to cause the SEC to declare the Registration Statement effective within 90 days of the closing date of the transaction (or 120 days in the event that the Registration Statement is subject to review by the SEC), and the Company is required to pay certain negotiated cash payments to the Buyers in the event that the Registration Statement is not filed within 15 days of the closing date or is not declared effective within 90 days of the closing date (or 120 days in
the event that the Registration Statement is subject to review by the SEC). The Registration Statement was filed by the Company with the SEC on March 31, 2011, and declared effective by the SEC on April 29, 2011.
In connection with the above private placement offering, Chardan Capital Markets, LLC (“Chardan”), acted as exclusive placement agent. As compensation for its services, Chardan received cash compensation of $751,296 and warrants to purchase up to 364,000 shares of common stock at $2.6058 per share at any time within five years following the six-month and one day anniversary of the issuance of the warrants, March 17, 2011. We have agreed to register the shares underlying the warrants for resale under the Act on the same terms afforded to the Buyers.
The total proceeds of $10,732,800 were reduced by $1,917,122, the fair value of the warrants which are subject to liability accounting (see Note 8), and cash issuance costs of $838,705, resulting in net cash proceeds of $9,894,095 and net proceeds related to common shares of $7,976,973. The proceeds from the offering will be used primarily to support the continuation of the Company’s Jump Start Program.
F-20
USA Technologies, Inc.
Notes to Consolidated Financial Statements
11. COMMON STOCK (CONTINUED)
The Company’s Board of Directors has authorized various compensation plans. Activity for these plans during the years ended June 30, 2011, 2010 and 2009 are as follows:
On February 12, 2007, upon recommendation of the Compensation Committee of the Board of Directors of the Company, the Board adopted the LTIP Program for each of George R. Jensen, Jr., Stephen P. Herbert, and David M. DeMedio, our Chief Executive Officer, Chief Operating Officer and Chief Financial Officer, respectively. The LTIP Program is intended to ensure continuity of the Company’s executive management, to encourage stock ownership by such persons, and to align the interests of executive management with those of the shareholders.
Pursuant to and as defined in the LTIP Program, each executive would be awarded shares of the Company’s Common Stock if the Company achieves certain target goals relating to revenues, gross profit, and EBITDA (the “Target Goals”) of the Company during each of the fiscal years ended June 30, 2007, June 30, 2008 and June 30, 2009. On February 4, 2009, the Board of Directors approved the recommendation of the Compensation Committee that the final twelve month measuring period under the LTIP Program be changed from the fiscal year ended June 30, 2009 to the fiscal year ended June 30, 2010. The foregoing was approved by the Board as the Board did not believe it would be appropriate to reward
senior management with bonuses during the current economic slowdown. EBITDA is defined as earnings before interest, taxes, depreciation, and amortization, and excludes non-cash stock payments/awards and stock options granted to officers and Board members. The Program allows for the executive officers to reduce the number of shares to be issued in order to satisfy the minimum statutory tax withholding requirements.
During the fiscal year ended June 30, 2010, the number of eligible shares to be awarded to the executive is based upon the following weightings: 40% of eligible shares are determined by revenues; 30% of eligible shares are determined by gross profit; and 30% of eligible shares are determined by EBITDA.
If the Target Goals are achieved by the Company during the applicable fiscal year, the executive officers would be awarded the following number of shares:
|
Fiscal Year Ended June 30,
|
||||||||||||
|
2009
|
2010
|
2011
|
||||||||||
|
George R. Jensen, Jr.
|
- | 178,570 | - | |||||||||
|
Stephen P. Herbert
|
- | 53,713 | - | |||||||||
|
David M. DeMedio
|
- | 21,663 | - | |||||||||
If the actual results for the fiscal year exceeds the Target Goals, each executive would be awarded an additional pro rata portion of the eligible shares, up to an amount no greater than 125% of the number of eligible shares. If the actual results for the fiscal year is less than the Target Goals, each executive would be awarded a lesser pro rata portion of the number of eligible shares. If minimum Target Goals for the fiscal year are not achieved, no eligible shares would be awarded to each executive.
During the year ended June 30, 2009, the Company recorded a reduction to stock compensation expense of $375,866 related to the final settlement of the fiscal year 2008 award.
As a result of the Board’s decision to change the final twelve month measuring date of the LTIP Program from fiscal year 2009 to fiscal year 2010, the accrued share based liability as of June 30, 2011, 2010 and 2009 was $0, $43,171 and $0, respectively, and compensation expense during the years ended June 30, 2011, 2010 and 2009 was $54,395, $43,171 and $0, respectively. Final settlement of the award occurred in December 2010 with 86,342 shares earned and total compensation expense recorded of $97,566.
On January 8, 2007, the Board of Directors approved the 2007-A Stock Compensation Plan to allow up to 100,000 shares of Common Stock to be available for issuance to future or current employees, directors or consultants of the Company. Prior to the year ended June 30, 2009, the Company had issued 43,513 shares under the 2007-A Stock Compensation plan. During the year ended June 30, 2009, the Company issued 56,487 under the 2007-A Stock Compensation plan totaling $284,117 based on the grant date fair value of the shares. As of June 30, 2009, all 100,000 shares of Common Stock available for issuance under the Plan had been issued.
F-21
USA Technologies, Inc.
Notes to Consolidated Financial Statements
11. COMMON STOCK (CONTINUED)
On February 28, 2008, the Company’s shareholders approved the 2008 Stock Incentive Plan to allow up to 300,000 shares of Common Stock to be available for issuance to future or current employees, directors and consultants of the Company. During the years ended June 30, 2011, 2010 and 2009, the Company issued 20,747, 40,000 and 239,253 shares under the plan totaling $10,208, $87,354 and $1,040,526, respectively based on the grant date fair value of the shares.
During September 2008, the Company entered into amendments to the employment agreements with Mr. Jensen, Mr. Herbert and Mr. DeMedio. As part of the amendments, Mr. Jensen was granted 110,000 shares of Common Stock under the 2008 Stock Incentive Plan valued at $4.44 per share which vest as follows: 36,000 on September 15, 2008; 37,000 on January 15, 2009; and 37,000 on June 30, 2009; Mr. Herbert was also granted 85,000 shares of Common Stock under the 2008 Stock Incentive Plan valued at $4.44 per share which vest as follows: 28,000 on September 15, 2008; 28,000 on January 15, 2009; and 29,000 on June 30, 2009; and Mr. DeMedio was granted 25,000 shares of Common Stock under the 2008 Stock Incentive Plan valued at
$4.44 per share which vest as follows: 8,000 on September 15, 2008; 8,000 on January 15, 2009; and 9,000 on June 30, 2009. During the year ended June 30, 2009, and as permitted under their employment agreements, these executive officers cancelled an aggregate of 23,855 shares of Common Stock held by them in order to satisfy an aggregate of $43,894 of payroll tax withholding obligations related to shares of Common Stock which vested during September 2008 under their employment agreements. During the year ended June 30, 2010, and as permitted under his employment agreement, an executive officer cancelled an aggregate of 5,113 shares of Common Stock held by him in order to satisfy an aggregate of $9,668 of payroll tax withholding obligations related to shares of Common Stock which vested during January and June 2009.
On June 15, 2010, the Company’s shareholders approved the 2010 Stock Incentive Plan to allow up to 300,000 shares of Common Stock to be available for issuance to future or current employees, directors and consultants of the Company. During the years ended June 30, 2011 and 2010, the Company issued 109,918 and 0 shares under the plan totaling $292,263 and $0, respectively based on the grant date fair value of the shares. As of June 30, 2011 187,335 shares under the plan have been granted, but have not been issued as they are subject to various vesting provisions, and 2,747 shares are available for future issuance.
During April 2011, the Company entered into amendments to the employment agreements with Mr. Jensen, Mr. Herbert and Mr. DeMedio. As part of the amendments, Mr. Jensen was granted 125,000 shares, Mr. Herbert was granted 75,000 shares and Mr. DeMedio was granted 25,000 shares of Common Stock under the 2010 Stock Incentive Plan valued at $2.35 per share. The shares vest as follows: 75,000 on April 14, 2011; 75,000 on April 14, 2012; and 75,000 on April 14, 2013.
During June 2011, the Board of Directors accepted the recommendation of the Compensation Committee that each non-employee Director serving as of June 30, 2011 receive a stock award of 10,000 shares of Common Stock under the 2010 Stock Incentive Plan valued at $2.22 per share. A total of 50,000 shares of Common Stock were awarded, and the shares vest as follows: 16,665 on June 30, 2011; 16,665 on June 30, 2012; and 16,670 on June 30, 2013.
During June 2011, the Company granted 4,000 shares of Common Stock to certain employees under the 2010 Stock Incentive Plan valued at $2.19 per share. The shares vest as follows: 1,000 on September 30, 2011; 1,000 on December 31, 2011; 1,000 on March 31, 2012; and 1,000 on June 30, 2012.
On June 13, 2011, the Company’s shareholders approved the 2011 Stock Incentive Plan to allow up to 300,000 shares of Common Stock to be available for issuance to future or current employees, directors and consultants of the Company. There were no shares issued under the plan during the fiscal year ended June 30, 2011.
During the year ended June 30, 2009, the Company retired 138,744 shares of its Common Stock it purchased on the open market at prices ranging from $1.26 to $4.00 per share for a total of $331,690. The Company did not purchase any of its Common Stock during the years ended June 30, 2011 and 2010.
As of June 30, 2011, the Company had reserved shares of Common Stock for future issuance for the following:
|
Exercise of Common Stock Options
|
90,666 | |||
|
Exercise of Common Stock Warrants
|
15,567,199 | |||
|
Conversions of Preferred Stock and cumulative Preferred Stock dividends
|
14,697 | |||
|
Issuance under 2010 Stock Incentive Plan
|
190,082 | |||
|
Issuance under 2011 Stock Incentive Plan
|
300,000 | |||
|
Issuance under Chief Executive Officer’s employment agreement upon the occurrence of a USA Transaction
|
140,000 | |||
|
Total shares reserved for future issuance
|
16,302,644 | |||
F-22
USA Technologies, Inc.
Notes to Consolidated Financial Statements
11. COMMON STOCK (CONTINUED)
A summary of the status of the Company’s nonvested common shares as of June 30, 2011, 2010 and 2009, and changes during the years then ended is presented below:
|
Weighted-Average
|
||||||||
|
Grant-Date
|
||||||||
|
Shares
|
Fair Value
|
|||||||
|
Nonvested Shares
|
||||||||
|
Nonvested at June 30, 2008
|
367,233 | $ | 5.77 | |||||
|
Granted
|
239,000 | 4.36 | ||||||
|
Vested
|
(268,600 | ) | 4.50 | |||||
|
Forfeited shares due to terminations
|
(6,200 | ) | 4.45 | |||||
|
Reversal of forfeited shares due to normalization- FY 2008 (LTIP)
|
64,756 | 5.90 | ||||||
|
Vested- FY 2008 (LTIP)
|
(64,756 | ) | 5.90 | |||||
|
Nonvested at June 30, 2009
|
331,433 | $ | 5.81 | |||||
|
Granted
|
39,000 | 1.75 | ||||||
|
Vested
|
(40,000 | ) | 2.47 | |||||
|
Vested- FY 2010 (LTIP)
|
(86,342 | ) | 5.90 | |||||
|
Forfeited- FY 2010 (LTIP)
|
(231,091 | ) | 5.90 | |||||
|
Nonvested at June 30, 2010
|
13,000 | $ | 1.75 | |||||
|
Granted
|
305,000 | 2.18 | ||||||
|
Vested
|
(130,665 | ) | 1.93 | |||||
|
Nonvested at June 30, 2011
|
187,335 | $ | 2.32 | |||||
The 187,335 nonvested shares of Common Stock as of June 30, 2011 were granted under the 2010 Stock Incentive Plan related to employment agreements and non-employee Board of Director grants. A discussion of assumptions used in calculating the number of shares and weighted-average grant date fair value is included above in Note 11 of the Consolidated Financial Statements.
F-23
USA Technologies, Inc.
Notes to Consolidated Financial Statements
12. COMMON STOCK WARRANTS AND OPTIONS
Common Stock Warrant activity for the years ended June 30, 2011, 2010 and 2009 was as follows:
|
Warrants
|
||||
|
Outstanding at June 30, 2008
|
1,591,735 | |||
|
Issued
|
1,570,622 | |||
|
Exercised
|
- | |||
|
Expired
|
(131,494 | ) | ||
|
Outstanding at June 30, 2009
|
3,030,863 | |||
|
Issued
|
10,495,885 | |||
|
Exercised
|
- | |||
|
Expired
|
- | |||
|
Outstanding at June 30, 2010
|
13,526,748 | |||
|
Issued
|
4,541,670 | |||
|
Exercised
|
(1,001,219 | ) | ||
|
Expired
|
(1,500,000 | ) | ||
|
Outstanding at June 30, 2011
|
15,567,199 | |||
All Common Stock warrants outstanding as of June 30, 2011 were exercisable except for 4,264,000 expiring on September 18, 2016 which are not exercisable until September 18, 2011. The following table shows exercise prices and expiration dates for warrants outstanding as of June 30, 2011:
|
Exercise
|
|||||
|
Warrants
|
Price
|
Expiration
|
|||
|
Outstanding
|
Per Share
|
Date
|
|||
|
609,376
|
$ | 6.40 |
December 31, 2011
|
||
|
6,909,437
|
$ | 2.20 |
December 31, 2011
|
||
|
291,432
|
$ | 2.20 |
August 6, 2012
|
||
|
17,532
|
$ | 7.70 |
October 17, 2012
|
||
|
46,258
|
$ | 1.13 |
May 12, 2013
|
||
|
7,169
|
$ | 1.13 |
July 7, 2013
|
||
|
903,955
|
$ | 5.90 |
September 14, 2013
|
||
|
2,518,040
|
$ | 1.13 |
December 31, 2013
|
||
|
4,264,000
|
$ | 2.6058 |
September 18, 2016
|
||
|
15,567,199
|
|||||
F-24
USA Technologies, Inc.
Notes to Consolidated Financial Statements
12. COMMON STOCK WARRANTS AND OPTIONS (CONTINUED)
All Common Stock warrants outstanding as of June 30, 2010 were exercisable except for the 500,000 and 1,000,000 warrants expiring on October 1, 2010 and October 1, 2011, respectively, which are not exercisable until minimum performance hurdles in the First Data Joint Marketing Agreement are achieved, as discussed later in this Note; an additional 2,753,454 warrants were not exercisable until January 1, 2011. The following table shows exercise prices and expiration dates for warrants outstanding as of June 30, 2010:
|
Exercise
|
|||||
|
Warrants
|
Price
|
Expiration
|
|||
|
Outstanding
|
Per Share
|
Date
|
|||
|
500,000
|
$ | 5.25 |
October 1, 2010
|
||
|
1,000,000
|
$ | 6.00 |
October 1, 2011
|
||
|
609,376
|
$ | 6.40 |
December 31, 2011
|
||
|
7,285,792
|
$ | 2.20 |
December 31, 2011
|
||
|
291,432
|
$ | 2.20 |
August 6, 2012
|
||
|
17,532
|
$ | 7.70 |
October 17, 2012
|
||
|
165,207
|
$ | 1.13 |
May 12, 2013
|
||
|
903,955
|
$ | 5.90 |
September 14, 2013
|
||
|
2,753,454
|
$ | 1.13 |
December 31, 2013
|
||
|
13,526,748
|
|||||
In conjunction with an October 17, 2007 Securities Purchase Agreement, the Company issued warrants to purchase up to 17,532 shares of the Company’s Common Stock at $7.70 per share at any time through October 17, 2012 to the broker dealer who acted as the exclusive placement agent in the transaction.
In connection with a Securities Purchase Agreement with S.A.C. Capital Associates, LLC (“SAC“) entered into by the Company on March 14, 2007, the Company issued warrants to purchase 833,333 shares of Common Stock, exercisable at $6.40 per share. The warrant provided that if the Company would issue securities in the future at a purchase price that is less than the exercise price of the warrant, then the exercise price of the warrant would be reduced to such lower purchase price, provided, however, that such exercise price can never be lower than $5.90 which was the closing bid price of our shares on the day prior to the sale of our securities to SAC. The warrant also provides that in the event we issue
securities at a purchase price less than the exercise price of the warrant, the number of shares issuable under the warrant shall be increased by that number of shares determined by multiplying the exercise price in effect immediately prior to such adjustment by the number of shares issuable under the warrant immediately prior to such adjustment and dividing the product thereof by the new exercise price of the warrant (which can never be less than $5.90). Under this formula, the maximum number shares would be issuable under the warrant would be 903,955. In October 2008, the Company entered into an agreement, as described below, which caused the number of warrants to be automatically increased to 903,955 and the exercise price reduced to $5.90. In addition for a period of five years, SAC has been granted the pre-emptive right to purchase that number of securities being offered for sale
by the Company in order to maintain SAC’s pro-rata ownership of the Common Stock of the Company following the issuance of any such securities by the Company. The warrants are exercisable at any time through September 14, 2013 to the extent that such exercise would not result in the beneficial ownership by SAC and its affiliates of more than 9.99% of the number of shares outstanding immediately after giving effect to the issuance of shares upon exercise of the warrants.
The warrant contains a provision that if a Fundamental Transaction occurs, notably a change in control, within ninety days of the Fundamental Transaction the warrant holder may require the Company to pay the Black-Scholes calculated value of the then unexercised warrant to the warrant holder in cash. The fair value of the 903,955 warrants was estimated using the Black-Scholes model and applying an estimated fair value adjustment related to warrant exercise restrictions, and the Company recorded a warrant liability in its Consolidated Balance Sheet of $93,624 and $0 at June 30, 2011 and 2010, respectively (see Note 8).
F-25
USA Technologies, Inc.
Notes to Consolidated Financial Statements
12. COMMON STOCK WARRANTS AND OPTIONS (CONTINUED)
At the time of entering into a Joint Marketing Agreement (October 2008), USA issued to First Data performance–based warrants to purchase up to 1,500,000 shares of Common Stock of USA. First Data had the right to purchase 500,000 of such shares within two years of issuance at $5.25 per share (the “A Warrants”), and 1,000,000 of such shares within three years of issuance at $6.00 per share (the “B Warrants”). The A Warrants were only exercisable by First Data if a minimum of 20,000 e-Ports were sold to a customer pursuant to the Joint Marketing Agreement prior to the expiration of the A Warrants, which was October 1, 2010. The B Warrants were only exercisable by First Data if the A
Warrants became exercisable. The performance measurements for the A Warrants to become exercisable were not met. Therefore, all 1,500,000 warrants issued under the First Data Joint Marketing Agreement were forfeited on October 1, 2010.
As a result of the issuance of warrants to First Data, the exercise price of the warrants held by S.A.C. Capital Associates, LLC (“S.A.C.”) has been automatically reduced to $5.90 per share from $6.40 per share, and the number of shares underlying these warrants has been automatically increased to 903,955 from 833,333, as required by the terms of the Securities Purchase Agreement with S.A.C. dated March 14, 2007.
In conjunction with the 2009 Rights Offering (see Note 11), the Company issued warrants to purchase 7,285,792 shares of Common Stock, exercisable at $2.20 per share at any time prior to December 31, 2011. Additionally, the Company issued each of the two dealer managers warrants to purchase 145,716 shares of Common Stock that were exercisable at $2.20 per share at any time prior to August 6, 2012. During the year ended June 30, 2011, 376,355 warrants, with an expiration date of December 31, 2011, were exercised at $2.20 per share for cash proceeds of $827,981.
In conjunction with the 2010 Public Offering (see Note 11), the Company issued warrants to purchase 2,753,454 shares of Common Stock, exercisable at $1.13 per share at any time prior to December 31, 2013. Additionally, the Company issued the placement agent warrants to purchase 165,207 shares of Common Stock, exercisable at $1.13 per share at any time prior to May 12, 2013.
In conjunction with the 2010 Rights Offering (see Note 11), the Company issued warrants to purchase 261,953 shares of Common Stock, exercisable at $1.13 per share at any time prior to December 31, 2013. Additionally, the Company issued the placement agent warrants to purchase 15,717 shares of Common Stock at $1.13 per share at any time through July 7, 2013.
During the year ended June 30, 2011, 497,367 warrants, with an expiration date of December 31, 2013, were exercised at $1.13 per share for cash proceeds of $562,025. Additionally, during the year ended June 30, 2011, 127,497 warrants, issued to the placement agent for the 2010 Public Offering and 2010 Rights Offering, were cashless exercised resulting in the issuance of 83,472 shares of Common Stock.
In conjunction with the 2011 Private Placement Offering (see Note 11), the Company issued warrants to purchase 3,900,000 shares of Common Stock at an exercise price of $2.6058 per share. Additionally, the Company issued the placement agent warrants to purchase 364,000 shares of common stock at $2.6058 per share. The 4,264,000 warrants are exercisable from September 18, 2011 through September 18, 2016.
The 3,900,000 warrants issued under the 2011 Private Placement Offering contain a provision that if a Fundamental Transaction occurs, notably a change in control, the warrant holder may require the Company to pay the Black-Scholes calculated value of the then unexercised warrant to the warrant holder in cash. The fair value of the warrants was estimated, and the Company recorded a warrant liability in its Consolidated Balance Sheet of $2,638,629 and $0 at June 30, 2011and 2010, respectively (see Note 8).
The Company’s Board of Directors has granted options to employees and Board members to purchase shares of Common Stock at prices that were at or above fair market value on the dates the options were granted. The option term and vesting schedule were established by the contracts under which the options were granted.
F-26
USA Technologies, Inc.
Notes to Consolidated Financial Statements
12. COMMON STOCK WARRANTS AND OPTIONS (CONTINUED)
Common Stock Option activity during the years ended June 30, 2011, 2010 and 2009 was as follows:
|
Weighted-
|
||||||||||||
|
Exercise
|
Average
|
|||||||||||
|
Options
|
Price
|
Exercise
|
||||||||||
|
Outstanding
|
Per Share
|
Price
|
||||||||||
|
Outstanding and exercisable at June 30, 2008
|
161,500 | $ | 7.50-20 | $ | 7.63 | |||||||
|
Granted
|
- | - | $ | - | ||||||||
|
Expired
|
(1,500 | ) | $ | 20.00 | $ | 20.00 | ||||||
|
Outstanding and exercisable at June 30, 2009
|
160,000 | $ | 7.50-8 | $ | 7.52 | |||||||
|
Granted
|
- | - | $ | - | ||||||||
|
Expired
|
- | - | $ | - | ||||||||
|
Outstanding and exercisable at June 30, 2010
|
160,000 | $ | 7.50-8 | $ | 7.52 | |||||||
|
Granted
|
- | - | $ | - | ||||||||
|
Expired
|
(69,334 | ) | $ | 7.50 | $ | 7.50 | ||||||
|
Outstanding and exercisable at June 30, 2011
|
90,666 | $ | 7.50-8 | $ | 7.53 | |||||||
The following table shows exercisable options, exercise prices, the weighted average remaining contractual life and the aggregate intrinsic value for options outstanding as of June 30, 2011:
|
Weighted Average
|
||||||||||||||||||||||||
|
Contractual
|
||||||||||||||||||||||||
|
Options
|
Options
|
Exercise Price Per
|
Remaining Life
|
(Years)-
|
Intrinsic Value-
|
|||||||||||||||||||
|
Outstanding
|
Exercisable
|
Share
|
Outstanding
|
Exercisable
|
Outstanding
|
Exercisable
|
||||||||||||||||||
|
84,666
|
84,666 | 7.50 | 1.45 | 0.49 | - | - | ||||||||||||||||||
|
6,000
|
6,000 | 8.00 | 1.47 | 0.74 | - | - | ||||||||||||||||||
|
90,666
|
90,666 | 1.45 | 0.51 | - | - | |||||||||||||||||||
The following table shows exercisable options, exercise prices, the weighted average remaining contractual life and the aggregate intrinsic value for options outstanding as of June 30, 2010:
|
Weighted Average
|
||||||||||||||||||||||||
|
Contractual
|
||||||||||||||||||||||||
|
Options
|
Options
|
Exercise Price Per
|
Remaining Life
|
(Years)-
|
Intrinsic Value-
|
|||||||||||||||||||
|
Outstanding
|
Exercisable
|
Share
|
Outstanding
|
Exercisable
|
Outstanding
|
Exercisable
|
||||||||||||||||||
|
154,000
|
154,000 | 7.50 | 1.72 | 0.82 | - | - | ||||||||||||||||||
|
6,000
|
6,000 | 8.00 | 2.47 | 1.06 | - | - | ||||||||||||||||||
|
160,000
|
160,000 | 1.73 | 0.83 | - | - | |||||||||||||||||||
There was no compensation expense related to the vesting of options outstanding in the years ended June 30, 2011, 2010 and 2009 as all options were vested, and all related compensation expense had been recognized, prior to the June 30, 2009 fiscal year.
F-27
USA Technologies, Inc.
Notes to Consolidated Financial Statements
13. RETIREMENT PLAN
The Company’s 401(k) Plan (the “Plan”) allows employees who have completed six months of service to make voluntary contributions up to a maximum of 100% of their annual compensation, as defined in the Plan. The Company may, in its discretion, make a matching contribution, a profit sharing contribution, a qualified non-elective contribution, and/or a safe harbor 401(k) contribution to the Plan. The Company must make an annual election, at the beginning of the plan year, as to whether it will make a safe harbor contribution to the plan. In fiscal years 2010 and 2009, the Company elected and made a safe harbor matching contributions of 100% of the participant’s first 3% and 50% of the next 2%
of compensation deferred into the Plan. For fiscal year 2011, the Company did not elect to make a safe harbor contribution to the plan. The Company’s safe harbor contributions for the years ended June 30, 2010 and 2009 approximated $160,000 and $189,000, respectively. The Company’s discretionary contribution for the year ended June 30, 2011 approximated $42,000.
14. RELATED PARTY TRANSACTIONS
During the years ended June 30, 2011, 2010, and 2009, the Company incurred approximately $513,000, $730,000, and $438,000, respectively, in connection with legal services provided by a member of the Company’s Board of Directors. At June 30, 2011 and 2010, approximately $25,000 and $29,000, respectively, were due to this Board member. During the years ended June 30, 2011, 2010, and 2009, the Company incurred approximately $0, $59,000, and $0 in connection with consulting services provided by another member of the Company’s Board of Directors. At June 30, 2011, 2010 and 2009, no amounts were due to this Board member, who resigned as a director of the Company effective May 13, 2010.
15. COMMITMENTS AND CONTINGENCIES
The Company conducts its operations from various facilities under operating leases. The Company leases 17,249 square feet of space located in Malvern, Pennsylvania for its principal executive office and used for general administrative functions, sales activities, and product development. In November 2010, the Company entered into an amended lease of its principal executive office in Malvern, Pennsylvania, which extended the lease term from December 31, 2010 to April 2016. The amendment includes rental payments of approximately $29,000 to $32,000 as well as a four month period of no rent payments. The straight-lined rent expense for this office is approximately $29,000 per month for the duration of the
lease.
The Company also leases 13,377 square feet of space, located in Malvern, Pennsylvania for its product warehousing, shipping and customer support. In December 2010, the Company entered into an amended lease of its operations site, also in Malvern, Pennsylvania, to extend the lease term from December 31, 2010 to December 31, 2011. Monthly lease payments are approximately $14,500.
Rent expense under operating leases was approximately $545,000, $616,000, and $612,000 during the years ended June 30, 2011, 2010 and 2009, respectively. Future minimum lease payments subsequent to June 30, 2011 under capital leases and noncancellable operating leases are as follows:
|
Capital
|
Operating
|
|||||||
|
Leases
|
Leases
|
|||||||
|
2012
|
$ | 79,331 | $ | 439,848 | ||||
|
2013
|
8,128 | 360,073 | ||||||
|
2014
|
677 | 368,697 | ||||||
|
2015
|
- | 377,322 | ||||||
|
Thereafter
|
- | 321,263 | ||||||
|
Total minimum lease payments
|
$ | 88,136 | $ | 1,867,203 | ||||
|
Less amount representing interest
|
4,092 | |||||||
|
Present value of net minimum lease payments
|
84,044 | |||||||
|
Less current obligations under capital leases
|
75,829 | |||||||
|
Obligations under capital leases, less current portion
|
$ | 8,215 | ||||||
F-28
USA Technologies, Inc.
Notes to Consolidated Financial Statements
15. COMMITMENTS AND CONTINGENCIES (CONTINUED)
On September 24, 2009, Mr. Jensen and the Company entered into an Amended and Restated Employment Agreement which replaced his prior employment agreement. The Agreement extended the term of Mr. Jensen’s employment with the Company from June 30, 2011 until September 30, 2012, and will automatically continue from year to year thereafter unless terminated as of the end of the original term or any such one year renewal period by the Company or Mr. Jensen by at least 90-days notice. Mr. Jensen was granted 30,000 shares of common stock under the 2008 Stock Incentive Plan which vested as follows: 10,000 on October 1, 2009; 10,000 on April 1, 2010; and 10,000 on September 30, 2010.
The agreement continued Mr. Jensen’s base salary at $365,000 per annum. The agreement requires Mr. Jensen to devote his full time and attention to the business and affairs of the Company, and obligates him not to engage in any investments or activities which would compete with the Company during the term of the agreement and for a period of two years thereafter. The Company has agreed to obtain and pay the premiums for a term life insurance policy in the amount of $2,000,000 on the life of Mr. Jensen while he is employed by the Company. Mr. Jensen has the right to designate the beneficiary of the policy. The Company has agreed to obtain and pay the premiums for a supplemental long term disability policy
covering Mr. Jensen over and above the existing long-term group disability plan of the Company. If he shall become disabled while employed by the Company, the policy would provide for monthly disability coverage of up to 65% of his monthly base compensation payable to age 65 or death. If the policy would not provide at least 65% of his monthly base salary, then the Company has agreed to make monthly payments to Mr. Jensen in an amount equal to the difference between the monthly benefit provided under such policy and 65% of Mr. Jensen’s monthly base salary; provided, however, that the Company’s total obligation for such monthly payments shall not exceed $110,000.
The agreement also provides that if Mr. Jensen would terminate his employment with the Company for good reason (as defined in the agreement), or if the Company would terminate his employment without cause (as defined in the agreement), then the Company would pay to him a lump sum equal to two times his base salary on or before the termination of his employment and all unvested restricted stock awards and stock options would immediately become vested. In addition, upon any such termination of Mr. Jensen’s employment, the Company has agreed, at its cost, for a period of two years, to continue to provide Mr. Jensen with health, life and disability benefits substantially similar to those which he had been
receiving immediately prior to the date of termination. The term good reason as defined in the agreement, includes: (A) a material breach of the terms of the Agreement by the Company; (B) the assignment by the Company to Mr. Jensen of duties in any way materially inconsistent with his authorities, duties, responsibilities, and status, as the Chief Executive Officer of the Company, or a material reduction or alteration in the nature or status of his authority, duties, or responsibilities; (C) the Company reduces Mr. Jensen’s annual base salary; or (D) a material reduction by the Company in the kind or level of employee benefits to which Mr. Jensen is entitled immediately prior to such reduction with the result that his overall benefit package is significantly reduced unless such failure to continue a plan, policy, practice or arrangement pertains to all plan participants generally.
As a condition to Mr. Jensen receiving any payments or benefits upon his termination of his employment for good reason, Mr. Jensen shall have executed and delivered (and not revoked) a release of any and all claims, suits, or causes of action against the Company and its affiliates in form reasonably acceptable to the Company.
The agreement also provides that as a condition of the consummation of a USA Transaction (as defined below), the successor to the Company’s business or assets would agree to assume and perform Mr. Jensen’s employment agreement. If any such successor would not do so, Mr. Jensen’s employment would terminate on the date of the consummation of the USA Transaction, and the Company would pay to Mr. Jensen a lump sum equal to two times his base salary on or before the termination of his employment, all unvested restricted stock awards and stock options would become immediately vested, and, at its cost, for a period of two years would continue to provide Mr. Jensen with health, life and disability
benefits substantially similar to those which he is receiving immediately prior to the date of termination.
The agreement also provides that upon the occurrence of a USA Transaction, the Company will issue to Mr. Jensen 140,000 shares of common stock subject to adjustment for stock splits or combinations (the “Jensen Shares”). Mr. Jensen is not required to pay any additional consideration for the Jensen Shares. At the time of any USA Transaction, all of the Jensen Shares are automatically deemed to be issued and outstanding immediately prior to any USA Transaction, and are entitled to be treated as any other issued and outstanding shares of common stock in connection with such USA Transaction. The Jensen Shares are irrevocable and fully vested, represent an unconditional obligation of the Company, and will
not be affected by the termination of Mr. Jensen’s employment with the Company for any reason whatsoever.
The term USA Transaction is defined as (i) the acquisition of fifty-one percent or more of the then outstanding voting securities entitled to vote generally in the election of Directors of the Company by any person, entity or group, or (ii) the approval by the shareholders of the Company of a reorganization, merger, consolidation, liquidation, or dissolution of the Company, or the sale, transfer, lease or other disposition of all or substantially all of the assets of the Company, or (iii) a change in the composition of the Board of Directors of the Company over a period of twelve (12) months or less such that the continuing directors fail to constitute a majority of the Board.
F-29
USA Technologies, Inc.
Notes to Consolidated Financial Statements
15. COMMITMENTS AND CONTINGENCIES (CONTINUED)
On April 14, 2011, the Company and Mr. Jensen entered into an amendment to the employment agreement. The amendment extended the term of Mr. Jensen’s employment with the Company from September 30, 2012 until June 30, 2014. In connection with the amendment, and in recognition of his dedicated and valuable service to the Company and extending the term of his employment agreement, Mr. Jensen was issued 125,000 shares of common stock under the 2010 Stock Incentive Plan which vest as follows: 41,666 on April 14, 2011; 41,667 on April 14, 2012; and 41,667 on April 14, 2013.
On September 24, 2009, Mr. Herbert and the Company entered into an Amended and Restated Employment Agreement which replaced his prior employment agreement. The Agreement extended the term of Mr. Herbert’s employment with the Company from June 30, 2011 until September 30, 2012, and will automatically continue from year to year thereafter unless terminated as of the end of the original term or any such one year renewal period by the Company or Mr. Herbert by at least 90-days notice and Mr. Herbert was granted 9,000 shares of common stock under the 2008 Stock Incentive Plan which vested as follows: 3,000 on October 1, 2009; 3,000 on April 1, 2010; and 3,000 on September 30, 2010.
The agreement continued Mr. Herbert’s base salary at $320,000 per annum. The agreement requires Mr. Herbert to devote his full time and attention to the business and affairs of the Company, and obligates him not to engage in any investments or activities which would compete with the Company during the term of the agreement and for a period of two years thereafter. The Company has agreed to obtain and pay the premiums for a term life insurance policy in the amount of $1,500,000 on the life of Mr. Herbert while he is employed by the Company. Mr. Herbert has the right to designate the beneficiary of the policy. The Company has agreed to obtain and pay the premiums for a supplemental long term disability policy
covering Mr. Herbert over and above the existing long-term group disability plan of the Company. If he shall become disabled while employed by the Company, the policy would provide for monthly disability coverage of up to 65% of his monthly base compensation payable to age 65 or death.
The agreement also provides that if Mr. Herbert would terminate his employment with the Company for good reason (as defined in the agreement), or if the Company would terminate his employment without cause (as defined in the agreement), then the Company would pay to him a lump sum equal to two times his base salary on or before the termination of his employment and all unvested restricted stock awards and stock options would become immediately vested. In addition, upon any such termination of Mr. Herbert’s employment, the Company has agreed, at its cost, for a period of two years, to continue to provide Mr. Herbert with health, life and disability benefits substantially similar to those which he had been
receiving immediately prior to the date of termination. The term good reason as defined in the agreement, includes: (A) a material breach of the terms of the agreement by the Company; (B) the assignment by the Company to Mr. Herbert of duties in any way materially inconsistent with his authorities, duties, or responsibilities, or a material reduction or alteration in the nature or status of his authority, duties, or responsibilities as the President of the Company; (C) the Company reduces Mr. Herbert’s annual base salary; or (D) a material reduction by the Company in the kind or level of employee benefits to which Mr. Herbert is entitled immediately prior to such reduction with the result that his overall benefit package is significantly reduced unless such failure to continue a plan, policy, practice or arrangement pertains to all plan participants generally. As a condition to
Mr. Herbert receiving any payments or benefits upon his termination of his employment for good reason, Mr. Herbert shall have executed and delivered (and not revoked) a release of any and all claims, suits, or causes of action against the Company and its affiliates in form reasonably acceptable to the Company.
The agreement also provides that as a condition of the consummation of a USA Transaction (as defined in the agreement), the successor to the Company’s business or assets would agree to assume and perform Mr. Herbert’s employment agreement. If any such successor would not do so, Mr. Herbert’s employment would terminate on the date of consummation of the USA Transaction, and the Company would pay to Mr. Herbert a lump sum equal to two times his base salary on or before the termination of his employment, all unvested restricted stock awards and stock options would become immediately vested, and, at its cost, for a period of two years would continue to provide Mr. Herbert with health, life and
disability benefits substantially similar to those which he is receiving immediately prior to the date of termination.
On April 14, 2011, the Company and Mr. Herbert entered into an amendment to the employment agreement. The amendment extended the term of Mr. Herbert’s employment with the Company from September 30, 2012 until June 30, 2014. In connection with the amendment, and in recognition of his dedicated and valuable service to the Company and extending the term of his employment agreement, Mr. Herbert was issued 75,000 shares of common stock under the 2010 Stock Incentive Plan which vest as follows: 25,000 on April 14, 2011; 25,000 on April 14, 2012; and 25,000 on April 14, 2013.
F-30
USA Technologies, Inc.
Notes to Consolidated Financial Statements
15. COMMITMENTS AND CONTINGENCIES (CONTINUED)
On April 12, 2005, Mr. DeMedio and the Company entered into an employment agreement pursuant to which he was employed as the Chief Financial Officer of the Company. The term of the agreement is for one year and will automatically continue from year to year thereafter unless terminated as of the end of the original term or any such one year renewal period by the Company or Mr. DeMedio by at least 90-days notice. The agreement requires Mr. DeMedio to devote his full time and attention to the business and affairs of the Company, and obligates him not to engage in any investments or activities which would compete with the Company during the term of the agreement and for a period of one year thereafter. In the event
that a USA Transaction (as defined in Mr. Jensen’s employment agreement) shall occur, then Mr. DeMedio has the right to terminate his agreement upon 30 days notice to the Company.
During September 2008, Mr. DeMedio and the Company entered into an amendment to his employment agreement pursuant to which he was granted 25,000 shares of common stock under the 2008 Stock Incentive Plan which vested as follows: 8,000 on September 15, 2008; 8,000 on January 15, 2009; and 9,000 on June 30, 2009.
On September 24, 2009, the Company agreed to obtain and pay the premiums for a term life insurance policy in the amount of $750,000 on the life of Mr. DeMedio while he is employed by the Company. Mr. DeMedio has the right to designate the beneficiary of the policy. The Company has agreed to obtain and pay the premiums for a supplemental long term disability policy covering Mr. DeMedio over and above the existing long-term group disability plan of the Company. If he shall become disabled while employed by the Company, the policy would provide for monthly disability coverage of up to 65% of his monthly base compensation payable to age 65 or death. If Mr. DeMedio’s employment with the Company would be
terminated without cause, the Company has agreed, at its cost, to continue to provide Mr. DeMedio with health insurance benefits substantially similar to those which he is receiving immediately prior to the date of termination for a one year period following such termination.
On April 14, 2011, the Company and Mr. DeMedio entered into an additional amendment to the employment agreement. The agreement extended the term of Mr. DeMedio’s employment with the Company from June 30, 2011 until June 30, 2014, and will automatically continue from year to year thereafter unless terminated as of the end of the original term or any such one year renewal period by the Company or Mr. DeMedio by at least 90-days notice. In connection with the amendment, and in recognition of his dedicated and valuable service to the Company and extending the term of his employment agreement, Mr. DeMedio was issued 25,000 shares of common stock under the 2010 Stock Incentive Plan which vest or vested as follows:
8,333 on April 14, 2011; 8,333 on April 14, 2012; and 8,334 on April 14, 2013.
Effective July 1, 2011, Mr. DeMedio’s annual base salary was increased to $230,000.
16. SUBSEQUENT EVENTS
FINANCING ARRANGEMENTS
During July 2011, the Company financed a portion of the premiums for various insurance policies totaling $90,372 due in nine equal monthly installment payments of $10,283 at an interest rate of 5.57%.
During August 2011, the Company entered into various capital leases for network equipment and maintenance contracts on the equipment totaling approximately $465,000, due in thirty-six equal monthly payments of $14,145 through July 2014 at an interest rate of 5.99%.
EXECUTIVE COMPENSATION
On September 15, 2011, at the recommendation of the Compensation Committee, the board of directors adopted the Fiscal Year 2012 Performance Share Plan (the “2012 Plan”) covering the Company’s executive officers – Messrs. Jensen, Herbert and DeMedio. Under the 2012 Plan, each executive officer will be awarded common stock in the event the Company achieves target goals during the fiscal year ending June 30, 2012 relating to the total number of connections, total revenues, operating expenses, and operating earnings. Operating earnings is defined as earnings before interest and taxes (after bonus accruals and
stock awards) and before non-operating gains or losses. The number of eligible shares to be awarded to the executives is based upon the following weightings: 30% by the total number of connections; 30% by total revenues; 10% by operating expenses; and 30% by operating earnings. No awards would be made under the 2012 Plan if either (i) none of the minimum, threshold performance target goals have been achieved, or (ii) if operating earnings for the 2012 fiscal year are not equal or better than those during the 2011 fiscal year.
If all of the target performance goals are achieved, the executive officers would be awarded the following number of shares: Mr. Jensen- 225,000 shares; Mr. Herbert – 120,000 shares; and Mr. DeMedio – 50,000 shares. If all of the minimum, threshold performance target goals are achieved, the executive officers would be awarded 20% of the number of shares which would have been awarded to them if all of the target performance goals had been achieved. If all of the maximum, distinguished performance target goals are achieved, the executive officers would be awarded 150% of the number of shares which would have been awarded to
them if all of the target performance goals had been achieved. If the actual results for the fiscal year are less than the target goals (but greater than the minimum, threshold performance target goals), each executive would be awarded a lesser pro rata portion of the number of eligible shares.
In the event of the occurrence of a USA Transaction during the fiscal year, and provided that the executive is an employee of USA on the date of such USA Transaction, the Plan shall be terminated and each executive shall be awarded shares as of the date of such USA Transaction as if all of the target performance goals had been met. In the event that the executive’s employment with the Company is terminated by the Company for cause during the fiscal year, or if the executive resigns his employment for any reason other than for good reason during the fiscal year, then the executive shall not be entitled to earn any award under the
2012 Plan. In the event that the executive’s employment with the Company shall be terminated by the Company during the fiscal year for any reason whatsoever other than for cause, or if the executive’s employment is terminated by the executive for good reason during the fiscal year, then the executive shall be awarded shares as if all of the target performance goals had been meet. If the executive’s employment is terminated during the fiscal year as a result of death or disability, the executive shall nevertheless be eligible to earn shares under the 2012 Plan as if he had remained employed with the Company through the end of the fiscal year.
Notwithstanding the above description of the 2012 Plan, the executives would receive shares from the Company pursuant to the 2012 Plan only if and to the extent that shares would be available to be issued to the executives under the existing 2011 stock incentive plan or another stock plan that has been approved by the shareholders of the Company in accordance with NASDAQ Listing Rule 5635(c). If there would not be a sufficient number of shares available to be issued to the executives, the Company would pay to the executives an amount of cash equal to the value of those shares not available to be issued to the executives. In such event,
the executives would be required to utilize the cash payment, net of any withholding, payroll or other taxes attributable to the cash payment, to purchase shares of common stock of the Company on the open market.
F-31
USA Technologies, Inc.
Notes to Consolidated Financial Statements
16. SUBSEQUENT EVENTS (CONTINUED)
On September 27, 2011, the Company and Mr. Jensen entered into an amended and restated employment agreement, as well as the Jensen Stock Agreement described below. The new employment agreement continued substantially all of the previous terms and conditions of his employment agreement other than the provisions related to the Jensen Shares. The new agreement did not continue the provisions of his prior agreement which obligated the Company to pay any excise taxes attributable to any excess parachute payments which would be payable to Mr. Jensen upon the occurrence of a USA Transaction as well as the Company's obligation to pay tax gross up payments attributable to such excise taxes. The new agreement also stated
that the premiums for Mr. Jensen’s supplemental long term disability policy being paid by the Company would now be included in his wages and be taxable to him. In exchange for modifying the excise tax and related gross up provisions, the Company issued an aggregate of 150,000 shares of common stock to Mr. Jensen under its stock incentive plans which vest as follows: 50,000 on the date the agreement was signed by Mr. Jensen and the Company; 50,000 on the first anniversary of the date of signing; and 50,000 on the second anniversary of the date of signing.
On September 27, 2011, the Company and Mr. Jensen also entered into a new agreement (the “Jensen Stock Agreement”) which contained the provisions relating to the issuance by the Company to Mr. Jensen of the Jensen Shares which had previously been set forth in his employment agreement. The provisions of Mr. Jensen’s prior employment agreement which required the Company to pay any excise taxes attributable to the excess parachute payments attributable to the Jensen Shares as well as the related obligation to make tax gross up payments have been retained in the Jensen Stock Agreement and continue to apply to the Jensen Shares.
On September 27, 2011, the Company and Mr. Herbert entered into a second amendment to his employment agreement. The amendment eliminated the provisions of his prior agreement which obligated the Company to pay any excise taxes attributable to any excess parachute payments which would be received by Mr. Herbert upon the occurrence of a USA Transaction as well as the Company’s related obligation to make tax gross up payments. The new agreement also stated that the premiums for Mr. Herbert’s supplemental long term disability policy being paid by the Company would now be included in his wages and be taxable to him. In exchange for
eliminating the excise tax and related gross up provisions, the Company issued an aggregate of 100,000 shares of common stock to Mr. Herbert under its stock incentive plans which vest as follows: 33,333 on the date the agreement was signed by Mr. Herbert and the Company; 33,333 on the first anniversary of the date of signing; and 33,334 on the second anniversary of the date of signing.
On September 27, 2011, the Company and Mr. DeMedio entered into another amendment to his employment agreement pursuant to which Mr. DeMedio was granted an aggregate of 25,000 shares of common stock as a bonus for his performance during the last six months of the 2011 fiscal year which vest as follows: 8,333 on the date of signing the amendment; 8,333 on the first anniversary of such signing date; and 8,334 on the second anniversary of such signing date. Mr. DeMedio also agreed that the premiums for his supplemental long term disability policy being paid by the Company would now be included in his wages and be taxable to him.
INTERCHANGE RATES
On September 14, 2011, we were notified by Elavon, Inc. (“Elavon”), our United States credit and debit card processor, that effective October 1, 2011, Visa and MasterCard will significantly raise their interchange fees for small ticket debit card transactions issued by regulated banks as defined under the “Durbin Amendment,” to the Dodd Frank Wall Street Reform and Consumer Protection Act of 2010. If the Company continues to accept debit cards, then pursuant to our contract with Elavon, we are obligated to pay to Elavon the increases in these interchange rates. The interchange rate would increase from 1.55% of a transaction plus 4 cents, to 0.5% of a transaction plus 22 cents, which
represents an increase of approximately 247% based on a transaction of $1.67, which was the average transaction experienced by the Company during fiscal year 2011. During the fiscal year ended June 30, 2011, approximately 82% of the transactions handled by our network consisted of small ticket debit card transactions. Of such debit card transactions, it is estimated that 70% of those were debit transactions from regulated banks or issuers. Therefore, approximately 57% of all our transactions handled would be affected by the new rate.
The Company, and its card processor (Elavon), are currently in discussions with the card associations to discuss the impact of the rate increases, in order to attempt to negotiate a viable rate structure. In addition to these discussions, the Company has formulated steps that it is contemplating to implement, as it does not intend to incur the increase in these costs. At the present time, we cannot predict how not accepting debit cards, or other steps we are contemplating would affect our business.
VERIZON WIRELESS JOINT MARKETING AGREEMENT
On September 21, 2011, the Company and Verizon Wireless entered into a Joint Marketing Addendum (the “Verizon Agreement”) which amended the three year agreement previously entered into by them in April 2011. Pursuant to the Verizon Agreement, Verizon Wireless and the Company would work together to help identify business opportunities for the Company’s products and services. The Verizon Agreement is terminable by either party upon 45 days notice after six months.
F-32
None.
(a) Evaluation of disclosure controls and procedures.
The principal executive officer and principal financial officer have evaluated the Company’s disclosure controls and procedures as of June 30, 2011. Based on this evaluation, they conclude that the disclosure controls and procedures were effective to ensure that the information required to be disclosed by the Company in the reports that it files or submits under the Securities Exchange Act of 1934 is recorded, processed, summarized and reported, within the time periods specified in the Commission’s rules and forms and to ensure that information required to be disclosed by the Company in the reports that it files or submits under the Securities Exchange Act of 1934 is accumulated and communicated to the
Company’s management, including its principal executive and principal financial officers, or persons performing similar functions, as appropriate to allow timely decisions regarding required disclosure.
(b) Management’s annual report on internal control over financial reporting.
Management of the Company is responsible for establishing and maintaining adequate internal control over financial reporting as defined in Exchange Act Rules 13a-15(f). The Company’s internal control over financial reporting is a process effected by the Company’s management to provide reasonable assurance regarding the reliability of financial reporting and the preparation of the Company’s financial statements for external purposes in accordance with U.S. generally accepted accounting principles.
In designing and evaluating our disclosure controls and procedures, our management recognized that disclosure controls and procedures, no matter how well conceived and operated, can provide only a reasonable, not absolute, assurance that the objectives of the disclosure controls and procedures are met.
The Company’s management assessed the effectiveness of its internal control over financial reporting as of June 30, 2011. In making this assessment, it used the criteria set forth by the Committee of Sponsoring Organizations (COSO) of the Treadway Commission in Internal Control—Integrated Framework. Based on its assessment, management believes that, as of June 30, 2011, the Company’s internal control over financial reporting is effective.
This annual report does not include an attestation report of the Company’s registered public accounting firm regarding internal control over financial reporting. Management’s report was not subject to attestation by the Company’s registered public accounting firm pursuant to an exemption for smaller reporting companies under Section 989G of the Dodd-Frank Wall Street Reform and Consumer Protection Act.
(c) Changes in internal control over financial reporting.
There have been no changes during the quarter ended June 30, 2011 in the Company’s internal controls over financial reporting that have materially affected, or are reasonably likely to materially affect, internal control over financial reporting.
Not Applicable.
42
DIRECTORS AND EXECUTIVE OFFICERS
Our Directors and executive officers, on August 31, 2011, together with their ages and business backgrounds were as follows:
|
Name
|
Age
|
Position(s) Held
|
||
|
George R. Jensen, Jr.
|
62
|
Chief Executive Officer, Chairman of the Board of Directors
|
||
|
Stephen P. Herbert
|
48
|
Chief Operating Officer and President, Director
|
||
|
David M. DeMedio
|
40
|
Chief Financial Officer
|
||
|
Douglas M. Lurio
|
54
|
Secretary and Director
|
||
|
Joel Brooks(2)
|
52
|
Director
|
||
|
Steven D. Barnhart(1)(2)(3)
|
49
|
Director
|
||
|
Jack E. Price(1)(2)(3)
|
65
|
Director
|
||
|
Bradley M. Tirpak(3)
|
41
|
Director
|
|
(1)
|
Member of Compensation Committee
|
|
(2)
|
Member of Audit Committee
|
|
(3)
|
Member of Nominating Committee
|
George R. Jensen, Jr., has been our Chief Executive Officer, Chairman and a Director since our inception in January 1992. Mr. Jensen’s current term as a Director expires at the 2012 annual shareholders’ meeting. Mr. Jensen was Chairman, Director, and Chief Executive Officer of American Film Technologies, Inc. (“AFT”) from 1985 until 1992. AFT was in the business of creating color imaged versions of black-and-white films. From 1979 to 1985, Mr. Jensen was Chief Executive Officer and President of International Film Productions, Inc. Mr. Jensen was the Executive Producer of the twelve hour miniseries, “A.D.”, a $35 million
dollar production filmed in Tunisia. Procter and Gamble, Inc., the primary source of funds, co-produced and sponsored the epic, which aired in March 1985 for five consecutive nights on the NBC network. Mr. Jensen was also the Executive Producer for the 1983 special for public television, “A Tribute to Princess Grace”. From 1971 to 1978, Mr. Jensen was a securities broker, primarily for the firm of Smith Barney, Harris Upham. Mr. Jensen was chosen as the1989 Entrepreneur of the Year in the high technology category for the Philadelphia, Pennsylvania area by Ernst & Young LLP and Inc. Magazine. Mr. Jensen received his Bachelor of Science Degree from the University of Tennessee and is a graduate of the Advanced Management Program at the Wharton School of the University of Pennsylvania. From 1996 until March 2006, Mr. Jensen was a Director of The Noah Fund. We believe Mr.
Jensen’s position as the founder and Chief Executive Officer of our Company, his intimate knowledge and experience with all aspects of our company, and his exceptional leadership and entrepreneurial skills provide the requisite qualifications, skills, perspectives, and experiences to serve on our Board of Directors.
Stephen P. Herbert was elected a Director in April 1996, and joined the Company on a full-time basis on May 6, 1996 as Executive Vice President. During August 1999, Mr. Herbert was appointed President and Chief Operating Officer of the Company. Mr. Herbert’s current term as a Director expires at the 2012 annual shareholders’ meeting. Prior to joining us and since 1986, Mr. Herbert had been employed by Pepsi-Cola, the beverage division of PepsiCo, Inc. From 1994 to April 1996, Mr. Herbert was a Manager of Market Strategy. In such position he was responsible for directing development of market strategy for the vending channel and subsequently the
supermarket channel for Pepsi-Cola in North America. Prior thereto, Mr. Herbert held various sales and management positions with Pepsi-Cola. Mr. Herbert graduated with a Bachelor of Science degree from Louisiana State University. We believe Mr. Herbert’s position as the President and Chief Operating Officer of our Company, his intimate knowledge and experience with all aspects of our Company, and his extensive vending experience at PepsiCo before joining our Company provide the requisite qualifications, skills, perspectives, and experiences to serve on our Board of Directors.
David M. DeMedio joined the Company on a full-time basis in March 1999 as Controller. In the summer of 2001, Mr. DeMedio was promoted to Director of Financial Services where he was responsible for the sales and financial data reporting to customers, the Company’s turnkey banking services and maintaining and developing relationships with credit card processors and card associations. In July 2003, Mr. DeMedio served as interim Chief Financial Officer through April 2004. From April 2004 until April 2005, Mr. DeMedio served as Vice President - Financial & Data Services. On April 12, 2005, he was appointed as the Company’s Chief Financial Officer.
From 1996 to March 1999, prior to joining the Company, Mr. DeMedio had been employed by Elko, Fischer, Cunnane and Associates, LLC as a supervisor in its accounting and auditing and consulting practice. Prior thereto, Mr. DeMedio held various accounting positions with Intelligent Electronics, Inc., a multi-billion reseller of computer hardware and configuration services. Mr. DeMedio graduated with a Bachelor of Science in Business Administration from Shippensburg University and is a Certified Public Accountant. From October 2007 until September 2008, Mr. DeMedio was a Director of GammaCan International, Inc.
43
Douglas M. Lurio joined the Board of Directors of the Company in June 1999 and was appointed Secretary of the Company in September 2010. Mr. Lurio’s current term as a Director expires at the 2012 annual shareholders’ meeting. Mr. Lurio is President of Lurio & Associates, P.C., attorneys-at-law, which he founded in 1991. He specializes in the practice of corporate and securities law. Prior thereto, he was a partner with Dilworth, Paxson LLP. Mr. Lurio received a Bachelor of Arts Degree in Government from Franklin & Marshall College, a Juris Doctor Degree from Villanova Law School, and a Masters in Law (Taxation) from Temple
Law School. We believe Mr. Lurio’s legal background, his service as corporate counsel to the Company since 1992, and his intimate knowledge and experience with many aspects of our Company provide the requisite qualifications, skills, perspectives, and experiences to serve on our Board of Directors.
Joel Brooks joined the Board of Directors of the Company during March 2007. Mr. Brooks’ current term as a Director expires at the 2012 annual shareholders’ meeting. Mr. Brooks is the Chairman of our Audit Committee. Since December 2000, Mr. Brooks has served as the Chief Financial Officer and Treasurer of Senesco Technologies, Inc., a biotechnology company whose shares are traded on the NYSE Amex Exchange. From September 1998 until November 2000, Mr. Brooks was the Chief Financial Officer of Blades Board and Skate, LLC, a retail establishment specializing in the action sports industry. Mr. Brooks was Chief Financial Officer from 1997
until 1998 and Controller from 1994 until 1997 of Cable and Company Worldwide, Inc. He also held the position of Controller at USA Detergents, Inc. from 1992 until 1994, and held various positions at several public accounting firms from 1983 through 1992. Mr. Brooks received his Bachelor of Science degree in Commerce with a major in Accounting from Rider University in February 1983. We believe Mr. Brooks’ extensive accounting and finance background, and his executive experience at Senesco Technologies provide the requisite qualifications, skills, perspectives, and experiences to serve on our Board of Directors.
Steven D. Barnhart was appointed to the Board of Directors in October 2009. Mr. Barnhart is Chairman of our Nominating Committee and a member of our Audit and Compensation Committees. Mr. Barnhart’s current term as a Director expires at the 2012 annual shareholders’ meeting. Since January 2010, Mr. Barnhart has been Senior Vice President and Chief Financial Officer of Bally Total Fitness. Mr. Barnhart was Chief Executive Officer and President of Orbitz Worldwide from 2007 to January 2009, after holding other executive positions since 2003, when he joined the company. Prior to Orbitz Worldwide, he worked for PepsiCo and the Pepsi Bottling Group
from 1990 to 2003, where he was Finance Director for the Southeast Business Unit of the Pepsi Bottling Group, and also held other regional and strategic positions for PepsiCo and Frito-Lay. Mr. Barnhart received a Bachelor of Science degree in Economics in 1984 from the University of Chicago and a Masters in Business Administration in 1988 from the University of Chicago. Mr. Barnhart served on the Board of Directors of Orbitz Worldwide (NYSE: OWW) from July 2007 to January 2009. We believe Mr. Barnhart’s extensive executive experience and leadership skills, and prior public board experience provide the requisite qualifications, skills, perspectives, and experiences to serve on our Board of Directors.
Jack E. Price was appointed to the Board of Directors in October 2009. Mr. Price is Chairman of our Compensation Committee and a member of our Nominating Committee and Audit Committee. Mr. Price’s current term as a Director expires at the 2012 annual shareholders’ meeting. Mr. Price was President and Chief Executive Officer of NovaRay Medical Inc. from 2007 to March 2009. Prior to that, he was President and Chief Executive Officer of VSM MedTech Ltd. from 2003 to 2006, and was President and Division Chief Executive Officer of Philips Medical Systems, North America from 1996 to 2003, having joined Philips Medical Systems in 1993 as Vice President
and General Manager. He was also with General Electric Medical Systems from 1988 to1993, where he held Vice President and General Manager positions. Mr. Price received his undergraduate degree from the University of Oregon. Mr. Price is also Chairman of The Radiological Society of North America Board of Trustees. Mr. Price served on the Board of Directors of NovaRay Medical, Inc. from 2007 to 2009 and of Health Solutions Systems, Inc. from May 1, 2008 to March 2010. We believe Mr. Price’s extensive executive experience, leadership skills and prior public company board experience provide the requisite qualifications, skills, perspectives, and experiences to serve on our Board of Directors.
Bradley M. Tirpak joined the Board of Directors in February 2010. Mr. Tirpak is a member of our Nominating Committee. Mr. Tirpak’s current term as a Director expires at the 2012 annual shareholders’ meeting. Since 2008, Mr. Tirpak has been a self-employed investor who manages a portfolio of equities, fixed income and private equity investments. Mr. Tirpak also advises senior management and members of public company boards of directors on corporate governance, strategy and capital allocation. In 2008, Mr. Tirpak was a Senior Vice President at Chilton Investment Company in London. From 2003 to 2007, Mr. Tirpak was a Portfolio Manager at Sigma
Capital Management, managing a $200 million equity portfolio within a large multi-strategy investment fund, affiliated with S.A.C. Capital Advisors, L.P. From 2000 to 2003, Mr. Tirpak was a Portfolio Manager at Caxton Associates. From 1997 to 2000, Mr. Tirpak was an analyst and then Vice President at Credit Suisse First Boston. From 1993 to 1996 Mr. Tirpak was the founder and president of Access Telecom, Inc. and Grupo Access de Mexico S.A. de C.V., telecommunications companies. Mr. Tirpak holds a B.S.M.E. from Tufts University and an M.B.A. from Georgetown University. Pursuant to the Settlement Agreement dated February 4, 2010 between the Company, Shareholder Advocates for Value Enhancement (the “Committee”) and certain other parties, the Committee appointed Mr. Tirpak as its director nominee, and the Company agreed to nominate and recommend Mr. Tirpak for election to the
Board as a Class II Director with a term expiring at the 2012 annual shareholder’ meeting. Pursuant to the Settlement Agreement, the Company also agreed to appoint Mr. Tirpak, as the Committee’s nominee, to the Nominating Committee. In June 2011, the Nominating Committee informed Mr. Tirpak that he would not be nominated by the Company to serve as a Director for election at the 2012 annual shareholders’ meeting.
44
AUDIT COMMITTEE FINANCIAL EXPERT
The Board of Directors has a standing Audit Committee presently consisting of each of Mr. Brooks (Chairman), Mr. Barnhart and Mr. Price. Mr. Price was appointed as a member of the Audit Committee on July 8, 2011, and replaced Mr. Michel whose resignation was accepted by the Board of Directors on June 28, 2011. The Company’s Board of Directors has determined that Joel Brooks is the Audit Committee financial expert serving on the Audit Committee as defined by applicable SEC rules. The Board has also determined that Mr. Brooks is “independent” as such term is defined by applicable SEC rules.
CODE OF BUSINESS CONDUCT AND ETHICS
Our Board has adopted a Code of Ethics, which applies to all executive officers, directors and employees of the Company, including our Chief Executive Officer, Chief Operating Officer, Chief Financial Officer, and Controller. A copy of our Code of Business Conduct and Ethics is accessible on the Company’s website, www.usatech.com.
45
Compensation Discussion And Analysis
During the 2009 fiscal year, and through October 2009, our Compensation Committee consisted of Steven Katz and William Van Alen, Jr. Effective October 2009, our Compensation Committee consisted of Mr. Katz, Mr. Van Alen and Jack Price. Effective February 2010, our Compensation Committee consisted of Mr. Katz, Mr. Price and Peter Michel. Effective May 2010 and through June 28, 2011, our Compensation Committee was comprised of Jack Price, Steven Barnhart, and Peter Michel. Effective June 28, 2011, and through the date of this Form 10-K, the Compensation Committee consists of Messrs. Price and Barnhart. The Compensation Committee is responsible for reviewing and recommending compensation and compensation changes
for the executive officers of the Company. The compensation of the two other employees named in the Summary Compensation Table is determined by the executive officers. The Chief Executive Officer assists the Committee in determining the compensation of all other executive officers and the other executive officers do not have a role in determining their own compensation. Our Chief Executive Officer regularly provides information to the Compensation Committee. The Compensation Committee considers each component of executive compensation in light of total compensation. In considering adjustments to the total compensation of the executive officers, the Compensation Committee also considers the value of previous compensation. The Compensation Committee has retained a compensation consultant, as deemed necessary, to assist the Committee to make appropriate
recommendations regarding the executive officer’s compensation.
We have developed a compensation policy that is designed to attract and retain key executives responsible for our success and motivate management to enhance long-term shareholder value. The Compensation Committee believes that compensation of the Company’s executive officers should encourage creation of shareholder value and achievement of strategic corporate objectives and the Committee seeks to align the interests of the Company’s shareholders and management by integrating compensation with the Company’s annual and long-term corporate and financial objectives. We believe that providing our executive officers who have responsibility for the Company’s management and growth with an
opportunity to increase their ownership of Company stock aligns the interests of the executive officers with those of the shareholders. In furtherance thereof, in April 2011, the Board approved Stock Ownership Guidelines that were recommended by the Compensation Committee. These guidelines provide that the Chief Executive Officer should own shares with a value of at least three times his annual base salary, the Chief Operating Officer should own shares with a value of at least two times his annual base salary, and the Chief Financial Officer should own shares with a value of at least one time his annual base salary. The guidelines provide that the executive officers have a period of five years to attain these levels of ownership.
In order to be competitive with compensation offered by other companies in our custom peer group, as compiled by our compensation consultant, and to motivate and retain executive officers, the Company intends to offer a total compensation package competitive with other companies in our custom peer group as well as take into account individual responsibilities and performance. The annual compensation package for our executives primarily consists of:
|
|
●
|
a base salary;
|
|
|
●
|
stock options;
|
|
|
●
|
restricted stock awards;
|
|
|
●
|
cash and stock bonuses;
|
|
|
●
|
long-term stock incentive awards;
|
|
|
●
|
other benefits.
|
We believe that each of our executive officer’s performance during the 2011 fiscal year was excellent, and we attempted to appropriately reward each of these executives for such performance through, among other things, restricted stock awards and extensions of their employment contracts.
Base Salary
Base salary is the fixed component of our executive officer’s annual cash compensation and is set with the goal of attracting talented executives and adequately compensating and rewarding them for services rendered during the fiscal year. Our executive officers’ employment agreements specify the level of salary to which the officer is entitled, subject to review of our board of directors or Compensation Committee from time to time. During September 2008, and in connection with the execution of amendments to their employment agreements, we increased each of Messrs. Jensen’s and Herbert’s base salary by approximately twelve percent. Based upon other components of compensation received by them
subsequent to September 2008, primarily restricted stock awards and long term stock incentive awards, we have not increased these base salaries. Effective July 1, 2011, we increased Mr. DeMedio’s base salary approximately eighteen percent in order to for his base salary to more competitive with the base salaries of chief financial officers of the companies in our custom peer group as compiled by our compensation consultant. The base salaries of our executive officers reflect the individual’s level of responsibility and performance. In recommending base salaries of our executive officers to the board of directors, the Compensation Committee also considers changes in duties and responsibilities, our business and financial results, the relationship among base salaries paid to others within our Company, and its knowledge of base salaries paid to executive officers of our
custom peer group. The base salaries for each of Messrs. Sagady and Lawlor are set forth in their respective employment agreements, and were established by our President after discussions with each employee.
46
As set forth in their respective employment agreements, upon the termination of Mr. Jensen’s or Mr. Herbert’s employment under certain circumstances, including termination by them with good cause or by the Company without cause, the Company has agreed to pay them their base salary for a period of two years following termination of employment. We believe that these provisions are an important component of the executive’s employment arrangements.
Stock Options
Stock options serve to ensure that executive management is properly focused on shareholder value. Stock options align management incentives with shareholder’s objectives because options granted at fair value have value only if the stock price increases over time. A vesting schedule also keeps the executives focused on long term performance and not short term gains. No stock options have been issued to our executive officers or employees during the 2009, 2010, or 2011 fiscal years.
Restricted Stock Awards
During the 2009, 2010, and 2011 fiscal years, the Compensation Committee has recommended that restricted stock be awarded to our executive officers. These restricted stock awards become vested over a period of time, and are issued under the Company’s incentive stock compensation plans. During September 2008, and based upon past performance and in consideration of the execution of amendments to their employment agreements, we awarded an aggregate of 220,000 shares to our executive officers under our stock incentive plans. During September 2009, and in conjunction with the execution of their amended and restated employment agreements, we awarded an aggregate of 39,000 shares under our stock incentive plan as a
bonus to Messrs. Jensen and Herbert. During April 2011, and based upon past performance and in consideration of the extension of their employment agreements, we awarded an aggregate of 225,000 shares under our stock incentive plan to our executive officers. During September 2011, we issued 150,000 shares under our incentive stock plan to Mr. Jensen and 100,000 shares under our incentive stock plan to Mr. Herbert in exchange for the elimination of certain provisions in their employment agreements requiring the Company to pay excise taxes and related tax gross up payments in connection with excess parachute payments in the event of a change in control of the Company. The Compensation Committee as well as the executive officers believed that these provisions were no longer appropriate given current compensation practices and represented good corporate governance. During September 2011, we
issued 25,000 shares under our incentive stock plan to Mr. DeMedio as a bonus for performance during the last six months of the 2011 fiscal year.
Cash and Stock Bonuses
In addition to base salary, we may award variable cash bonus awards to our executives as well as shares available under our incentive stock compensation plans.
EXECUTIVE COMPENSATION
On September 15, 2011, at the recommendation of the Compensation Committee, the board of directors adopted the Fiscal Year 2012 Performance Share Plan (the “2012 Plan”) covering the Company’s executive officers – Messrs. Jensen, Herbert and DeMedio. Under the 2012 Plan, each executive officer will be awarded common stock in the event the Company achieves target goals during the fiscal year ending June 30, 2012 relating to the total number of connections, total revenues, operating expenses, and operating earnings. Operating earnings is defined as earnings before interest and taxes (after bonus accruals and stock awards) and before non-operating gains or losses. The number of
eligible shares to be awarded to the executives is based upon the following weightings: 30% by the total number of connections; 30% by total revenues; 10% by operating expenses; and 30% by operating earnings. No awards would be made under the 2012 Plan if either (i) none of the minimum, threshold performance target goals have been achieved, or (ii) if operating earnings for the 2012 fiscal year are not equal or better than those during the 2011 fiscal year.
If all of the target performance goals are achieved, the executive officers would be awarded the following number of shares: Mr. Jensen- 225,000 shares; Mr. Herbert – 120,000 shares; and Mr. DeMedio – 50,000 shares. If all of the minimum, threshold performance target goals are achieved, the executive officers would be awarded 20% of the number of shares which would have been awarded to them if all of the target performance goals had been achieved. If all of the maximum, distinguished performance target goals are achieved, the executive officers would be awarded 150% of the number of shares which would have been awarded to them if all of the target performance goals had been achieved. If the
actual results for the fiscal year are less than the target goals (but greater than the minimum, threshold performance target goals), each executive would be awarded a lesser pro rata portion of the number of eligible shares.
In the event of the occurrence of a USA Transaction during the fiscal year, and provided that the executive is an employee of USA on the date of such USA Transaction, the Plan shall be terminated and each executive shall be awarded shares as of the date of such USA Transaction as if all of the target performance goals had been met. In the event that the executive’s employment with the Company is terminated by the Company for cause during the fiscal year, or if the executive resigns his employment for any reason other than for good reason during the fiscal year, then the executive shall not be entitled to earn any award under the 2012 Plan. In the event that the executive’s employment with the Company
shall be terminated by the Company during the fiscal year for any reason whatsoever other than for cause, or if the executive’s employment is terminated by the executive for good reason during the fiscal year, then the executive shall be awarded shares as if all of the target performance goals had been meet. If the executive’s employment is terminated during the fiscal year as a result of death or disability, the executive shall nevertheless be eligible to earn shares under the 2012 Plan as if he had remained employed with the Company through the end of the fiscal year.
Notwithstanding the above description of the 2012 Plan, the executives would receive shares from the Company pursuant to the 2012 Plan only if and to the extent that shares would be available to be issued to the executives under the existing 2011 stock incentive plan or another stock plan that has been approved by the shareholders of the Company in accordance with NASDAQ Listing Rule 5635(c). If there would not be a sufficient number of shares available to be issued to the executives, the Company would pay to the executives an amount of cash equal to the value of those shares not available to be issued to the executives. In such event, the executives would be required to utilize the cash payment, net of any
withholding, payroll or other taxes attributable to the cash payment, to purchase shares of common stock of the Company on the open market.
47
Long-Term Stock Incentive Awards
During February 2007, at the recommendation of the Compensation Committee, the board of directors adopted the LTIP Program covering the Company’s executive officers – Messrs. Jensen, Herbert and DeMedio. The purpose of the LTIP Program was to ensure continuity of the Company’s executives, encourage stock ownership by the executives, align the interests of the executives with those of the shareholders, and provide incentives and rewards to the executives who are largely responsible for the management and growth of the Company. The LTIP Program expired on June 30, 2010.
Under the LTIP Program, each executive officer was awarded common stock of the Company in the event the Company achieved target goals relating to each of revenues, GP and EBITDA during each of the fiscal years ended June 30, 2007, June 30, 2008, and June 30, 2010. EBITDA is defined as earnings before interest, taxes, depreciation, and amortization, and excludes non-cash stock payments/awards and stock options granted to officers and members of the board of directors. During each such fiscal year, the number of eligible shares to be awarded to the executive was based upon the following weightings: 40% of eligible shares was determined by revenues; 30% of eligible shares was determined by GP; and 30%
of eligible shares was determined by EBITDA.
If the target goal (100%) for revenues, GP, and EBITDA was achieved by the Company during the applicable fiscal year, the executive officers would be awarded the following number of shares: Mr. Jensen – 178,570 shares; Mr. Herbert – 53,713 shares; and Mr. DeMedio – 21,664 shares.
If actual revenues, GP, or EBITDA for a particular fiscal year exceeded the target goals, each executive would be awarded additional eligible shares, up to an amount no greater than 125% of the number of eligible shares. If the actual revenues, GP, or EBITDA for a particular fiscal year were less than the target goals, each executive would be awarded a lesser pro rata portion of the number of eligible shares. If minimum target goals for revenues, GP, or EBITDA for a particular fiscal year were not achieved, no eligible shares would be awarded to each executive.
Based upon the financial results of the Company for the fiscal year ended June 30, 2010, a lower than target goal (85%) relating to revenues was met and the minimum target goals relating to GP and EBITDA were not met. As a result, the Company issued to the executive officers of a total of 86,342 shares under the LTIP Program for the 2010 fiscal year, as follows: Mr. Jensen-60,716 shares; Mr. Herbert- 18,261 shares; and Mr. DeMedio- 7,365 shares.
Other Benefits
During the 2009, 2010 and 2011 fiscal years, our executive officers were entitled to the health care coverage, group insurance and other employee benefits provided to all of our employees. During these fiscal years, and pursuant to their employment agreements, we maintained an automobile allowance payment program for each of our executive officers as well as for Messrs. Sagady and Lawlor. As required under their employment agreements, we agreed to pay the premiums for a $2,000,000 face amount life insurance policy on Mr. Jensen and for a $1,500,000 face amount life insurance policy on Mr. Herbert. We also agreed to pay the premiums for a supplemental long-term disability policy for each of Messrs. Jensen
and Herbert over and above the existing long-term group disability plan of the Company. We agreed to pay the premiums for a $750,000 face amount life insurance policy on Mr. DeMedio and for a supplemental long-term disability policy for Mr. DeMedio over and above the existing long-term group disability plan of the Company.
As discussed elsewhere in this Form 10-K, the Company has agreed to pay for health insurance, life insurance, and disability insurance benefits for a two year period following Mr. Jensen’s and Mr. Herbert’s termination of employment under certain circumstances, including termination by them for good reason or by the Company without cause, and to pay health insurance for a one year period following Mr. DeMedio’s termination of employment by the Company without cause.
Impact of Taxation and Accounting Considerations on Executive Compensation
The Compensation Committee and the Board of Directors take into account tax and accounting consequences of the compensation program and weigh these factors when setting total compensation and determining the individual elements of any executive officer’s compensation package.
The restricted stock awards to our executive officers under our incentive stock plans or under the 2012 Plan provide that the executive is responsible for any withholding or payroll tax obligations incurred by the Company in connection with the award, and the executive may satisfy any such obligations by either the delivery to the Company of a cash payment equal to the obligations, or the assignment or transfer to the Company of shares having a value equal to the obligations, or such other method that shall be satisfactory to the Company.
In order to have any benefits payable to the executive officers under their supplemental long term disability policies not be included in their taxable income, the Compensation Committee recommended to the Board of Directors that the premiums therefore should be included in their wages from the Company, and such a change was included in each of their September 2011 employment contract revisions.
48
COMPENSATION COMMITTEE REPORT
The following “Compensation Committee Report” shall not be deemed incorporated by reference into any filing under the Securities Act of 1933, as amended, or under the Securities Exchange Act of 1934, as amended, except to the extent that the Company specifically incorporates this information by reference, and shall not otherwise be deemed filed under such Acts.
The Compensation Committee reviewed the above Compensation Discussion and Analysis and discussed its contents with Company management. Based on the review and discussions, the Committee has recommended to the Board of Directors that this Compensation Discussion and Analysis be included in the Form 10-K for the fiscal year ended June 30, 2011.
Respectfully submitted:
Jack E. Price, Chairman
Steven D. Barnhart
49
Summary Compensation Table
The following table sets forth certain information with respect to compensation paid or accrued by the Company during the fiscal years ended June 30, 2011, June 30, 2010 and June 30, 2009 to each of the executive officers and employees of the Company named below:
|
Non-
|
Nonqualified
|
|||||||||||||||||||||||||||||||||
|
Equity
|
Deferred
|
|||||||||||||||||||||||||||||||||
|
Incentive
|
Compen-
|
|||||||||||||||||||||||||||||||||
|
Name and
|
Stock
|
Option
|
Plan
|
sation
|
All Other
|
|||||||||||||||||||||||||||||
|
Principal
|
Fiscal
|
Bonus
|
Awards
|
Awards
|
Compensation
|
Earnings
|
Compenation
|
Total
|
||||||||||||||||||||||||||
|
Position
|
Year
|
Salary
|
($)(1)
|
($)(2)
|
($)(2)
|
($)
|
($)
|
($)(3)
|
($)
|
|||||||||||||||||||||||||
|
(a)
|
(b)
|
($)(c)
|
(d)
|
(e)
|
(f)
|
(g)
|
(h)
|
(i)
|
(j)
|
|||||||||||||||||||||||||
|
George R. Jensen, Jr.
|
2011
|
$ | 365,000 | $ | - | $ | 293,750 | $ | - | $ | - | $ | - | $ | 31,137 | $ | 689,887 | |||||||||||||||||
|
Chief Executive Officer
|
2010
|
$ | 365,000 | $ | - | $ | 52,500 | $ | - | $ | - | $ | - | $ | 38,675 | $ | 456,175 | |||||||||||||||||
|
& Chairman of the Board
|
2009
|
$ | 354,231 | $ | - | $ | 488,400 | $ | - | $ | - | $ | - | $ | 27,075 | $ | 869,706 | |||||||||||||||||
|
Stephen P. Herbert
|
2011
|
$ | 320,000 | $ | - | $ | 176,250 | $ | - | $ | - | $ | - | $ | 24,874 | $ | 521,124 | |||||||||||||||||
|
Chief Operating Officer
|
2010
|
$ | 320,000 | $ | - | $ | 15,750 | $ | - | $ | - | $ | - | $ | 32,412 | $ | 368,162 | |||||||||||||||||
|
& President
|
2009
|
$ | 310,577 | $ | - | $ | 377,400 | $ | - | $ | - | $ | - | $ | 27,075 | $ | 715,052 | |||||||||||||||||
|
David M. DeMedio
|
2011
|
$ | 195,000 | $ | - | $ | 58,750 | $ | - | $ | - | $ | - | $ | 19,175 | $ | 272,925 | |||||||||||||||||
|
Chief Financial Officer
|
2010
|
$ | 195,000 | $ | - | $ | - | $ | - | $ | - | $ | - | $ | 28,941 | $ | 223,941 | |||||||||||||||||
|
2009
|
$ | 195,000 | $ | - | $ | 111,000 | $ | - | $ | - | $ | - | $ | 26,352 | $ | 332,352 | ||||||||||||||||||
|
Cary Sagady
|
2011
|
$ | 188,606 | $ | 88,689 | $ | - | $ | - | $ | - | $ | - | $ | 10,444 | $ | 287,739 | |||||||||||||||||
|
Sr. VP Product Management &
|
2010
|
$ | 185,000 | $ | 13,209 | $ | - | $ | - | $ | - | $ | - | $ | 15,997 | $ | 214,206 | |||||||||||||||||
|
Network Solutions
|
2009
|
$ | 187,084 | $ | 29,839 | $ | 79,753 | $ | - | $ | - | $ | - | $ | 17,000 | $ | 313,676 | |||||||||||||||||
|
Michael Lawlor
|
2011
|
$ | 166,077 | $ | 148,170 | $ | - | $ | - | $ | - | $ | - | $ | 10,283 | $ | 324,530 | |||||||||||||||||
|
VP of Sales & Business
|
2010
|
$ | - | $ | - | $ | - | $ | - | $ | - | $ | - | $ | - | $ | - | |||||||||||||||||
|
Development
|
2009
|
$ | - | $ | - | $ | - | $ | - | $ | - | $ | - | $ | - | $ | - | |||||||||||||||||
|
(1)
|
Represents cash bonuses paid based upon such person’s performance during the fiscal year.
|
|
(2)
|
Represents the grant date fair value of awards computed in accordance with stock-based compensation accounting rules (FASB ASC Topic 718). A discussion of assumptions used in calculating award values is included in Note 11 of the Consolidated Financial Statements.
|
50
|
(3)
|
The following table shows each component of the column above titled “All Other Compensation.”
|
|
Company
|
Long-term
|
|||||||||||||||||||||
| 401(k) |
Disability
|
Life
|
||||||||||||||||||||
|
Matching
|
Insurance
|
Insurance
|
Auto
|
|||||||||||||||||||
|
Contributions
|
Premiums
|
Premiums
|
Allowance
|
Total
|
||||||||||||||||||
|
Name and Principal Position
|
Fiscal Year
|
($)
|
($)
|
($)
|
($)
|
($)
|
||||||||||||||||
|
George R. Jensen, Jr.
|
2011
|
$ | 2,262 | $ | 5,445 | $ | 5,555 | $ | 17,875 | $ | 31,137 | |||||||||||
|
Chief Executive Officer
|
2010
|
$ | 9,800 | $ | 5,445 | $ | 5,555 | $ | 17,875 | $ | 38,675 | |||||||||||
|
& Chairman of the Board
|
2009
|
$ | 9,200 | $ | - | $ | - | $ | 17,875 | $ | 27,075 | |||||||||||
|
Stephen P. Herbert
|
2011
|
$ | 2,262 | $ | 3,352 | $ | 1,385 | $ | 17,875 | $ | 24,874 | |||||||||||
|
Chief Operating Officer
|
2010
|
$ | 9,800 | $ | 3,352 | $ | 1,385 | $ | 17,875 | $ | 32,412 | |||||||||||
|
& President
|
2009
|
$ | 9,200 | $ | - | $ | - | $ | 17,875 | $ | 27,075 | |||||||||||
|
David M. DeMedio
|
2011
|
$ | - | $ | 985 | $ | 315 | $ | 17,875 | $ | 19,175 | |||||||||||
|
Chief Financial Officer
|
2010
|
$ | 9,800 | $ | 951 | $ | 315 | $ | 17,875 | $ | 28,941 | |||||||||||
|
2009
|
$ | 8,477 | $ | - | $ | - | $ | 17,875 | $ | 26,352 | ||||||||||||
|
Cary Sagady
|
2011
|
$ | 1,708 | $ | 732 | $ | 204 | $ | 7,800 | $ | 10,444 | |||||||||||
|
Sr. VP Network Solutions
|
2010
|
$ | 8,073 | $ | - | $ | 124 | $ | 7,800 | $ | 15,997 | |||||||||||
|
2009
|
$ | 9,200 | $ | - | $ | - | $ | 7,800 | $ | 17,000 | ||||||||||||
|
Michael Lawlor
|
2011
|
$ | 1,547 | $ | 732 | $ | 204 | $ | 7,800 | $ | 10,283 | |||||||||||
|
VP of Sales & Business
|
2010
|
$ | - | $ | - | $ | - | $ | - | $ | - | |||||||||||
|
Development
|
2009
|
$ | - | $ | - | $ | - | $ | - | $ | - | |||||||||||
Grants Of Plan-Based Awards Table
The table below summarizes the amounts of awards granted to our named executive officers and employees during the fiscal year ended June 30, 2011:
|
Estimated Future Payouts Under Non-Equity Incentive Plan Awards
|
Estimated Future Payouts Under Equity Incentive Plan Awards
|
All Other Stock Awards: Number of Shares of Stock or
|
All Other Option Awards: Number of Securities Underlying
|
Exercise or Base Price of Option
|
Grant Date Fair Value of Stock and Option (1)
|
|||||||||||||||||||||||||||
|
Grant
|
||||||||||||||||||||||||||||||||
|
Name
|
Date
|
Threshold
|
Target
|
Maximum
|
Threshold
|
Target
|
Maximum
|
Units
|
Options
|
Awards
|
Awards
|
|||||||||||||||||||||
|
(a)
|
(b)
|
($)(c)
|
($)(d)
|
($)(e)
|
($)(f)
|
($)(g)
|
($)(h)
|
(#)(i) | (#)(j) |
($)(k)
|
($)(l)
|
|||||||||||||||||||||
|
George R. Jensen, Jr.
|
4/14/2011
|
- | - | - | 125,000 | $ | 293,750 | |||||||||||||||||||||||||
|
Stephen P. Herbert
|
4/14/2011
|
- | - | - | 75,000 | $ | 176,250 | |||||||||||||||||||||||||
|
David M. DeMedio
|
4/14/2011
|
- | - | - | 25,000 | $ | 58,750 | |||||||||||||||||||||||||
|
Cary Sagady
|
- | - | - | - | $ | - | ||||||||||||||||||||||||||
|
Michael Lawlor
|
- | - | - | - | $ | - | ||||||||||||||||||||||||||
(1) Amount represents the grant date fair value determined in accordance with ASC 718.
51
Total Option Exercises And Stock Vested
The following table sets forth information regarding options exercised and shares of common stock acquired upon vesting by our named executive officers and employees during the fiscal year ended June 30, 2011:
|
Option Awards
|
Stock Awards
|
|||||||||||||||
|
Number of
|
Number of
|
Value
|
||||||||||||||
|
Shares
|
Value
|
Shares
|
Realized on
|
|||||||||||||
|
Acquired on
|
Realized on
|
Acquired on
|
Vesting
|
|||||||||||||
|
Name
|
Exercise (#)
|
Exercise ($)
|
Vesting (#)
|
($)(1)
|
||||||||||||
|
(a)
|
(b)
|
(c)
|
(d)
|
(e)
|
||||||||||||
|
George R. Jensen, Jr.(2)
|
- | $ | - | 112,382 | $ | 178,624 | ||||||||||
|
Stephen P. Herbert(3)
|
- | $ | - | 46,261 | $ | 83,015 | ||||||||||
|
David M. DeMedio(4)
|
- | $ | - | 15,699 | $ | 27,907 | ||||||||||
|
Cary Sagady
|
- | $ | - | - | $ | - | ||||||||||
|
Michael Lawlor(5)
|
- | $ | - | 10,000 | $ | 24,800 | ||||||||||
|
(1)
|
For awards classified as equity, the value equals number of shares multiplied by the market value on the vesting date. For awards classified as liabilities, the value equals the number of shares multiplied by the market value on the settlement date.
|
|
(2)
|
Represents 10,000 shares valued at $1.21 per share that vested on October 1, 2010, 60,716 shares valued at $1.13 per share that were issued on October 7, 2010 and 41,666 shares valued at $2.35 per share that vested on April 14, 2011.
|
|
(3)
|
Represents 3,000 shares valued at $1.21 per share that vested on October 1, 2010, 18,261 shares valued at $1.13 per share that were issued on October 7, 2010 and 25,000 shares valued at $2.35 that vested on April 14, 2011.
|
|
(4)
|
Represents 7,365 shares valued at $1.13 per share that were issued on October 7, 2010 and 8,334 shares valued at $2.35 per share that vested on April 14, 2011.
|
|
(5)
|
Represents shares valued at $2.48 per share that vested on April 1, 2011.
|
52
Outstanding Equity Awards At Fiscal Year-End
The following table shows information regarding unexercised stock options and unvested equity awards granted to the executive officers as of the fiscal year ended June 30, 2011:
|
Option Awards
|
Stock Awards
|
||||||||||||||||||||||||||||||||
|
Name
|
Number of
Securities
Underlying
Unexercised
Options(#)
Exercisable
|
Number of
Securities
Underlying
Unexercised
Options(#)
Unexercisable
|
Equity Incentive
Plan
Awards:
Number of
Securities
Underlying
Unexercised
Unearned
Options(#)
|
Option Exercise
Price($)
|
Option Expiration
Date
|
Number of
Shares or
Units of
Stock That
Have Not
Vested
|
Market
Value of
Shares or
Units of
Stock That
Have Not
Vested($)
|
Equity
Incentive
Plan Awards:
Number of
Unearned
Shares, Units
or Other
Rights That
Have Not
Vested(#)
|
Equity Incentive
Plan Awards:
Market or
Payout Value
of Unearned
Shares, Units
or Other
Rights That
Have Not
Vested($)
|
||||||||||||||||||||||||
|
(a)
|
(b)
|
(c)
|
(d)
|
(e)
|
(f)
|
(#)(g) |
(h)
|
(i)
|
(j)
|
||||||||||||||||||||||||
|
George R. Jensen, Jr., Chief
Executive Officer &
Chairman of the Board (1)
|
- | - | - | $ | - | 223,334 | 495,801 | - | $ | - | |||||||||||||||||||||||
| 25,000 | - | - | $ | 7.50 |
6/28/2012
|
- | - | - | $ | - | |||||||||||||||||||||||
| 25,000 | - | - | $ | 7.50 |
6/29/2013
|
- | - | - | $ | - | |||||||||||||||||||||||
|
Stephen P. Herbert, Chief
Operating Officer &
President (2)
|
- | - | - | $ | - | 50,000 | 111,000 | - | $ | - | |||||||||||||||||||||||
| 6,000 | - | - | $ | 7.50 |
6/28/2012
|
- | - | - | $ | - | |||||||||||||||||||||||
| 6,000 | - | - | $ | 7.50 |
6/29/2013
|
- | - | - | $ | - | |||||||||||||||||||||||
|
David M. DeMedio, Chief
Financial Officer (3)
|
- | - | - | $ | - | 16,666 | 36,999 | - | $ | - | |||||||||||||||||||||||
| 2,333 | - | - | $ | 7.50 |
6/28/2012
|
- | - | - | $ | - | |||||||||||||||||||||||
| 2,333 | - | - | $ | 7.50 |
6/29/2013
|
- | - | - | $ | - | |||||||||||||||||||||||
|
(1)
|
Reflects shares issued to Mr. Jensen under his employment agreement –41,667 shares that vest on April 14, 2012, 41,667 shares that vest on April 14, 2013 and 140,000 shares only issuable upon the occurrence of a USA Transaction. The closing market price on June 30, 2011, or $2.22 per share, was used in the calculation of market value (column (h)). The options expiring on June 28, 2012 and June 29, 2013 vested on June 30, 2007 and June 29, 2008, respectively.
|
|
(2)
|
Reflects shares issued to Mr. Herbert under his employment agreement – 25,000 shares that to vest on April 14, 2012 and 25,000 shares that vest on April 14, 2013. The closing market price on June 30, 2011, or $2.22 per share, was used in the calculation of market value (column (h)). The options expiring on June 28, 2012 and June 29, 2013 vested on June 30, 2007 and June 29, 2008, respectively.
|
|
(3)
|
Reflects shares issued to Mr. DeMedio under his employment agreement – 8,333 shares that vest on April 14, 2012 and 8,333 shares that vest on April 14, 2013. The closing market price on June 30, 2011, or $2.22 per share, was used in the calculation of market value (column (h)). The options expiring on June 28, 2012 and June 29, 2013 vested on June 30, 2007 and June 29, 2008, respectively.
|
Executive Employment Agreements
George R. Jensen, Jr.
On September 24, 2009, Mr. Jensen and the Company entered into an Amended and Restated Employment Agreement which replaced his prior employment agreement. The Agreement extended the term of Mr. Jensen’s employment with the Company from June 30, 2011 until September 30, 2012, and will automatically continue from year to year thereafter unless terminated as of the end of the original term or any such one year renewal period by the Company or Mr. Jensen by at least 90-days notice., Mr. Jensen was granted 30,000 shares of common stock under the 2008 Stock Incentive Plan which vested as follows: 10,000 on October 1, 2009; 10,000 on April 1, 2010; and 10,000 on September 30, 2010.
53
The agreement continued Mr. Jensen’s base salary at $365,000 per annum. The agreement requires Mr. Jensen to devote his full time and attention to the business and affairs of the Company, and obligates him not to engage in any investments or activities which would compete with the Company during the term of the agreement and for a period of two years thereafter. The Company has agreed to obtain and pay the premiums for a term life insurance policy in the amount of $2,000,000 on the life of Mr. Jensen while he is employed by the Company. Mr. Jensen has the right to designate the beneficiary of the policy. The Company has agreed to obtain and pay the premiums for a supplemental long term disability policy
covering Mr. Jensen over and above the existing long-term group disability plan of the Company. If he shall become disabled while employed by the Company, the policy would provide for monthly disability coverage of up to 65% of his monthly base compensation payable to age 65 or death. If the policy would not provide at least 65% of his monthly base salary, then the Company has agreed to make monthly payments to Mr. Jensen in an amount equal to the difference between the monthly benefit provided under such policy and 65% of Mr. Jensen’s monthly base salary; provided, however, that the Company’s total obligation for such monthly payments shall not exceed $110,000.
The agreement also provides that if Mr. Jensen would terminate his employment with the Company for good reason (as defined in the agreement), or if the Company would terminate his employment without cause (as defined in the agreement), then the Company would pay to him a lump sum equal to two times his base salary on or before the termination of his employment and all unvested restricted stock awards and stock options would immediately become vested. In addition, upon any such termination of Mr. Jensen’s employment, the Company has agreed, at its cost, for a period of two years, to continue to provide Mr. Jensen with health, life and disability benefits substantially similar to those which he had been
receiving immediately prior to the date of termination. The term good reason as defined in the agreement, includes: (A) a material breach of the terms of the Agreement by the Company; (B) the assignment by the Company to Mr. Jensen of duties in any way materially inconsistent with his authorities, duties, responsibilities, and status, as the Chief Executive Officer of the Company, or a material reduction or alteration in the nature or status of his authority, duties, or responsibilities; (C) the Company reduces Mr. Jensen’s annual base salary; or (D) a material reduction by the Company in the kind or level of employee benefits to which Mr. Jensen is entitled immediately prior to such reduction with the result that his overall benefit package is significantly reduced unless such failure to continue a plan, policy, practice or arrangement pertains to all plan participants generally.
As a condition to Mr. Jensen receiving any payments or benefits upon his termination of his employment for good reason, Mr. Jensen shall have executed and delivered (and not revoked) a release of any and all claims, suits, or causes of action against the Company and its affiliates in form reasonably acceptable to the Company.
The agreement also provides that as a condition of the consummation of a USA Transaction (as defined below), the successor to the Company’s business or assets would agree to assume and perform Mr. Jensen’s employment agreement. If any such successor would not do so, Mr. Jensen’s employment would terminate on the date of the consummation of the USA Transaction, and the Company would pay to Mr. Jensen a lump sum equal to two times his base salary on or before the termination of his employment, all unvested restricted stock awards and stock options would become immediately vested, and, at its cost, for a period of two years would continue to provide Mr. Jensen with health, life and disability
benefits substantially similar to those which he is receiving immediately prior to the date of termination.
The agreement also provides that upon the occurrence of a USA Transaction, the Company will issue to Mr. Jensen 140,000 shares of common stock subject to adjustment for stock splits or combinations (the “Jensen Shares”). Mr. Jensen is not required to pay any additional consideration for the Jensen Shares. At the time of any USA Transaction, all of the Jensen Shares are automatically deemed to be issued and outstanding immediately prior to any USA Transaction, and are entitled to be treated as any other issued and outstanding shares of common stock in connection with such USA Transaction. The Jensen Shares are irrevocable and fully vested, represent an unconditional obligation of the Company, and will
not be affected by the termination of Mr. Jensen’s employment with the Company for any reason whatsoever.
The term USA Transaction is defined as (i) the acquisition of fifty-one percent or more of the then outstanding voting securities entitled to vote generally in the election of Directors of the Company by any person, entity or group, or (ii) the approval by the shareholders of the Company of a reorganization, merger, consolidation, liquidation, or dissolution of the Company, or the sale, transfer, lease or other disposition of all or substantially all of the assets of the Company, or (iii) a change in the composition of the Board of Directors of the Company over a period of twelve (12) months or less such that the continuing directors fail to constitute a majority of the Board.
On April 14, 2011, the Company and Mr. Jensen entered into an amendment to the employment agreement. The amendment extended the term of Mr. Jensen’s employment with the Company from September 30, 2012 until June 30, 2014. In connection with the amendment, and in recognition of his dedicated and valuable service to the Company and extending the term of his employment agreement, Mr. Jensen was issued 125,000 shares of common stock under the 2010 Stock Incentive Plan which vest as follows: 41,666 on April 14, 2011; 41,667 on April 14, 2012; and 41,667 on April 14, 2013.
On September 27, 2011, the Company and Mr. Jensen entered into an amended and restated employment agreement, as well as the Jensen Stock Agreement described below. The new employment agreement continued substantially all of the previous terms and conditions of his prior employment agreement other than the provisions related to the Jensen Shares. The new agreement did not continue the provisions of his prior agreement which obligated the Company to pay any excise taxes attributable to any excess parachute payments which would be received by Mr. Jensen upon the occurrence of a USA Transaction as well as the Company’s related obligation to make
tax gross up payments. The new agreement also stated that the premiums for Mr. Jensen’s supplemental long term disability policy being paid by the Company would now be included in his wages and be taxable to him. In exchange for modifying the excise tax and related gross up provisions, the Company issued an aggregate of 150,000 shares of common stock to Mr. Jensen under its stock incentive plans which vest as follows: 50,000 on the date the agreement was signed by Mr. Jensen and the Company; 50,000 on the first anniversary of the date of signing; and 50,000 on the second anniversary of the date of signing.
54
On September 27, 2011, the Company and Mr. Jensen also entered into a new agreement (the “Jensen Stock Agreement”) which contained the provisions relating to the issuance by the Company to Mr. Jensen of the Jensen Shares which had previously been set forth in his employment agreement. The provisions of Mr. Jensen’s prior employment agreement which required the Company to pay any excise taxes attributable to the excess parachute payments attributable to the Jensen Shares as well as the related obligation to make tax gross up payments have been retained in the Jensen Stock Agreement and continue to apply to the Jensen Shares.
Stephen P. Herbert
On September 24, 2009, Mr. Herbert and the Company entered into an Amended and Restated Employment Agreement which replaced his prior employment agreement. The Agreement extended the term of Mr. Herbert’s employment with the Company from June 30, 2011 until September 30, 2012, and will automatically continue from year to year thereafter unless terminated as of the end of the original term or any such one year renewal period by the Company or Mr. Herbert by at least 90-days notice and Mr. Herbert was granted 9,000 shares of common stock under the 2008 Stock Incentive Plan which vested as follows: 3,000 on October 1, 2009; 3,000 on April 1, 2010; and 3,000 on September 30, 2010.
The agreement continued Mr. Herbert’s base salary at $320,000 per annum. The agreement requires Mr. Herbert to devote his full time and attention to the business and affairs of the Company, and obligates him not to engage in any investments or activities which would compete with the Company during the term of the agreement and for a period of two years thereafter. The Company has agreed to obtain and pay the premiums for a term life insurance policy in the amount of $1,500,000 on the life of Mr. Herbert while he is employed by the Company. Mr. Herbert has the right to designate the beneficiary of the policy. The Company has agreed to obtain and pay the premiums for a supplemental long term disability policy
covering Mr. Herbert over and above the existing long-term group disability plan of the Company. If he shall become disabled while employed by the Company, the policy would provide for monthly disability coverage of up to 65% of his monthly base compensation payable to age 65 or death.
The agreement also provides that if Mr. Herbert would terminate his employment with the Company for good reason (as defined in the agreement), or if the Company would terminate his employment without cause (as defined in the agreement), then the Company would pay to him a lump sum equal to two times his base salary on or before the termination of his employment and all unvested restricted stock awards and stock options would become immediately vested. In addition, upon any such termination of Mr. Herbert’s employment, the Company has agreed, at its cost, for a period of two years, to continue to provide Mr. Herbert with health, life and disability benefits substantially similar to those which he had been
receiving immediately prior to the date of termination. The term good reason as defined in the agreement, includes: (A) a material breach of the terms of the agreement by the Company; (B) the assignment by the Company to Mr. Herbert of duties in any way materially inconsistent with his authorities, duties, or responsibilities, or a material reduction or alteration in the nature or status of his authority, duties, or responsibilities as the President of the Company; (C) the Company reduces Mr. Herbert’s annual base salary; or (D) a material reduction by the Company in the kind or level of employee benefits to which Mr. Herbert is entitled immediately prior to such reduction with the result that his overall benefit package is significantly reduced unless such failure to continue a plan, policy, practice or arrangement pertains to all plan participants generally. As a condition to
Mr. Herbert receiving any payments or benefits upon his termination of his employment for good reason, Mr. Herbert shall have executed and delivered (and not revoked) a release of any and all claims, suits, or causes of action against the Company and its affiliates in form reasonably acceptable to the Company.
The agreement also provides that as a condition of the consummation of a USA Transaction (as defined in the agreement), the successor to the Company’s business or assets would agree to assume and perform Mr. Herbert’s employment agreement. If any such successor would not do so, Mr. Herbert’s employment would terminate on the date of consummation of the USA Transaction, and the Company would pay to Mr. Herbert a lump sum equal to two times his base salary on or before the termination of his employment, all unvested restricted stock awards and stock options would become immediately vested, and, at its cost, for a period of two years would continue to provide Mr. Herbert with health, life and
disability benefits substantially similar to those which he is receiving immediately prior to the date of termination.
On April 14, 2011, the Company and Mr. Herbert entered into an amendment to the employment agreement. The amendment extended the term of Mr. Herbert’s employment with the Company from September 30, 2012 until June 30, 2014. In connection with the amendment, and in recognition of his dedicated and valuable service to the Company and extending the term of his employment agreement, Mr. Herbert was issued 75,000 shares of common stock under the 2010 Stock Incentive Plan which vest as follows: 25,000 on April 14, 2011; 25,000 on April 14, 2012; and 25,000 on April 14, 2013.
On September 27, 2011, the Company and Mr. Herbert entered into a second amendment to his employment agreement. The amendment eliminated the provisions of his prior agreement which obligated the Company to pay any excise taxes attributable to any excess parachute payments which would be received by Mr. Herbert upon the occurrence of a USA Transaction as well as the Company’s related obligation to make tax gross up payments. The new agreement also stated that the premiums for Mr. Herbert’s supplemental long term disability policy being paid by the Company would now be included in his wages and be taxable to him. In exchange for
eliminating the excise tax and related gross up provisions, the Company issued an aggregate of 100,000 shares of common stock to Mr. Herbert under its stock incentive plans which vest as follows: 33,333 on the date the agreement was signed by Mr. Herbert and the Company; 33,333 on the first anniversary of the date of signing; and 33,334 on the second anniversary of the date of signing.
55
David M. DeMedio
On April 12, 2005, Mr. DeMedio and the Company entered into an employment agreement pursuant to which he was employed as the Chief Financial Officer of the Company. The term of the agreement is for one year and will automatically continue from year to year thereafter unless terminated as of the end of the original term or any such one year renewal period by the Company or Mr. DeMedio by at least 90-days notice. The agreement requires Mr. DeMedio to devote his full time and attention to the business and affairs of the Company, and obligates him not to engage in any investments or activities which would compete with the Company during the term of the agreement and for a period of one year thereafter. In the event
that a USA Transaction (as defined in Mr. Jensen’s employment agreement) shall occur, then Mr. DeMedio has the right to terminate his agreement upon 30 days notice to the Company.
During September 2008, Mr. DeMedio and the Company entered into an amendment to his employment agreement pursuant to which he was granted 25,000 shares of common stock under the 2008 Stock Incentive Plan which vested as follows: 8,000 on September 15, 2008; 8,000 on January 15, 2009; and 9,000 on June 30, 2009.
On September 24, 2009, the Company agreed to obtain and pay the premiums for a term life insurance policy in the amount of $750,000 on the life of Mr. DeMedio while he is employed by the Company. Mr. DeMedio has the right to designate the beneficiary of the policy. The Company has agreed to obtain and pay the premiums for a supplemental long term disability policy covering Mr. DeMedio over and above the existing long-term group disability plan of the Company. If he shall become disabled while employed by the Company, the policy would provide for monthly disability coverage of up to 65% of his monthly base compensation payable to age 65 or death. If Mr. DeMedio’s employment with the Company would be
terminated without cause, the Company has agreed, at its cost, to continue to provide Mr. DeMedio with health insurance benefits substantially similar to those which he is receiving immediately prior to the date of termination for a one year period following such termination.
On April 14, 2011, the Company and Mr. DeMedio entered into an additional amendment to the employment agreement. The agreement extended the term of Mr. DeMedio’s employment with the Company from June 30, 2011 until June 30, 2014, and will automatically continue from year to year thereafter unless terminated as of the end of the original term or any such one year renewal period by the Company or Mr. DeMedio by at least 90-days notice. In connection with the amendment, and in recognition of his dedicated and valuable service to the Company and extending the term of his employment agreement, Mr. DeMedio was issued 25,000 shares of common stock under the 2010 Stock Incentive Plan which vest or vested as follows:
8,333 on April 14, 2011; 8,333 on April 14, 2012; and 8,334 on April 14, 2013.
Effective July 1, 2011, Mr. DeMedio’s annual base salary was increased to $230,000.
On September 27, 2011, the Company and Mr. DeMedio entered into another amendment to his employment agreement pursuant to which Mr. DeMedio was granted an aggregate of 25,000 shares of common stock as a bonus for his performance during the last six months of the 2011 fiscal year which vest as follows: 8,333 on the date of signing the amendment; 8,333 on the first anniversary of such signing date; and 8,334 on the second anniversary of such signing date. Mr. DeMedio also agreed that the premiums for his supplemental long term disability policy being paid by the Company would now be included in his wages and be taxable to him.
Cary Sagady
On July 2, 2008, the Company and Mr. Sagady entered into an employment agreement pursuant to which the Company continued to employ Mr. Sagady as a Senior Vice President, Product Development for a one-year term. Mr. Sagady’s employment with the Company shall automatically continue for consecutive one-year periods unless terminated by either party upon notice of at least 60 days prior to the end of each one-year extension. Effective July 2, 2008, Mr. Sagady’s base salary has been $185,000 per annum. In addition, Mr. Sagady is eligible to earn an annual discretionary bonus in the maximum amount of 60% of his annual base salary based upon his performance. Mr. Sagady is also entitled to be reimbursed by the
Company for all reasonable expenses incurred by him in connection with his employment duties. The Company issued to Mr. Sagady an incentive bonus of 5,000 free-trading shares of the Company’s common stock, 1,250 of which vested on each of the following dates: September 30, 2008, December 31, 2008, March 31, 2009 and June 30, 2009. [Upon renewal of his employment agreement, Mr. Sagady was issued an additional 5,000 shares of common stock that vested quarterly in fiscal year 2010.] Pursuant to his employment agreement, the Company pays to Mr. Sagady an automobile allowance of $7,800 per annum. Mr. Sagady is also entitled to be covered by all standard fringe and employee benefits made available to other employees of the Company, including medical and dental insurance, paid vacation and holidays, a 401(k) plan and a long-term disability
plan. The agreement requires Mr. Sagady to devote his full time and attention to the business and affairs of the Company, and obligates him not to engage in any investments or activities which would compete with the Company during the term of the agreement and for a period of one year thereafter.
56
Michael Lawlor
On June 7, 2010, the Company and Mr. Lawlor entered into an employment agreement pursuant to which the Company employed Mr. Lawlor as a Senior Vice President, Sales and Business Development through June 30, 2011. Mr. Lawlor’s employment with the Company shall automatically continue for consecutive one-year periods unless terminated by either party upon notice of at least 60 days prior to the end of each one-year extension. Mr. Lawlor’s current base salary is $165,000 per annum. In addition, Mr. Lawlor is eligible to earn an annual discretionary bonus in the maximum amount of 100% of his annual base salary based upon his performance. Mr. Lawlor is also entitled to be reimbursed by the Company for all
reasonable expenses incurred by him in connection with his employment duties. The Company issued to Mr. Lawlor an incentive bonus of $10,000 upon the signing of his employment agreement. Upon renewal of his employment agreement before April 1, 2011, Mr. Lawlor was issued 10,000 shares of free-trading common stock. Pursuant to his employment agreement, the Company pays to Mr. Lawlor an automobile allowance of $7,800 per annum in equal bi-weekly installments of $300. Mr. Lawlor is also entitled to be covered by all standard fringe and employee benefits made available to other employees of the Company, including medical and dental insurance, paid vacation and holidays, a 401(k) plan and a long-term disability plan. The agreement requires Mr. Lawlor to devote his full time and attention to the business and affairs of the Company, and obligates him not to engage in any investments or
activities which would compete with the Company during the term of the agreement and for a period of one year thereafter.
Potential Payments Upon Termination Or Change Of Control
As described above and herein, each of the employment agreements of our executive officers include provisions for the payment and/or the provision of benefits to the executives upon termination of employment under certain conditions or if a successor to the Company’s business or assets does not agree to assume and perform his employment agreement as a condition to the consummation of a USA Transaction.
The term USA Transaction means: (i) the acquisition of fifty-one percent or more of the then outstanding voting securities entitled to vote generally in the election of Directors of the Company by any person, entity or group, or (ii) the approval by the shareholders of the Company of a reorganization, merger, consolidation, liquidation, or dissolution of the Company, or the sale, transfer, lease or other disposition of all or substantially all of the assets of the Company, or (iii) a change in the composition of the Board of Directors of the Company over a period of twelve (12) months or less such that the continuing directors fail to constitute a majority of the Board.
If Mr. Jensen’s employment had been terminated as of June 30, 2011 (when the closing price per share was $2.22) (i) by him with good cause, or (ii) by the Company without cause, or (iii) if a successor to the Company’s business or assets had not agreed to assume and perform his employment agreement as a condition to the consummation of a USA Transaction, then an aggregate of 83,334 shares previously issued to him under his employment agreement would become automatically vested as of the date of termination, with a value of $185,000. If a USA Transaction had occurred as of June 30, 2011, Mr. Jensen would receive 140,000 shares with a value of $310,000 pursuant to the provisions in his employment
agreement relating to the Jensen Shares.
If Mr. Herbert’s employment had been terminated as of June 30, 2011 (when the closing price per share was $2.22) (i) by him with good cause, or (ii) by the Company without cause, or (iii) if a successor to the Company’s business or assets had not agreed to assume and perform his employment agreement as a condition to the consummation of a USA Transaction, then an aggregate of 50,000 shares previously issued to him under his employment agreement would become automatically vested as of the date of termination, with a value of $111,000.
As described above under “Executive Employment Agreements”, the employment agreement between the Company and Mr. Jensen provides that the Company is required to provide Mr. Jensen with certain payments and benefits upon the termination by the Company of his employment without cause or upon the termination by Mr. Jensen of his employment for good reason or upon automatic termination of his employment if a successor to the Company’s business or assets does not agree to assume and perform his employment agreement as a condition to the consummation of a USA Transaction. Assuming that any such termination occurred on June 30, 2011, Mr. Jensen would in addition to the shares described above,
receive an aggregate cash payment of twice his annual base salary or $730,000, and the Company would pay health insurance, life insurance, and disability insurance premiums for a two year period following termination in the aggregate amount of $55,656. The aforesaid premium amount is based on an estimated monthly premium of $1,402 for the health insurance, $463 for the life insurance, and $454 for disability insurance.
As described above under “Executive Employment Agreements”, the employment agreement between the Company and Mr. Herbert provides that the Company is required to provide Mr. Herbert with certain payments and benefits upon the termination by the Company of his employment without cause or upon the termination by Mr. Herbert of his employment for good reason or upon automatic termination of his employment if a successor to the Company’s business or assets does not agree to assume and perform his employment agreement as a condition to the consummation of a USA Transaction. Assuming that any such termination occurred on June 30, 2011, Mr. Herbert would in addition to the shares described above, receive an aggregate cash payment of twice his annual base salary or $640,000,
and the Company would pay health insurance, life insurance, and disability insurance premiums for a two year period following termination in the aggregate amount of $43,104. The aforesaid premium amount is based on an estimated monthly premium of $1,402 for the health insurance, $115 for the life insurance, and $279 for disability insurance..
57
As described above under “Executive Employment Agreements”, if Mr. DeMedio’s employment with the Company would be terminated by the Company without cause, the Company would pay health insurance premiums for a one year period following termination in the aggregate amount of $16,824. The aforesaid premium amount is based on an estimated monthly premium of $1,402.
In addition, if a USA Transaction had occurred on June 30, 2011, and assuming that their employment with the Company had terminated as of such date, there would have been no excess parachute payments received by Messrs. Jensen or Herbert and there would have been no excise tax or related tax gross up payments required to be made by the Company.
Compensation Committee Interlocks And Insider Participation
During the fiscal year 2011, Jack Price, Steven Barnhart and Peter Michel served at various times as members of the Compensation Committee of our board of directors. No member of the Compensation Committee was an employee or former employee of our Company or any of our subsidiaries, or had any relationship with us requiring disclosure herein.
During the last fiscal year, none of our executive officers served as: (i) a member of the compensation committee (or other committee of the board of directors performing equivalent functions or, in the absence of any such committee, the entire board of directors) of another entity, one of whose executive officers served on our Compensation Committee; (ii) a director of another entity, one of whose executive officers served on our Compensation Committee; or (iii) a member of the compensation committee (or other committee of the board of directors performing equivalent functions or, in the absence of any such committee, the entire board of directors) of another entity, one of whose executive officers served as a
director on our board of directors.
58
Compensation Of Directors
Members of the Board of Directors receive cash and equity compensation for serving on the board of directors, as determined from time to time by the Compensation Committee with subsequent approval thereof by the board of directors.
Director Compensation Table
The table below summarizes the compensation earned or paid in cash by the Company to non-employee Directors during the fiscal year ended June 30, 2011.
|
Name
|
Fees Earned
or Paid in
Cash($)
|
Stock
Awards($)
|
Option
Awards($)
|
Non-Equity
Incentive
Compensation
Plan
|
Change in
Pension Value
and
Nonqualified
Deferred
Compensation
Earnings($)
|
All Other
Compensation
($)
|
Total($)
|
|||||||||||||||||||||
|
(a)
|
(b)
|
(1)(c) |
(d)
|
(e)
|
(f)
|
(g)
|
(h)
|
|||||||||||||||||||||
|
Steven D. Barnhart
|
$ | 40,000 | $ | 7,399 | $ | - | $ | - | $ | - | $ | - | $ | 47,399 | ||||||||||||||
|
Joel Brooks
|
$ | 30,000 | $ | 7,399 | $ | - | $ | - | $ | - | $ | - | $ | 37,399 | ||||||||||||||
|
Douglas M. Lurio
|
$ | 20,000 | $ | 7,399 | $ | - | $ | - | $ | - | $ | - | $ | 27,399 | ||||||||||||||
|
Peter A. Michel (1)
|
$ | 40,000 | $ | - | $ | - | $ | - | $ | - | $ | - | $ | 40,000 | ||||||||||||||
|
Jack E. Price
|
$ | 30,000 | $ | 7,399 | $ | - | $ | - | $ | - | $ | - | $ | 37,399 | ||||||||||||||
|
Bradley M. Tirpak
|
$ | 20,000 | $ | 7,399 | $ | - | $ | - | $ | - | $ | - | $ | 27,399 | ||||||||||||||
Represents the grant date fair value of awards computed in accordance with stock-based compensation accounting rules (FASB ASC Topic 718). A discussion of assumptions used in calculating award values is included in Note 11 of the Consolidated Financial Statements.
(1) Mr. Michel resigned as a Director effective June 28, 2011.
During fiscal year ended June, 30, 2011, and included in the above table, we paid the following fees during the fiscal year:
|
●
|
Director: each Director received $20,000.
|
|
|
●
|
Audit Committee: each of Messrs. Brooks, Barnhart and Michel received $10,000.
|
|
|
●
|
Compensation Committee: each of Messrs. Barnhart, Michel and Price received $10,000.
|
|
|
Nominating Committee: each of Messrs. Barnhart, Price and Tirpak did not receive compensation for their duties on this committee.
|
59
Common Stock
The following table sets forth, as of June 30, 2011, the beneficial ownership of the common stock of each of the Company’s directors and executive officers, the other employees named in the summary compensation table set forth above, as well as by the Company’s directors and executive officers as a group. Except as set forth below, the Company is not aware of any beneficial owner of more than five percent of the common stock. Except as otherwise indicated, the Company believes that the beneficial owners of the common stock listed below, based on information furnished by such owners, have sole investment and voting power with respect to such shares, subject to community property laws where
applicable:
|
Number of Shares of
Common Stock
|
||||||
|
Name and Address of Beneficial Owner(1)
|
Beneficially
Owned(2)
|
Percent of
Class
|
||||
|
George R. Jensen, Jr.
|
267,321 shares(3)
|
* | ||||
|
100 Deerfield Lane, Suite 140
|
||||||
|
Malvern, Pennsylvania 19355
|
||||||
|
Stephen P. Herbert
|
264,133 shares(4)
|
* | ||||
|
100 Deerfield Lane, Suite 140
|
||||||
|
Malvern, Pennsylvania 19355
|
||||||
|
David M. DeMedio
|
88,326 shares(5)
|
* | ||||
|
100 Deerfield Lane, Suite 140
|
||||||
|
Malvern, Pennsylvania 19355
|
||||||
|
Douglas M. Lurio
|
36,778 shares(6)
|
* | ||||
|
2005 Market Street, Suite 3120
|
||||||
|
Philadelphia, Pennsylvania 19103
|
||||||
|
Bradley M. Tirpak
|
144,140 shares(7)
|
* | ||||
|
50 Orchard Street, Apt #5
|
||||||
|
New York, New York 10002
|
||||||
|
Steven D. Barnhart
|
107,614 shares (8)
|
* | ||||
|
1143 N. Sheridan Road
|
||||||
|
Lake Forest, Illinois 60045
|
||||||
|
Joel Brooks
|
10,000 shares (9)
|
* | ||||
|
721 Route 202/206, Suite 130
|
||||||
|
Bridgewater, NJ 08807
|
||||||
|
Jack E. Price
|
10,000 shares (10)
|
* | ||||
|
12942 NE 24th Street
|
||||||
|
Bellevue, Washington, 98005
|
||||||
|
Cary Sagady
|
5,050 shares
|
* | ||||
|
100 Deerfield Lane, Suite 140
|
||||||
|
Malvern, Pennsylvania 19355
|
||||||
|
Michael Lawlor
|
15,552 shares
|
* | ||||
|
100 Deerfield Lane, Suite 140
|
||||||
|
Malvern, Pennsylvania 19355
|
||||||
|
Wellington Management Company, LLP
|
2,620,900 shares (11)
|
7.7 | % | |||
|
75 State Street
|
||||||
|
Boston, Massachusetts 02109
|
||||||
|
Downsview Capital, Inc.
|
1,890,073 shares (12)
|
5.82 | % | |||
|
3100 Dundee Road, Suite 703
|
||||||
|
Northbrook, Illinois 60062
|
||||||
|
All Directors and Executive Officers
|
928,312 shares
|
2.86 | % | |||
|
As a Group (8 persons)
|
||||||
* Less than one percent (1%)
60
|
(1)
|
Beneficial ownership is determined in accordance with the rules of the Securities and Exchange Commission and derives from either voting or investment power with respect to securities. Shares of common stock issuable upon conversion of preferred stock, or shares of common stock issuable upon exercise of warrants and options currently exercisable, or exercisable within 60 days of June 30, 2011, are deemed to be beneficially owned for purposes hereof.
|
|
(2)
|
The percentage of common stock beneficially owned is based on 32,462,292 shares outstanding as of June 30, 2011.
|
|
(3)
|
Includes 2,000 shares of common stock beneficially owned by his spouse, 25,827 shares owned by George R. Jensen, Jr. Grantor Retained Unitrust dated July 14, 2003 over which Mr. Jensen retains beneficial ownership. Includes 50,000 shares underlying vested stock options, 15,000 shares issuable upon the exercise of warrants and 350 shares underlying preferred stock. Does not include the right granted to Mr. Jensen under his Employment Agreement to receive common stock upon the occurrence of a USA Transaction. See “Executive Employment Agreements”. Includes 125,000 shares of common stock issued to Mr. Jensen on April 14, 2011 which vest or vested as follows: 41,666 on April 14, 2011; 41,667 on April 14, 2012; and 41,667 on April 14, 2013.
|
|
(4)
|
Includes 32,010 shares of common stock beneficially owned by his child and 27,440 shares of common stock beneficially owned by his spouse and 12,000 shares underlying vested stock options. Includes 75,000 shares of common stock issued to Mr. Herbert on April 14, 2011 which vest or vested as follows: 25,000 on April 14, 2011; 25,000 on April 14, 2012; and 25,000 on April 14, 2013.
|
|
(5)
|
Includes 4,666 shares underlying vested stock options. Includes 25,000 shares of common stock issued to Mr. DeMedio on April 14, 2011 which vest or vested as follows: 8,333 on April 14, 2011; 8,333 on April 14, 2012; and 8,334 on April 14, 2013.
|
|
(6)
|
Includes 6,000 shares underlying vested stock options and 6,874 shares issuable upon the exercise of warrants. Includes 10,000 shares issued to Mr. Lurio as a non-employee director of the Company as of June 30, 2011 which vest or vested as follows: 3,333 shares on June 30, 2011, 3,333 shares on June 30, 2012 and 3,334 shares on June 30, 2013.
|
|
(7)
|
Includes 10 shares underlying preferred stock. Includes 10,000 shares issued to Mr. Tirpak as a non-employee director of the Company as of June 30, 2011 which vest or vested as follows: 3,333 shares on June 30, 2011, 3,333 shares on June 30, 2012 and 3,334 shares on June 30, 2013.
|
|
(8)
|
Includes 32,538 shares issuable upon the exercise of warrants. Includes 10,000 shares issued to Mr. Barnhart as a non-employee director of the Company as of June 30, 2011 which vest or vested as follows: 3,333 shares on June 30, 2011, 3,333 shares on June 30, 2012 and 3,334 shares on June 30, 2013.
|
|
(9)
|
Includes 10,000 shares issued to Mr. Brooks as a non-employee director of the Company as of June 30, 2011 which vest or vested as follows: 3,333 shares on June 30, 2011, 3,333 shares on June 30, 2012 and 3,334 shares on June 30, 2013.
|
|
(10)
|
Includes 10,000 shares issued to Mr. Price as a non-employee director of the Company as of June 30, 2011 which vest or vested as follows: 3,333 shares on June 30, 2011, 3,333 shares on June 30, 2012 and 3,334 shares on June 30, 2013.
|
|
(11)
|
Based upon a Schedule 13-F/A filed with the Securities and Exchange Commission on August 17, 2011, reflecting the beneficial ownership of our common stock by Wellington Management Company, LLP, which has shared voting authority over 948,900 shares and shared dispositive power over 2,620,900 shares. Includes 1,674,900 shares underlying warrants.
|
|
(12)
|
Includes 165,073 shares underlying warrants. Based upon a Schedule 13G filed with the Securities and Exchange Commission on March 24, 2011, Downsview Capital, Inc. (“Downsview”) and Mitchell P. Kopin, the president of Downsview, each has shared voting and dispositive power over 1,890,073 shares, and Cranshire Capital, L.P. (“Cranshire”), a limited partnership of which Downsview is the general partner, has shared voting and dispositive power over 1,744,725 of such shares (165,073 of which represent shares underlying warrants). The address of Mr. Kopin and Cranshire is as indicated in the table. The foregoing excludes 1,293,750 shares of common stock issuable upon exercise of warrants which
are not exercisable within 60-days of June 30, 2011.
|
Preferred Stock
Other than 1,000 shares and 35,000 shares of preferred stock owned by Mr. Tirpak and Mr. Jensen, respectively, there were no shares of preferred stock that were beneficially owned as of June 30, 2011 by the Company’s directors, executive officers, or the other employees named in the Summary Compensation Table set forth above.
61
During the fiscal year ended June 30, 2011, the Company incurred professional fees of approximately $513,000 in connection with legal services rendered to the Company by Lurio & Associates, P.C., a law firm of which Douglas M. Lurio, a Director, is President. Of such amount of professional fees, approximately $57,000 was attributable to issues arising under the Settlement Agreement with the Committee.
REVIEW, APPROVAL OR RATIFICATION OF TRANSACTIONS WITH RELATED PERSONS
Our policy is that all related party transactions, which are required to be disclosed under Item 404 of Regulation S-K promulgated under the Securities Act of 1933, as amended, are to be reviewed and approved by the Audit Committee for any possible conflicts of interest. This policy is evidenced in the Charter of the Audit Committee of the Board of Directors of the Company.
DIRECTOR INDEPENDENCE
The Board of Directors has determined that Joel Brooks, Steven D. Barnhart, Jack E. Price, and Bradley M. Tirpak, which members constitute a majority of the Board of Directors, are independent in accordance with the applicable listing standards of The NASDAQ Stock Market, Inc.
The Board of Directors has a standing Audit Committee, Nominating Committee, and Compensation Committee.
The Audit Committee of the Board of Directors presently consists of Mr. Brooks (Chairman), Mr. Barnhart, and Mr. Price. The Audit Committee recommends the engagement of the Company’s independent accountants and is primarily responsible for approving the services performed by the Company’s independent accountants, for reviewing and evaluating the Company’s accounting principles, reviewing the independence of independent auditors, and reviewing the adequacy and effectiveness of the Company’s internal controls. The Audit Committee operates pursuant to a charter that was last amended and restated by the Board of Directors on April 11, 2006, a copy of which is accessible on the Company’s
website, www.usatech.com.
The Compensation Committee of the Board of Directors presently consists of Mr. Price (Chairman), and Mr. Barnhart. The Board of Directors has determined that each of the current members of the Compensation Committee is independent in accordance with the applicable listing standards of The Nasdaq Stock Market, Inc. The Committee reviews and recommends compensation and compensation changes for the executive officers of the Company and administers the Company’s stock option and restricted stock grant plans. The Compensation Committee operates pursuant to a charter that was adopted by the Board in September 2007, a copy of which is accessible on the Company’s website, www.usatech.com.
The Nominating Committee of the Board of Directors was established in November 2009, and presently consists of Mr. Barnhart (Chairman), Mr. Price and Mr. Tirpak. The Board of Directors has determined that each of the current members of the Nominating Committee is independent in accordance with the applicable listing standards of The Nasdaq Stock Market, LLC. The Committee recommends to the entire Board of Directors for selection any nominees for director. The Nominating Committee operates pursuant to a charter that was adopted by the Board of Directors on November 3, 2009, a copy of which is accessible on the Company’s website, www.usatech.com.
62
AUDIT AND NON-AUDIT FEES
During the fiscal year ended June 30, 2011 and 2010, fees in connection with services rendered by McGladrey & Pullen, LLP were as set forth below:
|
Fiscal
|
Fiscal
|
|||||||
|
2011
|
2010
|
|||||||
|
Audit Fees
|
$ | 190,000 | $ | 195,000 | ||||
|
Audit-Related Fees
|
24,000 | 50,000 | ||||||
|
Tax Fees
|
5,100 | 85,000 | ||||||
|
All Other Fees
|
- | - | ||||||
|
TOTAL
|
$ | 219,100 | $ | 330,000 | ||||
Audit fees consisted of fees for the audit of our annual financial statements and review of quarterly financial statements as well as services normally provided in connection with statutory and regulatory filings or engagements, consents and assistance with and reviews of Company documents filed with the Securities and Exchange Commission.
Audit related fees were primarily incurred in connection with our equity offerings, and fees in connection with attending the annual shareholders meeting.
Tax fees related to the review of our analysis of the timing and extent to which the Company can utilize future tax deductions in any year, which may be limited by provisions of the Internal Revenue Code regarding changes in ownership of corporations (i.e. IRS Code Section 382).
AUDIT COMMITTEE PRE-APPROVAL POLICY
The Audit Committee’s policy is to pre-approve all audit and permissible non-audit services provided by the independent registered public accounting firm on a case-by-case basis.
63
|
Exhibit
Number
|
Description
|
|
|
3.1
|
Amended and Restated Articles of Incorporation of USA filed January 26, 2004 (Incorporated by reference to Exhibit 3.1.19 to Form 10-QSB filed on February 12, 2004).
|
|
|
3.1.1
|
First Amendment to Amended and Restated Articles of Incorporation of USA filed on March 17, 2005 (Incorporated by reference to Exhibit 3.1.1 to Form S-1 Registration Statement No. 333-124078).
|
|
|
3.1.2
|
Second Amendment to Amended and Restated Articles of Incorporation of USA filed on December 13, 2005 (Incorporated by reference to Exhibit 3.1.2 to Form S-1 Registration Statement No. 333-130992).
|
|
|
3.1.3
|
Third Amendment to Amended and Restated Articles of Incorporation of USA filed on July 25, 2007. (Incorporated by reference to Exhibit 3.1.3 to Form 10-K filed September 23, 2008).
|
|
|
3.1.4
|
Fourth Amendment to Amended and Restated Articles of Incorporation of USA filed on March 6, 2008. (Incorporated by reference to Exhibit 3.1.4 to Form 10-K filed September 23, 2008).
|
|
|
3.2
|
Amended and Restated By-Laws of USA (Incorporated by reference to Exhibit 3(ii) to Form10-Q/A filed on February 22, 2010).
|
|
|
4.1
|
Form of Warrant No. SAC-001 issued to S.A.C. Capital Associates, LLC (Incorporated by reference to Exhibit 4.2 to Form 8-K filed on March 15, 2007).
|
|
|
4.2
|
Registration Rights Agreement between the Company and S.A.C. Capital Associates, LLC dated March 14, 2007 (Incorporated by reference to Exhibit 4.3 to Form 8-K filed on March 15, 2007).
|
|
|
4.3
|
Warrant No.CR-001 dated March 16, 2011 in favor of Cranshire Capital, L.P. (Incorporated by reference to Exhibit 4.1 of Form S-1 filed March 31, 2011)
|
|
|
4.4
|
Warrant No.CR-002 dated March 16, 2011 in favor of Freestone Advantage Partners, LP (Incorporated by reference to Exhibit 4.2 of Form S-1 filed March 31, 2011)
|
|
|
4.5
|
Warrant No.CR-003 dated March 16, 2011 in favor of Iroquois Master Fund Ltd. (Incorporated by reference to Exhibit 4.3 of Form S-1 filed March 31, 2011)
|
|
|
4.6
|
Warrant No.CR-004 dated March 16, 2011 in favor of Kingsbrook Opportunities Master Fund LP (Incorporated by reference to Exhibit 4.4 of Form S-1 filed March 31, 2011)
|
|
|
4.7
|
Warrant No.CR-005 dated March 16, 2011 in favor of Hudson Bay Master Fund Ltd. (Incorporated by reference to Exhibit 4.5 of Form S-1 filed March 31, 2011)
|
|
|
4.8
|
Warrant No.CR-006 dated March 16, 2011 in favor of Cowen Overseas Investment LP (Incorporated by reference to Exhibit 4.6 of Form S-1 filed March 31, 2011)
|
|
|
4.9
|
Warrant No.CR-007 dated March 16, 2011 in favor of Ramius Select Equity Fund LP (Incorporated by reference to Exhibit 4.7 of Form S-1 filed March 31, 2011)
|
|
|
4.10
|
Warrant No.CRA-001 dated March 17, 2011 in favor of Chardan Capital Markets, LLC (Incorporated by reference to Exhibit 4.8 of Form S-1 filed March 31, 2011)
|
|
|
4.11
|
Warrant No.CRA-002 dated March 17, 2011 in favor of Jonathan Schechter (Incorporated by reference to Exhibit 4.9 of Form S-1 filed March 31, 2011)
|
|
|
4.12
|
Warrant No.CRA-003 dated March 17, 2011 in favor of Joseph Reda (Incorporated by reference to Exhibit 4.10 of Form S-1 filed March 31, 2011)
|
|
|
4.13
|
Warrant No.CRA-004 dated March 17, 2011 in favor of Adam Selkin (Incorporated by reference to Exhibit 4.11 of Form S-1 filed March 31, 2011)
|
64
|
10.1
|
Agreement of Lease between Pennswood Spring Mill Associates, as landlord, and the Company, as tenant, dated September 2002, and the Rider thereto (Incorporated by reference to Exhibit 10.21 to Form 10-KSB filed on September 28, 2004).
|
|
|
10.2
|
Agreement of Lease between Deerfield Corporate Center 1 Associates LP, as landlord, and the Company, as tenant, dated March 2003 (Incorporated by reference to Exhibit 10.22 to Form 10-KSB filed on September 28, 2004).
|
|
|
10.3
|
Amendment to Office Space Lease dated as of April 1, 2005 by and between the Company and Deerfield Corporate Center Associates, LP. (Incorporated by reference to Exhibit 10.19.1 to Form S-1 Registration Statement No. 333-124078)
|
|
|
10.4
|
Employment and Non-Competition Agreement between USA and David M. DeMedio dated April 12, 2005 (Incorporated by reference to Exhibit 10.22 to Form S-1 Registration Statement No. 333-124078).
|
|
|
10.5
|
First Amendment to Employment and Non-Competition Agreement between USA and David M. DeMedio dated May 11, 2006 (Incorporated by reference to Exhibit 10.3 to Form 10-Q filed on May 15, 2006).
|
|
|
10.6
|
Option Certificate (No. 200) dated April 12, 2005 in favor of David M. DeMedio (Incorporated by reference to Exhibit 10.23 to Form S-1 Registration Statement No. 333-124078).
|
|
|
10.7
|
Option Certificate (No. 201) dated May 11, 2006 in favor of George R. Jensen, Jr. (Incorporated by reference to Exhibit 10.21 to Form 10-K filed on September 28, 2006).
|
|
|
10.8
|
Option Certificate (No. 202) dated May 11, 2006 in favor of Stephen P. Herbert. (Incorporated by reference to Exhibit 10.21 to Form 10-K filed on September 28, 2006).
|
|
|
10.9
|
Option Certificate (No. 203) dated May 11, 2006 in favor of David M. DeMedio. (Incorporated by reference to Exhibit 10.21 to Form 10-K filed on September 28, 2006).
|
|
|
10.10
|
Option Certificate (No. 204) dated April 21, 2006 in favor of William W. Sellers. (Incorporated by reference to Exhibit 10.21 to Form 10-K filed on September 28, 2006).
|
|
|
10.11
|
Option Certificate (No. 205) dated April 21, 2006 in favor of William L. Van Alen, Jr. (Incorporated by reference to Exhibit 10.21 to Form 10-K filed on September 28, 2006).
|
|
|
10.12
|
Option Certificate (No. 206) dated April 21, 2006 in favor of Steven Katz. (Incorporated by reference to Exhibit 10.21 to Form 10-K filed on September 28, 2006).
|
|
|
10.13
|
Option Certificate (No. 207) dated April 21, 2006 in favor of Douglas M. Lurio. (Incorporated by reference to Exhibit 10.21 to Form 10-K filed on September 28, 2006).
|
|
|
10.14
|
Option Certificate (No. 208) dated April 21, 2006 in favor of Albert Passner. (Incorporated by reference to Exhibit 10.21 to Form 10-K filed on September 28, 2006).
|
|
|
10.15
|
Option Certificate (No. 209) dated July 20, 2006 in favor of Stephen W. McHugh. (Incorporated by reference to Exhibit 10.21 to Form 10-K filed on September 28, 2006).
|
|
|
10.16
|
USA Technologies, Inc. 2010 Stock Compensation Plan (Incorporated by reference to Exhibit 10.1 to Form S-8 filed April 14, 2011).
|
|
|
10.17
|
Amendment to Agreement of Lease between BMR-Spring Mill Drive, L.P., as landlord, and the Company, as tenant, dated January 15, 2007 (Incorporated by reference to Exhibit 10.1 to Form 10-Q filed on February 13, 2007).
|
|
|
10.18
|
Second Amendment to Agreement of Lease between BMR-Spring Mill Drive, L.P., as landlord, and the Company, as tenant, dated December 28, 2010. (Incorporated by reference to Exhibit 10.1 to Form 10-Q filed on January 20, 2011).
|
|
|
10.19
|
Second Amendment to Employment and Non-Competition Agreement dated March 13, 2007, between the Company and David M. DeMedio (Incorporated by reference to Exhibit 10.34 to Form S-1 filed April 12, 2007).
|
|
|
10. 20
|
Form of Indemnification Agreement between the Company and each of its officers and Directors (Incorporated by reference to Exhibit 10.1 to Form 10-Q filed May 14, 2007).
|
65
|
10.21
|
First Amendment to MasterCard PayPass Participation Agreement dated August 17, 2007 between the Company, MasterCard International Incorporated and Coca Cola Enterprises Inc. And Its Bottling Subsidiaries. (Incorporated by reference to Exhibit 10.26 to Form 10-K filed September 27, 2007).
|
|
|
10.22
|
Third Amendment to Employment and Non-Competition Agreement between the Company and David M. DeMedio dated September 22, 2008. (Incorporated by reference to Exhibit 10.29 to Form 10-K filed September 24, 2008).
|
|
|
10.23**
|
Amended and Restated Employment and Non-Competition Agreement between the Company and George R. Jensen, Jr., dated September 27, 2011
|
|
|
10.24
|
Amended and Restated Employment and Non-Competition Agreement between the Company and Stephen P. Herbert dated September 24, 2009. (Incorporated by reference to Exhibit 10.31 to Form 10-K filed September 25, 2009).
|
|
|
10.25
|
Securities Purchase Agreement dated March 14, 2011 between the Company and each of the Buyers (Incorporated by reference to Exhibit 10.1 of Form 8-K filed on March 14, 2011)
|
|
|
10.26
|
Engagement Agreement between the Company and Chardan Capital Markets LLC dated March 14, 2011 (Incorporated by reference to Exhibit 10.4 of Form 8-K filed on March 14, 2011)
|
|
|
10.27
|
Letter from the Company to David M. DeMedio dated September 24, 2009. (Incorporated by reference to Exhibit 10.32 to Form 10-K filed September 25, 2009).
|
|
|
10.28
|
Settlement Agreement dated February 4, 2010 by and among USA Technologies, Inc., Shareholder Advocates For Value Enhancement, Bradley M. Tirpak, Craig W. Thomas, and certain other parties (Incorporated by reference to Exhibit 10.1 to Form 8-K filed on February 5, 2010).
|
|
|
10.29**
|
Jensen Stock Agreement between the Company and George R. Jensen, Jr., dated September 27, 2011
|
|
|
10.30**
|
Second Amendment to Employment and Non-Competition Agreement dated September 27, 2011 between the Company and Stephen P. Herbert
|
|
|
10.31**
|
Fifth Amendment to Employment and Non-Competition Agreement dated as of July 1, 2011 between the Company and David M. DeMedio
|
|
|
10.32**
|
Sixth Amendment to Employment and Non-Competition Agreement dated September 27, 2011 between the Company and David M. DeMedio
|
|
|
10.33
|
Second Amendment to Office Space Lease dated as of November 17, 2010 by and between the Company and Liberty Malvern, LP. (Incorporated by reference to Exhibit 10.2 to Form 10-Q filed on January 20, 2011)
|
|
|
21
|
List of significant subsidiaries of the Company (Incorporated by reference to Exhibit 21 to Form S-1 filed on March 16, 2010).
|
|
|
23.1**
|
Consent of McGladrey & Pullen, LLP, Independent Registered Public Accounting Firm.
|
|
|
31.1**
|
Certifications of Chief Executive Officer pursuant to Rule 13a-14(a) under the Securities Exchange Act of 1934.
|
|
|
31.2**
|
Certifications of Chief Financial Officer pursuant to Rule 13a-14(a) under the Securities Exchange Act of 1934.
|
|
|
32**
|
Certifications by the Chief Executive Officer and Chief Financial Officer pursuant to 18 USC Section 1350, as adopted pursuant to Section 906 of the Sarbanes-Oxley Act of 2002.
|
** Filed herewith
66
Item 15(a).
SCHEDULE II
USA TECHNOLOGIES, INC.
VALUATION AND QUALIFYING ACCOUNTS
YEARS ENDED JUNE 30, 2011, 2010 AND 2009
|
Deductions
|
||||||||||||||||
|
uncollectible
|
||||||||||||||||
|
Balance at
|
Additions
|
receivables
|
Balance
|
|||||||||||||
|
beginning
|
charged to
|
written off, net
|
at end
|
|||||||||||||
|
ACCOUNTS RECEIVABLE
|
of period
|
earnings
|
of recoveries
|
of period
|
||||||||||||
|
June 30, 2011
|
$ | 41,000 | $ | 92,000 | $ | 20,000 | $ | 113,000 | ||||||||
|
June 30, 2010
|
$ | 42,000 | $ | (1,000 | ) | $ | - | $ | 41,000 | |||||||
|
June 30, 2009
|
$ | 215,000 | $ | (17,000 | ) | $ | 156,000 | $ | 42,000 | |||||||
|
Balance at
|
Additions
|
Deductions,
|
Balance
|
|||||||||||||
|
beginning
|
charged to
|
Shrinkage and
|
at end
|
|||||||||||||
|
INVENTORY
|
of period
|
earnings
|
obsolescence
|
of period
|
||||||||||||
|
June 30, 2011
|
$ | 741,000 | $ | 11,000 | $ | 124,000 | $ | 628,000 | ||||||||
|
June 30, 2010
|
$ | 596,000 | $ | 171,000 | $ | 26,000 | $ | 741,000 | ||||||||
|
June 30, 2009
|
$ | 418,000 | $ | 390,000 | $ | 212,000 | $ | 596,000 | ||||||||
67
SIGNATURES
In accordance with Section 13 or 15(d) of the Exchange Act, the registrant has duly caused this report to be signed on its behalf by the undersigned, thereunto duly authorized.
|
USA TECHNOLOGIES, INC.
|
||
|
By: /s/ George R. Jensen, Jr.
|
||
|
George R. Jensen, Jr., Chairman
|
||
|
and Chief Executive Officer
|
||
In accordance with the Exchange Act, this report has been signed below by the following persons on behalf of the registrant and in the capacities and on the dates indicated.
|
SIGNATURES
|
TITLE
|
DATE
|
||
| /s/ George R. Jensen, Jr. |
Chairman of the Board of Directors
|
September 27, 2011
|
||
|
George R. Jensen, Jr.
|
and Chief Executive Officer
|
|||
|
(Principal Executive Officer)
|
||||
|
/s/ David M. DeMedio
|
Chief Financial Officer (Principal
|
September 27, 2011
|
||
|
David M. DeMedio
|
Accounting Officer)
|
|||
| /s/ Stephen P. Herbert |
Chief Operating Officer, President
|
September 27, 2011
|
||
|
Stephen P. Herbert
|
and Director
|
|||
| /s/ Douglas M. Lurio |
Secretary and Director
|
September 27, 2011
|
||
|
Douglas M. Lurio
|
||||
| /s/ Joel Brooks |
Director
|
September 21, 2011
|
||
|
Joel Brooks
|
||||
| /s/ Steven D. Barnhart |
Director
|
September 27, 2011
|
||
|
Steven D. Barnhart
|
||||
| /s/ Jack E. Price |
Director
|
September 20, 2011
|
||
|
Jack E. Price
|
||||
| /s/ Bradley M. Tirpak |
Director
|
September 22, 2011
|
||
|
Bradley M. Tirpak
|
68