Attached files
| file | filename |
|---|---|
| 8-K - FORM 8-K - NEW JERSEY RESOURCES CORP | d366011d8k.htm |
 New Jersey
Resources A Premium Company Delivering Premium Results
New York Financial Community
June 13, 2012
Exhibit 99.1 |
 2
Certain statements contained in this presentation are forward-looking statements within the
meaning of the Private Securities Litigation Reform Act of 1995. Forward-looking statements
can also be identified by the use of forward-looking terminology such as “may,”
“intend,” “expect,” or “continue” or comparable terminology and are made based upon management’s
current expectations and beliefs as of this date concerning future developments and their
potential effect upon New Jersey Resources (NJR or the Company). There can be no assurance
that future developments will be in accordance with management’s expectations or that the
effect of future developments on the Company will be those anticipated by management. NJR
cautions persons reading or hearing this presentation that the assumptions that form the basis
for forward-looking statements regarding NJR's net financial earnings (NFE) guidance for
the 2012 fiscal year, the contributions to NFE by New Jersey Natural Gas Company (NJNG), NJR
Clean Energy Ventures (NJRCEV), NJR Energy Services (NJRES) , the Company's Energy
Holdings segment and NJR Home Services, expected contribution by new customers of New
Jersey Natural Gas Company (NJNG) to utility gross margin, expected number of new
customers of NJNG, the completion of NJRCEV's planned solar projects in fiscal 2012, estimated
capital expenditures in fiscal 2012 by NJNG and NJRCEV, and NJ’s Energy Master Plan
include many factors that are beyond the Company’s ability to control or estimate
precisely. The factors that could cause actual results to differ materially from NJR’s expectations
include, but are not limited to, weather and economic conditions; demographic changes in the NJNG
service territory and their effect on NJNG's customer growth; volatility of natural gas and
other commodity prices and their impact on NJNG customer usage, NJNG's incentive programs,
NJRES' operations and on the Company's risk management efforts; changes in rating agency
requirements and/or credit ratings and their effect on availability and cost of capital to the
Company; the impact of volatility in the credit markets; the ability to comply with debt
covenants; the impact to the asset values and resulting higher costs and funding obligations of NJR's
pension and postemployment benefit plans as a result of downturns in the financial markets, a
lower discount rate, and impacts associated with the Patient Protection and Affordable Care
Act; accounting effects and other risks associated with hedging activities and use of
derivatives contracts; commercial and wholesale credit risks, including the availability of creditworthy
customers and counterparties, liquidity in the wholesale energy trading market and the
Company’s ability to recover all of NJRES’ funds in the MF Global liquidation proceedings; the ability
to obtain governmental approvals and/or financing for the construction, development and
operation of certain non-regulated energy investments; risks associated with the management o
the Company's joint ventures and partnerships; risks associated with our investments in solar
energy projects, including the availability of regulatory and tax incentives, logistical risks and
potential delays related to construction, permitting, regulatory approvals and electric grid
interconnection, the availability of viable projects and NJR's eligibility for federal investment tax
credits (ITC), the future market for Solar Renewable Energy Certificates and operational risks
related to projects in service; timing of qualifying for ITCs due to delays or failures to complete
planned solar energy projects and the resulting effect on our effective tax rate and earnings;
the level and rate at which NJNG's costs and expenses are incurred and the extent to which
they are allowed to be recovered from customers through the regulatory process; access to
adequate supplies of natural gas and dependence on third-party storage and transportation
facilities for natural gas supply; operating risks incidental to handling, storing,
transporting and providing customers with natural gas; risks related to our employee workforce; the
regulatory and pricing policies of federal and state regulatory agencies; the costs of
compliance with the proposed regulatory framework for over-the-counter derivatives; the costs of
compliance with present and future environmental laws, including potential climate
change-related legislation; risks related to changes in accounting standards; the disallowance of
recovery of environmental-related expenditures and other regulatory changes;
environmental-related and other litigation and other uncertainties; and the impact of natural disasters,
terrorist activities, and other extreme events.
The
aforementioned
factors
are
detailed
in
the
“Risk
Factors”
sections
of
our
Annual
Report
on
Form
10-K
filed
on
November
23,
2011,
as
filed
with
the
Securities
and
Exchange
Commission
(SEC)
and
which
is
available
on
the
SEC’s
website
at
sec.gov.
NJR
disclaims
any
obligation
to
update
and
revise
statements
contained
in
these
materials
based
on
new
information or otherwise.
Regarding Forward-Looking Statements |
 Disclaimer
Regarding Non-GAAP Financial Measures 3
Management uses net financial earnings and utility gross margin as supplemental measures to other GAAP
results to provide a more complete understanding of the company’s performance. Management
believes these non-GAAP measures are more reflective of the company’s business model,
provide transparency to investors and enable period-to-period comparability
of
financial
performance.
For
a
full
discussion
of
our
non-GAAP
financial
measures,
please
see
Item
7
of
our
Annual
Report
on
Form
10-K
for
the
fiscal
year
ended
September
30,
2011,
filed
on
November
23,
2011.
This presentation includes the non-GAAP measures net financial earnings (losses) and
utility gross margin. As an indicator of the company’s operating performance, these
measures should not be considered an alternative to, or more meaningful than, GAAP measures
such as cash flow, net income, operating income or earnings per share. Net financial
earnings (losses) exclude unrealized gains or losses on derivative instruments related to the company’s unregulated subsidiaries and certain realized gains and losses
on derivative instruments related to natural gas that has been placed into storage at NJRES.
Volatility associated with the change in value of these financial and physical commodity
contracts is reported in the income statement in the current period. In order to manage its business, NJR views its results without the impacts of the unrealized
gains and losses, and certain realized gains and losses, caused by changes in value of these
financial instruments and physical commodity contracts prior to the completion of the
planned transaction because it shows changes in value currently as opposed to when the planned transaction ultimately is settled. NJNG’s utility gross margin represents
the results of revenues less natural gas costs, sales and other taxes and regulatory rider
expenses, which are key components of the company’s operations that move in relation
to each other. |
 4
Celebrating 60 years of service
Total Revenue
$3.2 million
Net Income
$351,ooo
Assets
$28.4 million
Dividends Paid
$66,391
Total Customers
90,000 |
 Consistent
Results +
Higher Net Financial Earnings (NFE) for the six months ended March 31, 2012
$2.88 vs. $2.33 last year, a 24 percent increase
+
NFE
guidance
reaffirmed
–
range
of
$2.60
to
$2.80
per
share
Two decades of improved financial performance
+
Increased dividend 5.6 percent effective January 3, 2012
Attractive yield of 3.5 percent
+
Strong results driven by core regulated utility
60 percent of total earnings from New Jersey Natural Gas
+
Positive earnings contributions from unregulated subsidiaries
Strong results from NJR Clean Energy Ventures
5 |
 Our Business
Model We focus on the fundamentals
We
have
a
record
of
consistently
delivering
premium
earnings
and
dividend
growth
Natural Gas Distribution
Steady customer growth
Infrastructure investment
opportunities
Regulatory incentives
Clean Energy and Retail
Services
Residential solar programs
Commercial rooftop and
ground-mounted solar projects
Service contracts, installations
and repair services
Wholesale Energy Services
Energy marketer
Asset management services
Midstream investments
6
+
Energy Infrastructure, Asset Management and Services
+
Disciplined Capital Allocation
+
Strong Financial Profile
+
Diverse Stakeholder Relationships |
   The NJNG
Advantage Primarily residential and commercial customer base
Net plant, property and equipment of nearly $1.2
billion
Collaborative regulatory relations
Strong record of system safety and customer
satisfaction
We will achieve the half million customer
milestone in
the summer of 2012 7 |
 3,492 new
customers in the first six months of fiscal 2012, a 14 percent increase over fiscal
2011 261 existing customer heat conversions
Customer growth through March 2012 to add
about $1.9 million of utility gross margin
annually
Conversion breakdown:
68 percent oil
25 percent electric
7 percent propane
Estimate 12,000 to 14,000 new customers over
the
next
two
years
–
a
1.3
percent
growth
rate
Steady Customer Growth
Strong demographics to support customer growth
8
New Customer Breakdown
Conversions
59%
New
Construction
41%
Gross Margin Contribution
Residential
63%
Commercial
33%
Existing
4% |
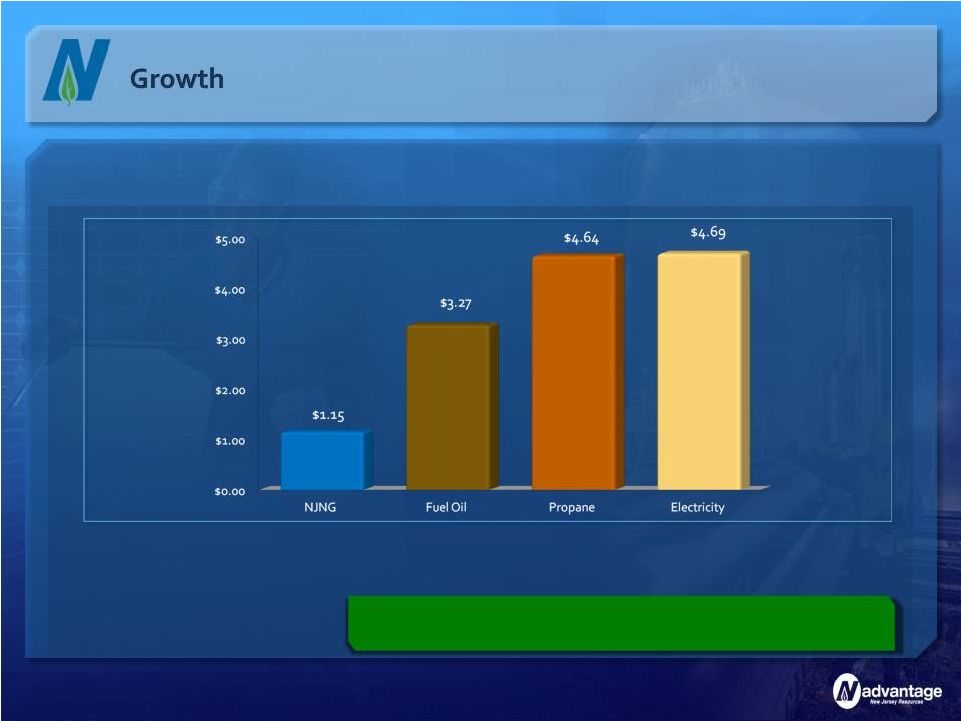 Value for
Customers Source: US Energy Information Administration
Data as of March 2012. Based on 100,000
comparable BTUs
9
We have a strong price advantage in our service territory |
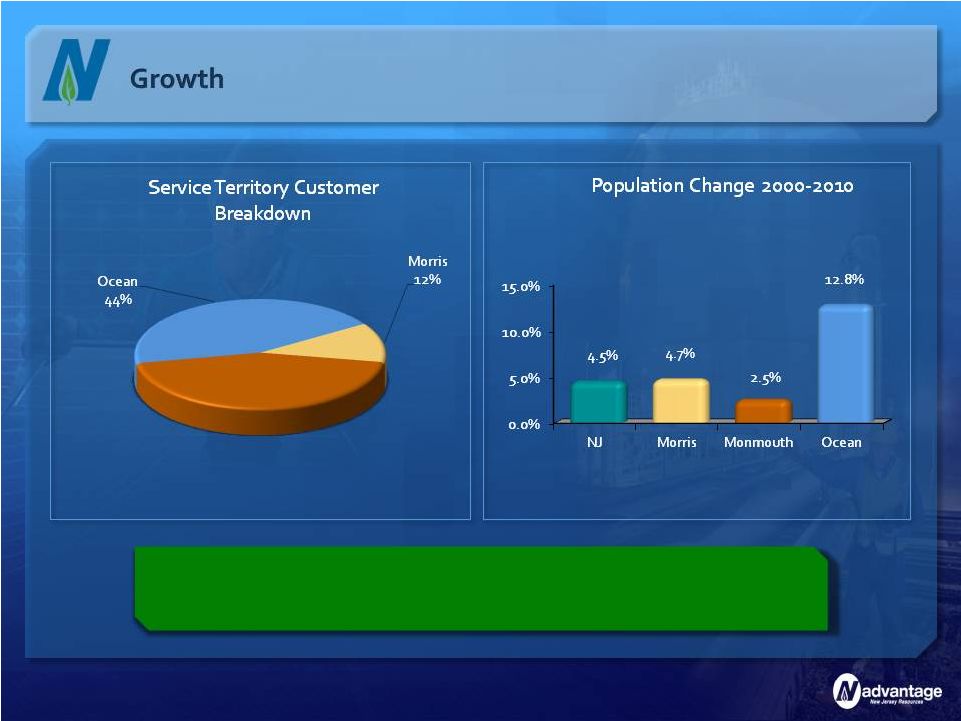 A Growing
Service Area 10
Monmouth
44%
Our service territory is among the fastest growing in the state with
Ocean County accounting for half our growth |
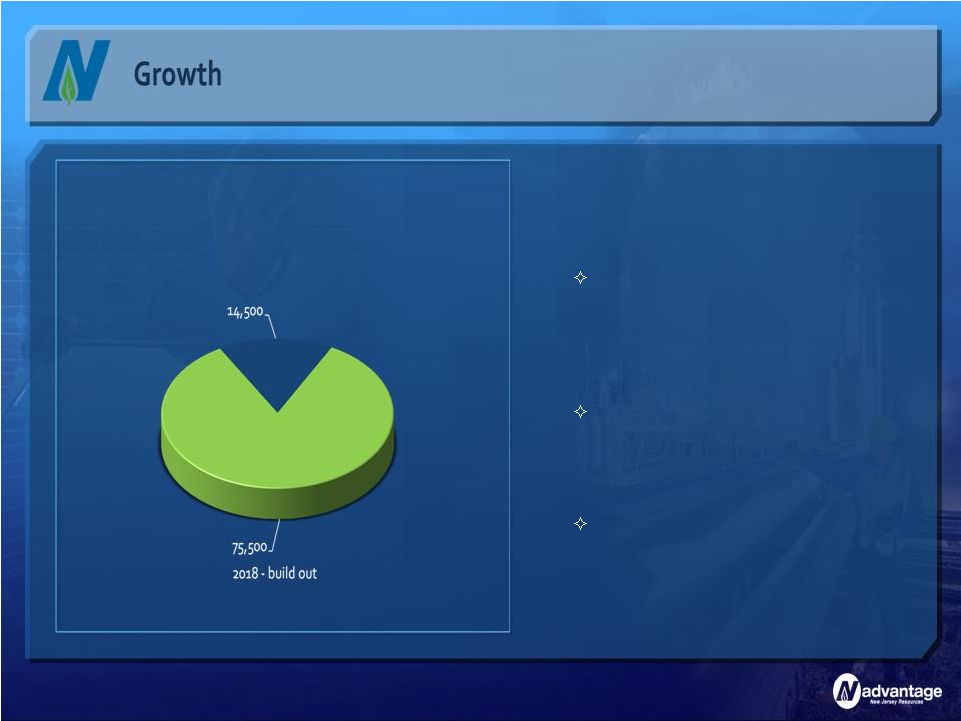 Future New
Construction Potential New Customers = 90,000
Sources: Arthur D. Little, Harte Hanks and NJNG
11
+
New residential construction
market improving
Based on NJ Builders Association
(NJBA) data, Ocean County produced
the State’s highest annual average
number of building permits (3,500)
during the 2000 decade
Rutgers University forecasts
approximately 10,000 newly
constructed homes for the three-year
period 2013-2015
Through March 2012, residential new
construction represented 34% of all new
customer additions and 25% of total
margin
2013 -
2017 |
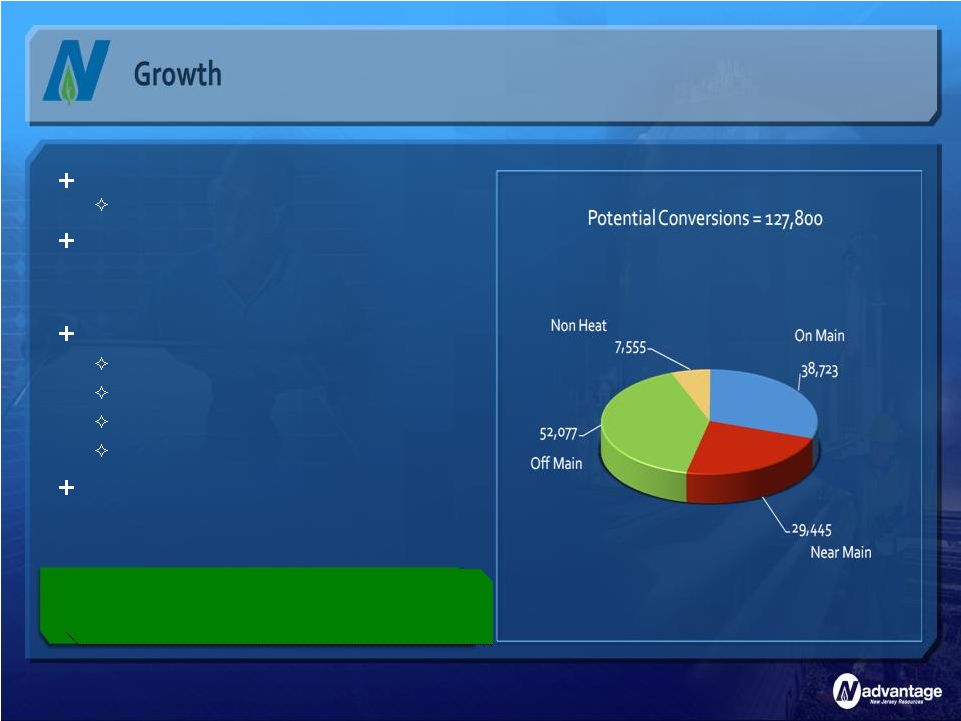   Identify and
target areas for conversion Proximity to existing natural gas lines
Aggressive marketing to communities
using a mix of fuels including oil,
electric and propane
To encourage conversions:
Fuel cost comparisons
Rebates and incentives
Partner with contractors
Direct marketing
Long-term conversion growth outlook is
strong
Robust Conversion Markets
With our new construction and conversion outlook,
we see a potential of about 210,000 new customers
12 |
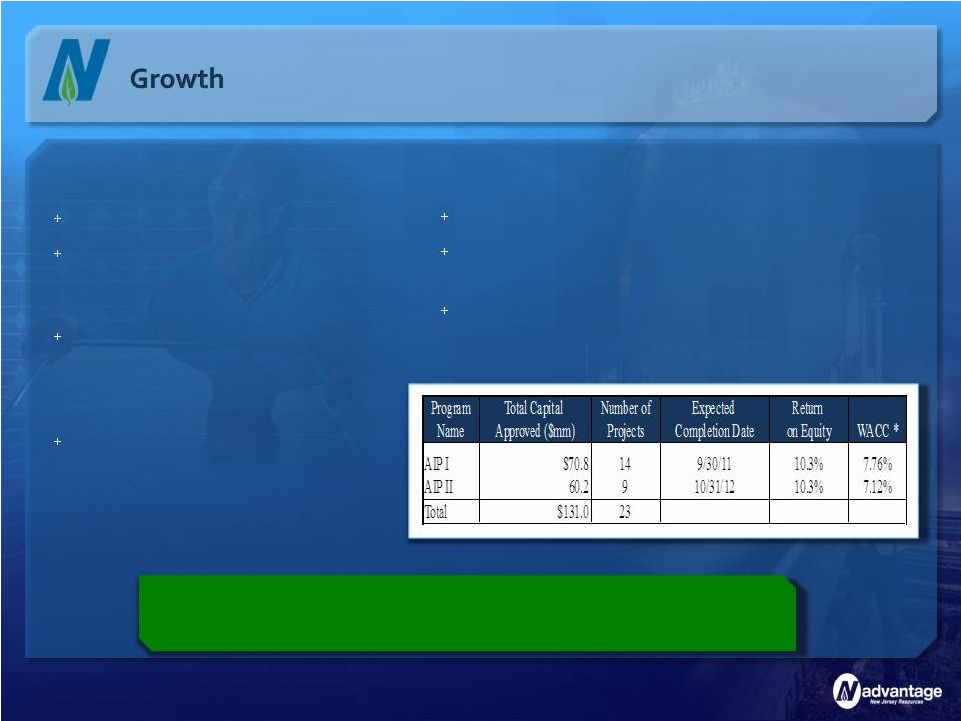 Conservation
Incentive Program Regulatory Update
Accelerated Infrastructure Programs (AIP)
Constructive regulatory environment and support of public policy
objectives
creates
potential
growth
investment
opportunities
for
NJNG
13
Customers have reduced usage and
saved over $219 million since
inception in 2006
Filed for a 2.4 percent increase to its
CIP rate to be effective October 1,
2012, due to significantly warmer-
than-normal winter weather
Protects NJNG from declining usage and
weather; encourages customer
conservation
In place through September 30, 2013
Project spending:
Accelerated capital projects support system reliability
and helps strengthen the state’s economy
Phase II approved on March 30, 2011 |
 Safety
Acceleration and Facility Enhancement (SAFE) Program 14
Infrastructure Investment Opportunities
NJ Energy Master Plan supports increased use of natural gas
as well as enhancements to system infrastructure
Filed with the BPU on March 20, 2012 to replace approximately 343 miles of
unprotected steel and cast iron distribution main
Possible $204 million investment over a five-year period
Seeking annual recovery of costs at NJNG’s weighted average cost of capital of
7.76 percent
AFUDC accounting treatment similar to successful AIP programs
Should create approximately 2,100 jobs |
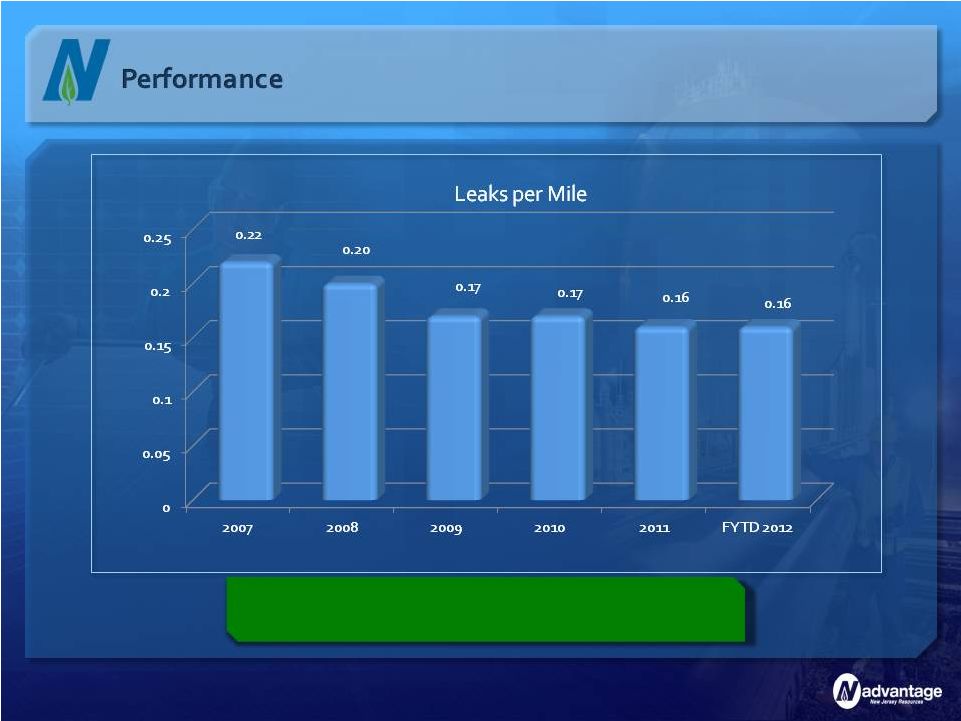 System
Reliability 15
NJNG average response time ranked in the top
quartile nationally and best in New Jersey in 2011 |
 +
Over 6 million meters read
+
More than 1 million customer calls
handled
+
Invested almost $96 million to support
customer growth and system reliability
+
Lowest number of BPU complaints per
1,000 customers for 19 consecutive years
through March 31, 2012
+
Highest in Customer Satisfaction With
Residential Natural Gas Service in the
Eastern U.S. among Large Utilities
Customer Satisfaction
Continuously working to meet
customer expectations
16
Rolling 12-months through March31, 2012
New Jersey Natural Gas received the highest numerical score among
large utilities in the Eastern U.S. in the proprietary J.D.
Power and Associates 2011 Gas Utility Residential Customer
Satisfaction Study SM
.
Study based on 62,711 online interviews ranking 10
providers
in
the
Eastern
U.S.
(CT,
DC,
MD,
MA,
NH,
NJ,
NY,
PA,
RI,
VA).
Proprietary
study results are based on experiences and perceptions of
consumers surveyed September
2010
-
July
2011.
Your
experiences
may
vary.
Visit
jdpower.com. |
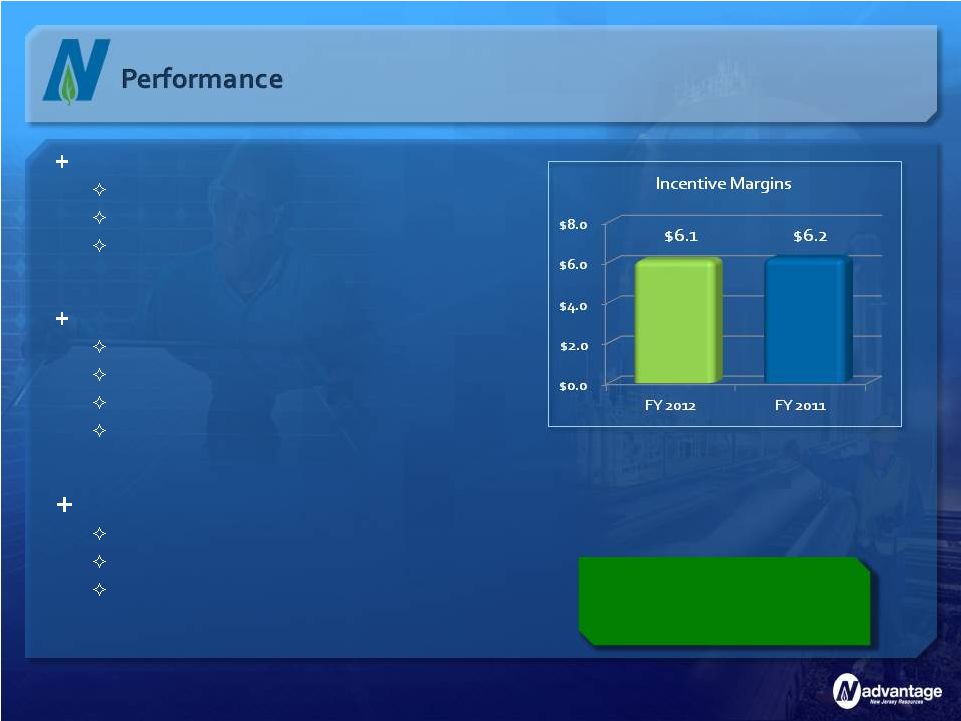 Off-system
sales and capacity release In place since 1992
Optimization of capacity and supply contracts
Sharing formula of 85 percent customer; 15 percent
NJNG
Storage Incentive (SI)
In place since 2004
Promotes long-term price stability
Promotes efficient contract utilization
Sharing formula of 80 percent customer; 20 percent
NJNG
Financial Risk Management (FRM)
In place since 1997
Promote application of risk management tools
Sharing formula of 85 percent customer; 15 percent
NJNG
Regulatory Incentives
Since inception customers have saved over
$573 million with total earnings of $1.85 per
share, an average of $.08 annually
Incentive programs in place
through October 2015
17 |
 Consistent
with our core energy strategy Meaningful earnings growth opportunities
Competitively priced electricity for customers
Strong legislative commitment to solar in NJ
Supports NJ’s Energy Master Plan
Our Clean Energy Advantage
Clean energy investments
contributed $22 million to
NFE in the first six months
of fiscal 2012
18 |
 Anticipated
legislation in support of New Jersey’s solar industry is pending for vote in both
State Assembly and Senate
Governor supporting solar industry for environmental,
job creation and energy cost benefits to New Jersey
Renewable portfolio standard (RPS) significantly
increased starting in energy year 2014
Solar alternative compliance payments (SACP)
reduced to better reflect current market
conditions
Pending Solar Legislation
NJR targeting $70 to $90 million
of clean energy investments
annually
19 |
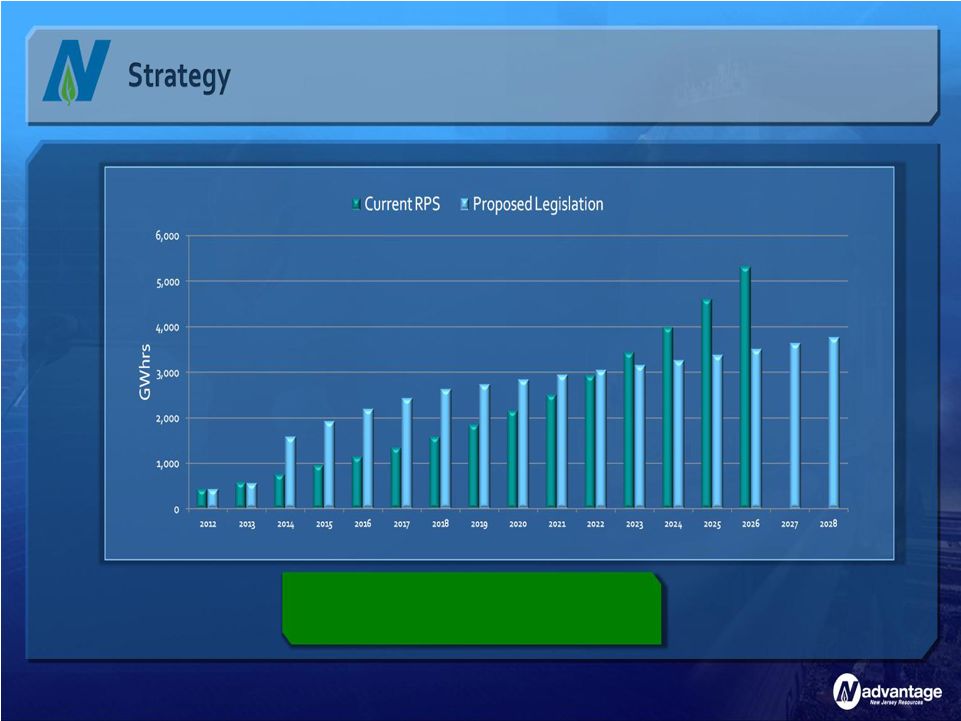 Overview
of
New
Jersey’s
Clean
Energy
Initiatives
(GWhrs)
Current proposed legislation supports
a
sustainable
solar
industry
in
New
Jersey
20 |
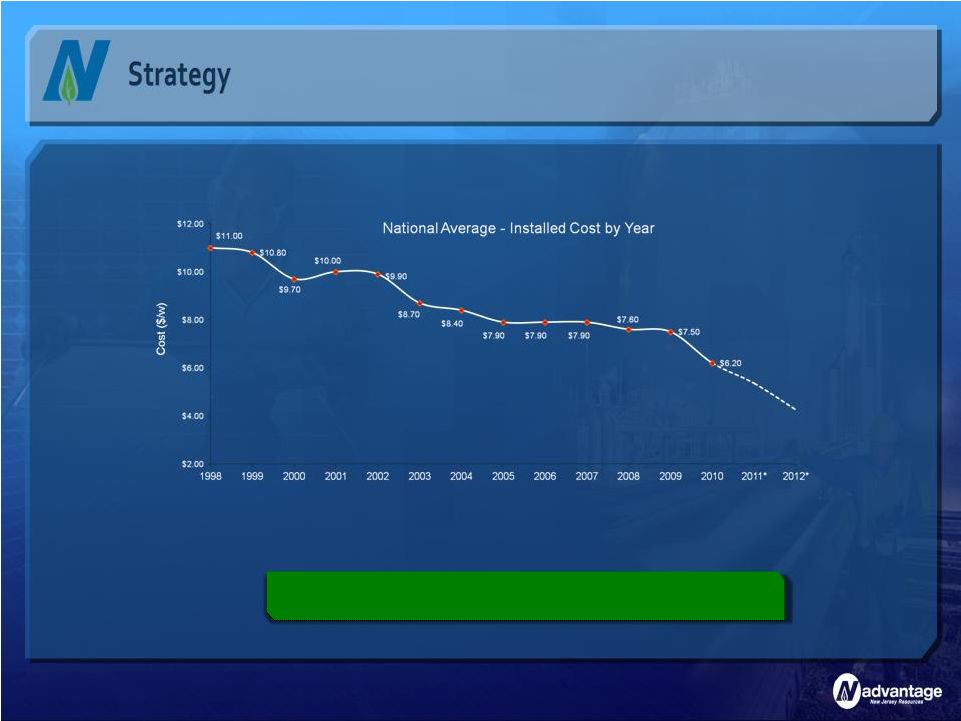 Declining
Solar Material Costs 21
Solar
industry
costs
are
reducing
to
competitive
levels
Source: Lawrence Berkeley National Laboratory
(Behind
the meter weighted average installed cost)
* Industry estimate for 2011 and 2012
|
 Fiscal 2012 Q2
results: 272 operational in fiscal 2012
Average size: 7.4 kilowatts
$7 million of capital deployed
Capital projection of
approximately $20.5 million in
fiscal 2012
To date, homeowners have
saved over $390,000 on their
electric bills annually
The Sunlight Advantage
Pipeline for residential solar
leases remains strong
Residential
22 |
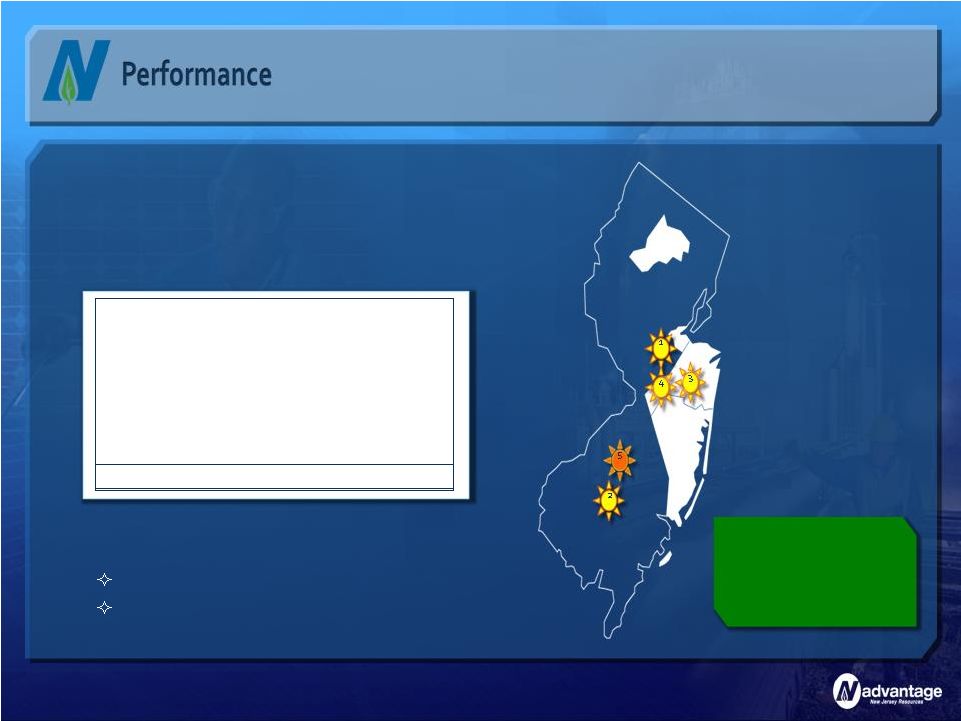 +
Expanding NJR brand beyond traditional service territory
+
Completed projects in fiscal 2011 and 2012:
The Sunlight Advantage
Commercial
+
$96.4 million placed in service in fiscal 2012
+
Medford project announced
$20 million, 6.7 MW project
In service date planned for Q1 fiscal 2013
Additional project
opportunities for
fiscal 2012 and
beyond
23
Project
Capital (MM)
MW
1 -
Adler
2 -
Vineland
3 -
Manalapan
4 -
McGraw Hill
Total
$24.4
22.3
17.2
59.5
$123.4
5.2
4.7
3.6
14.1
27.6 |
 +
Changes in volatility and increased shale production have
changed the competitive landscape
Successfully taking advantage of emerging opportunities
Physical participants with a conservative approach
remain profitable
+
Focus on long-option strategy and disciplined risk
management
Provide asset management services to producers
Focus on growing demand for electric generation
and petrochemicals
NJRES NFE
expected to be 5 to
15 percent of fiscal
2012 total
NJR Energy Services |
 Midstream
investments contributed $3.8 million in the first six-months of fiscal 2012;
Expected to contribute between 3 and 10 percent of total 2012 NFE
Steckman Ridge
50 percent joint venture with Spectra Energy
Up to 12 Bcf storage facility in southwestern Pennsylvania
66 percent of Steckman Ridge revenue from long-term contracts
Iroquois
5.53 percent ownership in pipeline from Canada to the northeast
NJR Energy Holdings |
 Home Services
Advantage Consistently delivers high-quality products and service levels
26
Serves nearly 140,000 customers with Premier
Service Plans, service contracts and equipment
installations
Geographic expansion
Currently marketing in Sussex, Warren and Hunterdon
counties
Fiscal 2011 revenue of more than $36 million, an
18 percent increase over last year
Expected to contribute 1-5 percent of fiscal 2012
NFE |
   Delivering
Results 27
($MM)
Company
2012
2011
Change
New Jersey Natural Gas
$70.9
$68.4
$2.5
NJR Energy Services
23.5
19.2
4.3
NJR Clean Energy
22.0
5.2
16.8
NJR Energy Holdings
3.8
3.9
(0.1)
NJR Home Services/Other
(0.8)
(0.5)
(0.3)
Total
$119.4
$96.2
$23.2
NFE per basic share
$2.88
$2.33
$0.55
FYTD March 31, |
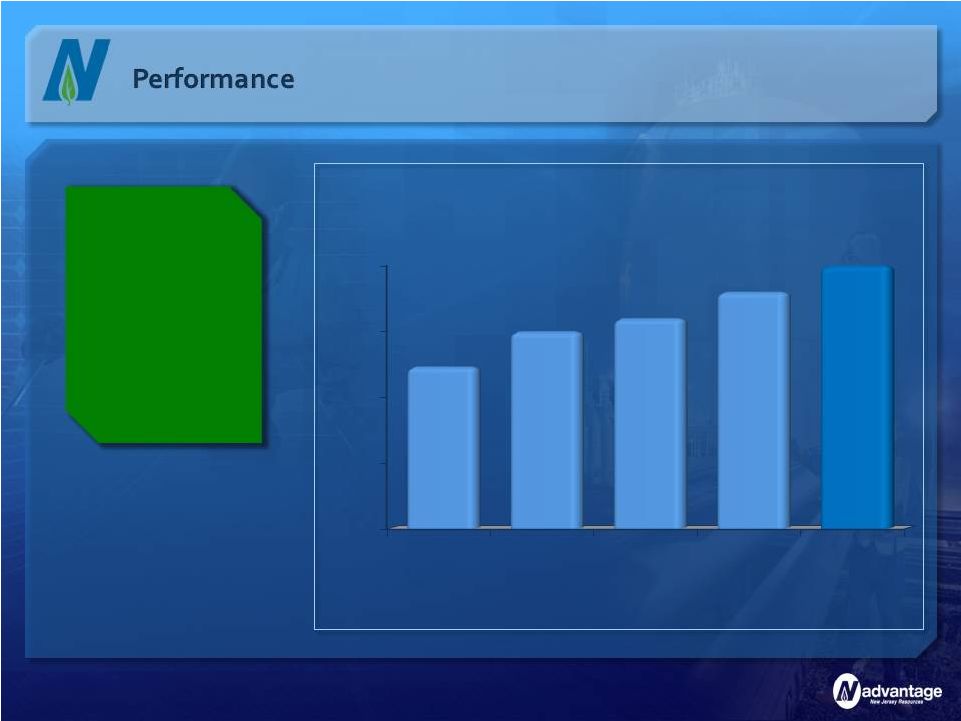 A Record of
Consistency NJR currently
estimates net
financial earnings
of $2.60 to $2.80
per basic share in
fiscal 2012
28
$1.50
$1.80
$2.10
$2.40
$2.70
2008
2009
2010
2011
2012
Current
Range
$2.24
$2.40
$2.46
$2.58
$2.60-$2.80
Net Financial Earnings |
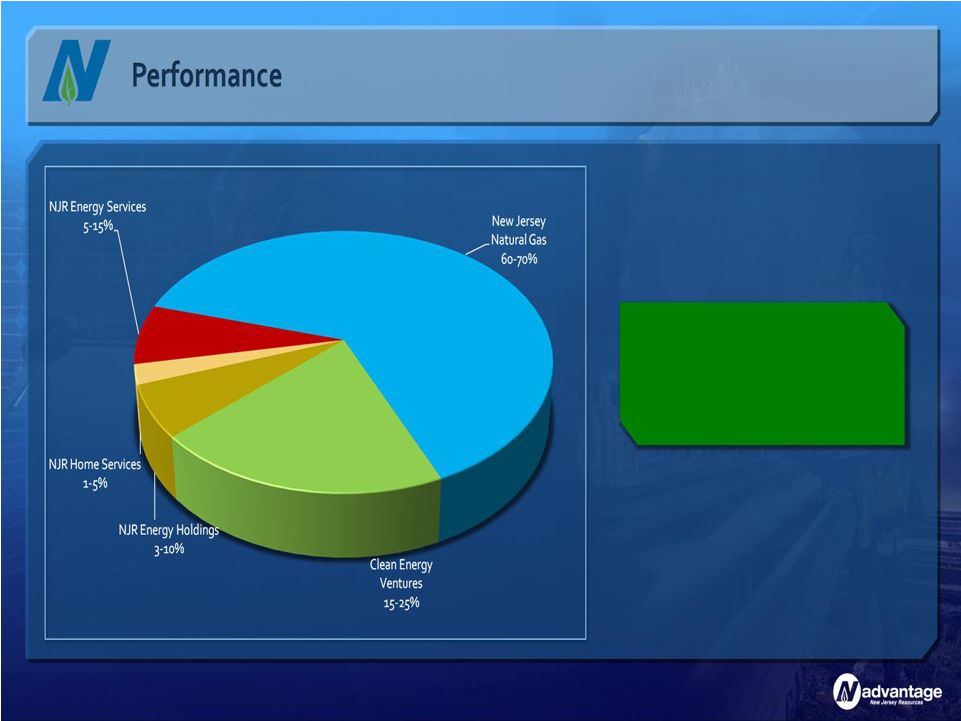 2012 Earnings
Guidance Infrastructure-based
businesses expected
to contribute about
90 percent of fiscal
2012 NFE
29 |
 Dividend
Growth 19
dividend
increase in 17 years;
1-year growth rate
of 5.6 percent
compared with 3.7
percent
for peers
* Effective January 3, 2012
** Based on current indicated dividend rates
30
th
$0.60
$0.80
$1.00
$1.20
$1.40
$1.60
2007
2008
2009
2010
2011
2012*
$1.01
$1.12
$1.24
$1.36
$1.44
$1.52 |
 Payout
Ratio* Strong reinvestment to
support future growth
* Based on NJR Net Financial Earnings
** Peer group average based on 2011 earnings estimates
and indicated dividend from Bloomberg. Peer group:
ATO, GAS, LG, NWN, PNY, SJI, SWX, VVC and WGL
31
0%
16%
33%
49%
65%
2005
2006
2007
2008
2009
2010
2011
Peer Group**
49%
51%
48%
50%
52%
55%
56%
61% |
 Capital
Expenditures Capital expenditures support future growth
32
($MM)
Fiscal 2012
2012
2011
Estimate
NJNG
New Customer
$10.8
$10.2
$20.6
System Integrity
11.6
10.8
33.3
AIP Projects
14.9
15.8
49.9
Technology & Other
5.1
6.8
8.4
Cost of Removal
6.8
3.6
9.0
Sub-total NJNG
49.2
47.2
121.2
Clean Energy Ventures
61.9
11.5
103.2
Other Non-Utility
0.3
0.4
0.7
Total
$111.4
$59.1
$225.1
FYTD March 31, |
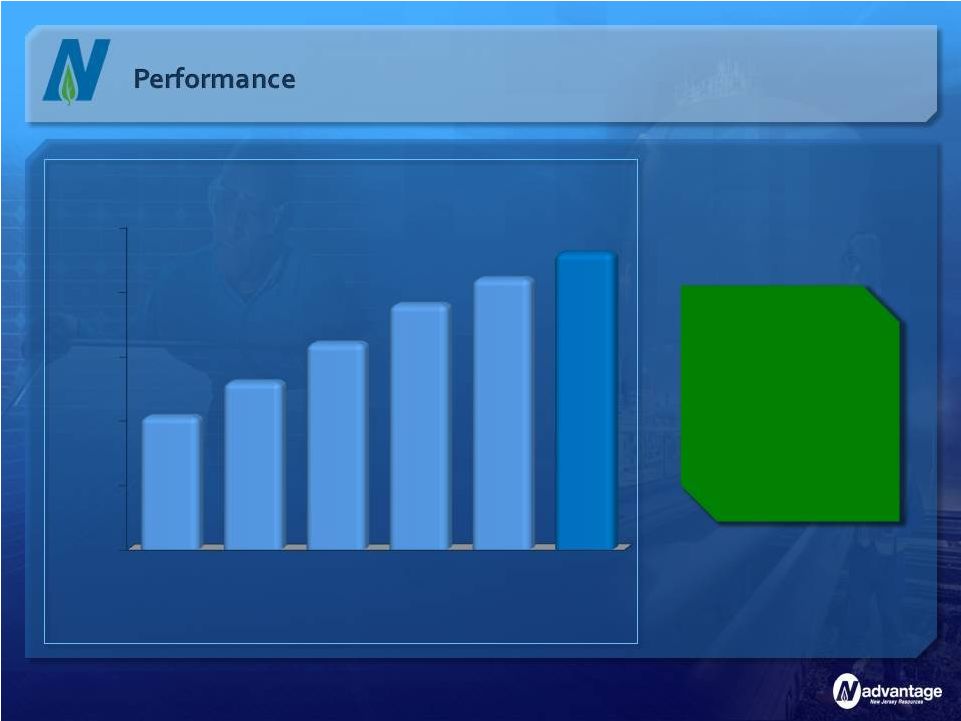
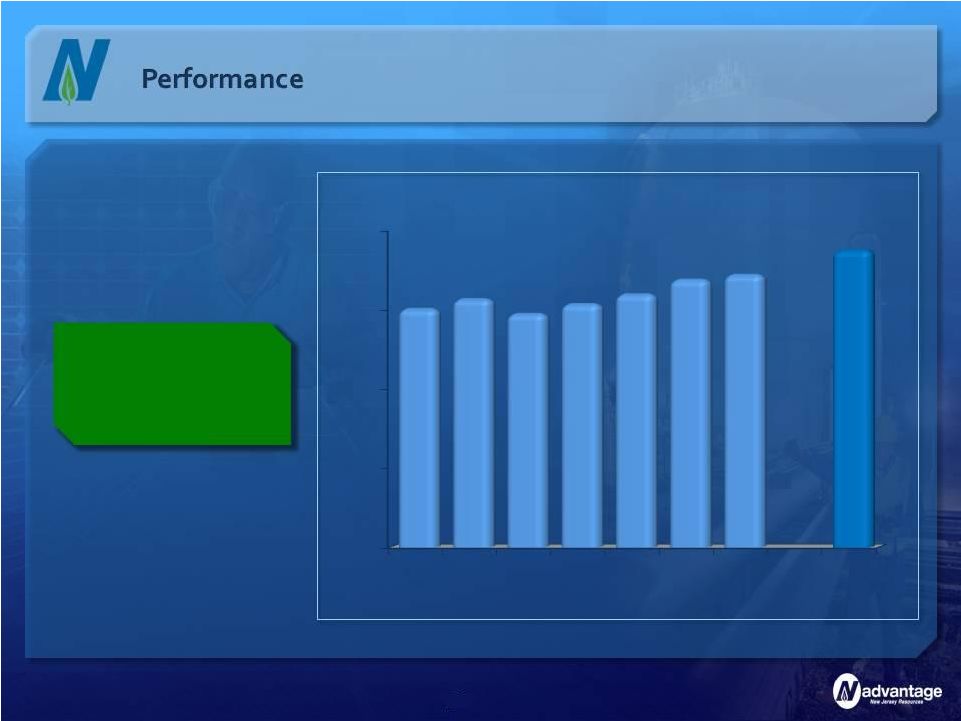
 Delivering
Premium Results We have the fundamentals in place to achieve continued
operational excellence, consistent results and long-term
growth
33
Strategy
Performance
Growth
Core utility provides
majority of
earnings
Pursue
complementary
non-regulated
businesses
Work constructively
with regulators
and policymakers
Maintain strong
financial profile
A track record of
consistent results
Increasing dividend
while maintaining
low payout ratio
Five-year total return
greater than
peer group average
A tradition of
outstanding
customer service
and safety
Core customer
growth
Regulated
infrastructure
opportunities
Clean energy
investments
Retail energy services |
 New Jersey
Resources A Premium Company Delivering Premium Results
New York Financial Community
June 13, 2012 |