Attached files
| file | filename |
|---|---|
| 8-K - FORM 8-K - FRANKLIN ELECTRIC CO INC | a20125308-k.htm |

KeyBanc Industrial Conference May 2012
Safe Harbor Statement "Safe Harbor" Statement under the Private Securities Litigation Reform Act of 1995. Any forward- looking statements contained herein, including those relating to market conditions or the Company's financial results, costs, expenses or expense reductions, profit margins, inventory levels, foreign currency translation rates, liquidity expectations, business goals and sales growth, involve risks and uncertainties, including but not limited to, risks and uncertainties with respect to general economic and currency conditions, various conditions specific to the Company's business and industry, weather conditions, new housing starts, market demand, competitive factors, changes in distribution channels, supply constraints, effect of price increases, raw material costs, technology factors, integration of acquisitions, litigation, government and regulatory actions, the Company's accounting policies, future trends, and other risks which are detailed in the Company's Securities and Exchange Commission filings, included in Item 1A of Part I of the Company's Annual Report on Form 10-K for the fiscal year ending December 31, 2011, Exhibit 99.1 attached thereto and in Item 1A of Part II of the Company's Quarterly Reports on Form 10-Q. These risks and uncertainties may cause actual results to differ materially from those indicated by the forward-looking statements. All forward-looking statements made herein are based on information currently available, and the Company assumes no obligation to update any forward-looking statements. 2

Topics Financial Summary --- Water Systems Growth --- Fueling Systems Growth 3

2011 Financial Highlights 2011 % +(-) Prior Sales $821 M + 15% Adjusted EPS1 $2.70 + 41% ROIC2 21.5% + 52% Net Debt/Capital 2% – 1 See company’s 10-K for reconciliation of adjusted EPS to GAAP EPS 2Operating income/net debt + equity 4

1st Quarter 2012 Financial Highlights 5 Q1 2012 % +(-) Prior Sales $202 M + 9% EPS $0.96 + 113% Adjusted EPS1 $0.60 + 30% 1 For reconciliation of adjusted EPS to GAAP EPS see company’s 10Q.
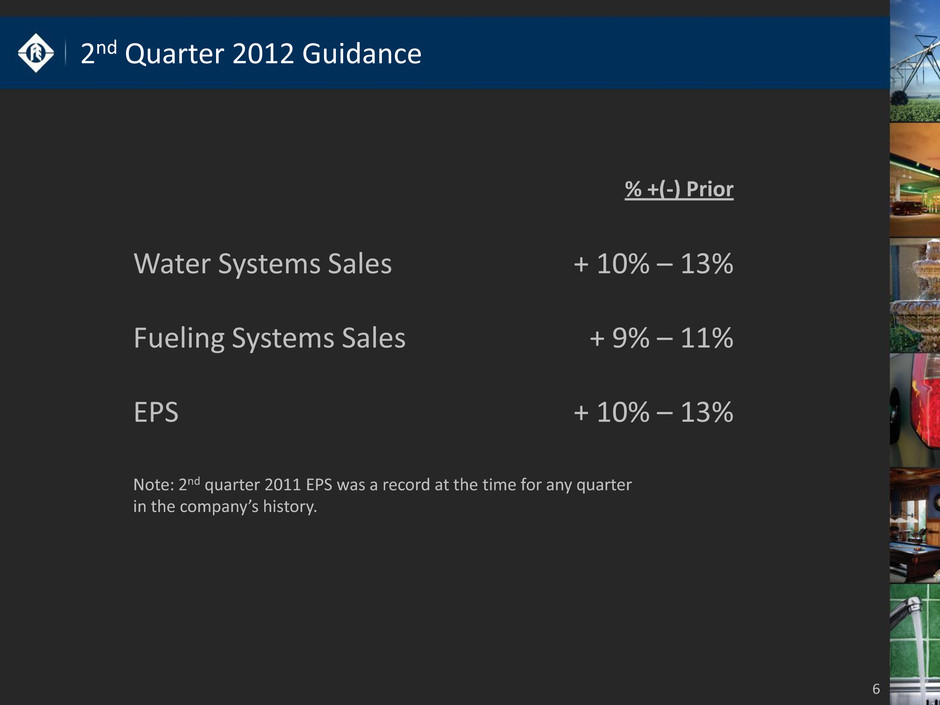
2nd Quarter 2012 Guidance 6 % +(-) Prior Water Systems Sales + 10% – 13% Fueling Systems Sales + 9% – 11% EPS + 10% – 13% Note: 2nd quarter 2011 EPS was a record at the time for any quarter in the company’s history.

2011 Global Business Segment Performance % of Franklin Sales Water Systems 80% Fueling Systems 20% Fueling Systems LTM 3/31/12 % +(-) Prior Sales $166 M + 16% Operating Income1 $32 M + 35% 1 Operating income after non-GAAP adjustments described on pages 16-17 of the company’s 2011 10-K Water Systems LTM 3/31/12 % +(-) Prior Sales $672 M + 13% Operating Income1 $112 M + 22% 7

Water Systems – Sales by End User Application 8 Irrigation & Industrial Water Pumping 40% Residential & Light Commercial Water Pumping 60% • Unplanned and non-discretionary replacement purchases represent 80%1 of sales • Availability takes precedence over pricing % of Franklin Water Sales 1 Franklin management estimate
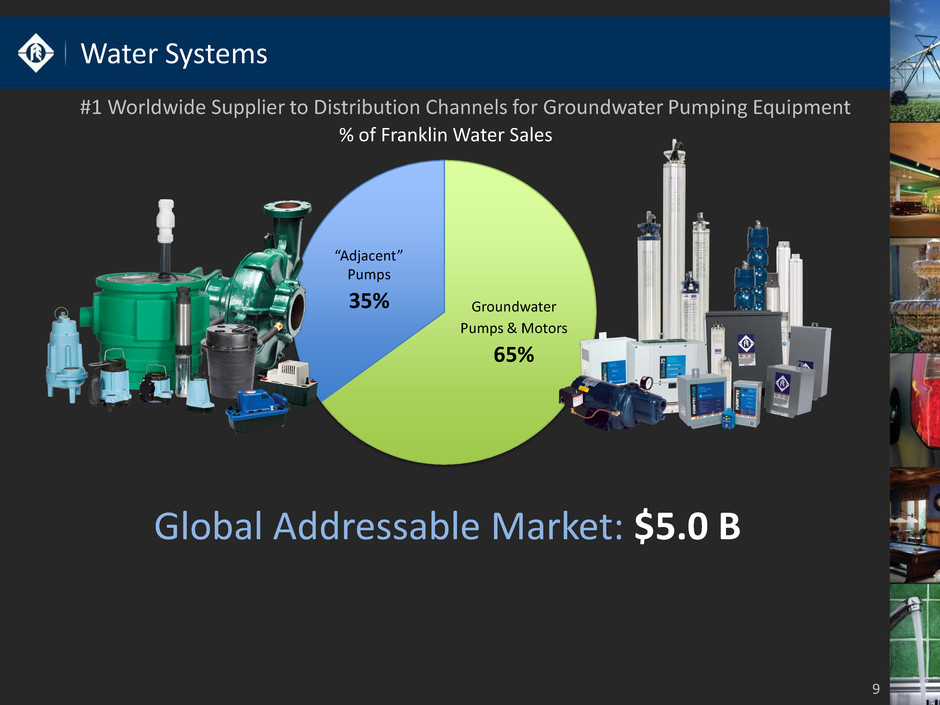
Water Systems 9 #1 Worldwide Supplier to Distribution Channels for Groundwater Pumping Equipment “Adjacent” Pumps 35% Groundwater Pumps & Motors 65% % of Franklin Water Sales Global Addressable Market: $5.0 B
Water Systems – Growth Strategy 10 Further extend product lines to sell through Franklin global distribution network --- Expand distribution network in developing regions

Water Systems – Growth: Extend Product Lines 11 Fill Out Product Catalogs to Displace Competitor Offerings in our Distribution Network # of Franklin Water Systems SKUs 2015 Projected 2004 8,000 43,000 2011 30,000 • Manufactured in existing facilities • Sold by existing sales force • Bolt-on acquisitions and internal development

Water Systems – Growth: Packaged Systems 12 Typical Oil/Gas Well Depth (2000 to 6000 feet) Oil and Gas Well Deliquification System Addressable Market (US, Canada, Australia): $0.5 B Typical Water Well Depth (40 to 600 feet) Gas Line Water Line

Water Systems – Growth: Packaged Systems 13 Solar Groundwater Pumping Systems Water Pressure Boosting/Control Systems Other Packaged Systems Development Initiatives 2011

Pioneer Pump Acquisition – March 2012 14 Mobile Pumping Systems - 2011 Sales - $70 M • Oil and gas fracking liquids • Dewatering mines and construction sites • Wastewater by-pass • Flood control

Water Systems – Growth in Developing Regions 15 2010 $0 $50 $75 $100 $125 $150 $175 $200 $225 2004 2005 2006 2007 2008 2009 $55 M $77 M $94 M $135 M $204 M $188 M $228 M 12% Share of Addressable Market % of Total Franklin Water Sales 16% 40% $25 2011 $270 M $250 $275 $ 5 5 M B as e $ 9 5 M Ac q u isi tio n s $ 1 2 0 M O rg an ic
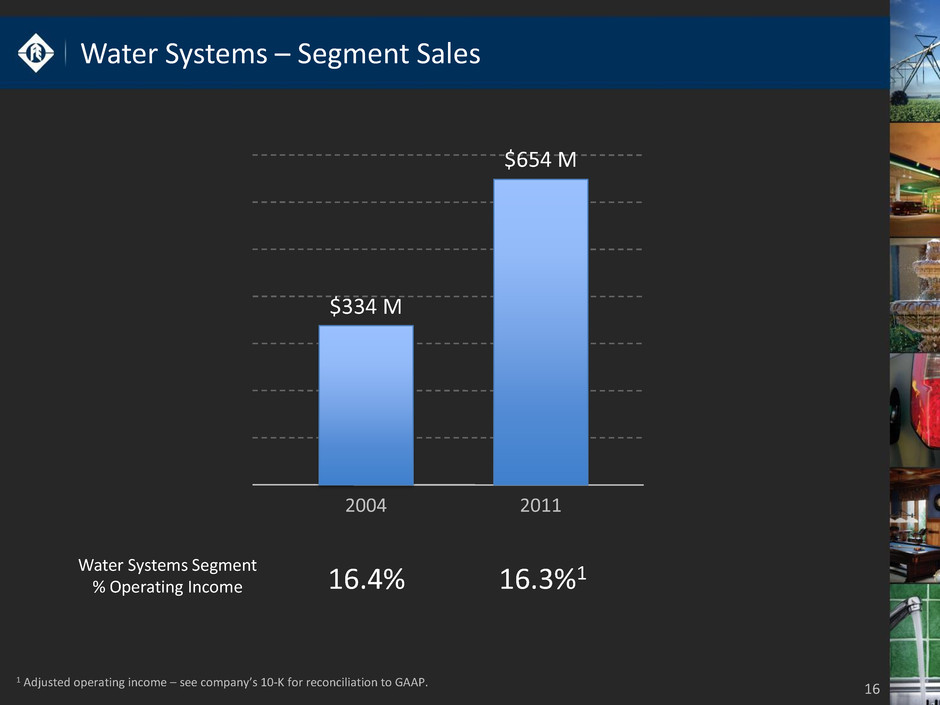
Water Systems – Segment Sales 16 2011 2004 $334 M $654 M Water Systems Segment % Operating Income 16.4% 16.3%1 1 Adjusted operating income – see company’s 10-K for reconciliation to GAAP.

Fueling Systems – Product Line Extensions 17 FE Petro Turbine and Drive 1990s FE Petro Turbine Pump 1980s Franklin Submersible Motor 1960s Adjacent Products 2000s International Expansion Global Addressable Market: $1.0 B
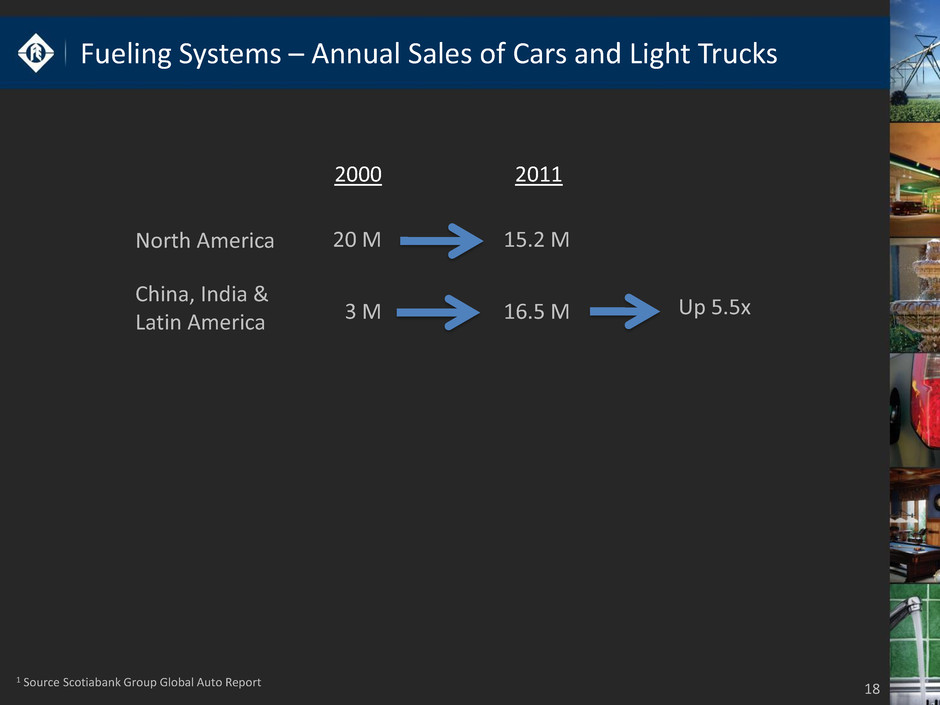
Fueling Systems – Annual Sales of Cars and Light Trucks 18 Up 5.5x North America 2000 2011 20 M 15.2 M 3 M 16.5 M China, India & Latin America 1 Source Scotiabank Group Global Auto Report

Fueling Systems – Installation of New Technologies 19 United States Rest of World Number of Stations 175,000 500,000 Stations with pressure pumping technology 97% 23% Stations with vapor recovery systems 80% 17% Stations with fuel management systems 75% 36% * Franklin management estimates International Markets Growth (on board)
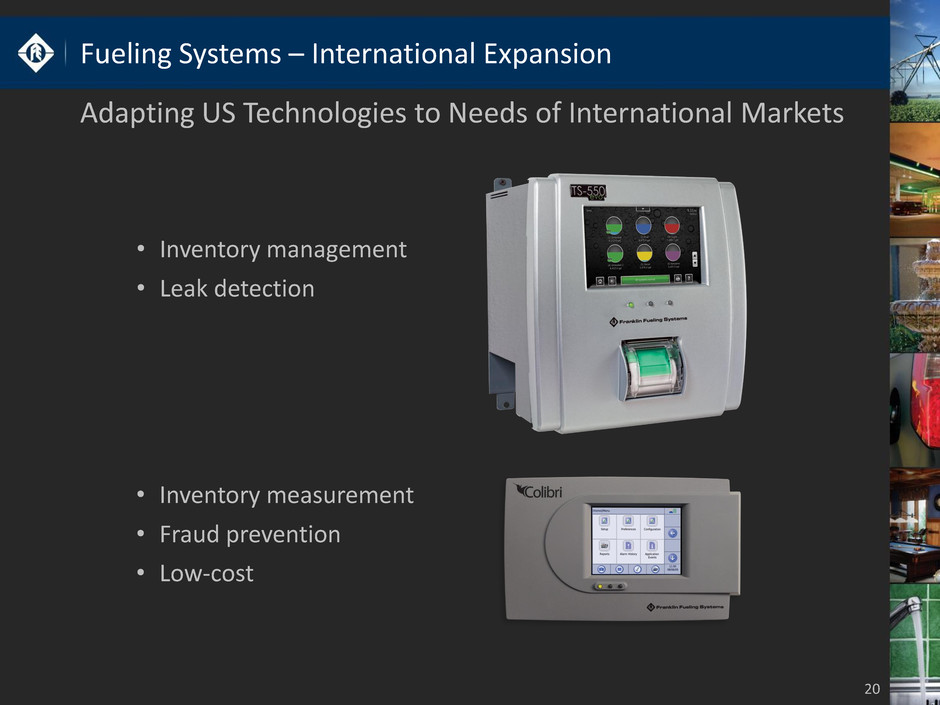
Fueling Systems – International Expansion 20 • Inventory management • Leak detection • Inventory measurement • Fraud prevention • Low-cost Adapting US Technologies to Needs of International Markets

Fueling Systems – International Expansion 21 Piping & Containment APT (UL Approved) UPP (EN Approved) Dispensing Systems Healy/Franklin System Omni Series Adapting US Technologies to Needs of International Markets
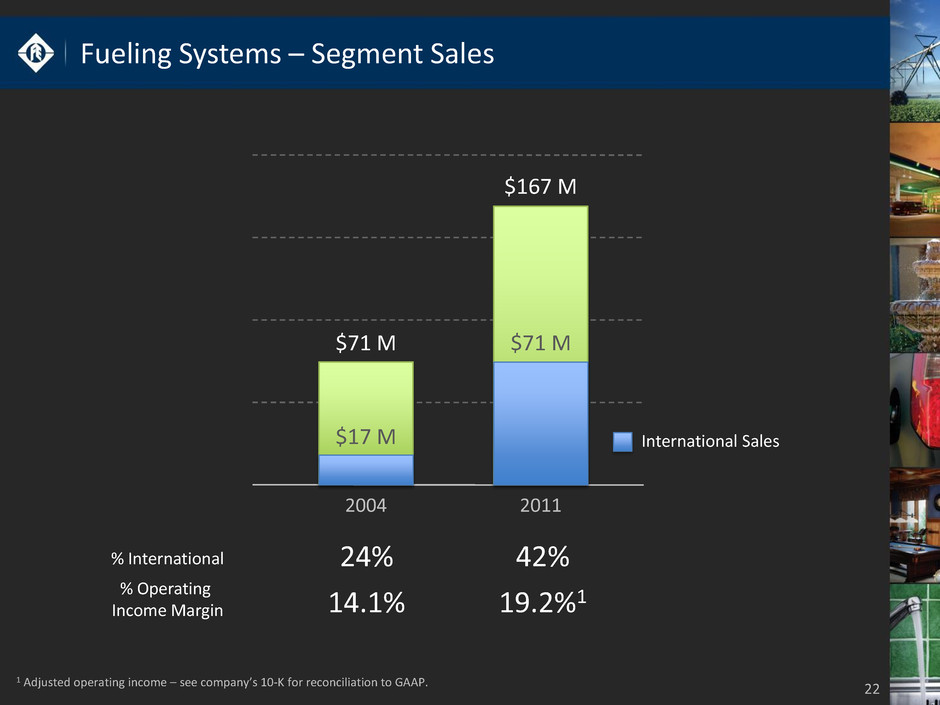
Fueling Systems – Segment Sales 22 2011 2004 $71 M $167 M $17 M $71 M % International 24% 42% % Operating Income Margin 14.1% 19.2%1 International Sales 1 Adjusted operating income – see company’s 10-K for reconciliation to GAAP.

Summary 23 Focused operating company --- Strong brand franchise and worldwide product leadership --- Ample headroom for organic growth in growing global markets --- Attractive bolt-on acquisition opportunities

KeyBanc Industrial Conference May 2012
