Attached files
| file | filename |
|---|---|
| EX-99.1 - EX-99.1 - BRADY CORP | d353881dex991.htm |
| 8-K - FORM 8-K - BRADY CORP | d353881d8k.htm |
Exhibit 99.2
| F'12 - Q3 Financial Results May 16, 2012 May 16, 2012 BRADY - FISCAL 2012 Q3 FINANCIAL RESULTS |
| FORWARD-LOOKING STATEMENTS BRADY - FISCAL 2012 Q3 FINANCIAL RESULTS 2 Brady believes that certain statements in this presentation are "forward-looking statements" within the meaning of the Private Securities Litigation Reform Act of 1995. All statements related to future, not past, events included in this presentation, including, without limitation, statements regarding Brady's future financial position, business strategy, targets, projected sales, costs, earnings, capital expenditures, debt levels and cash flows, and plans and objectives of management for future operations are forward-looking statements. When used in this presentation, words such as "may," "will," "expect," "intend," "estimate," "anticipate," "believe," "should," "project" or "plan" or similar terminology are generally intended to identify forward-looking statements. These forward-looking statements by their nature address matters that are, to different degrees, uncertain and are subject to risks, assumptions and other factors, some of which are beyond Brady's control, that could cause actual results to differ materially from those expressed or implied by such forward-looking statements. For Brady, uncertainties arise from the length or severity of the current worldwide economic downturn or timing or strength of a subsequent recovery; future financial performance of major markets Brady serves, which include, without limitation, telecommunications, manufacturing, electrical, construction, laboratory, education, governmental, public utility, computer, transportation; difficulties in making and integrating acquisitions; risks associated with newly acquired businesses; Brady's ability to develop and successfully market new products; changes in the supply of, or price for, parts and components; increased price pressure from suppliers and customers; fluctuations in currency rates versus the US dollar; unforeseen tax consequences; potential write-offs of Brady's substantial intangible assets; Brady's ability to retain significant contracts and customers; risks associated with international operations; Brady's ability to maintain compliance with its debt covenants; technology changes; business interruptions due to implementing business systems; environmental, health and safety compliance costs and liabilities; future competition; interruptions to sources of supply; Brady's ability to realize cost savings from operating initiatives; difficulties associated with exports; risks associated with restructuring plans; risks associated with obtaining governmental approvals and maintaining regulatory compliance; and numerous other matters of national, regional and global scale, including those of a political, economic, business, competitive and regulatory nature contained from time to time in Brady's U.S. Securities and Exchange Commission filings, including, but not limited to, those factors listed in the "Risk Factors" section located in Item 1A of Part I of Brady's Form 10-K for the year ended July 31, 2011. These uncertainties may cause Brady's actual future results to be materially different than those expressed in its forward-looking statements. Brady does not undertake to update its forward-looking statements except as required by law. We refer to certain non-GAAP financial measures in this presentation. Reconciliations of these non-GAAP financial measures to the most directly comparable GAAP financial measures can be found within this presentation. |
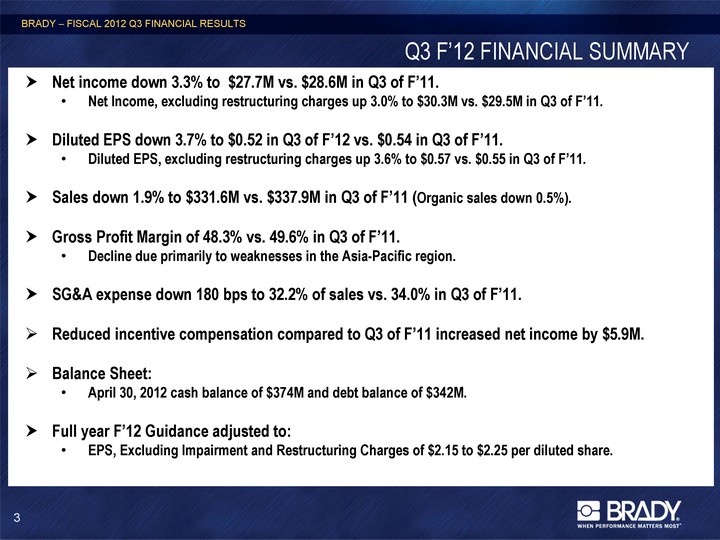
| Q3 F'12 FINANCIAL SUMMARY Net income down 3.3% to $27.7M vs. $28.6M in Q3 of F'11. Net Income, excluding restructuring charges up 3.0% to $30.3M vs. $29.5M in Q3 of F'11. Diluted EPS down 3.7% to $0.52 in Q3 of F'12 vs. $0.54 in Q3 of F'11. Diluted EPS, excluding restructuring charges up 3.6% to $0.57 vs. $0.55 in Q3 of F'11. Sales down 1.9% to $331.6M vs. $337.9M in Q3 of F'11 (Organic sales down 0.5%). Gross Profit Margin of 48.3% vs. 49.6% in Q3 of F'11. Decline due primarily to weaknesses in the Asia-Pacific region. SG&A expense down 180 bps to 32.2% of sales vs. 34.0% in Q3 of F'11. Reduced incentive compensation compared to Q3 of F'11 increased net income by $5.9M. Balance Sheet: April 30, 2012 cash balance of $374M and debt balance of $342M. Full year F'12 Guidance adjusted to: EPS, Excluding Impairment and Restructuring Charges of $2.15 to $2.25 per diluted share. BRADY - FISCAL 2012 Q3 FINANCIAL RESULTS 3 |
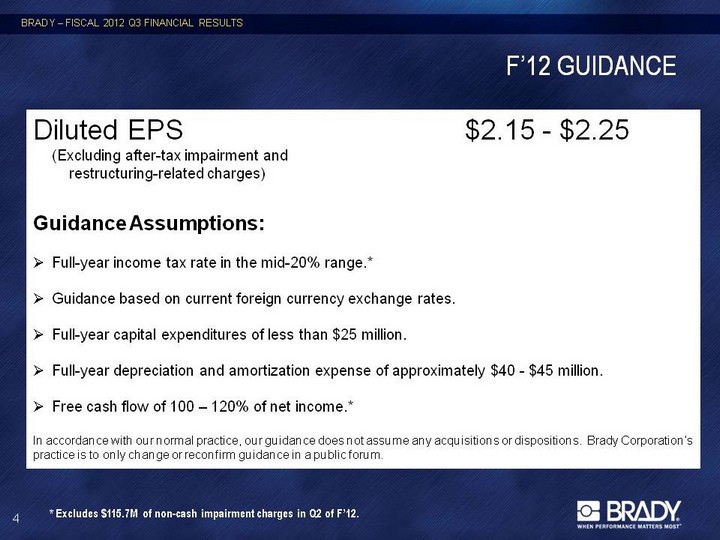
| F'12 GUIDANCE BRADY - FISCAL 2012 Q3 FINANCIAL RESULTS 4 Diluted EPS $2.15 - $2.25 (Excluding after-tax impairment and restructuring-related charges) Guidance Assumptions: Full-year income tax rate in the mid-20% range.* Guidance based on current foreign currency exchange rates. Full-year capital expenditures of less than $25 million. Full-year depreciation and amortization expense of approximately $40 - $45 million. Free cash flow of 100 - 120% of net income.* In accordance with our normal practice, our guidance does not assume any acquisitions or dispositions. Brady Corporation's practice is to only change or reconfirm guidance in a public forum. * Excludes $115.7M of non-cash impairment charges in Q2 of F'12. |
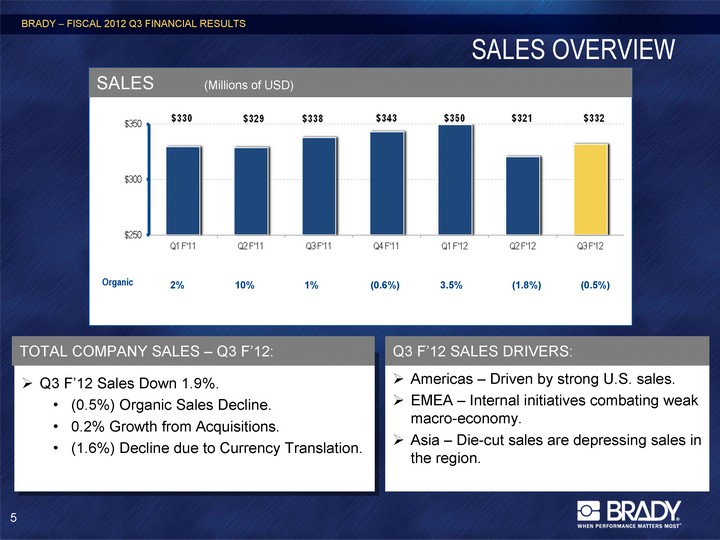
| SALES OVERVIEW Organic 2% 10% 1% (0.6%) 3.5% (1.8%) (0.5%) BRADY - FISCAL 2012 Q3 FINANCIAL RESULTS 5 Q3 F'12 Sales Down 1.9%. (0.5%) Organic Sales Decline. 0.2% Growth from Acquisitions. (1.6%) Decline due to Currency Translation. Americas - Driven by strong U.S. sales. EMEA - Internal initiatives combating weak macro-economy. Asia - Die-cut sales are depressing sales in the region. TOTAL COMPANY SALES - Q3 F'12: Q3 F'12 SALES DRIVERS: SALES (Millions of USD) |
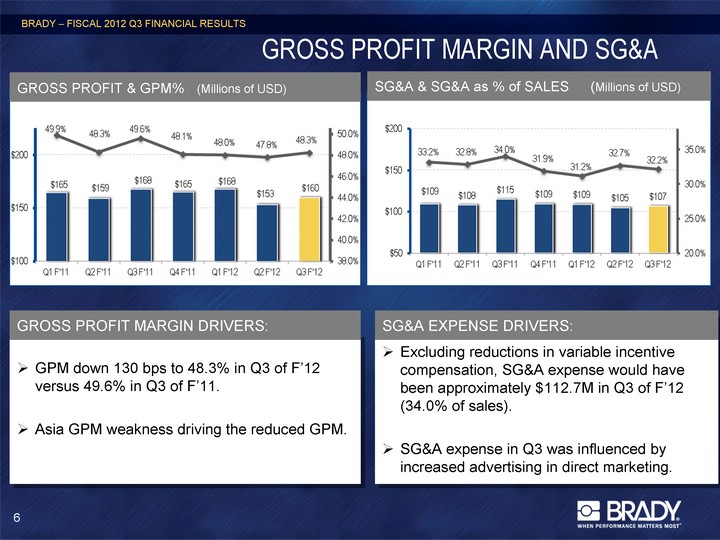
| GROSS PROFIT MARGIN AND SG&A BRADY - FISCAL 2012 Q3 FINANCIAL RESULTS 6 GROSS PROFIT & GPM% (Millions of USD) SG&A & SG&A as % of SALES (Millions of USD) GPM down 130 bps to 48.3% in Q3 of F'12 versus 49.6% in Q3 of F'11. Asia GPM weakness driving the reduced GPM. GROSS PROFIT MARGIN DRIVERS: Excluding reductions in variable incentive compensation, SG&A expense would have been approximately $112.7M in Q3 of F'12 (34.0% of sales). SG&A expense in Q3 was influenced by increased advertising in direct marketing. SG&A EXPENSE DRIVERS: |
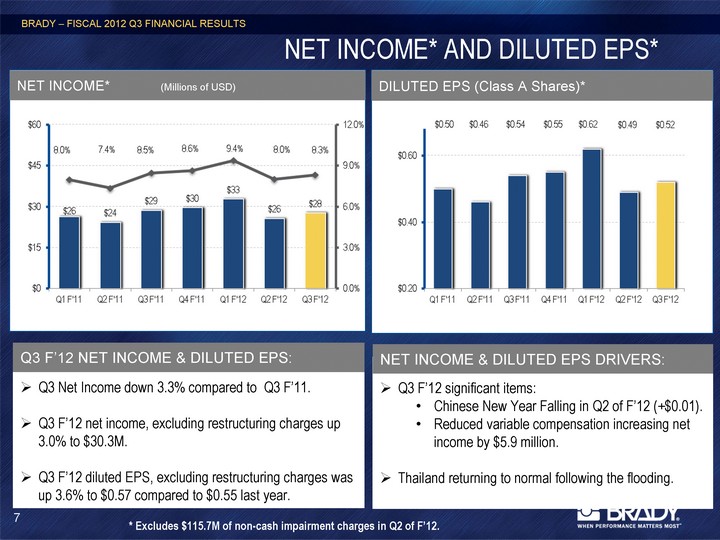
| NET INCOME* AND DILUTED EPS* Q3 Net Income down 3.3% compared to Q3 F'11. Q3 F'12 net income, excluding restructuring charges up 3.0% to $30.3M. Q3 F'12 diluted EPS, excluding restructuring charges was up 3.6% to $0.57 compared to $0.55 last year. Q3 F'12 significant items: Chinese New Year Falling in Q2 of F'12 (+$0.01). Reduced variable compensation increasing net income by $5.9 million. Thailand returning to normal following the flooding. BRADY - FISCAL 2012 Q3 FINANCIAL RESULTS 7 NET INCOME* (Millions of USD) DILUTED EPS (Class A Shares)* Q3 F'12 NET INCOME & DILUTED EPS: NET INCOME & DILUTED EPS DRIVERS: * Excludes $115.7M of non-cash impairment charges in Q2 of F'12. |
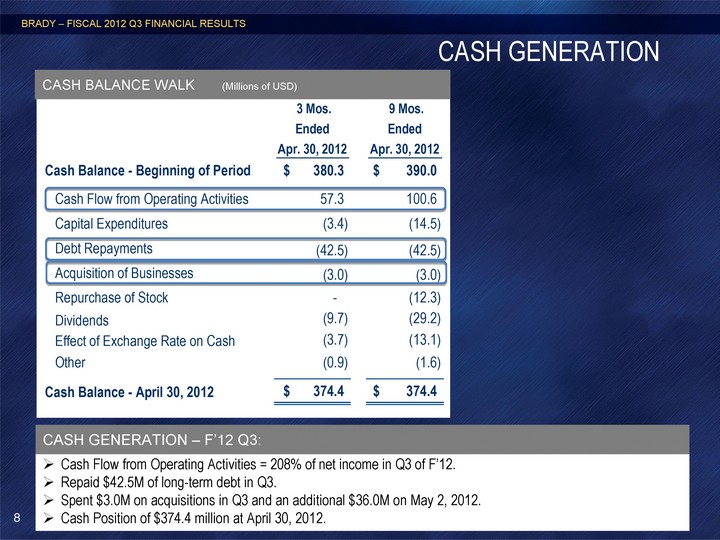
| CASH GENERATION BRADY - FISCAL 2012 Q3 FINANCIAL RESULTS 8 Cash Flow from Operating Activities = 208% of net income in Q3 of F'12. Repaid $42.5M of long-term debt in Q3. Spent $3.0M on acquisitions in Q3 and an additional $36.0M on May 2, 2012. Cash Position of $374.4 million at April 30, 2012. CASH BALANCE WALK (Millions of USD) CASH GENERATION - F'12 Q3: |
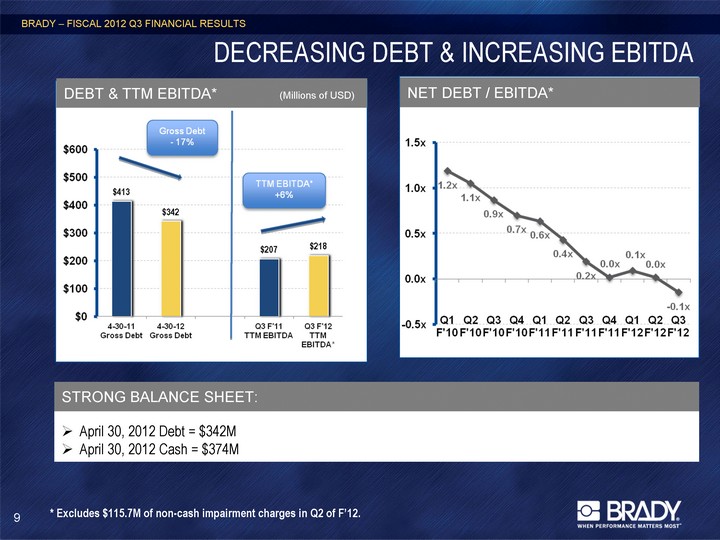
| DECREASING DEBT & INCREASING EBITDA BRADY - FISCAL 2012 Q3 FINANCIAL RESULTS NET DEBT / EBITDA* April 30, 2012 Debt = $342M April 30, 2012 Cash = $374M STRONG BALANCE SHEET: 9 DEBT & TTM EBITDA* (Millions of USD) * Excludes $115.7M of non-cash impairment charges in Q2 of F'12. |
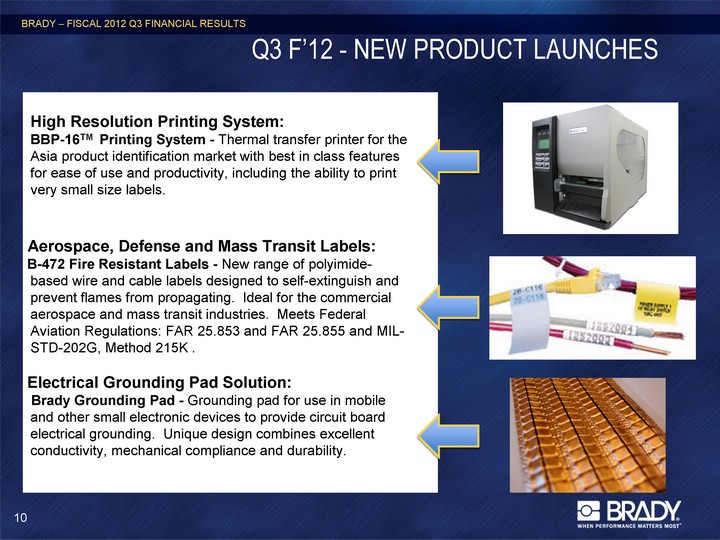
| Q3 F'12 - NEW PRODUCT LAUNCHES High Resolution Printing System: BBP-16TM Printing System - Thermal transfer printer for the Asia product identification market with best in class features for ease of use and productivity, including the ability to print very small size labels. Aerospace, Defense and Mass Transit Labels: B-472 Fire Resistant Labels - New range of polyimide- based wire and cable labels designed to self-extinguish and prevent flames from propagating. Ideal for the commercial aerospace and mass transit industries. Meets Federal Aviation Regulations: FAR 25.853 and FAR 25.855 and MIL- STD-202G, Method 215K . Electrical Grounding Pad Solution: Brady Grounding Pad - Grounding pad for use in mobile and other small electronic devices to provide circuit board electrical grounding. Unique design combines excellent conductivity, mechanical compliance and durability. BRADY - FISCAL 2012 Q3 FINANCIAL RESULTS 10 |
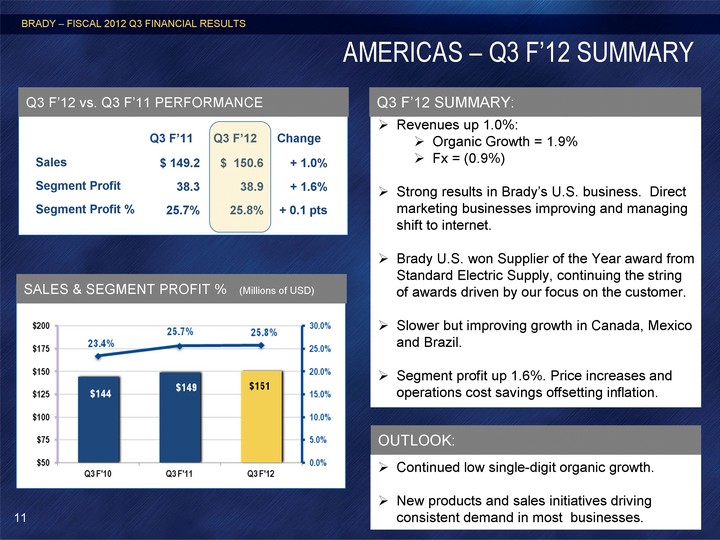
| AMERICAS - Q3 F'12 SUMMARY Q3 F'11 Q3 F'12 Change Sales $ 149.2 $ 150.6 + 1.0% Segment Profit 38.3 38.9 + 1.6% Segment Profit % 25.7% 25.8% + 0.1 pts BRADY - FISCAL 2012 Q3 FINANCIAL RESULTS 11 SALES & SEGMENT PROFIT % (Millions of USD) Q3 F'12 vs. Q3 F'11 PERFORMANCE Revenues up 1.0%: Organic Growth = 1.9% Fx = (0.9%) Strong results in Brady's U.S. business. Direct marketing businesses improving and managing shift to internet. Brady U.S. won Supplier of the Year award from Standard Electric Supply, continuing the string of awards driven by our focus on the customer. Slower but improving growth in Canada, Mexico and Brazil. Segment profit up 1.6%. Price increases and operations cost savings offsetting inflation. Q3 F'12 SUMMARY: Continued low single-digit organic growth. New products and sales initiatives driving consistent demand in most businesses. OUTLOOK: |
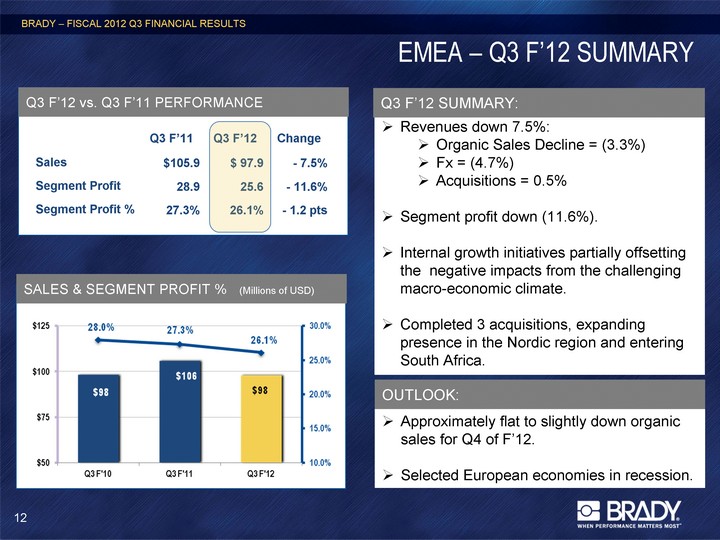
| EMEA - Q3 F'12 SUMMARY Q3 F'11 Q3 F'12 Change Sales $105.9 $ 97.9 - 7.5% Segment Profit 28.9 25.6 - 11.6% Segment Profit % 27.3% 26.1% - 1.2 pts BRADY - FISCAL 2012 Q3 FINANCIAL RESULTS 12 SALES & SEGMENT PROFIT % (Millions of USD) Q3 F'12 vs. Q3 F'11 PERFORMANCE Revenues down 7.5%: Organic Sales Decline = (3.3%) Fx = (4.7%) Acquisitions = 0.5% Segment profit down (11.6%). Internal growth initiatives partially offsetting the negative impacts from the challenging macro-economic climate. Completed 3 acquisitions, expanding presence in the Nordic region and entering South Africa. Q3 F'12 SUMMARY: Approximately flat to slightly down organic sales for Q4 of F'12. Selected European economies in recession. OUTLOOK: |
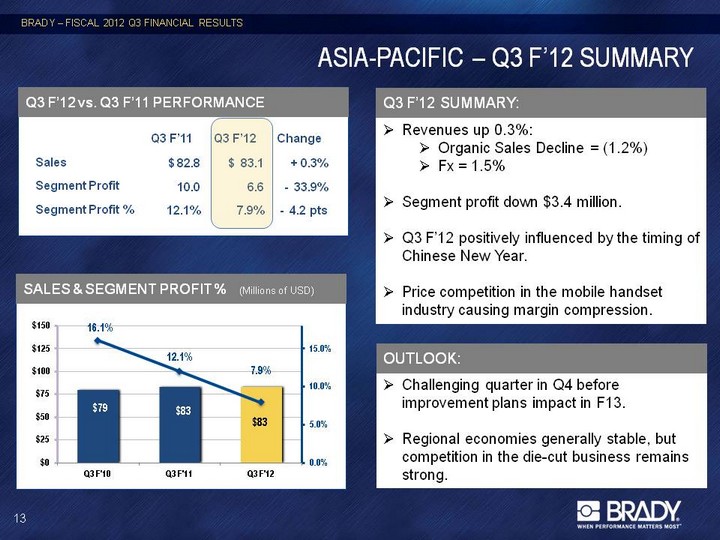
| ASIA-PACIFIC - Q3 F'12 SUMMARY Q3 F'11 Q3 F'12 Change Sales $ 82.8 $ 83.1 + 0.3% Segment Profit 10.0 6.6 - 33.9% Segment Profit % 12.1% 7.9% - 4.2 pts BRADY - FISCAL 2012 Q3 FINANCIAL RESULTS 13 SALES & SEGMENT PROFIT % (Millions of USD) Q3 F'12 vs. Q3 F'11 PERFORMANCE Revenues up 0.3%: Organic Sales Decline = (1.2%) Fx = 1.5% Segment profit down $3.4 million. Q3 F'12 positively influenced by the timing of Chinese New Year. Price competition in the mobile handset industry causing margin compression. Q3 F'12 SUMMARY: Challenging quarter in Q4 before improvement plans impact in F13. Regional economies generally stable, but competition in the die-cut business remains strong. OUTLOOK: |

| INVESTOR RELATIONS Brady Contact: Aaron Pearce Investor Relations 414-438-6895 Aaron_Pearce@Bradycorp.com See our web site at www.investor.bradycorp.com BRADY - FISCAL 2012 Q3 FINANCIAL RESULTS 14 |
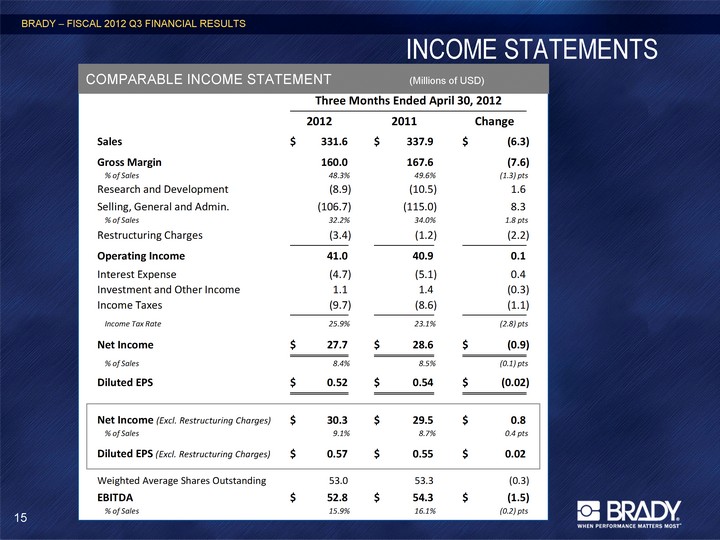
| INCOME STATEMENTS BRADY - FISCAL 2012 Q3 FINANCIAL RESULTS 15 COMPARABLE INCOME STATEMENT (Millions of USD) |
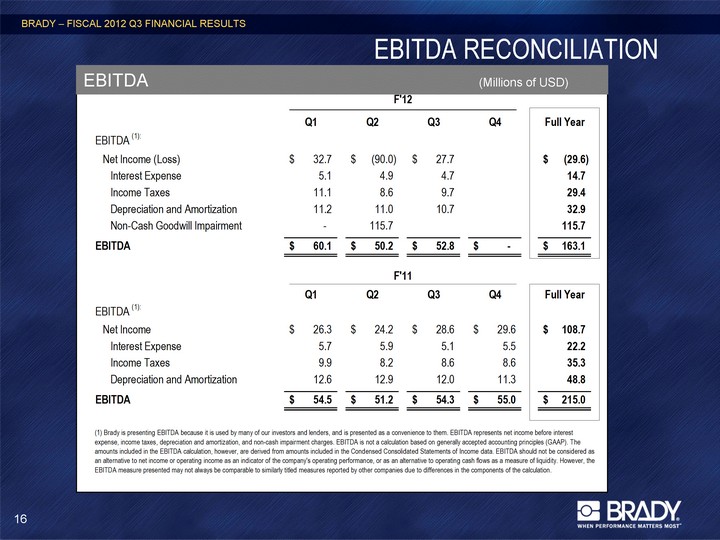
| EBITDA RECONCILIATION BRADY - FISCAL 2012 Q3 FINANCIAL RESULTS 16 EBITDA (Millions of USD) |