Attached files
| file | filename |
|---|---|
| 8-K - FORM 8K - CenterState Bank Corp | d351888d8k.htm |
 Investor Presentation
First Quarter 2012
Exhibit 99.1 |
 This presentation contains forward-looking statements, as defined by Federal
Securities
Laws,
relating
to
present
or
future
trends
or
factors
affecting
the
operations, markets and products of CenterState Banks, Inc. (CSFL). These
statements
are
provided
to
assist
in
the
understanding
of
future
financial
performance. Any such statements are based on current expectations and involve a
number of risks and uncertainties. For a discussion of factors that may
cause such forward-looking statements to differ materially from actual
results, please refer to CSFL’s most recent Form 10-Q and Form
10-K filed with the Securities Exchange Commission.
CSFL undertakes no obligation to release revisions to these forward-looking
statements or reflect events or circumstances after the date of this
presentation. Forward Looking Statement
2 |
 Birmingham
Atlanta
Winston-Salem
Tamp
a
Winter Haven
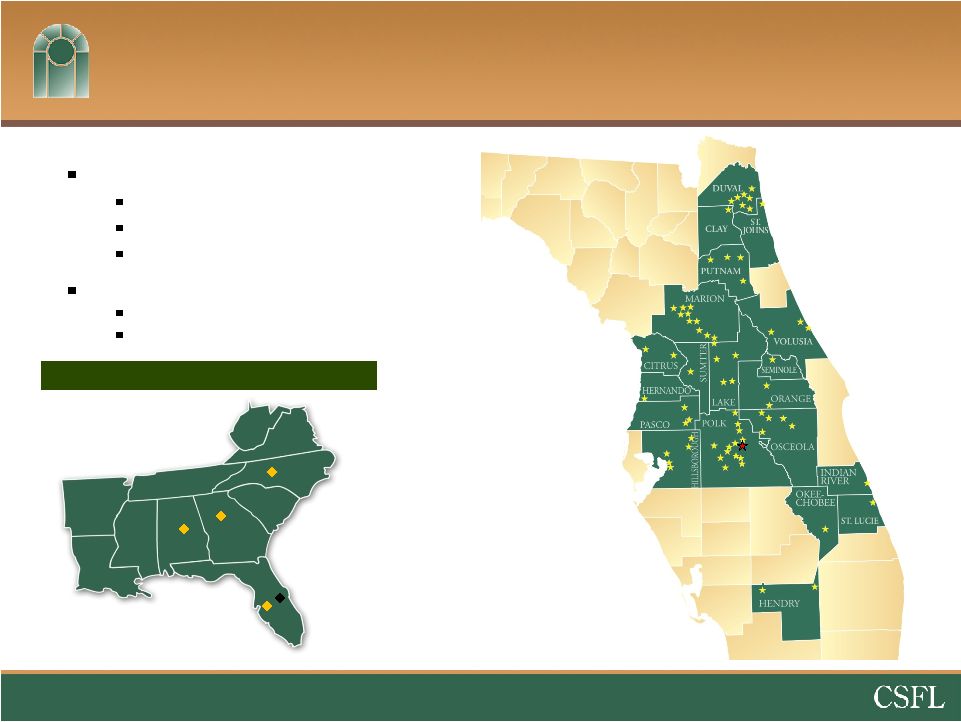
Corporate Overview
3
Correspondent Banking market
Data as of 3/31/12
Headquartered in Davenport, FL
$2.5 billion in assets
$1.5 billion in loans
$2.1 billion in deposits
Company formed: June 2000
2 Subsidiary Banks
Valrico merger in 2012 |
 Conservative Balance Sheet
•
CAPITAL -
Total Risk-Based Capital Ratio –
17.6%
•
LIQUIDITY -
Loans / Assets -
58%
•
LOANS WITH THIRD PARTY PROTECTION –
40%
2
•
24%
of loans are covered by loss sharing agreements with the FDIC
•
16%
are subject to “Put Back”
agreements with TD Bank or The Hartford
Insurance Co.
•
ASSETS WITH THIRD PARTY PROTECTION –
50%
1,2
•
41%
-
Backed by the United States
•
9%
-
Backed by TD or The Hartford
•
LOW CONCENTRATION LEVELS (excludes FDIC covered loans)
•
CRE at 109%
of capital vs. 300% guidance
•
CD&L at 25%
of capital vs. 100% guidance
4
1.
Includes
cash
and
cash
equivalents,
AFS
securities
issued
by
U.S.
Government
Sponsored
Entities, FDIC covered assets, and FHLB and FRB stock.
2. Data as of 3/31/12 |
 Opportunistic through the Crisis
5
1) FDIC Acquisitions
•
Ocala National Bank
•
Olde Cypress Community Bank
•
Independent National Bank of Ocala
•
Community National Bank of Bartow
•
Central Florida State Bank
•
First Guaranty Bank & Trust Co.
3) New Fee-Based Business Lines
•
Correspondent Banking Division
•
Prepaid Card Division
•
Wealth Management Division
•
Trust Department
2) Non –
FDIC Acquisitions
•
TD Bank divesture in Putnam
•
Federal Trust Acquisition from
The Hartford Insurance
Company
4) Strategic Expansion &
Management Lift-Outs
•
Vero Beach
•
Okeechobee
•
Jacksonville |
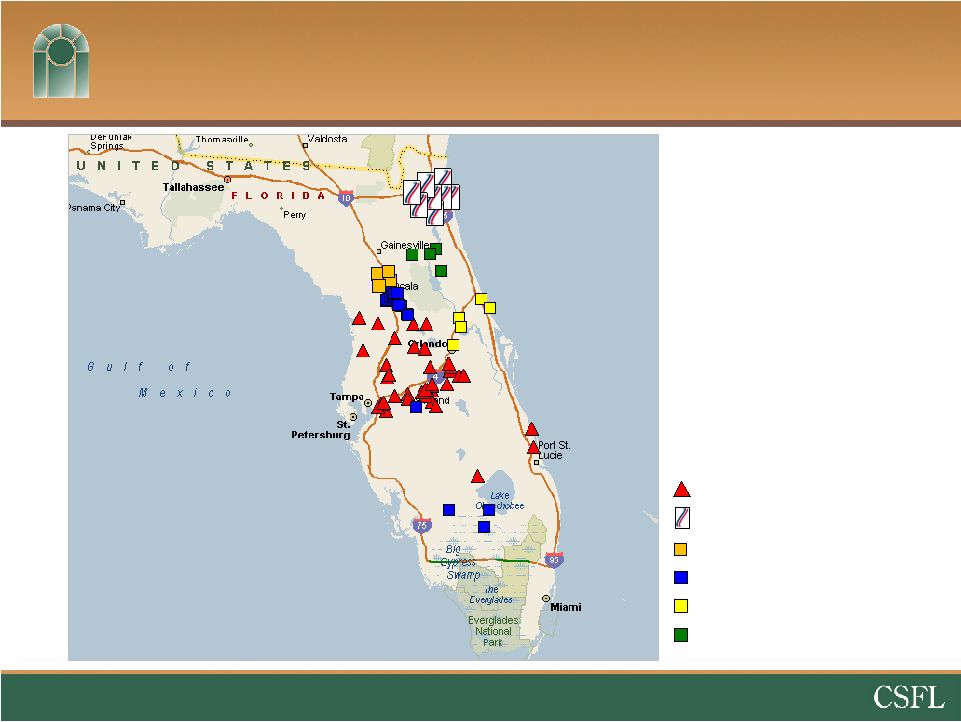 Recent M&A Transactions
6
Source: SNL Financial
Legacy CSFL Branch
First Guaranty Bank (FDIC)
Central FL State Bank (FDIC)
Three FDIC Acquisitions (3Q 2010)
Federal Trust Acquisition (Nov 2011)
TD Branch Acquisition (Jan 2011)
Jacksonville |
 7
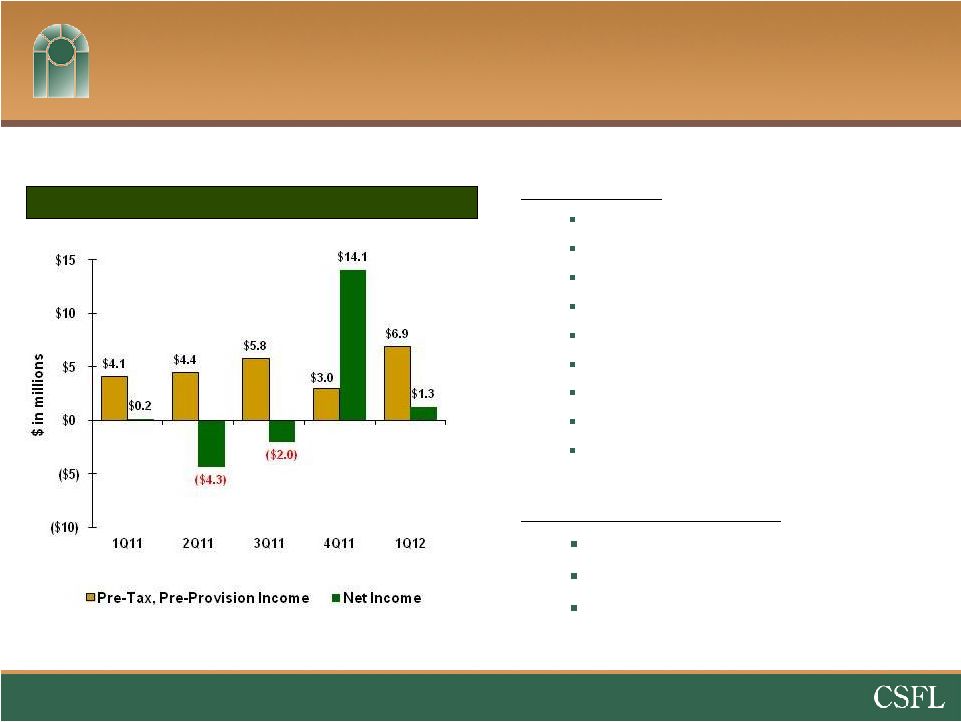
Profitability Metrics
PTPP & Net Income –
trailing 5 quarters
1. Pre-tax pre-provision income (“PTPP”) is a non-GAAP measure that if defined as income (loss) before
income tax excluding provision for loan losses, gain on sale of available for sale
securities, other credit related costs including losses on repossessed real
estate and other assets, other foreclosure related expenses., and
non-recurring items. 1Q12 Results:
$0.04/sh on $1.3M net income
Margin expansion to 4.03%
Lower provision expense
Higher bond sales revenue
Gain on sale of AFS securities –
$602K
Bargain purchase gain –
$453K –
Belleview
Goodwill + other intangibles –
FGB
Acquisition related expenses –
$1.9M
PTPP improvement
Profitability Components:
Credit Cost
Net Interest Margin
Operating Efficiencies
1 |
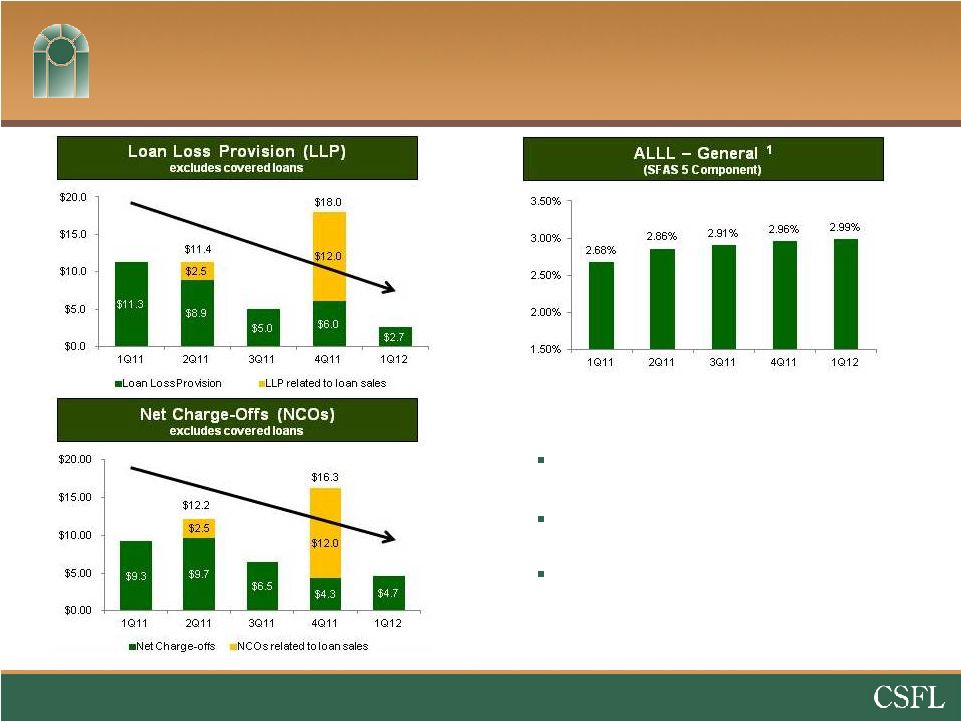 Credit Cost
8
1. Excludes FDIC covered loans and loans with putback options.
Provision expense trending downward
Net charge-offs trending downward
General allowance for loan losses
(SFAS 5 component) –
steady |
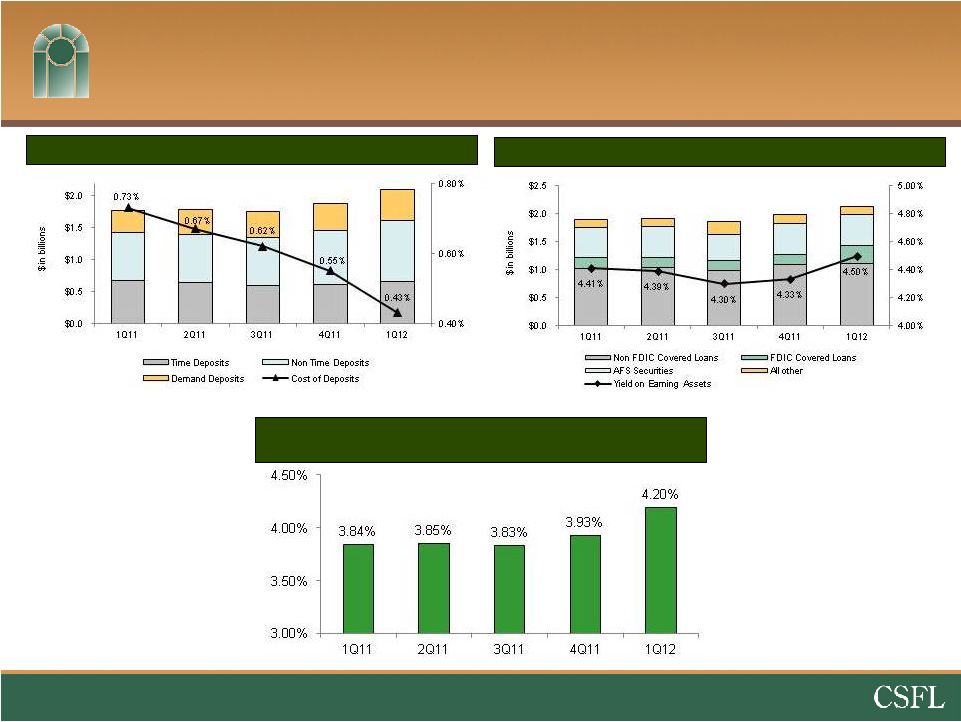 9
Net Interest Margin
Costs of Deposits
Yield on Interest Earning Assets
Net Interest Margin %
(excluding Correspondent Division) |
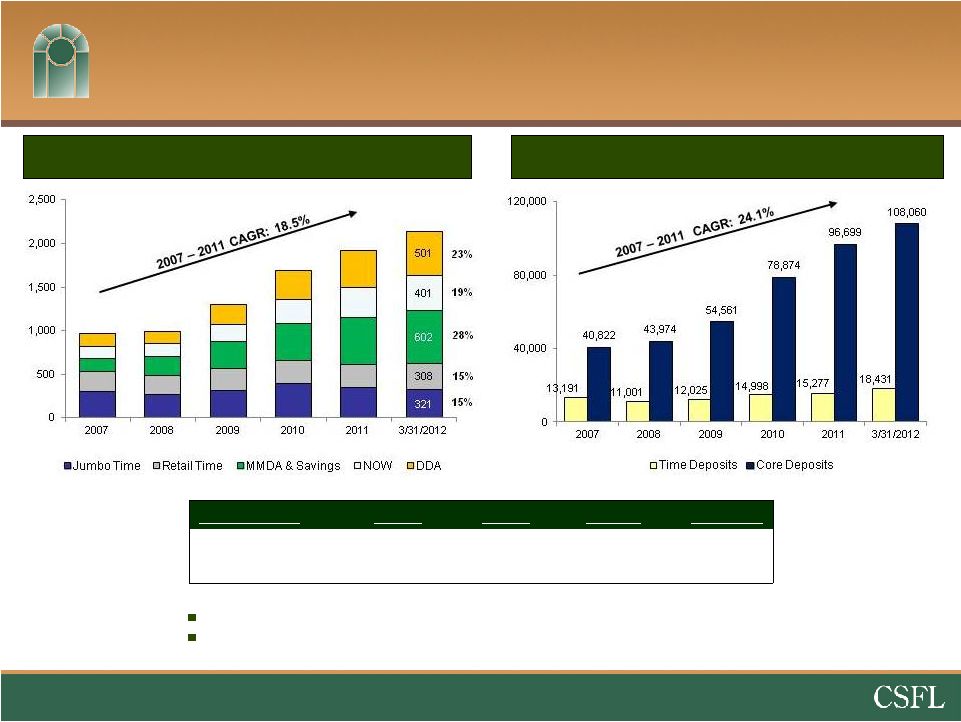 Building Franchise Value
with Core Deposits
Value of core deposits not fully realized in this low rate environment.
Approximately 126,491 total accounts -
$16,861 average balance per account
Core deposits defined as non-time deposits.
Total Deposits ($MM)
Number of Deposit Accounts
10
DDA and NOW
3/31/11
3/31/12
Change
% Change
Balance
$689MM
$902MM
$213MM
31%
No. of Accounts
67,859
84,595
16,736
25% |
 Operating Expenses as a % of Average Assets
(excluding credit costs, nonrecurring items, and Correspondent Division)
Operating Efficiencies
11
Efficiency Ratio –
Total Company
Opportunities through:
Leverage
Cost Efficiencies
Non-Interest Expense as a % of Average Assets*
All Florida-based
Banks Nationwide Banks (Assets $100M –
$10B)
*Source: The Hovde Group |
 12
Efficiency Steps
First
Quarter
2012
Second
Quarter
2012
•Close & consolidate 4 FDIC acquired branches
•Close & consolidate 7 FDIC acquired branches
•Complete 2 systems conversions
•Merge Valrico State Bank into the Lead Bank
Third
Quarter
2012
•Restructure retail checking product offering
•Evaluate underperforming Legacy branches |
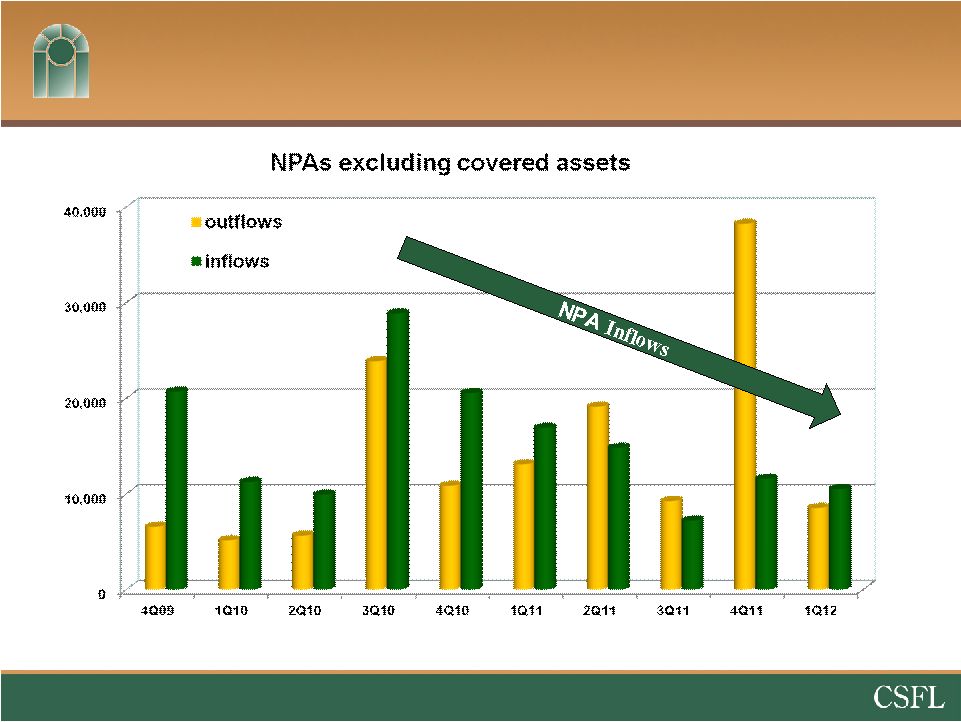 13
NPA Inflows -
Slowing Down |
 Credit Quality Trends
NPAs / Loans & OREO (%)
Problem Loan Trends ($MM)
Source: SNL Financial and Company filings. Peer information updated
quarterly Nonperforming assets include 90 days or more past due.
Southeastern peers include ABCB, BTFG, GRNB, PNFP, RNST, SCBT, UBSH and UCBI.
Florida peers include all banks headquartered in Florida , opened no later
than 12/31/2005 and total assets between $500 million and $5 billion.
14 |
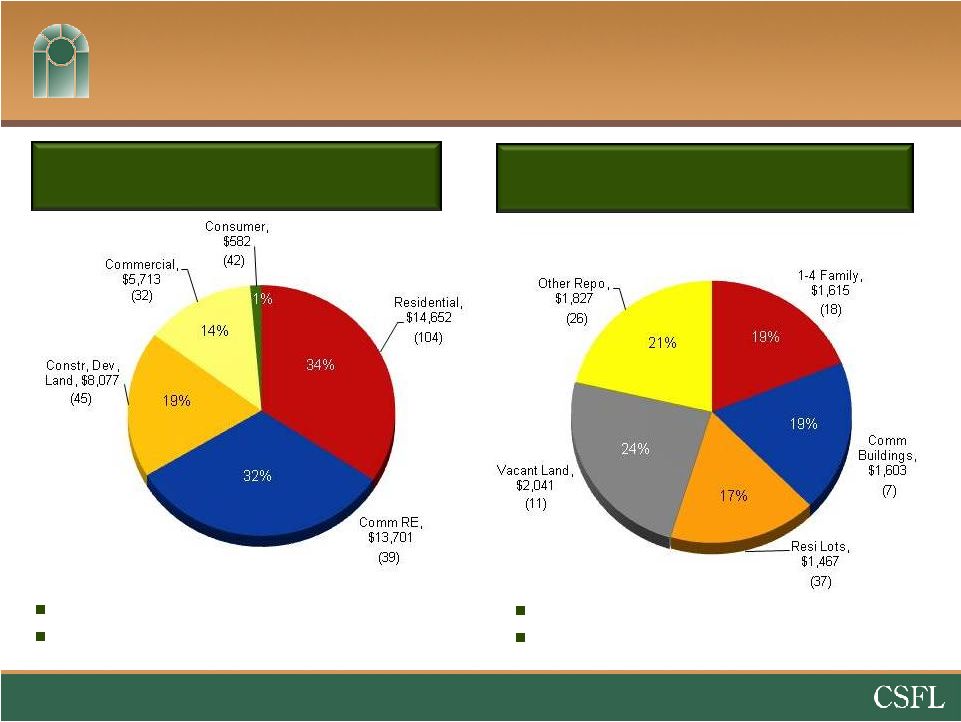 Non-Performing Loans
($M)
$8,553M
OREO & Repos are carried at 49% of
Unpaid Principal Balance
15
Data as of 3/31/12
NPA Breakout
(excluding FDIC covered assets)
OREO & Repo
($M)
$42,725M (3.85% of Gross Loans)
NPLs are carried at 78% of Unpaid
Principal Balance |
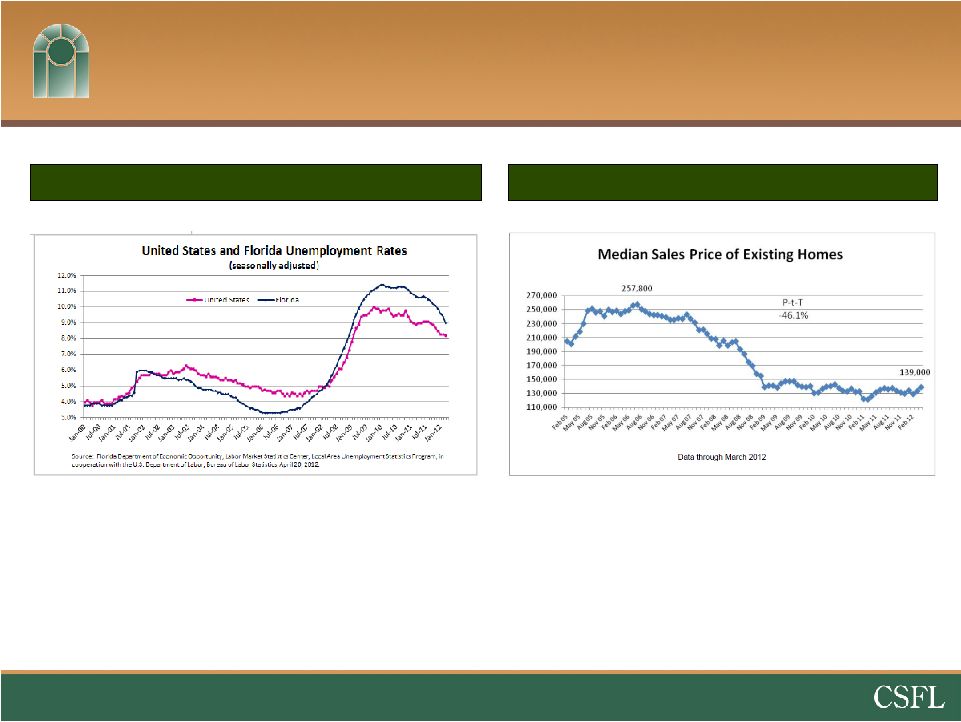 Florida Economy Slowly Recovering
16
Source: The Florida Legislature Office of Economic and Demographic Research & US
Bureau of Labor Statistics
Unemployment at 9.0%, down from
12% -
seventeen consecutive months
of job growth after losing jobs for
three years
Florida Unemployment Rate
Florida Median Home Price
Median home prices for existing homes
have been essentially flat since January
2009 (38 Months) |
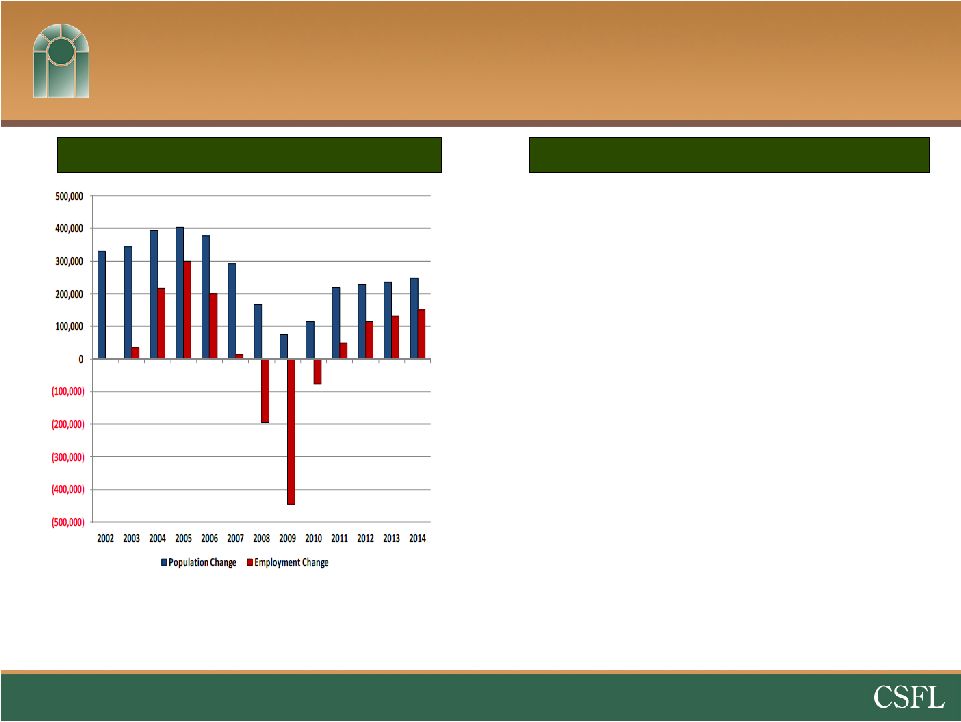 17
Population Growth
Returns to Florida in 2011
•
Florida’s population grew by 256,000
between 4-1-2010 and 7-1-2011 –
Higher
than most anticipated
•Over half of the US population growth
occurred in 5 sunbelt states –
CA, TX, FL,
GA & NC
•Lower Florida home prices are attracting
baby boom buyers from the Midwest and
Northeast as housing conditions improve
in those markets
Florida Population & Employment
Things to Consider
Source: Fishkind & Associates, Inc., US Census Bureau
|
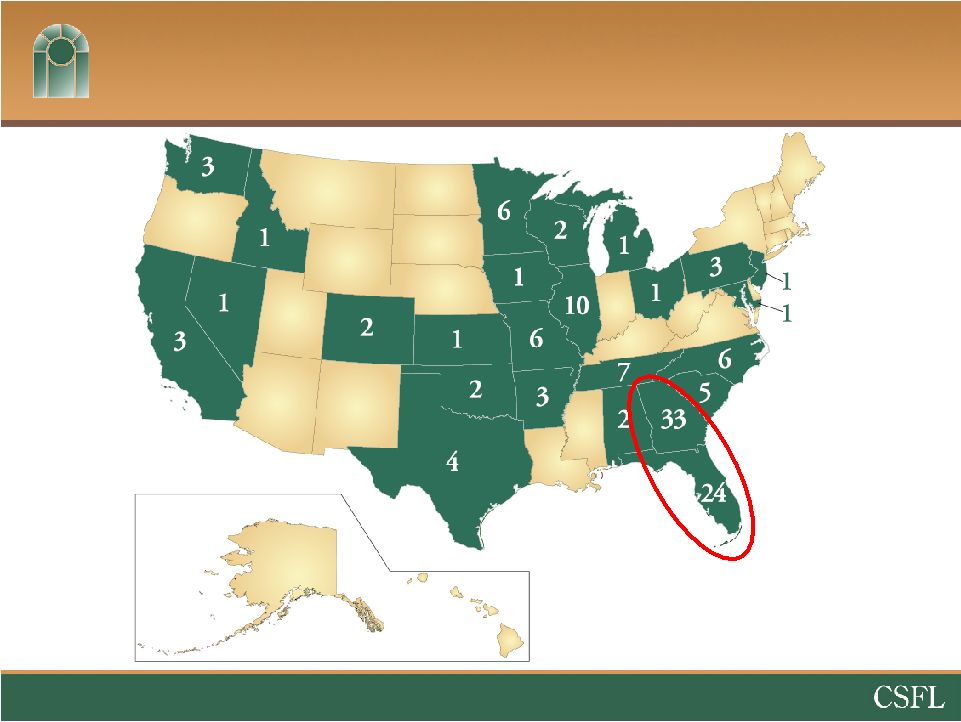
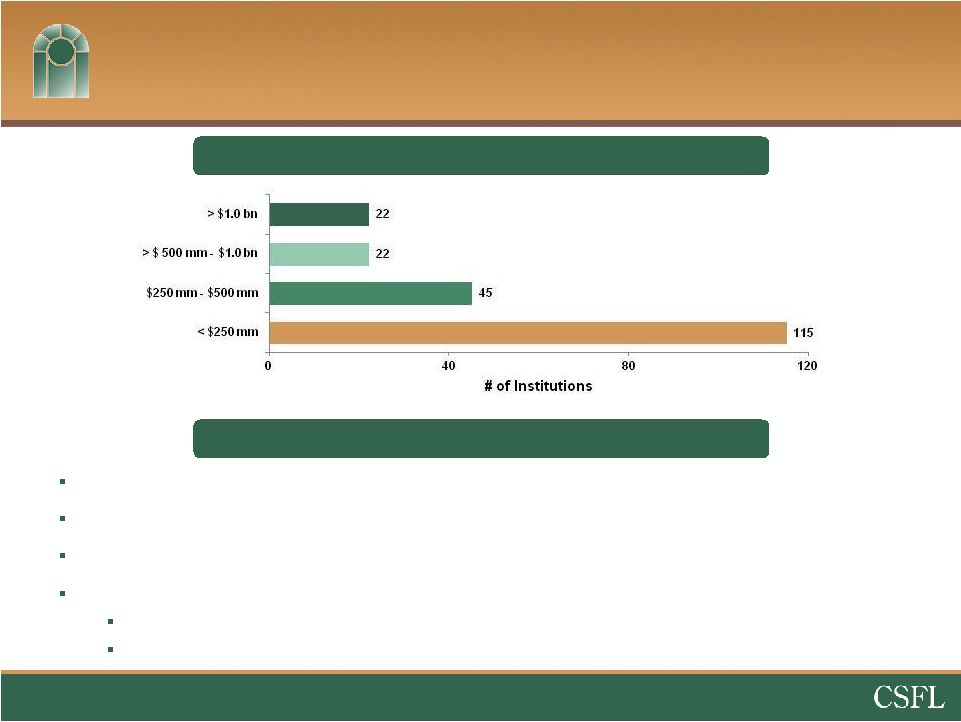 CSFL: Best Positioned Florida Consolidator
Disproportionate number of sellers versus very few buyers
CSFL
is
one
of
five
major
exchange
traded
banks
headquartered
in
FL
with
assets
greater
than
$1.0
billion
Proven experience through 8 successful acquisitions in the past 3 years
The number of small, distressed Florida institutions remains
high 98 banks with a Texas ratio > 50%
77 of those banks have assets less than $500 million
CSFL’
s Advantage
Source: SNL Financial
Data as of 3/31/12 or MRQ
FL Banks: Distribution of Banks by Assets
18 |
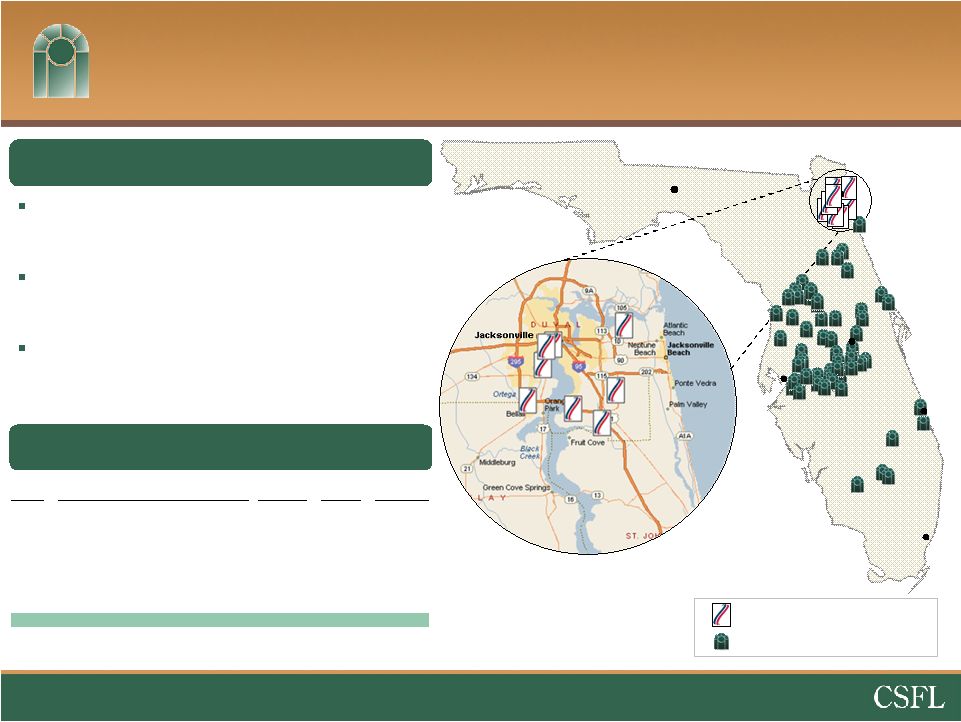 Overview of
First Guaranty Bank and Trust Company of Jacksonville
65 year old bank headquartered in
Jacksonville, FL
2
nd
largest community bank in Duval County,
behind Jacksonville Bancorp, Inc.
Profitable Trust Services includes
approximately 300 relationships and $140
million in assets under management
Overview
Deposits
Market
Rank
Institution
($mm)
Share
Branches
1
Bank of America Corp.
$21,097
50.8
%
24
2
EverBank Financial Corp.
9,009
21.7
5
3
Wells Fargo & Co.
4,943
11.9
40
4
SunTrust Banks Inc.
1,518
3.7
21
5
Banco Bilbao Vizcaya Argentaria SA
803
1.9
14
6
Regions Financial Corp.
730
1.8
16
7
Jacksonville Bancorp Inc.
522
1.3
9
8
Toronto-Dominion Bank
373
0.9
5
9
First Guaranty B&TC Co. of Jacksonville
362
0.9
8
10
Fifth Third Bancorp
353
0.9
7
Deposit Market Share –
Duval County
Source: SNL Financial
Deposit data as of 6/30/11
VERO
BEACH
ORLANDO
TALLAHASSEE
JACKSONVILLE
TAMPA
MIAMI
First Guaranty Branch (8)
CenterState Branch (57)
19 |
 Summary
20
Lifetime local bankers with common lineage and vision
Nearly all of the recent growth is guaranteed by the United
States Government or a major financial institution
Senior management added in anticipation of growth
Focus on efficiencies in 2012
A consolidator of banks |
 21
Banks with Texas Ratio over 200%
44%
Source: SNL Financial
Data as of 3/31/12 or MRQ |
 Appendix |
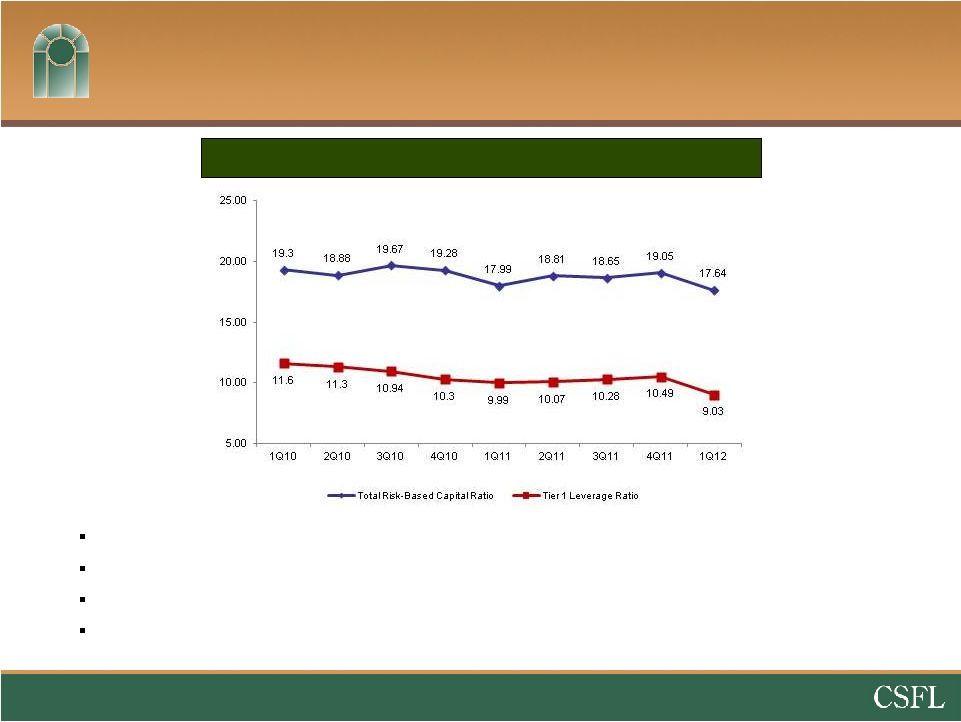 Capital
Total Risk-Based & Tier 1 Leverage
22
Two successful capital raises in 2009 and 2010 totaling $114 million
First
publicly
traded
bank
in
Florida
to
successfully
complete
a
capital
raise
during
financial
crisis
in
2009
Over
50
“Blue
Chip”
active
institutional
investors
–
Average
daily
volume
over
50,000
shares
Institutions committed to capitalize additional FDIC accretive transactions
|
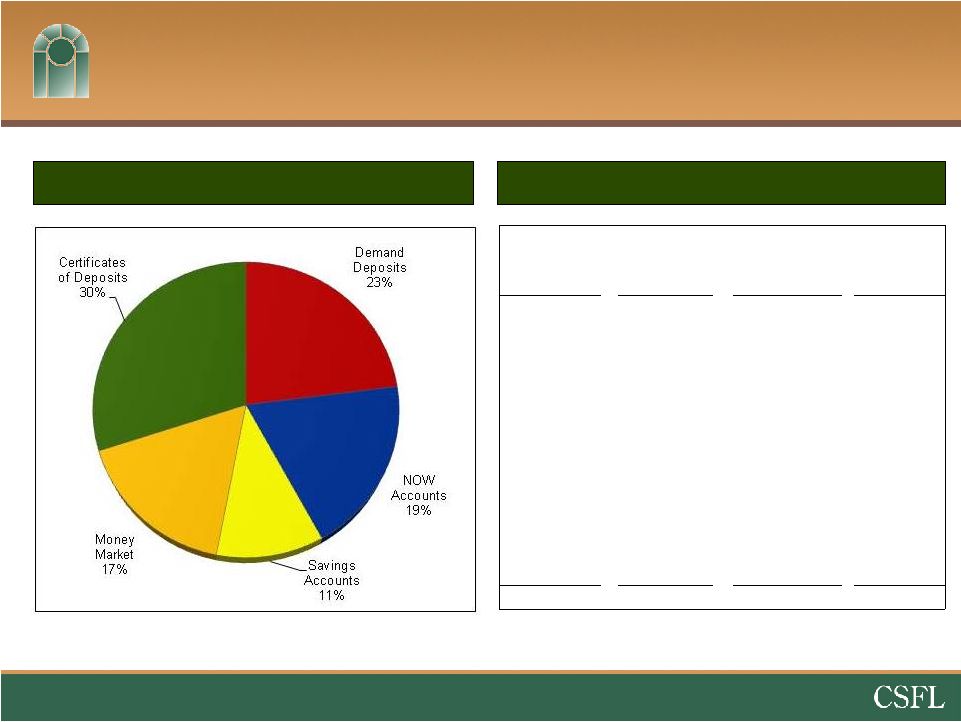 Total Deposit Portfolio
(at 3/31/12)
Total Deposits by Type (%)
Total Deposits Detail
23
Deposit Type
Number of
Deposits
3/31/12
Balance
Avg Deposit
Balance
Demand
Deposits
41,528
$ 501 MM
$12,500
NOW
Accounts
43,067
$ 401 MM
$9,300
Savings
Deposits
19,523
$ 247 MM
$12,700
Money
Market
3,942
$ 355 MM
$90,000
Certificates of
Deposit
18,431
$ 629 MM
$34,100
Total
126,491
$ 1,920 MM
$16,900 |
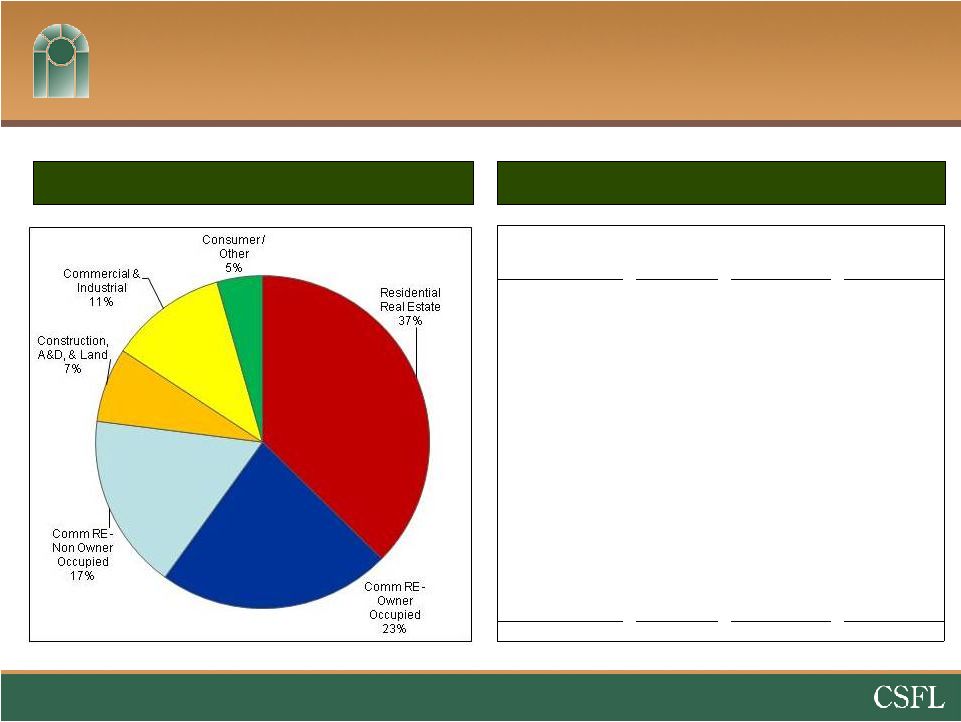 Total Loan Portfolio
(at 3/31/12, excluding FDIC covered assets)
Total Loans by Type (%)
Total Loans Detail
24
Loan Type
No. of
Loans
3/31/12
Balance
Avg Loan
Balance
Residential Real
Estate
3,822
$ 414 MM
$108,200
CRE-Owner
Occupied
763
$ 254 MM
$332,900
CRE-Non Owner
Occupied
470
$ 186 MM
$395,700
Construction,
A&D, & Land
498
$ 80 MM
$161,200
Commercial &
Industrial
1,033
$ 126 MM
$121,700
Consumer & All
Other
2,867
$ 49 MM
$17,400
Total
9,453
$ 1,109 MM
$117,300 |
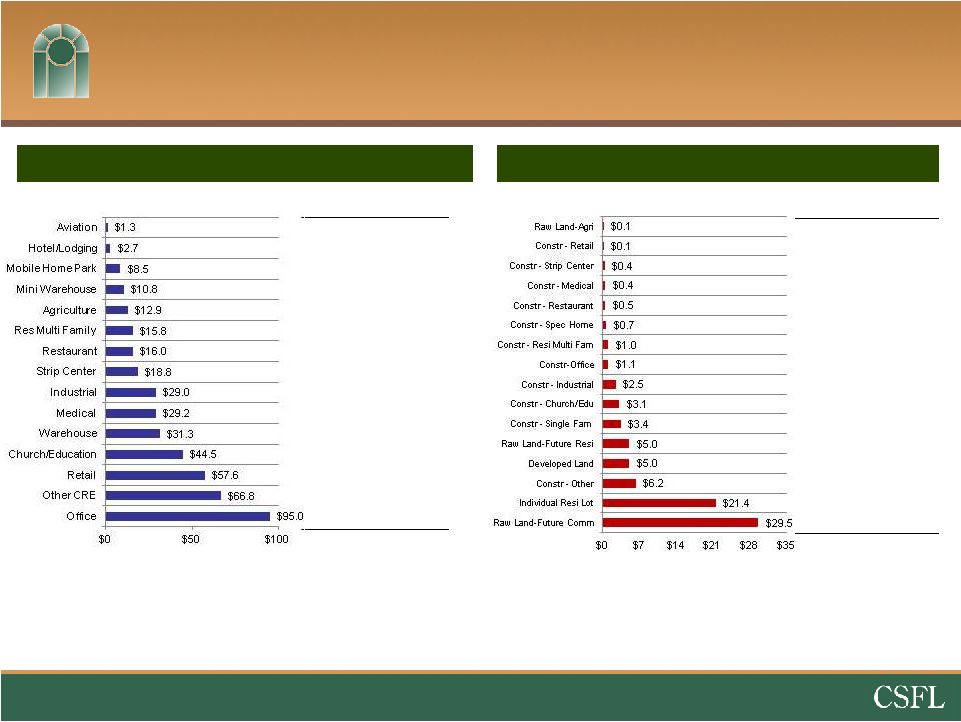 Commercial Real Estate by Type ($MM)
Construction Loans by Type ($MM)
CRE Concentrations
(as of 3/31/12, excluding FDIC acquired loans)
25
C&D concentration –
25% vs. 100%
•
58% Owner Occupied
CRE concentration –
109% vs. 300%
% of Total
Loans
Avg. Loan
Amount ($000)
0.3%
$425
0.6%
$683
1.9%
$941
2.4%
$718
2.9%
$216
3.6%
$206
3.6%
$432
4.3%
$417
6.6%
$392
6.6%
$583
7.1%
$434
10.1%
$542
13.1%
$324
15.2%
$321
21.6%
$298
100.0%
$357
% of Total
Loans
Avg. Loan
Amt ($000)
0.1%
$68
0.1%
$70
0.5%
$366
0.5%
$440
0.6%
$485
0.8%
$170
1.3%
$1,050
1.3%
$1,064
3.1%
$2,454
3.9%
$1,555
4.2%
$242
6.2%
$355
6.2%
$416
7.7%
$365
26.7%
$65
36.8%
$301
100.0%
$161 |