Attached files
| file | filename |
|---|---|
| 8-K - 8-K - SELECT MEDICAL HOLDINGS CORP | a12-10747_28k.htm |
Exhibit 99.1
|
|
Goldman Sachs Leveraged Finance Healthcare Conference 2012 May 1, 2012 |
|
|
This presentation may contain forward-looking statements based on current management expectations. Numerous factors, including those related to market conditions and those detailed from time-to-time in the Company’s filings with the Securities and Exchange Commission, may cause results to differ materially from those anticipated in the forward-looking statements. Many of the factors that will determine the Company’s future results are beyond the ability of the Company to control or predict. These statements are subject to risks and uncertainties and, therefore, actual results may differ materially. Readers should not place undue reliance on forward-looking statements, which reflect management’s views only as of the date hereof. The Company undertakes no obligation to revise or update any forward-looking statements, or to make any other forward-looking statements, whether as a result of new information, future events or otherwise. All references to “Select” used throughout this presentation refer to Select Medical Holdings Corporation and its subsidiaries. Forward-Looking Statements |
|
|
111 LTAC Hospitals 110 owned with 4,660 beds and 1 managed. Hospitals in 28 states. 950 Outpatient Rehab Clinics in 32 states and the District of Columbia. $2.8 Billion Net Revenue 2011 $386 Million Adjusted EBITDA 20111 29,250 Employees in the United States 12 Inpatient Rehab Facilities (IRF) 7 owned with 545 beds, 5 managed, and 4 managed units. Facilities in 5 states. 520 Contract Therapy locations in 31 states and the District of Columbia. Note: Statistics as of March 31, 2012 1 See slide 21 for non-GAAP reconciliation Select Medical Today Specialty Hospitals Segment Outpatient Rehabilitation Segment |
|
|
2011 Accomplishments Financial Performance Grew YoY Revenue by 17.3% Grew YoY EBITDA by 25.7% Reduced leverage thru Holdco by 1 full turn (4.6x to 3.6x) Added Miami, FL IRF – Jan. 1, 2011 Completed Baylor Health System Rehab JV – April 1, 2011 Continued improvement on Regency integration Completed debt refinancing – June 1, 2011 |
|
|
Balanced Payor Mix Specialty Payor Mix Outpatient Payor Mix Overall Payor Mix 90% Commercial Payors and Other 10% Medicare/Medicaid 65% Medicare/Medicaid 35% Commercial Payors and Other Note: 2011 58.5% 55.0% 50.3% 48.3% 49.0% 49.7% 51.5% 41.5% 45.0% 49.7% 51.7% 51.0% 50.3% 48.5% 2005 2006 2007 2008 2009 2010 2011 Medicare/Medicaid Commercial Payors and Other |
|
|
Closed September 1, 2010 – Purchase Price $210.0M 23 long-term acute care hospitals Corporate services and back office functions fully integrated Regency 2009 Audit 2011 Net Revenue $ 375M $ 340M Adjusted EBITDA $ 28M $ 46M Adjusted EBITDA Margin 7.5% 13.5% 2011 specialty hospital margins excluding Regency - 18.0% Regency Acquisition |
|
|
MMSEA 2007 – extended through December 2012 Hospital in Hospital Rules – suspended at 50% Very Short Stay Outlier Rule – suspended Moratorium on new LTAC hospital licenses Future – post-2012 Patient/Facility Criteria (Supported by Industry, AHA, FAH, etc.) Extension of 2012 legislation (status quo) Lapse (25% Rule introduction, de novo facilities) Budget Sequestration LTACH Regulatory Environment |
|
|
10/1/12 Market-Basket Update: Net of 2.1% 12/29/12 Market-Basket Update 1.266% reduction for 3-year phase-in of the Budget Neutrality Adjustment 25% Rule 1 year extension Exception: Cost reporting periods on or after 7/1/2012 and before 10/1/2012 subject to 25% rule for 1 year before receiving extension Labor-related share of federal base rate decreased 9.95% High-cost outlier threshold decreased $2,203 (12.3%) Adjusted MC-LTC-DRG weights and geometric LOS Very SSO: Effective with discharges on or after 12/29/12 Moratorium on new LTACH’s and satellite facilities expires 12/29/12 Proposed Regulatory Updates |
|
|
Joint Ventures Baylor Rehabilitation SSM Rehabilitation Penn State Hershey Rehabilitation Denton, TX CON States Kessler, NJ Miami, FL Inpatient Rehabilitation Strategy |
|
|
Rehab JV Overview Two inpatient hospitals One unit 32 outpatient locations 16 contract therapy locations 3 occupational health clinics 3 day institute clinics Four inpatient rehab hospitals Three managed inpatient rehab units 34 outpatient locations 1 contract therapy location 54 bed rehab facility |
|
|
Outpatient Rehab Clinics Outpatient Rehab Facilities (Number of Facilities) 950 Outpatient Margin Opportunity Continue to expand former HealthSouth clinics’ EBITDA margins 2009 EBITDA margin differential – greater than 5% 2010 EBITDA margin differential – greater than 3% 2011 EBITDA margin differential – greater than 2% Former HealthSouth clinics’ revenue – $220M Joint Venture outpatient opportunities Source: Company public filings and websites as of March 31, 2012. 26 147 414 650 |
|
|
Contract Services 520 contracts in 31 states and the District of Columbia 2011 Revenue $164.3M Organic growth only |
|
|
Financial Overview |

|
|
$2,390 $2,240 $2,153 Note: In Millions CAGR 9.2% CAGR 12.7% $307 $330 $270 Net Revenue Adjusted EBITDA $2,805 $386 Net Revenue and Adjusted EBITDA Trends 2008 2009 2010 2011 Specialty Outpatient Other 2008 2009 2010 2011 Specialty Outpatient |
|
|
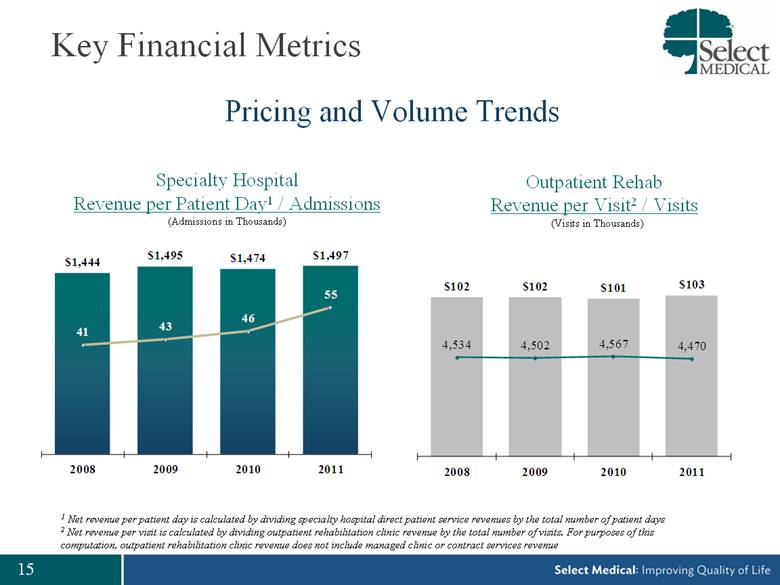
Key Financial Metrics Pricing and Volume Trends Specialty Hospital Revenue per Patient Day1 / Admissions Outpatient Rehab Revenue per Visit2 / Visits (Admissions in Thousands) (Visits in Thousands) 1 Net revenue per patient day is calculated by dividing specialty hospital direct patient service revenues by the total number of patient days 2 Net revenue per visit is calculated by dividing outpatient rehabilitation clinic revenue by the total number of visits. For purposes of this computation, outpatient rehabilitation clinic revenue does not include managed clinic or contract services revenue $102 $102 $101 $103 4,534 4,502 4,567 4,470 0 20 40 60 80 100 120 140 2008 2009 2010 2011 $1,444 $1,495 $1,474 $1,497 41 43 46 55 0.0 10.0 20.0 30.0 40.0 50.0 60.0 70.0 80.0 2008 2009 2010 2011 |
|
|
Annual Capital Expenditures ($ in millions) 2008 2009 2010 2011 Maintenance Development $52 $ 46 $57 $58 |
|
|
Free Cash Flow Free Cash Flow1 Intense Focus on Free Cash Flow Generation ($ in millions) Note: Free Cash Flow calculated as Net Cash Provided by Operating Activities less Purchases of Property and Equipment 1 See slide 21 for non-GAAP reconciliation $51 $108 $93 $171 2008 2009 2010 2011 |
|
|
As of 12/31/08 As of 12/31/09 As of 12/31/10 As of 12/31/11 Cash and Equivalents $ 64 $ 84 $ 4 $ 12 Revolving Credit Facility ($300mm) 150 0 25 40 Term Loan B 657 483 482 838 Other Debt 5 6 6 5 Total Senior Debt 811 489 513 883 Sr. Sub. Notes due 2015 658 612 612 345 Total Op. Co. Debt $ 1,469 $ 1,101 $ 1,125 $ 1,228 Op. Co. Net Debt / Adjusted EBITDA1 5.2x 3.1x 3.7x 3.2x Sr. Floating Rate Notes due 2015 (Hold Co.) 175 167 167 167 Sr. Sub. Notes due 2015 (Hold Co.) 136 137 139 0 Total Debt $ 1,780 $ 1,405 $ 1,431 $ 1,395 Total Net Debt / Adjusted EBITDA1 6.4x 4.0x 4.6x 3.6x 1 See slide 21 for non-GAAP reconciliation ($ in millions) Capitalization Details |
|
|
2012 Financial Guidance Net Revenue $ 2,850M - $ 2,950M Adjusted EBITDA $ 390M - $ 410M EPS $ 0.86 - $ 0.94 |
|
|
Questions |

|
|
Appendix: Additional Materials |
|
|
Non-GAAP Reconciliation 2008 2009 2010 2011 Net Income $ 25 $ 79 $ 82 $ 113 (+) Income tax 26 37 42 71 (+/-) Equity in losses/(earnings) of unconsolidated subsidiaries - - 1 (3) (+/-) Other expense / (income) - 1 (1) - (+) Interest expense, net 146 132 112 99 (-/+) (Gain) / Loss on debt retirement (1) (13) - 31 (+) Depreciation and Amortization 72 71 69 71 (+) Stock Based Compensation 2 23 2 4 Adjusted EBITDA $ 270 $ 330 $ 307 $ 386 Net Cash Provided by Operating Activities $ 107 $ 166 $ 145 $ 217 (-) Purchase of Property and Equipment 56 58 52 46 Free Cash Flow $ 51 $ 108 $ 93 $ 171 ($ in millions) |