Attached files
| file | filename |
|---|---|
| 8-K - FORM 8-K - Kraton Corp | v311383_8k.htm |

KRATON PERFORMANCE POLYMERS, INC. FIRST QUARTER 2012 EARNINGS CONFERENCE CALL May 1, 2012

KRATON First Quarter 2012 Earnings Call Forward - Looking Statement Disclaimer 2 This presentation may include forward - looking statements that reflect our plans, beliefs, expectations and current views with re spect to, among other things, future events and financial performance. Forward - looking statements are often characterized by the use of wo rds such as “outlook”, “believes,” “estimates,” “expects,” “projects,” “may,” “intends,” “plans” or “anticipates,” or by discussi ons of strategy, plans or intentions, including statements regarding our general “outlook”; our ability to obtain raw materials at com petitive prices; costs, timing and plans related to our planned joint venture with Formosa Petrochemical Corporation and the related fac ility; anticipated capital expenditures; anticipated sales volumes or levels of demand for our products; anticipated rates of growt h, including sales growth and growth in product offerings through innovation; anticipated raw material price movements and related expecta tio ns regarding customer activities. All forward - looking statements in this presentation are made based on management's current expec tations and estimates, which involve known and unknown risks, uncertainties and other important factors that could cause our actual r esu lts or industry results to differ materially from historical results or those expressed in forward - looking statements. These risks and uncertainties are more fully described in our latest Annual Report on Form 10 - K, as subsequently amended on March 8, 2012, including but not limited to “Part I, Item 1A. Risk Factors” and “Part I, Item 7. Management’s Discussion and Analysis of Financial Condition and Resul ts of Operations” therein, and in our other filings with the Securities and Exchange Commission, and include, but are not limited t o, risks related to : conditions in the global economy and capital markets; our reliance on LyondellBasell Industries for the provision of significant operating and other services; the failure of our raw materials suppliers to perform their obligations under long - term supply agr eements, or our inability to replace or renew these agreements when they expire; limitations in the availability of raw materials we need to produce our products in the amounts or at the prices necessary for us to effectively and profitably operate our business; competition in our end - use markets, from other producers of SBCs and from producers of products that can be substituted for our products; our abilit y t o produce and commercialize technological innovations; our ability to protect our intellectual property, on which our business is subst ant ially dependent; the possibility that our products infringe on the intellectual property rights of others; seasonality in our busin ess , particularly for Paving and Roofing end uses; our substantial indebtedness, which could adversely affect our financial condition and prevent us from fulfilling our obligations under the senior secured credit agreement and the senior notes; financial and operating constraints related to our indebtedness; the inherently hazardous nature of chemical manufacturing; product liability claims and other lawsuits arising fro m environmental damage, personal injuries or other damage associated with chemical manufacturing or our products; political , economic and local business risks in the various countries in which we operate; health, safety and environmental laws, including laws that govern our employees’ exposure to chemicals deemed harmful to humans; regulation of our company or our customers, which could affect the demand for our products or result in increased compliance costs; customs, international trade, export control, antitrust, zon ing and occupancy and labor and employment laws that could require us to modify our current business practices and incur increased costs; fluctuations in currency exchange rates; our planned joint venture in Asia and whether or not it will materialize; our relationship with our employees; loss of key personnel or our inability to attract and retain new qualified personnel; the fact that we typically d o n ot enter into long - term contracts with our customers; a decrease in the fair value of our pension assets, which could require us to materially increase future funding of the pension plan; Delaware law and some provisions of our organizational documents make a takeover of our c omp any more difficult; our expectation that we will not pay dividends for the foreseeable future; our status as a holding company dependent on dividends from our subsidiaries; other risks, factors and uncertainties described in this press release and our other reports an d documents; and other factors of which we are currently unaware or deem immaterial. Readers are cautioned not to place undue reliance on fo rward - looking statements. Forward - looking statements speak only as of the date they are made, and we assume no obligation to update s uch information in light of new information or future events. Further information concerning issues that could materially affect fi nancial performance related to forward - looking statements can be found in Kraton’s periodic filings with the Securities and Exchange Commission.

KRATON First Quarter 2012 Earnings Call GAAP Disclaimer This presentation includes the use of both GAAP (generally accepted accounting principles) and non - GAAP financial measures. The non - GAAP financial measures are EBITDA and Adjusted EBITDA. In each case the most directly comparable GAAP financial measure is net income. A table included in this earnings release reconciles these non - GAAP financial measures with the most directly comparable GAAP financial measure. We consider EBITDA and Adjusted EBITDA important supplemental measures of our performance and believe they are frequently used by investors, securities analysts and other interested parties in the evaluation of our performance and companies in our industry. Further, management uses these measures to evaluate operating performance; our executive compensation plan bases incentive compensation payments on our EBITDA performance; and our long - term debt agreements use EBITDA (with additional adjustments) to measure our compliance with certain financial covenants such as leverage and interest coverage. EBITDA and Adjusted EBITDA have limitations as analytical tools, and you should not consider them in isolation, or as a substitute for analysis of our results under GAAP in the United States. Some of these limitations include: EBITDA does not reflect our cash expenditures, or future requirements for capital expenditures or contractual commitments; EBITDA does not reflect changes in, or cash requirements for, our working capital needs; EBITDA does not reflect the significant interest expense, or the cash requirements necessary to service interest or principal payments, on our debt; although depreciation and amortization are non - cash charges, the assets being depreciated and amortized will often have to be replaced in the future, and EBITDA does not reflect any cash requirements for such replacements; and other companies in our industry may calculate EBITDA differently than we do, limiting its usefulness as a comparative measure. In addition, we prepare Adjusted EBITDA by adjusting EBITDA to eliminate the impact of a number of items we do not consider indicative of our ongoing performance, and you should be aware that in the future we may incur expenses similar to the adjustments in this presentation. Our presentation of Adjusted EBITDA should not be construed as an inference that our future results will be unaffected by unusual or non - recurring items. Because of these and other limitations, EBITDA and Adjusted EBITDA should not be considered as a measure of discretionary cash available to us to invest in the growth of our business. 3

KRATON First Quarter 2012 Earnings Call First Quarter 2012 Highlights ( $ thousands, except volume and per share data) Q1’12 Q1’11 Change Sales volume (kT) 90 81 10% Sales revenue $ 408,313 $ 344,828 18% Net income $ 16,353 $ 21,877 (25)% Diluted EPS $ 0.50 $ 0.68 $ (0.18) Adjusted EBITDA (1) $ 42,961 $ 56,018 (23)% Net cash provided by (used in) operating activities $ 56,076 $ (44,137) $ 100,213 4 ▪ Record sales volume of 90 kilotons ▪ Sales revenue up 18% compared to Q1’11 on higher volume and price increases ▪ Working capital (excluding cash) 27% of TTM revenue ▪ TTM vitality index at 14% ▪ TTM innovation revenue up 14% year - on - year (1) Adjusted EBITDA is EBITDA excluding restructuring and related charges, gain on LBI settlement, charge associated with resolution of a property tax dispute in France, non - cash compensation expenses and loss on the extinguishment of debt.

KRATON First Quarter 2012 Earnings Call 27% Advanced Materials End Use Review 5 TTM Sales Revenue Profile Change in Sales Revenue End Use Sales Revenue US $ in millions Q1’12 vs. Q1’11 Q1’12 vs. Q4’11 $110 $83 $106 Q1'11 Q4'11 Q1'12 - 4% 27%
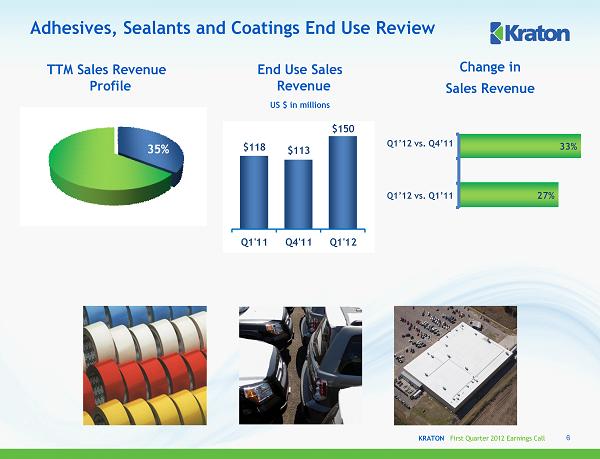
KRATON First Quarter 2012 Earnings Call Adhesives, Sealants and Coatings End Use Review ASC 6 TTM Sales Revenue Profile Change in Sales Revenue End Use Sales Revenue US $ in millions Q1’12 vs. Q1’11 Q1’12 vs. Q4’11 35% $118 $113 $150 Q1'11 Q4'11 Q1'12 27% 33%
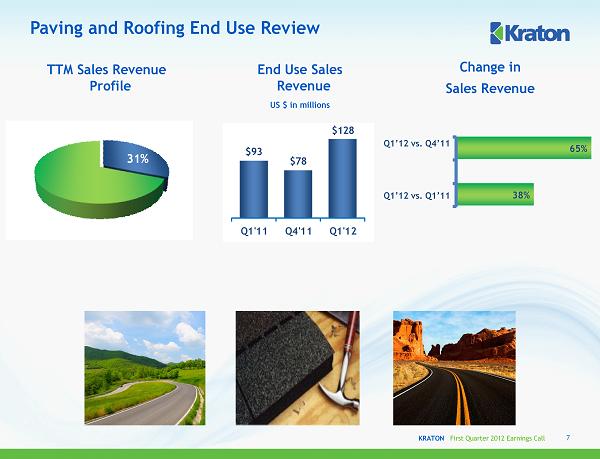
KRATON First Quarter 2012 Earnings Call 38% 65% 31% Paving and Roofing End Use Review 7 TTM Sales Revenue Profile Change in Sales Revenue End Use Sales Revenue US $ in millions Q1’12 vs. Q1’11 Q1’12 vs. Q4’11 $93 $78 $128 Q1'11 Q4'11 Q1'12
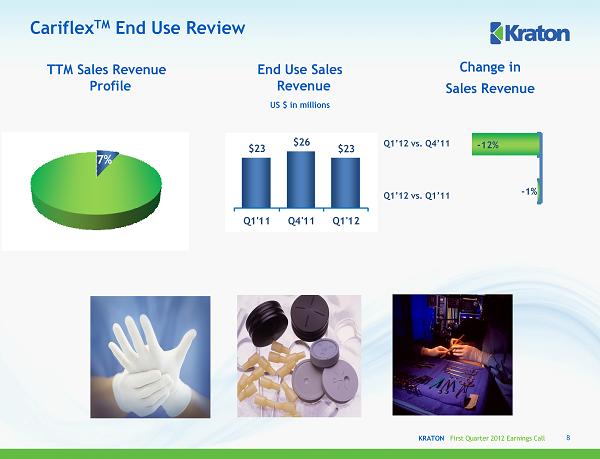
KRATON First Quarter 2012 Earnings Call 7% Cariflex TM End Use Review 8 TTM Sales Revenue Profile End Use Sales Revenue US $ in millions $23 $26 $23 Q1'11 Q4'11 Q1'12 - 1% - 12% Change in Sales Revenue Q1’12 vs. Q1’11 Q1’12 vs. Q4’11
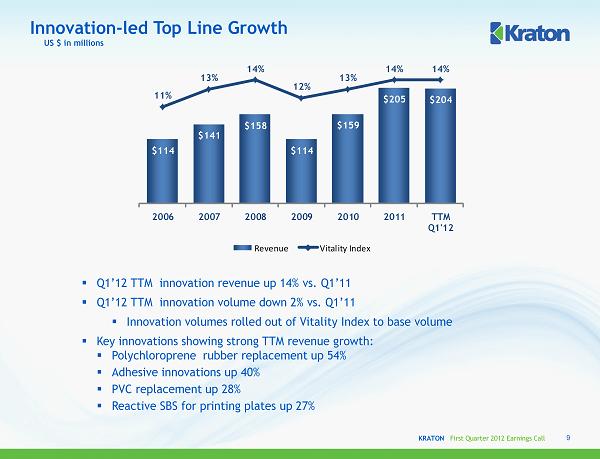
KRATON First Quarter 2012 Earnings Call Innovation - led Top Line Growth ▪ Q1’12 TTM innovation revenue up 14% vs. Q1’11 ▪ Q1’12 TTM innovation volume down 2% vs. Q1’11 ▪ Innovation volumes rolled out of Vitality Index to base volume ▪ Key innovations showing strong TTM revenue growth: ▪ Polychloroprene rubber replacement up 54% ▪ Adhesive innovations up 40% ▪ PVC replacement up 28% ▪ Reactive SBS for printing plates up 27% 9 US $ in millions $114 $141 $158 $114 $159 $205 $204 11% 13% 14% 12% 13% 14% 14% 0% 2% 4% 6% 8% 10% 12% 14% 16% 0 50 100 150 200 250 2006 2007 2008 2009 2010 2011 TTM Q1'12 Revenue Vitality Index

KRATON First Quarter 2012 Earnings Call 81 62 90 40 60 80 100 120 140 Q1'11 Q4'11 Q1'12 $345 $304 $408 0 200 400 600 800 1000 Q1'11 Q4'11 Q1'12 Sales Volume (Kilotons) Q1 2012 Sales Volume and Sales Revenue Sales Revenue (US $ in Millions) 10

KRATON First Quarter 2012 Earnings Call Q1 2012 Sales Revenue Walk Q1 2012 vs. Q4 2011 Q1 2012 vs. Q1 2011 US $ in millions 11 $345 $408 $35 $33 $(5) Q1 2011 Volume Price F/X / Other Q1 2012 $304 $408 $137 $(26) $(7) Q4 2011 Volume Price FX / Other Q1 2012
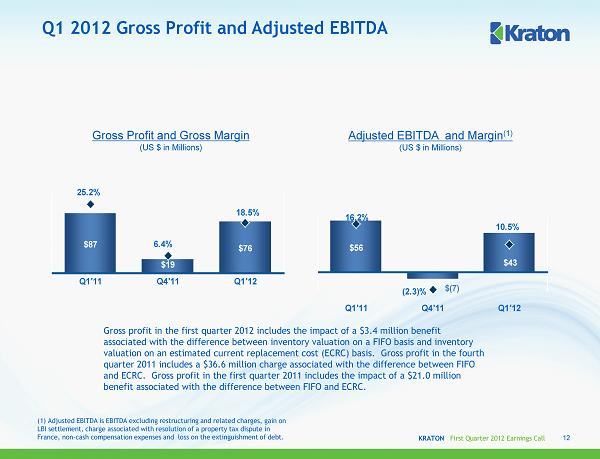
KRATON First Quarter 2012 Earnings Call Q1 2012 Gross Profit and Adjusted EBITDA Gross Profit and Gross Margin (US $ in Millions) $87 $19 $76 25.2% 6.4% 18.5% 0 20 40 60 80 100 120 Q1'11 Q4'11 Q1'12 Adjusted EBITDA and Margin (1) (US $ in Millions) $56 $(7) $43 16.2% (2.3)% 10.5% -20 -10 0 10 20 30 40 50 60 Q1'11 Q4'11 Q1'12 12 Gross profit in the first quarter 2012 includes the impact of a $3.4 million benefit a ssociated with the difference between inventory valuation on a FIFO basis and inventory v aluation on an estimated current replacement cost (ECRC) basis. Gross profit in the fourth q uarter 2011 includes a $36.6 million charge associated with the difference between FIFO and ECRC. Gross profit in the first quarter 2011 includes the impact of a $21.0 million benefit associated with the difference between FIFO and ECRC. (1) Adjusted EBITDA is EBITDA excluding restructuring and related charges, gain on LBI settlement, charge associated with resolution of a property tax dispute in France, non - cash compensation expenses and loss on the extinguishment of debt.

KRATON First Quarter 2012 Earnings Call $56 $43 $11 $33 $(41) $(18) $2 Q1 2011 Volume Price COGS ECRC vs. FIFO R&D/SG&A FX/Other Q1 2012 Q1 2012 Adjusted EBITDA Walk Q1 2012 vs. Q4 2011 US $ in millions Q1 2012 vs. Q1 2011 13 $(7) $43 $44 $(26) $2 $40 $(5) $(5) Q4 2011 Volume Price COGS ECRC vs. FIFO R&D/SG&A FX/Other Q1 2012 (1) Adjusted EBITDA is EBITDA excluding restructuring and related charges, gain on LBI settlement, charge associated with resolution of a property tax dispute in France, non - cash compensation expenses and loss on the extinguishment of debt.

KRATON First Quarter 2012 Earnings Call Q1 2012 Financial Overview US $ in Thousands except per share data Three months Ended Three months Ended Three months Ended 3/31/2012 12/31/2011 3/31/2011 Sales Volume (Kilotons) 90 62 81 Sales Revenues $ 408,313 $ 304,230 $ 344,828 Cost of Goods Sold 332,794 284,744 257,977 Gross Profit 75,519 19,486 86,851 Operating expenses Research and Development 7,560 7,725 6,602 Selling, General and Administrative 26,463 20,685 27,171 Depreciation and Amortization 15,849 15,816 14,626 Loss on Extinguishment of Debt (2,985) Earnings of Unconsolidated Joint Venture 137 673 141 Interest Expense, net 6,699 6,500 11,181 Income (loss) Before Income Taxes 19,085 (30,567) 24,427 Income Tax Expense (Benefit) 2,732 (9,545) 2,550 Net Income (Loss) $ 16,353 $ (21,022) $ 21,877 Earnings (Loss) per Common Share – Diluted $ 0.50 $ (0.66) $ 0.68 Adjusted EBITDA (1) $ 42,961 $ (6,953) $ 56,018 14 (1) Adjusted EBITDA is EBITDA excluding restructuring and related charges, gain on LBI settlement, charge associated with resolution of a property tax dispute in France, non - cash compensation expenses and loss on the extinguishment of debt.

KRATON First Quarter 2012 Earnings Call $5.2 $11.9 $22.3 ($2.3) ($34.3) ($9.3) $12.8 $13.3 $7.3 $14.7 ($1.7) ($8.1) $21.0 $49.8 $32.1 ($36.6) $3.4 Monomer Volatility Quarterly Difference Between Inventory Valuation at FIFO and at ECRC Gross Profit per Ton at Estimated Current Replacement Cost Gross Profit per Ton at FIFO 15 Q1’08 Q2’08 Q3’08 Q4’08 Q1’09 Q2’09 Q3’09 Q4’09 Q1’10 Q2’10 Q3’10 Q4’10 Q1’11 Q2’11 Q3’11 Q4 ’11 Q1’12 $568 $537 $805 $976 $918 $632 $707 $781 $849 $863 $1,046 $1,005 $810 $712 $894 $907 $805 Q1'08 Q2'08 Q3'08 Q4'08 Q1'09 Q2'09 Q3'09 Q4'09 Q1'10 Q2'10 Q3'10 Q4'10 Q1'11 Q2'11 Q3'11 Q4'11 Q1'12 $636 $664 $1,054 $932 $190 $501 $865 $998 $949 $1,034 $1,024 $885 $1,068 $1,318 $1,308 $315 $842 Q1'08 Q2'08 Q3'08 Q4'08 Q1'09 Q2'09 Q3'09 Q4'09 Q1'10 Q2'10 Q3'10 Q4'10 Q1'11 Q2'11 Q3'11 Q4'11 Q1'12

KRATON First Quarter 2012 Earnings Call US $ in millions 49.7% 47.0% 40.0% 39.1% 42.2% 37.2% 37.9% 37.0% 32.1% 0% 10% 20% 30% 40% 50% 60% $0 $50 $100 $150 $200 $250 $300 $350 $400 Net Debt to Cap Net Debt Net Debt (1) and Net Debt to Capitalization ▪ Cash at quarter end of $233 million. ▪ Net Debt - to - Capitalization ratio of 32.1% at 3/31/12. ▪ Net Debt to TTM Adjusted EBITDA was 1.43x at 3/31/12. (1) Net debt is equal to total debt, less c ash and cash equivalents. Balance Sheet 16

KRATON First Quarter 2012 Earnings Call Selected 2012 P&L Estimates (1) (1) Management's estimates. These estimates are forward - looking statements and speak only as of May 1, 2012. Management assumes no obligation to update these estimates in light of new information or future events. 17 Interest expense ~ $28 million Research & development ~ $32 million SG&A ~ $96 million Depreciation and amortization ~ $65 million Book tax rate ~ 13%

KRATON PERFORMANCE POLYMERS, INC. FIRST QUARTER 2012 EARNINGS CONFERENCE CALL May 1, 2012

APPENDIX May 1, 2012
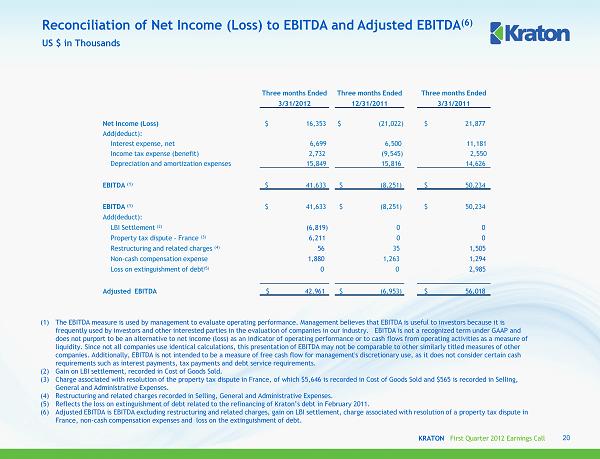
KRATON First Quarter 2012 Earnings Call Reconciliation of Net Income (Loss) to EBITDA and Adjusted EBITDA (6) (1) The EBITDA measure is used by management to evaluate operating performance. Management believes that EBITDA is useful to inve sto rs because it is frequently used by investors and other interested parties in the evaluation of companies in our industry. EBITDA is not a recognized term under GAAP and does not purport to be an alternative to net income (loss) as an indicator of operating performance or to cash flows from ope rat ing activities as a measure of liquidity. Since not all companies use identical calculations, this presentation of EBITDA may not be comparable to other sim ila rly titled measures of other companies. Additionally, EBITDA is not intended to be a measure of free cash flow for management's discretionary use, as it d oes not consider certain cash requirements such as interest payments, tax payments and debt service requirements. (2) Gain on LBI settlement, recorded in Cost of Goods Sold. (3) Charge associated with resolution of the property tax dispute in France, of which $5,646 is recorded in Cost of Goods Sold an d $ 565 is recorded in Selling, General and Administrative Expenses. (4) Restructuring and related charges recorded in Selling, General and Administrative Expenses. (5) Reflects the loss on extinguishment of debt related to the refinancing of Kraton’s debt in February 2011. (6) Adjusted EBITDA is EBITDA excluding restructuring and related charges, gain on LBI settlement, charge associated with resolution of a pro perty tax dispute in France, non - cash compensation expenses and loss on the extinguishment of debt. US $ in Thousands 20 Three months Ended Three months Ended Three months Ended 3/31/2012 12/31/2011 3/31/2011 Net Income (Loss) $ 16,353 $ (21,022) $ 21,877 Add(deduct): Interest expense, net 6,699 6,500 11,181 Income tax expense (benefit) 2,732 (9,545) 2,550 Depreciation and amortization expenses 15,849 15,816 14,626 EBITDA (1) $ 41,633 $ (8,251) $ 50,234 EBITDA (1) $ 41,633 $ (8,251) $ 50,234 Add(deduct): LBI Settlement (2) (6,819) 0 0 Property tax dispute - France (3) 6,211 0 0 Restructuring and related charges (4) 56 35 1,505 Non - cash compensation expense 1,880 1,263 1,294 Loss on extinguishment of debt (5) 0 0 2,985 Adjusted EBITDA $ 42,961 $ (6,953) $ 56,018
KRATON PERFORMANCE POLYMERS, INC. FIRST QUARTER 2012 EARNINGS CONFERENCE CALL May 1, 2012