Attached files
| file | filename |
|---|---|
| 8-K/A - 8-K/A - W R GRACE & CO | a12-10020_28ka.htm |
Exhibit 99.1
|
|
COMPANY OVERVIEW W. R. Grace & Co. April 19, 2012 |

|
|
Disclaimer Safe Harbor Statement under the Private Securities Litigation Reform Act of 1995 This presentation contains forward-looking statements, that is, statements related to future, not past, events. Such statements generally include the words “believes,” “plans,” “intends,” “targets,” “will,” “expects,” “suggests,” “anticipates,” “outlook,” “continues” or similar expressions. Forward-looking statements include, without limitation, all statements regarding Grace’s Chapter 11 case; expected financial positions; results of operations; cash flows; financing plans; business strategy; budgets; capital and other expenditures; competitive positions; growth opportunities for existing products; benefits from new technology and cost reduction initiatives, plans and objectives; and markets for securities. For these statements, Grace claims the protection of the safe harbor for forward-looking statements contained in the Private Securities Litigation Reform Act of 1995. Like other businesses, Grace is subject to risks and uncertainties that could cause its actual results to differ materially from its projections or that could cause other forward-looking statements to prove incorrect. Factors that could cause actual results to materially differ from those contained in the forward-looking statements include, without limitation: developments affecting Grace’s bankruptcy, proposed plan of reorganization and settlements with certain creditors, the cost and availability of raw materials (including rare earth) and energy, developments affecting Grace’s underfunded and unfunded pension obligations, risks related to foreign operations, especially in emerging regions, acquisitions and divestitures of assets and gains and losses from dispositions or impairments, the effectiveness of its research and development and growth investments, its legal and environmental proceedings, costs of compliance with environmental regulation and those factors set forth in Grace’s most recent Annual Report on Form 10-K, quarterly report on Form 10-Q and current reports on Form 8-K, which have been filed with the Securities and Exchange Commission and are readily available on the Internet at www.sec.gov. Reported results should not be considered as an indication of future performance. Readers are cautioned not to place undue reliance on Grace’s projections and forward-looking statements, which speak only as of the date thereof. Grace undertakes no obligation to publicly release any revisions to the forward-looking statements contained in this presentation, or to update them to reflect events or circumstances occurring after the date of this presentation. Non-GAAP Financial Terms These slides contain certain “non-GAAP financial terms” which are defined in the Appendix. Reconciliations of non-GAAP terms to the closest GAAP term (i.e., net income) are provided in the Appendix. |
|
|
Table of Contents 4 16 17 25 33 42 Grace Overview Business Segments Catalysts Technologies Materials Technologies Construction Products Definitions and Reconciliations |
|
|
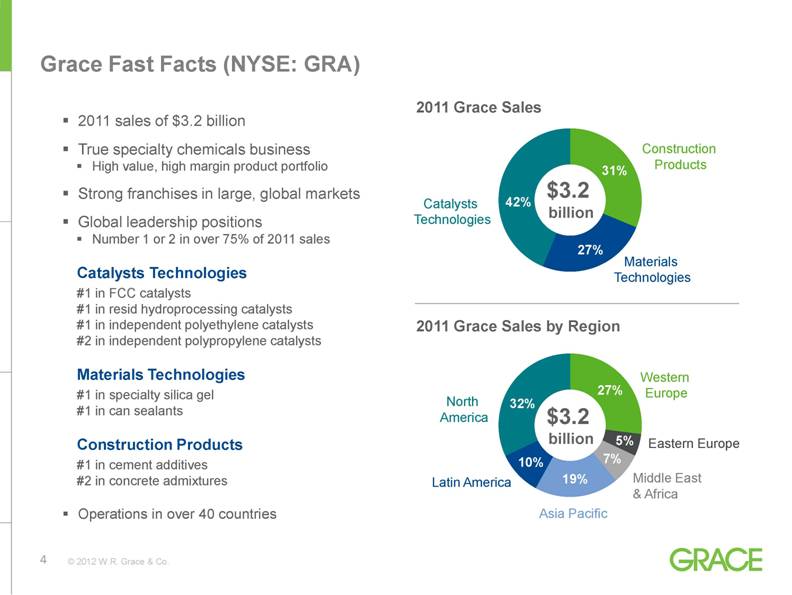
Grace Fast Facts (NYSE: GRA) 2011 sales of $3.2 billion True specialty chemicals business High value, high margin product portfolio Strong franchises in large, global markets Global leadership positions Number 1 or 2 in over 75% of 2011 sales Catalysts Technologies #1 in FCC catalysts #1 in resid hydroprocessing catalysts #1 in independent polyethylene catalysts #2 in independent polypropylene catalysts Materials Technologies #1 in specialty silica gel #1 in can sealants Construction Products #1 in cement additives #2 in concrete admixtures Operations in over 40 countries 2011 Grace Sales 2011 Grace Sales by Region $3.2 billion $3.2 billion Catalysts Technologies Construction Products Materials Technologies North America Western Europe Eastern Europe Middle East & Africa Asia Pacific Latin America |
|
|
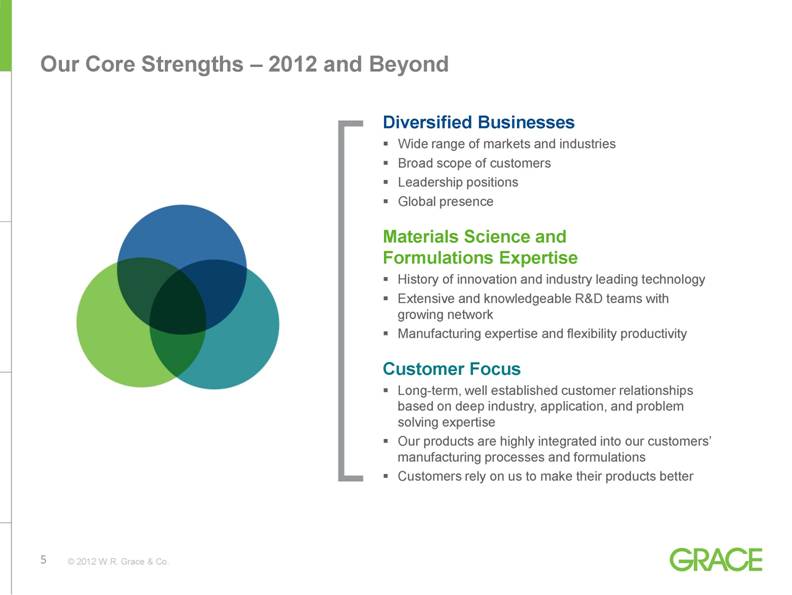
Diversified Businesses Wide range of markets and industries Broad scope of customers Leadership positions Global presence Materials Science and Formulations Expertise History of innovation and industry leading technology Extensive and knowledgeable R&D teams with growing network Manufacturing expertise and flexibility productivity Customer Focus Long-term, well established customer relationships based on deep industry, application, and problem solving expertise Our products are highly integrated into our customers’ manufacturing processes and formulations Customers rely on us to make their products better Our Core Strengths – 2012 and Beyond |
|
|
Founded On Innovation CATALYSTS TECHNOLOGIES Developed the first fluid cracking catalysts used for gasoline as well as the world’s first heterogeneous catalysts to make polyethylene polymers MATERIALS TECHNOLOGIES Pioneered the use of silica gel for military, industrial, and consumer applications since 1919 CONSTRUCTION PRODUCTS Leader in developing chemical admixtures to enhance the quality of concrete CATALYSTS TECHNOLOGIES Quickly launched 8 new FCC catalysts and additives to provide refiners with new low- or no-rare earth solutions in response to unprecedented rare earth cost inflation MATERIALS TECHNOLOGIES Materials and novel technologies leading to new industry segments, value-added applications, and performance-enhancing attributes CONSTRUCTION PRODUCTS New process control technology offers customers savings through increased productivity and greater product consistency Our History of Innovation Continues Today |
|
|
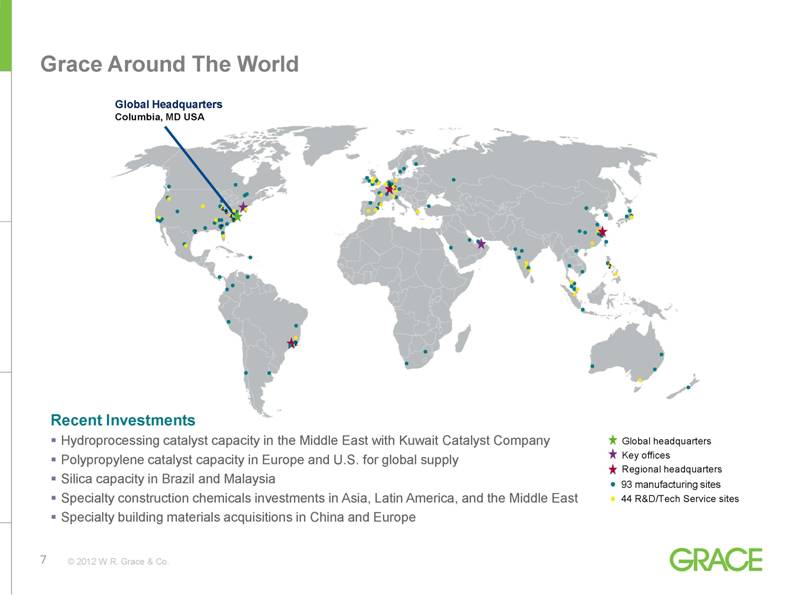
Global Headquarters Columbia, MD USA 2 2 2 5 2 5 2 4 4 2 Grace Around The World Recent Investments Hydroprocessing catalyst capacity in the Middle East with Kuwait Catalyst Company Polypropylene catalyst capacity in Europe and U.S. for global supply Silica capacity in Brazil and Malaysia Specialty construction chemicals investments in Asia, Latin America, and the Middle East Specialty building materials acquisitions in China and Europe Global headquarters Key offices Regional headquarters 93 manufacturing sites 44 R&D/Tech Service sites |
|
|
Financial Performance Record *Definitions of non-GAAP financial terms and reconciliations to the closest GAAP term are provided in the Appendix **Deconsolidated ART JV in December 2009. GAAP Sales were $2,825.0 million Sales ($M) Adjusted Free Cash Flow* ($M) Adjusted EBIT* ($M) Adjusted EBIT Return on Invested Capital* ($M) 2009-2011 CAGR = 11.3% 2009-2011 CAGR = 44.6% 4,000 3,000 2,000 1,000 0 2009 2010 2011 2,590.4** 2,675.0 3,211.9 400 300 200 100 0 2009 2010 2011 396.6 246.2 278.4 600 500 400 300 200 100 0 2009 2010 2011 229.0 326.4 478.6 40% 30% 20% 10% 0% 2009 2010 2011 20.5% 27.2% 35.4% |
|
|
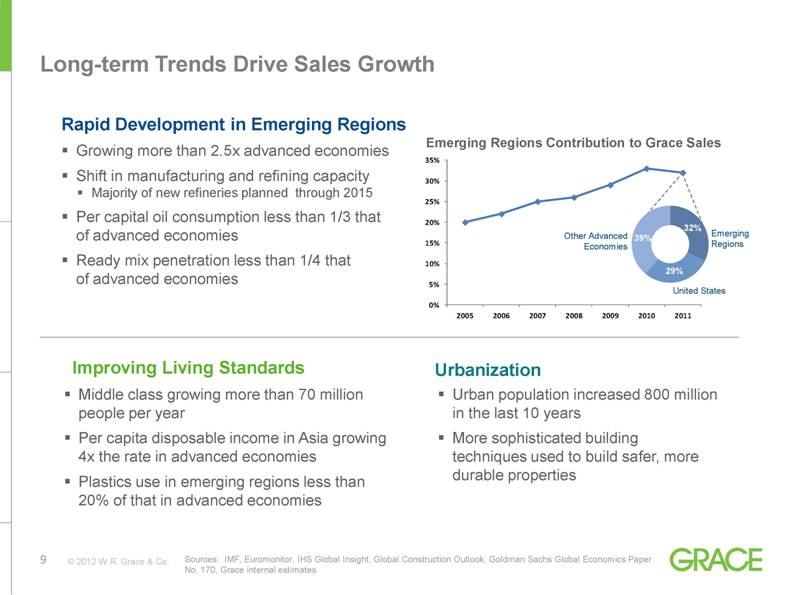
39% 32% 29% Emerging Regions United States Other Advanced Economies Emerging Regions Contribution to Grace Sales Long-term Trends Drive Sales Growth Sources: IMF, Euromonitor, IHS Global Insight, Global Construction Outlook, Goldman Sachs Global Economics Paper No. 170, Grace internal estimates Rapid Development in Emerging Regions Middle class growing more than 70 million people per year Per capita disposable income in Asia growing 4x the rate in advanced economies Plastics use in emerging regions less than 20% of that in advanced economies Urban population increased 800 million in the last 10 years More sophisticated building techniques used to build safer, more durable properties Growing more than 2.5x advanced economies Shift in manufacturing and refining capacity Majority of new refineries planned through 2015 Per capital oil consumption less than 1/3 that of advanced economies Ready mix penetration less than 1/4 that of advanced economies Improving Living Standards Urbanization 0% 5% 10% 15% 20% 25% 30% 35% 2005 2006 2007 2008 2009 2010 2011 |
|
|
Track Record of Increasing Profitability *Definitions of Non-GAAP financial terms and reconciliations to the closest GAAP term are provided in the Appendix. Sales and Gross Margin ($B) Profitability Drivers Sales Growth Capital-efficient capacity additions Growth in emerging economies leverages existing infrastructure Growth in advanced economies scales fixed costs Bolt-on acquisitions with clear cost synergies Product Margins Pricing power during periods of increasing raw materials costs Product innovation focused on increasing margins Lean manufacturing prioritized to higher margin products Global sourcing of raw materials and raw materials substitution Productivity Increasing manufacturing flexibility and reducing fixed costs Investing in supply chain function Disciplined Six Sigma approach to back office productivity Reducing inventories and inventory costs Adjusted EBITDA* ($M) 32.7% 35.5% 36.2% 3.5 3.0 2.5 2.0 1.5 1.0 0.5 0.0 2009 2010 2011 40% 30% 20% 10% 0% 700 600 500 400 300 200 100 0 2009 2010 2011 20% 15% 10% 5% 0% 12.1% 16.5% 18.6% 2.6 2.7 3.2 342 442 599 |
|
|
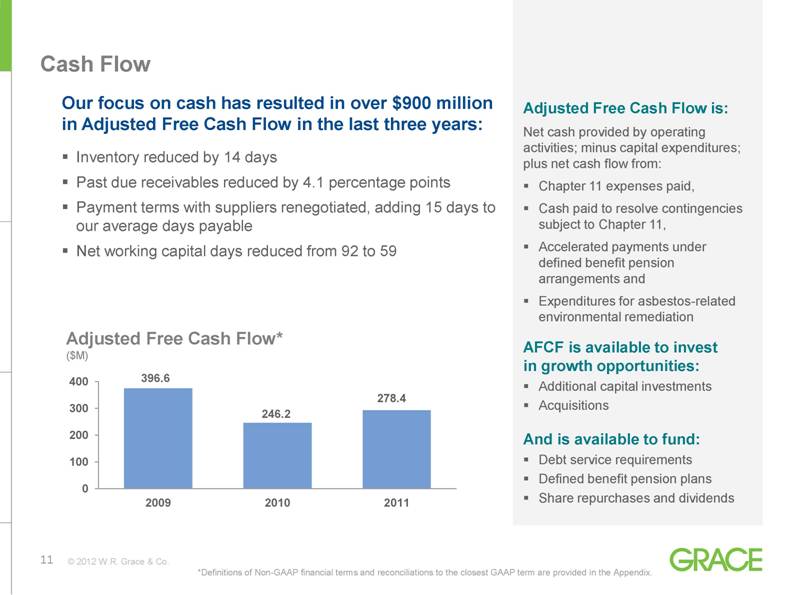
Cash Flow Our focus on cash has resulted in over $900 million in Adjusted Free Cash Flow in the last three years: Inventory reduced by 14 days Past due receivables reduced by 4.1 percentage points Payment terms with suppliers renegotiated, adding 15 days to our average days payable Net working capital days reduced from 92 to 59 Adjusted Free Cash Flow is: Net cash provided by operating activities; minus capital expenditures; plus net cash flow from: Chapter 11 expenses paid, Cash paid to resolve contingencies subject to Chapter 11, Accelerated payments under defined benefit pension arrangements and Expenditures for asbestos-related environmental remediation AFCF is available to invest in growth opportunities: Additional capital investments Acquisitions And is available to fund: Debt service requirements Defined benefit pension plans Share repurchases and dividends Adjusted Free Cash Flow* ($M) *Definitions of Non-GAAP financial terms and reconciliations to the closest GAAP term are provided in the Appendix. |
|
|
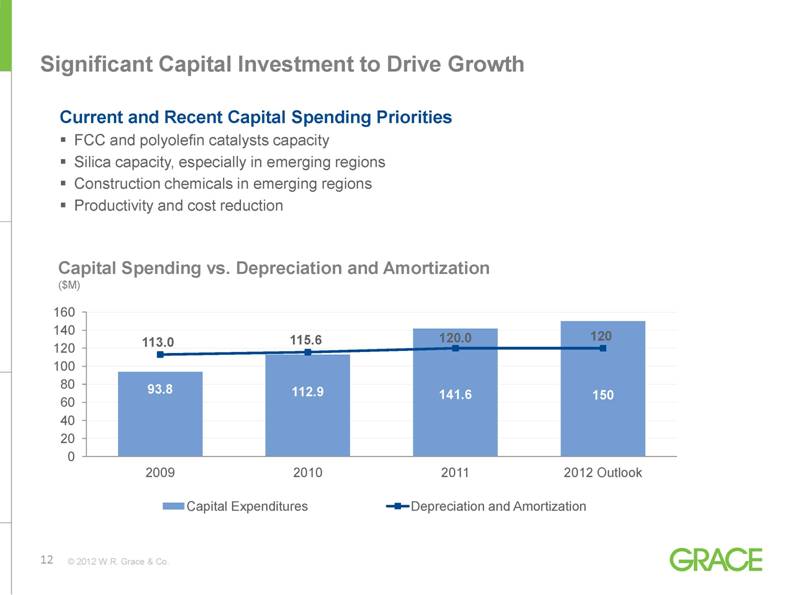
Significant Capital Investment to Drive Growth Capital Spending vs. Depreciation and Amortization ($M) Current and Recent Capital Spending Priorities FCC and polyolefin catalysts capacity Silica capacity, especially in emerging regions Construction chemicals in emerging regions Productivity and cost reduction |
|
|
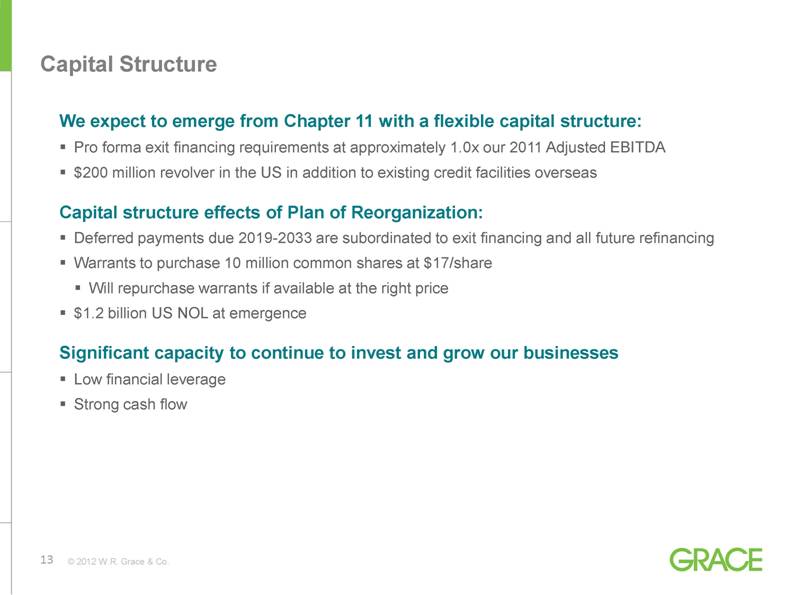
Capital Structure We expect to emerge from Chapter 11 with a flexible capital structure: Pro forma exit financing requirements at approximately 1.0x our 2011 Adjusted EBITDA $200 million revolver in the US in addition to existing credit facilities overseas Capital structure effects of Plan of Reorganization: Deferred payments due 2019-2033 are subordinated to exit financing and all future refinancing Warrants to purchase 10 million common shares at $17/share Will repurchase warrants if available at the right price $1.2 billion US NOL at emergence Significant capacity to continue to invest and grow our businesses Low financial leverage Strong cash flow |
|
|
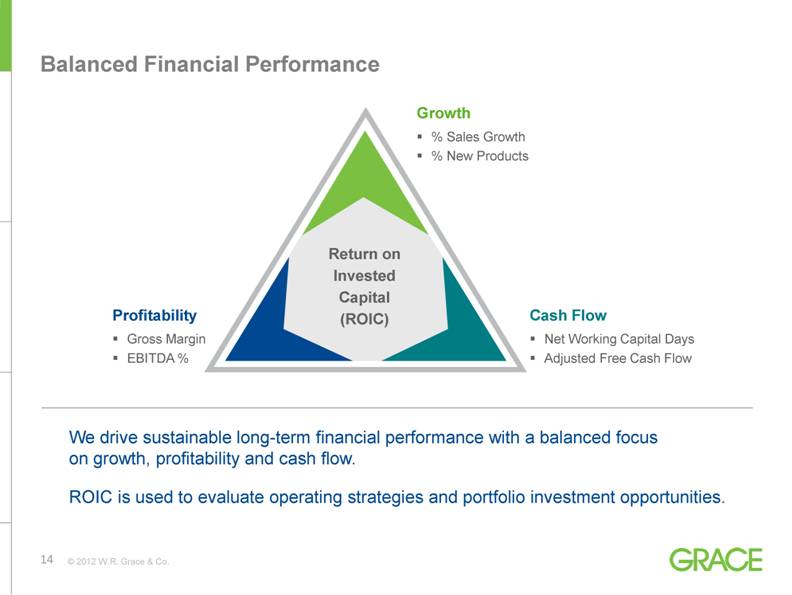
We drive sustainable long-term financial performance with a balanced focus on growth, profitability and cash flow. ROIC is used to evaluate operating strategies and portfolio investment opportunities. Balanced Financial Performance Growth % Sales Growth % New Products Cash Flow Net Working Capital Days Adjusted Free Cash Flow Profitability Gross Margin EBITDA % Return on Invested Capital (ROIC) |
|
|
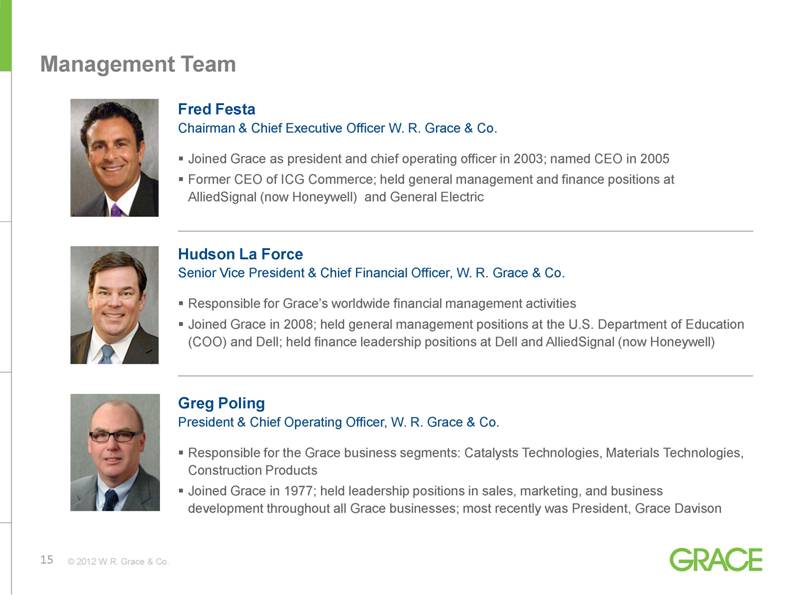
Management Team Fred Festa Chairman & Chief Executive Officer W. R. Grace & Co. Joined Grace as president and chief operating officer in 2003; named CEO in 2005 Former CEO of ICG Commerce; held general management and finance positions at AlliedSignal (now Honeywell) and General Electric Greg Poling President & Chief Operating Officer, W. R. Grace & Co. Responsible for the Grace business segments: Catalysts Technologies, Materials Technologies, Construction Products Joined Grace in 1977; held leadership positions in sales, marketing, and business development throughout all Grace businesses; most recently was President, Grace Davison Hudson La Force Senior Vice President & Chief Financial Officer, W. R. Grace & Co. Responsible for Grace’s worldwide financial management activities Joined Grace in 2008; held general management positions at the U.S. Department of Education (COO) and Dell; held finance leadership positions at Dell and AlliedSignal (now Honeywell) |
|
|
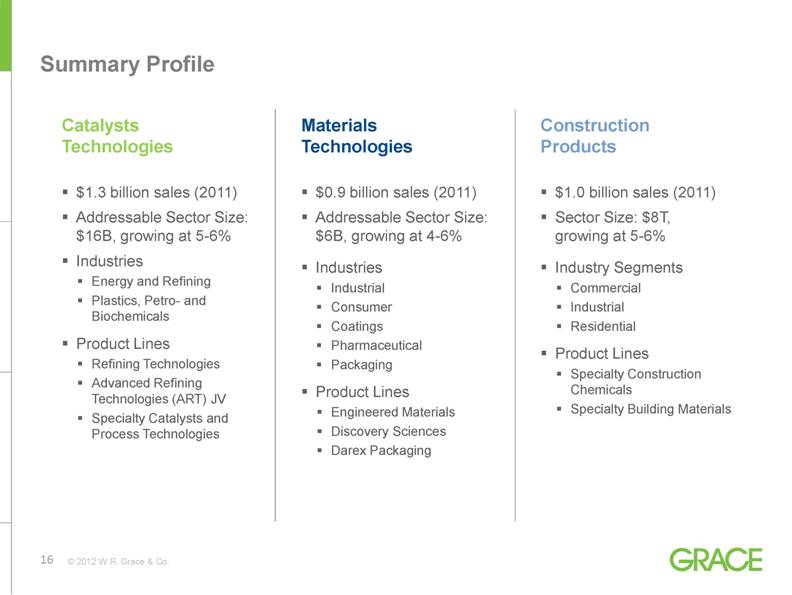
Summary Profile $1.3 billion sales (2011) Addressable Sector Size: $16B, growing at 5-6% Industries Energy and Refining Plastics, Petro- and Biochemicals Product Lines Refining Technologies Advanced Refining Technologies (ART) JV Specialty Catalysts and Process Technologies Catalysts Technologies $0.9 billion sales (2011) Addressable Sector Size: $6B, growing at 4-6% Industries Industrial Consumer Coatings Pharmaceutical Packaging Product Lines Engineered Materials Discovery Sciences Darex Packaging Materials Technologies $1.0 billion sales (2011) Sector Size: $8T, growing at 5-6% Industry Segments Commercial Industrial Residential Product Lines Specialty Construction Chemicals Specialty Building Materials Construction Products |
|
|
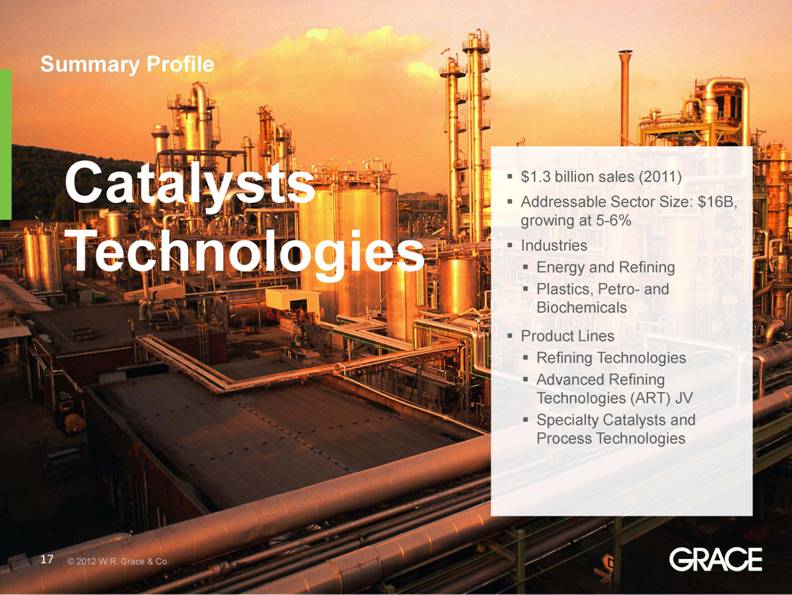
Summary Profile Catalysts Technologies $1.3 billion sales (2011) Addressable Sector Size: $16B, growing at 5-6% Industries Energy and Refining Plastics, Petro- and Biochemicals Product Lines Refining Technologies Advanced Refining Technologies (ART) JV Specialty Catalysts and Process Technologies |
|
|
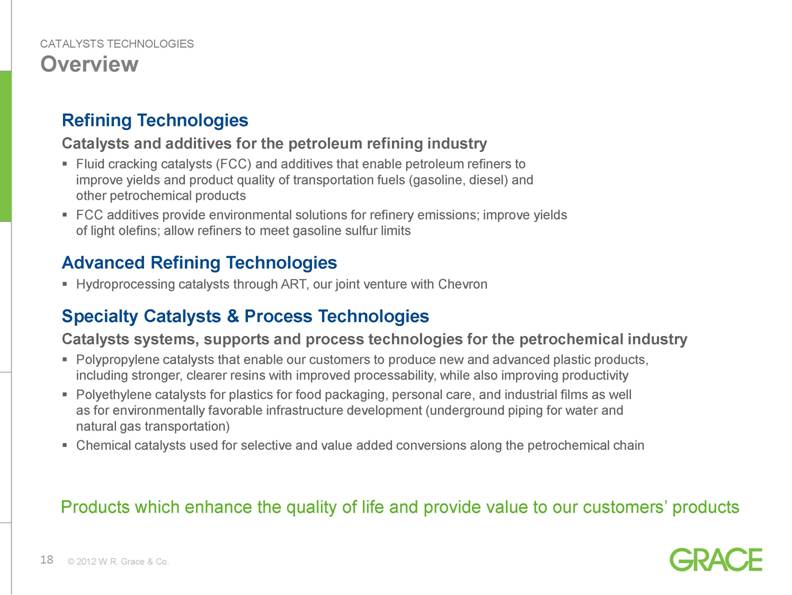
Overview Refining Technologies Catalysts and additives for the petroleum refining industry Fluid cracking catalysts (FCC) and additives that enable petroleum refiners to improve yields and product quality of transportation fuels (gasoline, diesel) and other petrochemical products FCC additives provide environmental solutions for refinery emissions; improve yields of light olefins; allow refiners to meet gasoline sulfur limits Advanced Refining Technologies Hydroprocessing catalysts through ART, our joint venture with Chevron Specialty Catalysts & Process Technologies Catalysts systems, supports and process technologies for the petrochemical industry Polypropylene catalysts that enable our customers to produce new and advanced plastic products, including stronger, clearer resins with improved processability, while also improving productivity Polyethylene catalysts for plastics for food packaging, personal care, and industrial films as well as for environmentally favorable infrastructure development (underground piping for water and natural gas transportation) Chemical catalysts used for selective and value added conversions along the petrochemical chain CATALYSTS TECHNOLOGIES Products which enhance the quality of life and provide value to our customers’ products |
|
|
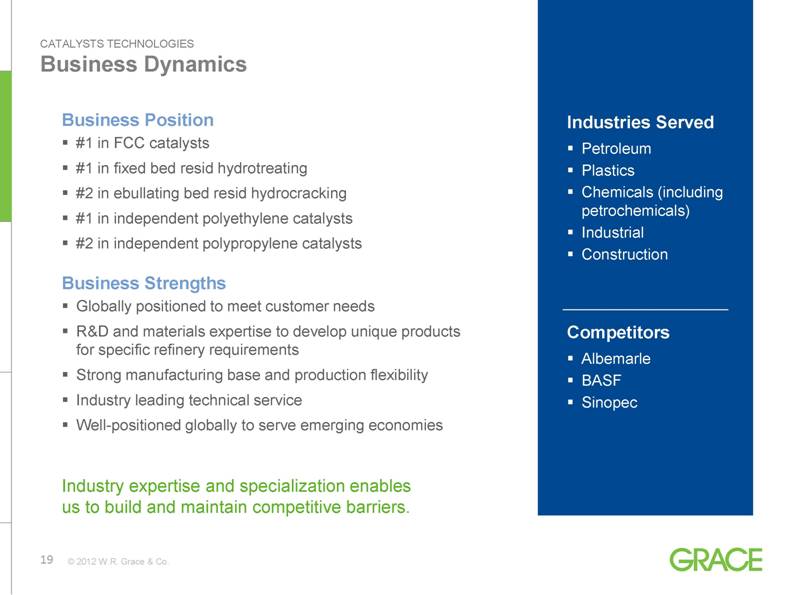
Business Dynamics Business Position #1 in FCC catalysts #1 in fixed bed resid hydrotreating #2 in ebullating bed resid hydrocracking #1 in independent polyethylene catalysts #2 in independent polypropylene catalysts Business Strengths Globally positioned to meet customer needs R&D and materials expertise to develop unique products for specific refinery requirements Strong manufacturing base and production flexibility Industry leading technical service Well-positioned globally to serve emerging economies CATALYSTS TECHNOLOGIES Industries Served Petroleum Plastics Chemicals (including petrochemicals) Industrial Construction Competitors Albemarle BASF Sinopec Industry expertise and specialization enables us to build and maintain competitive barriers. |
|
|
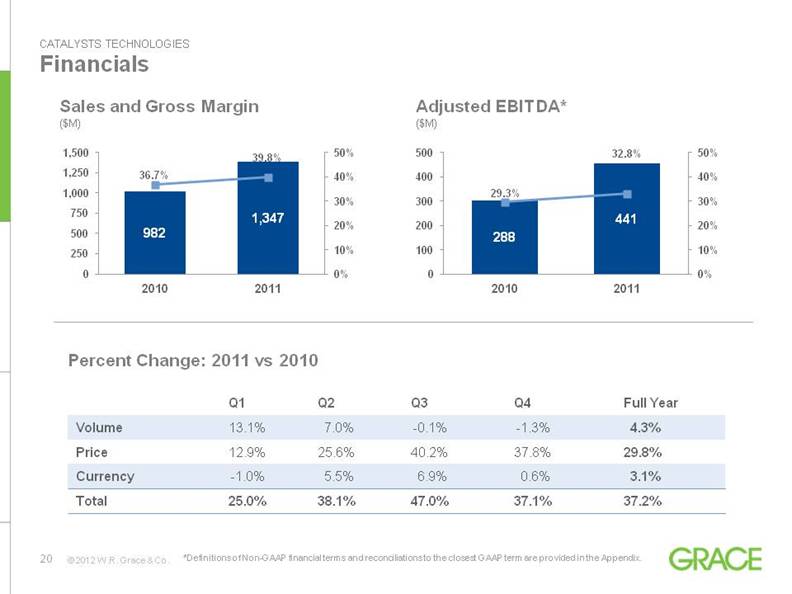
Financials CATALYSTS TECHNOLOGIES *Definitions of Non-GAAP financial terms and reconciliations to the closest GAAP term are provided in the Appendix. Q1 Q2 Q3 Q4 Full Year Volume 13.1% 7.0% -0.1% -1.3% 4.3% Price 12.9% 25.6% 40.2% 37.8% 29.8% Currency -1.0% 5.5% 6.9% 0.6% 3.1% Total 25.0% 38.1% 47.0% 37.1% 37.2% Percent Change: 2011 vs 2010 Sales and Gross Margin ($M) Adjusted EBITDA* ($M) |
|
|
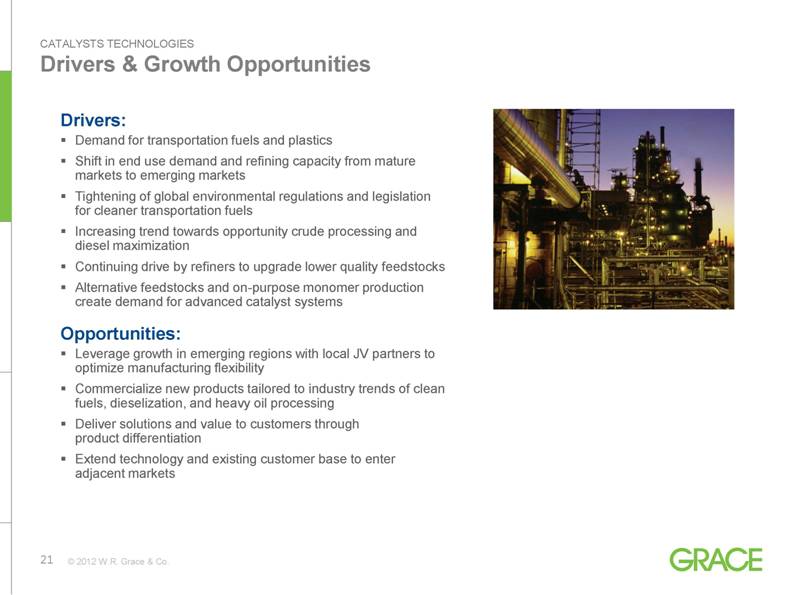
Drivers & Growth Opportunities Drivers: Demand for transportation fuels and plastics Shift in end use demand and refining capacity from mature markets to emerging markets Tightening of global environmental regulations and legislation for cleaner transportation fuels Increasing trend towards opportunity crude processing and diesel maximization Continuing drive by refiners to upgrade lower quality feedstocks Alternative feedstocks and on-purpose monomer production create demand for advanced catalyst systems Opportunities: Leverage growth in emerging regions with local JV partners to optimize manufacturing flexibility Commercialize new products tailored to industry trends of clean fuels, dieselization, and heavy oil processing Deliver solutions and value to customers through product differentiation Extend technology and existing customer base to enter adjacent markets CATALYSTS TECHNOLOGIES |
|
|
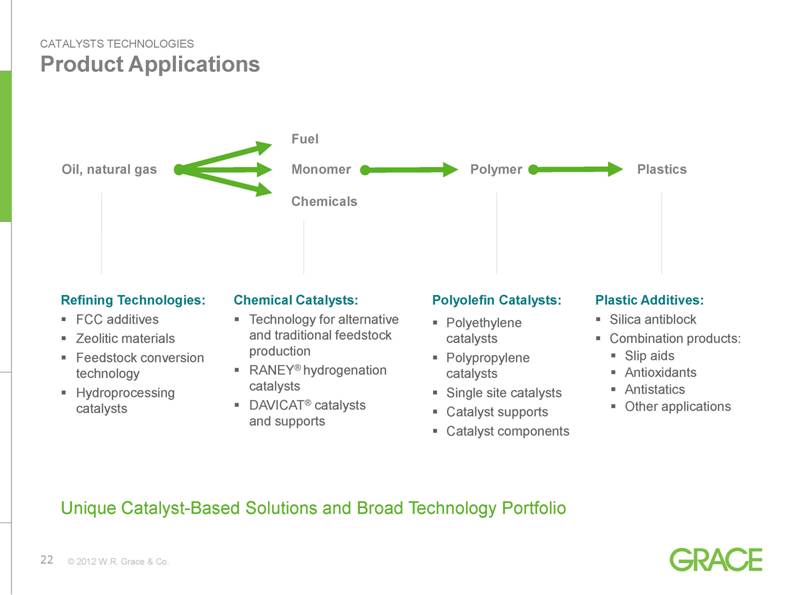
Product Applications CATALYSTS TECHNOLOGIES Unique Catalyst-Based Solutions and Broad Technology Portfolio Polymer Oil, natural gas Plastics Monomer Chemicals Fuel |
|
|
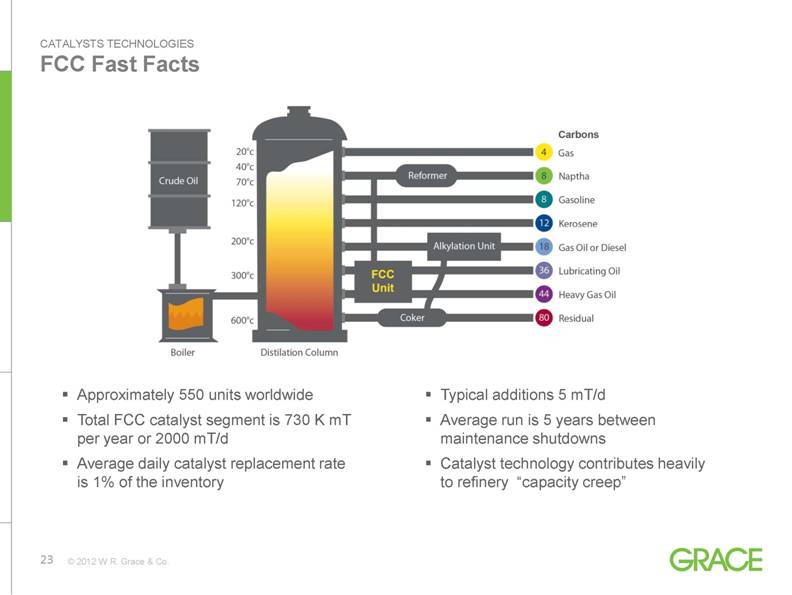
FCC Fast Facts CATALYSTS TECHNOLOGIES |
|
|
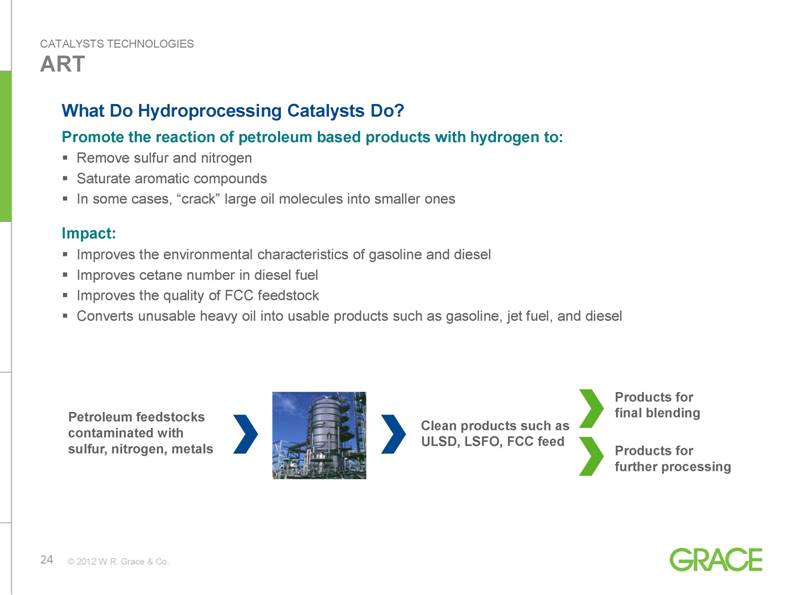
ART What Do Hydroprocessing Catalysts Do? Promote the reaction of petroleum based products with hydrogen to: Remove sulfur and nitrogen Saturate aromatic compounds In some cases, “crack” large oil molecules into smaller ones Impact: Improves the environmental characteristics of gasoline and diesel Improves cetane number in diesel fuel Improves the quality of FCC feedstock Converts unusable heavy oil into usable products such as gasoline, jet fuel, and diesel CATALYSTS TECHNOLOGIES Petroleum feedstocks contaminated with sulfur, nitrogen, metals Products for final blending Products for further processing Clean products such as ULSD, LSFO, FCC feed |
|
|
Summary Profile Materials Technologies $0.9 billion sales (2011) Addressable Sector Size: $6B, growing at 4-6% Industries Industrial Consumer Coatings Pharmaceutical Packaging Product Lines Engineered Materials Discovery Sciences Darex Packaging |
|
|
Overview Value-added, materials-based specialty products for a variety of industrial, consumer, food / beverage, coatings, and packaging uses Industrial Multifunctional additives for use in coatings, tires, biofuel, paper, metal casting, plastics and windows Consumer Silica-based process aids and additives for the toothpaste, beer, edible oil, food and cosmetic segments Coatings Silica-based matting and anti corrosion materials for industrial and consumer coatings Pharmaceutical Silica-based media for purification, excipients, intermediates, and complementary chromatography tools and instrumentation Packaging Formulated coatings and sealants for food, beverage, industrial, and personal care packaging MATERIALS TECHNOLOGIES A history of innovation tailored to a diversity of applications |
|
|
Business Dynamics Business Position Leading supplier of materials-based specialty products for a variety of industrial, consumer, food /beverage, coatings, and packaging uses #1 in specialty silica gel #1 in can sealants Strong materials technology base in precipitated and colloidal silica, molecular sieves, can coatings, and closure sealants Innovative leader in flash chromatography Strengths Strong technology base Diversified portfolio of products across several silica platforms Broad scope of industries with high value niches Deep customer relationships and applications expertise Well-established global infrastructure MATERIALS TECHNOLOGIES Industries Served Industrial Coatings & Print Media Food & Beverage Pharmaceutical/Biotech Personal Care Packaging Competitors Engineered Materials Evonik EKA PQ Discovery Sciences Agilent Teledyne ISCO Packaging Altana Valspar |
|
|
Financials MATERIALS TECHNOLOGIES *Definitions of Non-GAAP financial terms and reconciliations to the closest GAAP term are provided in the Appendix. Q1 Q2 Q3 Q4 Full Year Volume 4.5% -0.8% -6.0% -5.6% -1.7% Price 3.0% 5.0% 5.9% 4.9% 4.7% Currency 0.0% 6.3% 7.2% 0.1% 3.5% Total 7.5% 10.5% 7.1% -0.6% 6.5% Sales and Gross Margin ($M/% of Sales) Adjusted EBITDA* ($M/% of Sales) Percent Change: 2011 vs. 2010 |
|
|
Drivers & Growth Opportunities Drivers: Emerging markets creating new demand for higher value consumer products Pharma patent expirations fueling new biotech and generic drug development Regulatory changes driving growth of sustainable technologies Growth of alternative fuels Opportunities: Leverage global manufacturing and technology capabilities to expand customer base Expand core capabilities into new segments Commercialize new non-intent BPA coating products, silicas for “green” tires, and non-PVC containing sealants Optimize materials portfolio to enable alternative fuel purification MATERIALS TECHNOLOGIES |
|
|
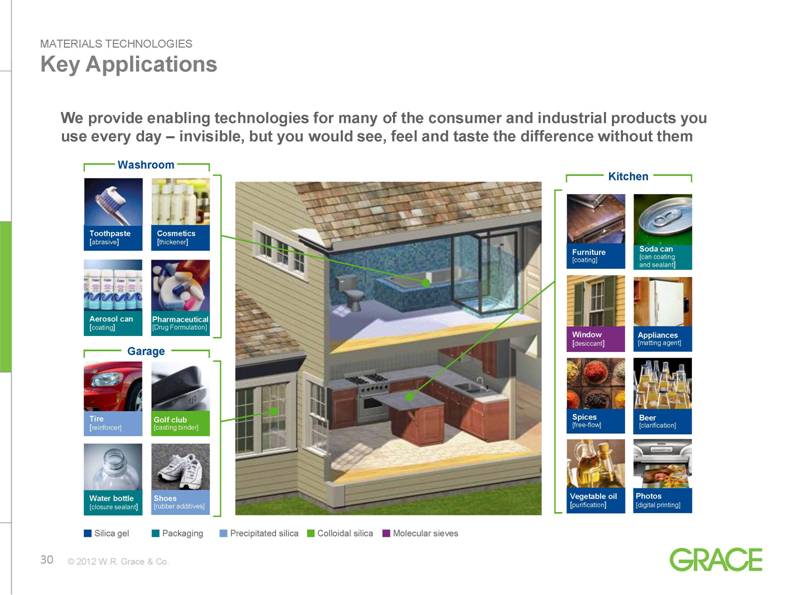
Key Applications MATERIALS TECHNOLOGIES We provide enabling technologies for many of the consumer and industrial products you use every day – invisible, but you would see, feel and taste the difference without them Garage Tire [reinforcer] Golf club [casting binder] Shoes [rubber additives] Toothpaste [abrasive] Cosmetics [thickener] Aerosol can [coating] Pharmaceutical [Drug Formulation] Washroom Kitchen Spices [free-flow] Furniture [coating] Appliances [matting agent] Vegetable oil [purification] Beer [clarification] Soda can [can coating and sealant] Window [desiccant] Photos [digital printing] Silica gel Packaging Precipitated silica Colloidal silica Molecular sieves Water bottle [closure sealant] |
|
|
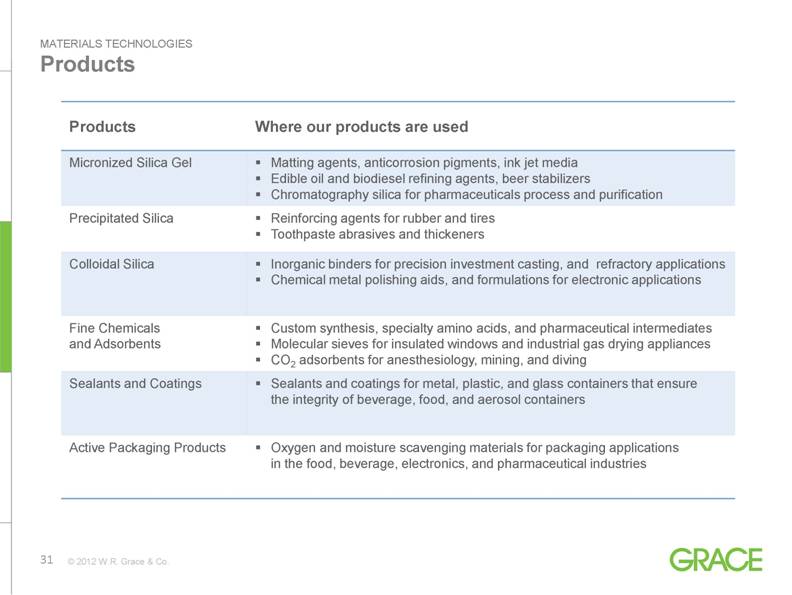
Products MATERIALS TECHNOLOGIES Products Where our products are used Micronized Silica Gel Matting agents, anticorrosion pigments, ink jet media Edible oil and biodiesel refining agents, beer stabilizers Chromatography silica for pharmaceuticals process and purification Precipitated Silica Reinforcing agents for rubber and tires Toothpaste abrasives and thickeners Colloidal Silica Inorganic binders for precision investment casting, and refractory applications Chemical metal polishing aids, and formulations for electronic applications Fine Chemicals and Adsorbents Custom synthesis, specialty amino acids, and pharmaceutical intermediates Molecular sieves for insulated windows and industrial gas drying appliances CO2 adsorbents for anesthesiology, mining, and diving Sealants and Coatings Sealants and coatings for metal, plastic, and glass containers that ensure the integrity of beverage, food, and aerosol containers Active Packaging Products Oxygen and moisture scavenging materials for packaging applications in the food, beverage, electronics, and pharmaceutical industries |
|
|
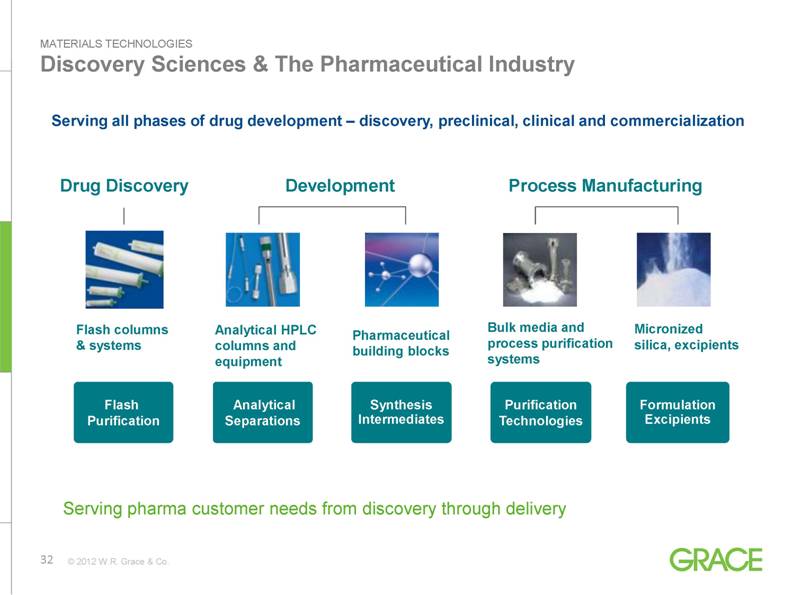
Discovery Sciences & The Pharmaceutical Industry MATERIALS TECHNOLOGIES Serving all phases of drug development – discovery, preclinical, clinical and commercialization Flash Purification Analytical Separations Synthesis Intermediates Purification Technologies Formulation Excipients Flash columns & systems Analytical HPLC columns and equipment Pharmaceutical building blocks Bulk media and process purification systems Micronized silica, excipients Serving pharma customer needs from discovery through delivery Drug Discovery Development Process Manufacturing |
|
|
Summary Profile Construction Products $1.0 billion sales (2011) Sector Size: $8T, growing at 5-6% Industry Segments Commercial Industrial Residential Product Lines Specialty Construction Chemicals Specialty Building Materials |
|
|
Overview Specialty construction materials, systems and services that strengthen, enhance and protect structures Specialty Construction Chemicals Specialty chemicals and systems that lower the costs of producing construction materials and improve their in-place performance Improve quality of concrete raw materials Allow optimization of materials to ensure mixes are fit-for-purpose Lower customers’ production costs of both cement and concrete Strengthen concrete – improve durability Reduce building and infrastructure maintenance Specialty Building Materials Barriers that provide protective systems to buildings and infrastructure Wall, air and vapor barriers Foundation waterproofing Roofing waterproofing Fire protection materials Products that improve contractor productivity CONSTRUCTION PRODUCTS Our products contribute to sustainability: Less environmental impact, efficient land use, green building practices, and flexible design options |

|
|
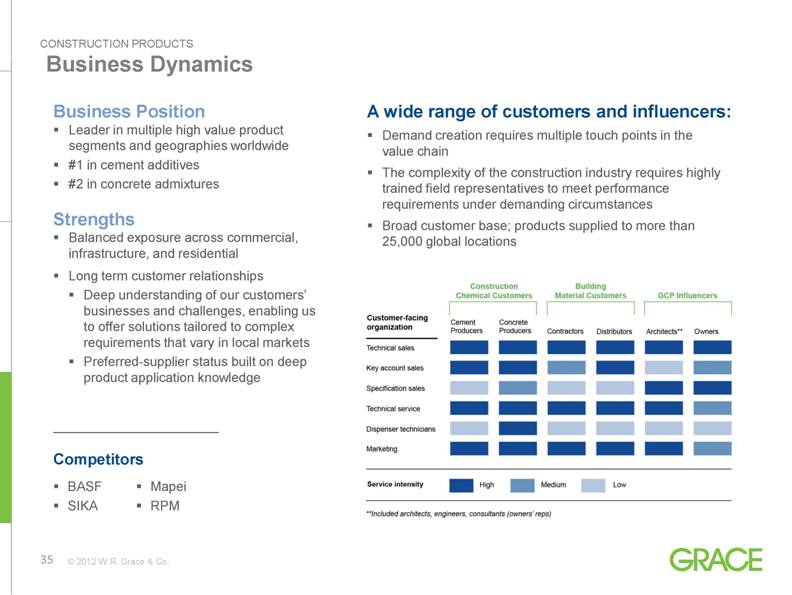
Business Dynamics Business Position Leader in multiple high value product segments and geographies worldwide #1 in cement additives #2 in concrete admixtures Strengths Balanced exposure across commercial, infrastructure, and residential Long term customer relationships Deep understanding of our customers’ businesses and challenges, enabling us to offer solutions tailored to complex requirements that vary in local markets Preferred-supplier status built on deep product application knowledge CONSTRUCTION PRODUCTS A wide range of customers and influencers: Demand creation requires multiple touch points in the value chain The complexity of the construction industry requires highly trained field representatives to meet performance requirements under demanding circumstances Broad customer base; products supplied to more than 25,000 global locations Competitors BASF Mapei SIKA RPM |
|
|
Financials CONSTRUCTION PRODUCTS *Definitions of Non-GAAP financial terms and reconciliations to the closest GAAP term are provided in the Appendix. Q1 Q2 Q3 Q4 Full Year Volume 1.7% 4.2% 13.1% 12.7% 7.7% Price 2.1% 2.4% 3.1% 2.7% 3.0% Currency 1.7% 5.0% 5.8% -1.0% 2.9% Total 5.5% 11.6% 22.0% 14.4% 13.6% Percent Change: 2011 vs 2010 Sales and Gross Margin ($M) Adjusted EBITDA* ($M) |

|
|
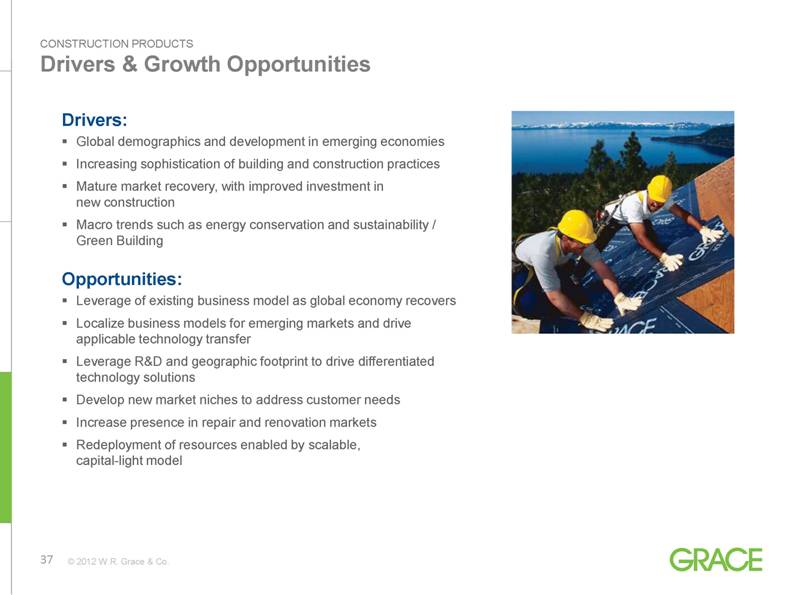
Drivers & Growth Opportunities CONSTRUCTION PRODUCTS |
|
|
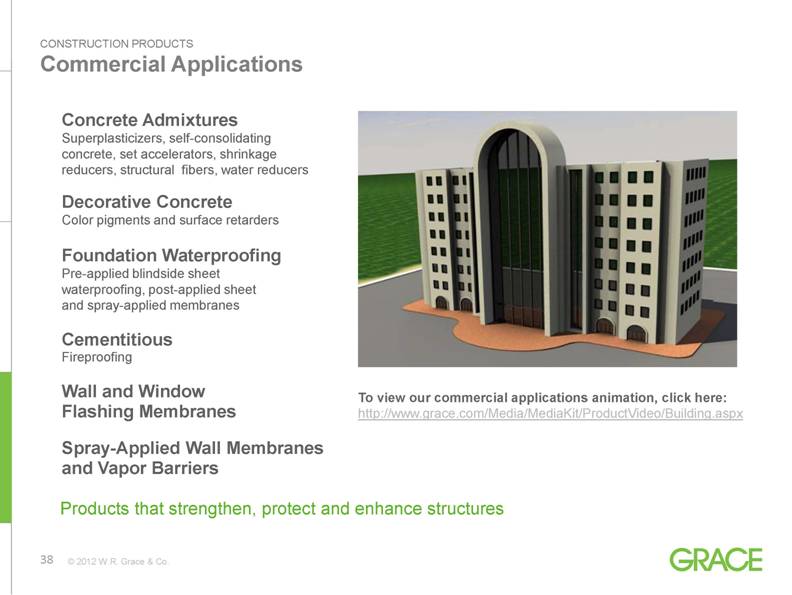
Commercial Applications Concrete Admixtures Superplasticizers, self-consolidating concrete, set accelerators, shrinkage reducers, structural fibers, water reducers Decorative Concrete Color pigments and surface retarders Foundation Waterproofing Pre-applied blindside sheet waterproofing, post-applied sheet and spray-applied membranes Cementitious Fireproofing Wall and Window Flashing Membranes Spray-Applied Wall Membranes and Vapor Barriers CONSTRUCTION PRODUCTS To view our commercial applications animation, click here: http://www.grace.com/Media/MediaKit/ProductVideo/Building.aspx Products that strengthen, protect and enhance structures |
|
|
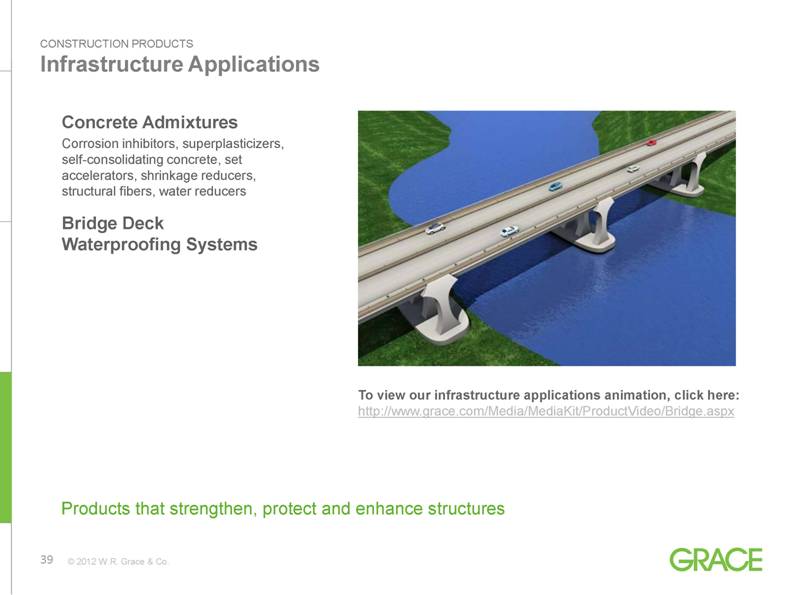
Infrastructure Applications Concrete Admixtures Corrosion inhibitors, superplasticizers, self-consolidating concrete, set accelerators, shrinkage reducers, structural fibers, water reducers Bridge Deck Waterproofing Systems CONSTRUCTION PRODUCTS To view our infrastructure applications animation, click here: http://www.grace.com/Media/MediaKit/ProductVideo/Bridge.aspx Products that strengthen, protect and enhance structures |
|
|
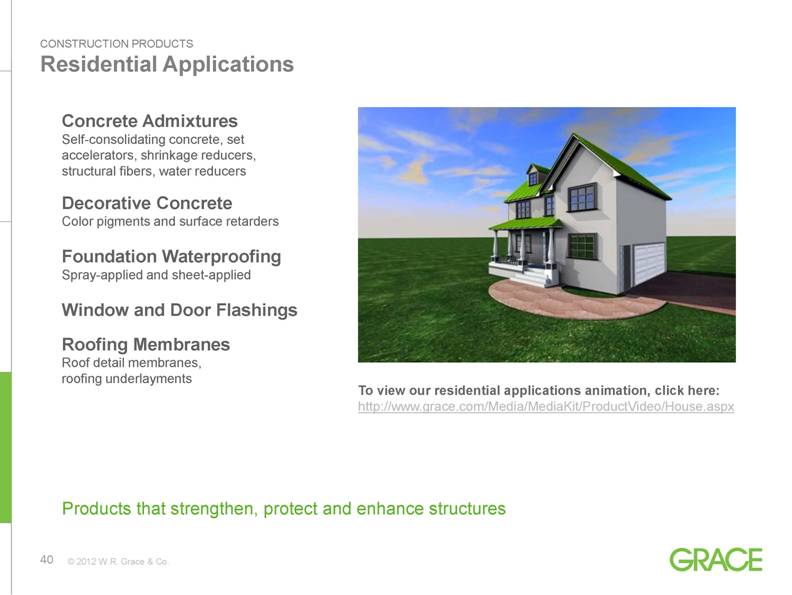
Residential Applications Concrete Admixtures Self-consolidating concrete, set accelerators, shrinkage reducers, structural fibers, water reducers Decorative Concrete Color pigments and surface retarders Foundation Waterproofing Spray-applied and sheet-applied Window and Door Flashings Roofing Membranes Roof detail membranes, roofing underlayments CONSTRUCTION PRODUCTS To view our residential applications animation, click here: http://www.grace.com/Media/MediaKit/ProductVideo/House.aspx Products that strengthen, protect and enhance structures |
|
|
[LOGO] |
|
|
Definitions and Reconciliations Non-GAAP Financial Terms Adjusted EBIT (Earnings Before Interest and Taxes) is net income adjusted for interest income and expense, income taxes, Chapter 11- and asbestos-related costs, net, restructuring expenses and related asset impairments and gains and losses on sales of product lines and other investments. Adjusted EBITDA (Earnings Before Interest, Taxes, Depreciation and Amortization) is Adjusted EBIT plus depreciation and amortization expenses. Segment Operating Income is Adjusted EBIT adjusted for defined benefit pension expense and corporate costs. Adjusted EBIT Return on Invested Capital is Adjusted EBIT divided by the sum of net working capital, properties and equipment and certain other assets and liabilities. Free Cash Flow is Cash Flow from Operations minus Capital Expenditures. Adjusted Free Cash Flow is Cash Flow from Operations minus Capital Expenditures, plus: Chapter 11 expenses paid, cash paid to resolve contingencies subject to Chapter 11, accelerated payments under defined benefit pension arrangements, and expenditures for asbestos-related environmental remediation. |
|
|
Definitions and Reconciliations (continued) Adjusted EBIT, Adjusted EBITDA, Segment Operating Income, and Adjusted EBIT Return on Invested Capital do not purport to represent income or cash flow measures as defined under U.S. generally accepted accounting principles (GAAP), and should not be used as alternatives to such measures as an indicator of Grace’s performance. These measures are provided to investors and others to improve the period-to-period comparability and peer-to-peer comparability of Grace’s financial results, and to ensure that investors understand the information we use to evaluate the performance of our businesses. Adjusted EBIT has material limitations as an operating performance measure because it excludes Chapter 11- and asbestos-related costs and may exclude income and expenses from restructuring and divestment activities, which historically have been material components of Grace’s net income. Adjusted EBITDA also has material limitations as an operating performance measure since it excludes the impact of depreciation and amortization expense. Grace’s business is substantially dependent on the successful deployment of capital, and depreciation and amortization expense is a necessary element of Grace’s costs. Grace compensates for the limitations of these measurements by using these indicators together with net income as measured under GAAP when evaluating its results of operations. Adjusted EBIT and Adjusted EBITDA should be used together with net income measured under GAAP when evaluating Grace’s results of operations. Investors should evaluate these measures in conjunction with Grace’s Consolidated Financial Statements as presented in Grace’s annual reports on Form 10-K for a more complete analysis of its financial results. |
|
|
Definitions and Reconciliations (continued) Adjusted Free Cash Flow is a non-GAAP measure. Grace uses Adjusted Free Cash Flow as a liquidity measure to evaluate its ability to generate cash to support its ongoing business operations, to invest in its businesses, and to provide a return of cash to shareholders. Adjusted Free Cash Flow does not purport to represent an income or cash flow measure as defined under U.S. GAAP, and should not be used as an alternative to such measures as an indicator of Grace's performance. This measure is provided to investors and others to improve the period-to-period comparability and peer-to-peer comparability of Grace's financial results, and to ensure that investors understand the information Grace uses to evaluate the performance of its businesses. Adjusted Free Cash Flow has material limitations as a liquidity measure because it excludes the cash flow effects of Chapter 11- and asbestos-related costs, and any accelerated defined benefit pension plan contributions, which historically have been material components of Grace's cash flow. Grace compensates for the limitations of this measurement by using this indicator together with Net Cash Flow Provided by Operating Activities as measured under GAAP when analyzing its liquidity. Adjusted Free Cash Flow should be evaluated together with Net Cash Provided by Operating Activities as measured under GAAP when evaluating Grace's financial performance. |
|
|
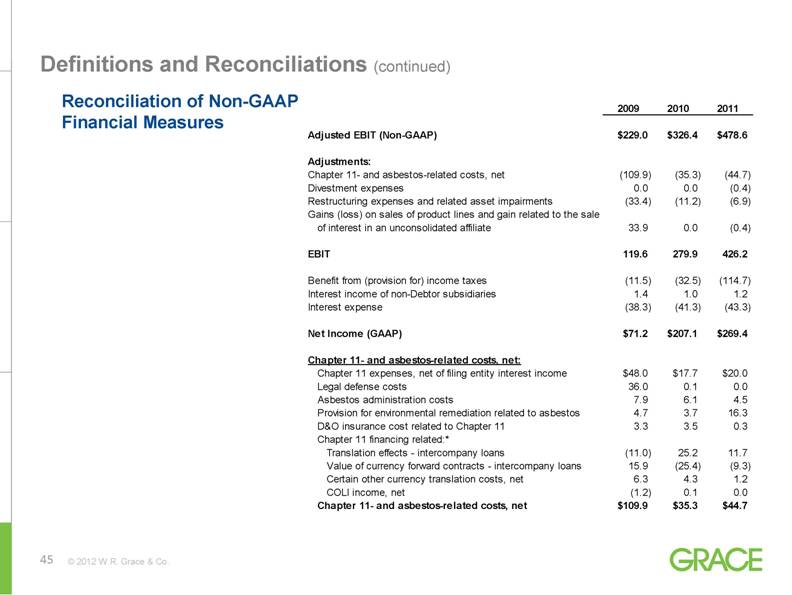
Definitions and Reconciliations (continued) Reconciliation of Non-GAAP Financial Measures 2009 2010 2011 Adjusted EBIT (Non-GAAP) $229.0 $326.4 $478.6 Adjustments: Chapter 11- and asbestos-related costs, net (109.9) (35.3) (44.7) Divestment expenses 0.0 0.0 (0.4) Restructuring expenses and related asset impairments (33.4) (11.2) (6.9) Gains (loss) on sales of product lines and gain related to the sale of interest in an unconsolidated affiliate 33.9 0.0 (0.4) EBIT 119.6 279.9 426.2 Benefit from (provision for) income taxes (11.5) (32.5) (114.7) Interest income of non-Debtor subsidiaries 1.4 1.0 1.2 Interest expense (38.3) (41.3) (43.3) Net Income (GAAP) $71.2 $207.1 $269.4 Chapter 11- and asbestos-related costs, net: Chapter 11 expenses, net of filing entity interest income $48.0 $17.7 $20.0 Legal defense costs 36.0 0.1 0.0 Asbestos administration costs 7.9 6.1 4.5 Provision for environmental remediation related to asbestos 4.7 3.7 16.3 D&O insurance cost related to Chapter 11 3.3 3.5 0.3 Chapter 11 financing related:* Translation effects - intercompany loans (11.0) 25.2 11.7 Value of currency forward contracts - intercompany loans 15.9 (25.4) (9.3) Certain other currency translation costs, net 6.3 4.3 1.2 COLI income, net (1.2) 0.1 0.0 Chapter 11- and asbestos-related costs, net $109.9 $35.3 $44.7 |
|
|
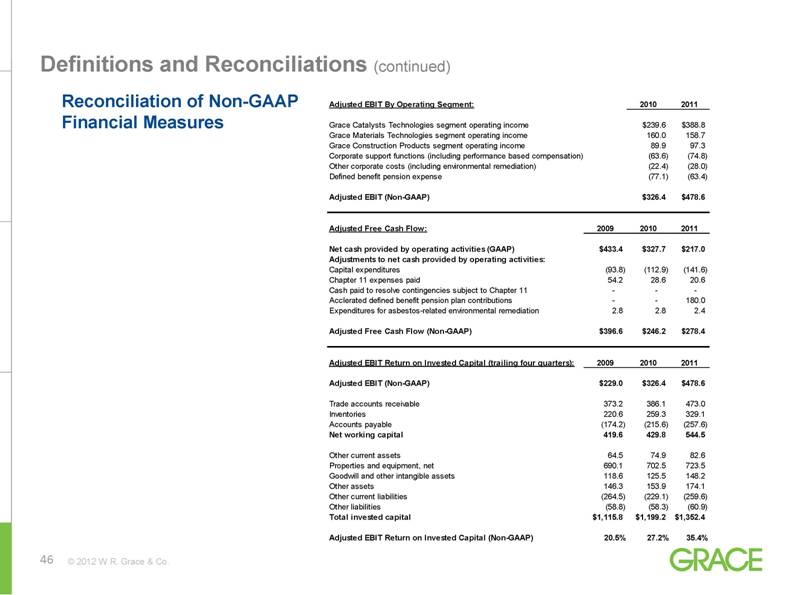
Definitions and Reconciliations (continued) Reconciliation of Non-GAAP Financial Measures Adjusted EBIT By Operating Segment: 2010 2011 Grace Catalysts Technologies segment operating income $239.6 $388.8 Grace Materials Technologies segment operating income 160.0 158.7 Grace Construction Products segment operating income 89.9 97.3 Corporate support functions (including performance based compensation) (63.6) (74.8) Other corporate costs (including environmental remediation) (22.4) (28.0) Defined benefit pension expense (77.1) (63.4) Adjusted EBIT (Non-GAAP) $326.4 $478.6 Adjusted Free Cash Flow: 2009 2010 2011 Net cash provided by operating activities (GAAP) $433.4 $327.7 $217.0 Adjustments to net cash provided by operating activities: Capital expenditures (93.8) (112.9) (141.6) Chapter 11 expenses paid 54.2 28.6 20.6 Cash paid to resolve contingencies subject to Chapter 11 - - - Acclerated defined benefit pension plan contributions - - 180.0 Expenditures for asbestos-related environmental remediation 2.8 2.8 2.4 Adjusted Free Cash Flow (Non-GAAP) $396.6 $246.2 $278.4 Adjusted EBIT Return on Invested Capital (trailing four quarters): 2009 2010 2011 Adjusted EBIT (Non-GAAP) $229.0 $326.4 $478.6 Trade accounts receivable 373.2 386.1 473.0 Inventories 220.6 259.3 329.1 Accounts payable (174.2) (215.6) (257.6) Net working capital 419.6 429.8 544.5 Other current assets 64.5 74.9 82.6 Properties and equipment, net 690.1 702.5 723.5 Goodwill and other intangible assets 118.6 125.5 148.2 Other assets 146.3 153.9 174.1 Other current liabilities (264.5) (229.1) (259.6) Other liabilities (58.8) (58.3) (60.9) Total invested capital $1,115.8 $1,199.2 $1,352.4 Adjusted EBIT Return on Invested Capital (Non-GAAP) 20.5% 27.2% 35.4% |