Attached files
| file | filename |
|---|---|
| EXCEL - IDEA: XBRL DOCUMENT - DYNARESOURCE INC | Financial_Report.xls |
| EX-31.1 - CERTIFICATION - DYNARESOURCE INC | dynr_ex311.htm |
| EX-31.2 - CERTIFICATION - DYNARESOURCE INC | dynr_ex312.htm |
| EX-32.1 - CERTIFICATION - DYNARESOURCE INC | dynr_ex321.htm |
UNITED STATES
SECURITIES AND EXCHANGE COMMISSION
WASHINGTON, D.C. 20549
FORM 10-K
þ ANNUAL REPORT PURSUANT TO SECTION 13 OR 15(d) OF THE SECURITIES EXCHANGE ACT OF 1934
For the fiscal year ended December 31, 2011
o TRANSITION REPORT PURSUANT TO SECTION 13 OR 15(d) OF THE SECURITIES EXCHANGE ACT OF 1934
For the transition period from ______________ to ______________
Commission File Number: 000-30371
DYNARESOURCE, INC.
(Exact name of Registrant as specified in its charter)
|
Delaware
|
94-1589426
|
|
|
(State of Incorporation)
|
(Employer Identification No.)
|
|
222 W. Las Colinas Blvd.,
Suite 744 East Tower Irving, Texas
|
75039
|
|
|
(Address of principal executive offices)
|
(Zip Code)
|
Registrant’s telephone number: Phone: (972) 868-9066; Fax: (972) 868-9067
Securities registered pursuant to Section 12(b) of the Act:
None
Securities registered pursuant to Section 12(g) of the Act:
Common Stock; $0.01 Par Value
(Title of Class)
Indicate by check mark if the registrant is a well-known seasoned issuer, as defined in Rule 405 of the Securities Act.
Yes o No þ
Indicate by check mark if the registrant is not required to file reports pursuant to Section 13 or Section 15(d) of the Act.
Yes o No þ
Indicate by check mark whether the registrant (1) has filed all reports required to be filed by Section 13 or 15(d) of the Securities Exchange Act of 1934 during the preceding 12 months (or for such shorter period that the registrant was required to file such reports), and (2) has been subject to such filing requirements for the past 90 days.
Yes þ No o
Indicate by check mark whether the registrant has submitted electronically and posted on its corporate Website, if any, every Interactive Data File required to be submitted and posted pursuant to Rule 405 of Regulation S-T (§ 232.405 of this chapter) during the preceding 12 months (or for such shorter period that the registrant was required to submit and post such files).
Yes o No o
Indicate by check mark if disclosure of delinquent filers pursuant to Item 405 of Regulation S-K (§ 229.405 of this chapter) is not contained herein, and will not be contained, to the best of registrant’s knowledge, in definitive proxy or information statements incorporated by reference in Part III of this Form 10-K or any amendment to this Form 10-K. þ
Indicate by a check mark whether the Registrant is a large filer, an accredited filer, non-accredited filer, or a smaller reporting company. See the definitions of “large accredited filer”, “accredited filer” and “smaller reporting company” in Rule 12b-2 of the Exchange Act.
| Large accredited filer | o | Accredited filer | o |
| Non-accredited filer | o | Smaller reporting company | þ |
Indicate by check mark whether the registrant is a shell company (as defined in Rule 12b-2 of the Act).
Yes o No þ
The aggregate market value of common stock, par value $0.01 per share, held by non-affiliates of the registrant, based on the average bid and asked prices of the common stock on June 30, 2011 (the last business day of the registrant’s most recently completed second fiscal quarter) was approximately $35.2 million. For purposes of this computation, all officers, directors and 10% beneficial owners of the registrant are deemed to be affiliates. Such determination should not be deemed an admission that such officers, directors or 10% beneficial owners are, in fact, affiliates of the registrant.
Number of common shares outstanding at March 30, 2012 10,602,868
DOCUMENTS INCORPORATED BY REFERENCE
Listed below are documents incorporated herein by reference and the part of this Report into which each such document is incorporated:
None
DYNARESOURCE, INC.
FORM 10-K
TABLE OF CONTENTS
|
PART I
|
|||||
|
ITEM 1.
|
Business
|
5 | |||
|
ITEM 1A.
|
Risk Factors
|
11 | |||
|
ITEM 1B.
|
Unresolved Staff Comments
|
15 | |||
|
ITEM 2.
|
Properties
|
15 | |||
|
ITEM 3.
|
Legal Proceedings
|
18 | |||
|
ITEM 4.
|
Mine Safety Disclosures
|
18 | |||
|
PART II
|
|||||
|
ITEM 5.
|
Market for Registrant’s Common Equity, Related Stockholders Matters and Issuer Purchases of Equity Securities
|
19 | |||
|
ITEM 6.
|
Selected Financial Data
|
19 | |||
|
ITEM 7.
|
Management’s Discussion and Analysis of Financial Condition and Results of Operation
|
20 | |||
|
ITEM 7A.
|
Quantitative and Qualitative Disclosures About Market Risk
|
31 | |||
|
ITEM 8.
|
Financial Statements and Supplementary Data
|
32 | |||
|
ITEM 9.
|
Changes in and Disagreements with Accountants on Accounting and Financial Disclosure
|
50 | |||
|
ITEM 9A.
|
Controls and Procedures
|
50 | |||
|
ITEM 9B.
|
Other Information
|
51 | |||
|
PART III
|
|||||
|
ITEM 10.
|
Directors, Executive Officers and Corporate Governance
|
51 | |||
|
ITEM 11.
|
Executive Compensation
|
53 | |||
|
ITEM 12.
|
Security Ownership of Certain Beneficial Owners and Management and Related Stockholder Matters
|
54 | |||
|
ITEM 13.
|
Certain Relationships and Related Transactions, and Director Independence
|
55 | |||
|
ITEM 14.
|
Principal Accounting Fees and Services
|
56 | |||
|
PART IV
|
|||||
|
ITEM 15.
|
Exhibits and Financial Statement Schedules
|
57 | |||
|
EXHIBIT INDEX
|
|||||
|
Exhibit 31.1
|
Certification of Chief Executive Officer, pursuant to Rule 13a-14(a) of the Exchange Act, as enacted by Section 302 of the Sarbanes-Oxley Act of 2002
|
||||
|
Exhibit 31.2
|
Certification of Chief Financial Officer, pursuant to Rule 13a-14(a) of the Exchange Act, as enacted by Section 302 of the Sarbanes-Oxley Act of 2002
|
||||
|
Exhibit 32.1
|
Certification of Chief Executive Officer and Chief Financial Officer, pursuant to 18 United States Code Section 1350, as enacted by Section 906 of the Sarbanes-Oxley Act of 2002
|
||||
3
FORWARD-LOOKING STATEMENTS
This annual report on Form 10-K includes forward-looking statements within the meaning of Section 27A of the Securities Act of 1933, as amended, which we refer to in this annual report as the Securities Act, and Section 21E of the Securities Exchange Act of 1934, as amended, which we refer to in this annual report as the Exchange Act. Forward-looking statements are not statements of historical fact but rather reflect our current expectations, estimates and predictions about future results and events. These statements may use words such as “anticipate,” “believe,” “estimate,” “expect,” “intend,” “predict,” “project” and similar expressions as they relate to us or our management. When we make forward-looking statements, we are basing them on our management’s beliefs and assumptions, using information currently available to us. These forward-looking statements are subject to risks, uncertainties and assumptions, including but not limited to, risks, uncertainties and assumptions discussed in this annual report. Factors that can cause or contribute to these differences include those described under the headings “Risk Factors” and “Management Discussion and Analysis and Plan of Operation.”
If one or more of these or other risks or uncertainties materialize, or if our underlying assumptions prove to be incorrect, actual results may vary materially from what we projected. Any forward-looking statement you read in this annual report reflects our current views with respect to future events and is subject to these and other risks, uncertainties and assumptions relating to our operations, results of operations, growth strategy and liquidity. All subsequent written and oral forward-looking statements attributable to us or individuals acting on our behalf are expressly qualified in their entirety by this paragraph. You are cautioned not to place undue reliance on forward-looking statements, which speak only as of the date of this annual report. The Company expressly disclaims any obligation to release publicly any updates or revisions to these forward-looking statements to reflect any change in its views or expectations. The Company can give no assurances that such forward-looking statements will prove to be correct.
IMPORTANT NOTE REGARDING CANADIAN DISCLOSURE STANDARDS
The Company is an “OTC Reporting Issuer” as that term is defined in BC Instrument 51-509, Issuers Quoted in the U.S. Over-the-Counter Markets, promulgated by the British Columbia Securities Commission. Accordingly, certain disclosure in this annual report has been prepared in accordance with the requirements of securities laws in effect in Canada, which differ from the requirements of United States securities laws. In Canada, an issuer is required to provide technical information with respect to mineralization, including reserves and resources, if any, on its mineral exploration properties in accordance with Canadian requirements, which differ significantly from the requirements of the United States Securities and Exchange Commission (the “SEC”) applicable to registration statements and reports filed by United States companies pursuant to the Securities Act or the Exchange Act. As such, information contained in this annual report concerning descriptions of mineralization under Canadian standards may not be comparable to similar information made public by United States companies subject to the reporting and disclosure requirements of the SEC and not subject to Canadian securities legislation. This annual report may use the terms “measured mineral resources”, “indicated mineral resources” and “inferred mineral resources”. While these terms are recognized and required by Canadian securities legislation (under National Instrument 43-101, Standards of Disclosure for Mineral Projects), the SEC does not recognize them. United States investors are cautioned not to assume that any part or all of the mineral deposits in these categories will ever be converted to reserves. In addition, “inferred mineral resources” have a great amount of uncertainty as to their existence and economic and legal feasibility. It cannot be assumed that all or any part of a measured mineral resource, indicated mineral resource or inferred mineral resource will ever be upgraded to a higher category. Under Canadian securities legislation, estimates of inferred mineral resources may not form the basis of feasibility or pre-feasibility studies, although they may form, in certain circumstances, the basis of a “preliminary economic assessment” as that term is defined in National Instrument 43-101, Standards of Disclosure for Mineral Projects. U.S. investors are cautioned not to assume that any part or all of any reported measured mineral resources, indicated mineral resources or inferred mineral resources referred to herein or in the Technical Report are economically or legally mineable.
4
PART I
ITEM 1. BUSINESS
Company.
DynaResource, Inc., the Company described herein, is a Delaware corporation, with offices located at 222 W. Las Colinas Blvd., Suite 744 East Tower, Irving, Texas 75039. It can be reached by phone at (972) 868-9066 and by fax at (972) 868-9067.
History.
The Company was incorporated in the State of California on September 28, 1937, under the name West Coast Mines, Inc. In November 1998, the Company re-domiciled from California to Delaware and changed its name to DynaResource, Inc.
The Company is in the business of acquiring, investing in, and developing precious metal properties, and the production of precious metals.
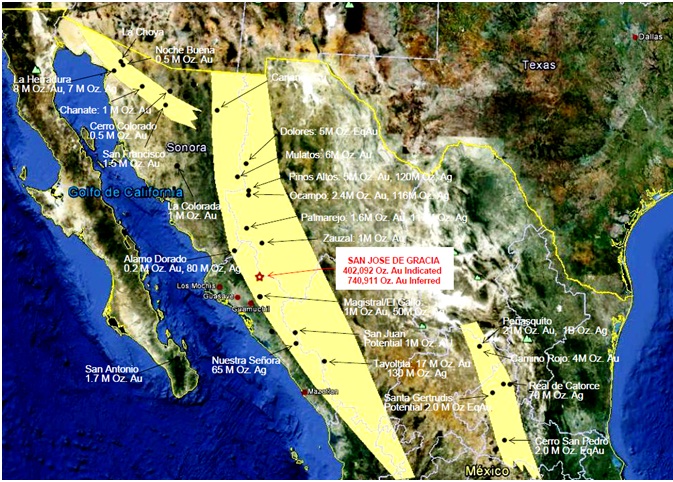
Through its 50% owned Mexican subsidiary, DynaResource de México, S.A. de C.V. (“DynaMéxico”), the Company owns a portfolio of mining concessions that currently includes its interests in the San José de Gracia (SJG) Project in Sinaloa State, in northern Mexico. The SJG District covers 69,121 hectares (170,802 acres) on the west side of the Sierra Madre Mountains.
DynaResource owns a 50% common stock interest in DynaMéxico, and the remaining 50% common stock interest is held by Goldgroup Mining Inc.
A wholly owned subsidiary of the Company, Mineras de DynaResource S.A. de C.V. (“MinerasDyna”), entered into an operating agreement with DynaMéxico on April 15, 2005 and, as a consequence of that agreement, is the named exclusive operating entity for the SJG Project.
In 2005, the Company formed another wholly owned subsidiary, DynaResource Operaciones, SA de C.V. (“DynaOperaciones”). DynaOperaciones entered into a personnel management agreement with MinerasDyna and, as a consequence of that agreement, is the exclusive manager of personnel for the SJG Project.
The SJG District is comprised of 33 mining concessions covering 69,121 hectares (171,802 acres) and is located within the Sierra Madre gold-silver belt, where the majority of hydrothermal deposits in Mexico are located. The Company’s concessions, all of which are formally held by DynaMéxico, are granted by the Mexican government, or acquired from previous owners. The Company’s concessions are comprised of a combination of exploration concessions and development concessions, are filed in the Public Registry of Mining, and are scheduled to expire from 2028 through 2058. The concessions can be renewed prior to the expiry dates. The table below contains a listing of the mineral concessions currently held by DynaMéxico.
DynaMexico plans to apply for certain operating licenses and additional permits as part of its pre-production activities for the San Jose de Gracia property. The licenses and permits would be issued by the host government, whether state or federal.
5
Current Mining Concessions - San José de Gracia
|
Claim Name
|
Claim
Number
|
Staking date
|
Expiry
|
Hectares
|
Taxes / ha (pesos)
|
|
AMPL. SAN NICOLAS
|
183815
|
22/11/1988
|
21/11/2038
|
17.4234
|
111.27
|
|
AMPL. SANTA ROSA
|
163592
|
30/10/1978
|
29/10/2028
|
25.0000
|
111.27
|
|
BUENA VISTA
|
211087
|
31/03/2000
|
30/03/2050
|
17.9829
|
63.22
|
|
EL CASTILLO
|
214519
|
02/10/2001
|
01/10/2051
|
100.0000
|
31.62
|
|
EL REAL
|
212571
|
07/11/2000
|
06/11/2050
|
2037.9479
|
63.22
|
|
EL REAL 2
|
216301
|
30/04/2002
|
29/04/2052
|
280.1555
|
31.62
|
|
FINISTERRE FRACC. A
|
219001
|
28/01/2003
|
27/01/2053
|
18.7856
|
31.62
|
|
FINISTERRE FRACC. B
|
219002
|
28/01/2003
|
27/01/2053
|
174.2004
|
31.62
|
|
GUADALUPE
|
189470
|
05/12/1990
|
04/12/2040
|
7.0000
|
111.27
|
|
LA GRACIA I
|
215958
|
02/04/2002
|
01/04/2052
|
300.0000
|
31.62
|
|
LA GRACIA II
|
215959
|
02/04/2002
|
01/04/2052
|
230.0000
|
31.62
|
|
LA LIBERTAD
|
172433
|
15/12/1983
|
14/12/2033
|
97.0000
|
111.27
|
|
LA NUEVA AURORA
|
215119
|
08/02/2002
|
07/02/2052
|
89.3021
|
31.62
|
|
LA NUEVA ESPERANZA
|
226289
|
06/12/2005
|
05/12/2055
|
40.0000
|
7.6
|
|
LA UNION
|
176214
|
26/08/1985
|
25/08/2035
|
4.1098
|
111.27
|
|
LOS TRES AMIGOS
|
172216
|
27/10/1983
|
26/10/2033
|
23.0000
|
111.27
|
|
MINA GRANDE
|
163578
|
10/10/1978
|
09/10/2028
|
6.6588
|
111.27
|
|
NUEVO ROSARIO
|
184999
|
13/12/1989
|
12/12/2039
|
32.8781
|
111.27
|
|
PIEDRAS DE LUMBRE 2
|
215556
|
05/03/2002
|
04/03/2052
|
34.8493
|
31.62
|
|
PIEDRAS DE LUMBRE 3
|
218992
|
28/01/2003
|
27/01/2053
|
4.3098
|
31.62
|
|
PIEDRAS DE LUMBRE No.4
|
212349
|
29/09/2000
|
28/09/2050
|
0.2034
|
63.22
|
|
PIEDRAS DE LUMBRE UNO
|
215555
|
05/03/2002
|
04/03/2052
|
40.2754
|
31.62
|
|
SAN ANDRES
|
212143
|
31/08/2000
|
30/08/2050
|
385.0990
|
63.22
|
|
SAN JOSÉ
|
208537
|
24/11/1998
|
23/11/2048
|
27.0000
|
111.27
|
|
SAN MIGUEL
|
183504
|
26/10/1988
|
25/10/2038
|
7.0000
|
111.27
|
|
SAN NICOLAS
|
163913
|
14/12/1978
|
13/12/2028
|
55.5490
|
111.27
|
|
SAN SEBASTIAN
|
184473
|
08/11/1989
|
07/11/2039
|
40.0000
|
111.27
|
|
SANTA MARIA
|
218769
|
17/01/2003
|
16/01/2053
|
4.2030
|
31.62
|
|
SANTA ROSA
|
170557
|
13/05/1982
|
12/05/2032
|
31.4887
|
111.27
|
|
SANTO TOMAS
|
187348
|
13/08/1986
|
12/08/2036
|
312.0000
|
111.27
|
|
TRES AMIGOS 2
|
212142
|
31/08/2000
|
30/08/2050
|
54.4672
|
63.22
|
|
FINISTERRE 4
|
231166
|
18/01/2008
|
17/01/2058
|
2142.1302
|
5.08
|
|
FRANCISCO ARTURO
|
230494
|
06/09/2007
|
27/03/2057
|
62481.3815
|
5.08
|
|
TOTAL
|
69,121.4010
|
The San Jose de Gracia mining property surrounds the area of San Jose de Gracia, Sinaloa State, Mexico. San Jose de Gracia is located on the west side of the Sierra Madre Mountains in the Sierra Madre Gold-Silver Belt, approximately 100 kilometers inland from Los Mochis, Sinaloa Mexico and approximately 200 kilometers north of Mazatlan, Sinaloa. (See Map below). The SJG property is described in more detail in this Form 10-K, under Item 2, Properties.
6
Sierra Madre Gold-Silver Belt in Mexico
See also:” National Instrument 43-101 (“NI 43-101”) Mineral Resource Estimate” below:
Historical Production
SJG reports 1,000,000 Oz. gold historical production from a series of underground workings. 471,000 Oz. Au is reported produced at the La Purisima area of SJG, at an average grade of 66.7 g/t; and 215,000 Oz. Au is reported produced from the La Prieta area, at an average grade of 27.6 g/t. Mineralization at SJG has been traced on surface and underground over a 15 square kilometer area.
7
1997-1998 Drilling – Exploration Programs
A drill program was conducted at SJG in 1997 - 1998 by a prior majority owner. Approximately 6,172 meters drilling was completed in 63 core drill holes. Significant intercepts, including bonanza grades, outlined the down dip potential of the Northeast section (150 Meter NE to SW extent of the Drilling) of the Los Hilos to Tres Amigos Trend of SJG. Surface and underground sampling in 1999 - 2000 confirmed high grades in historic workings and surface exposures throughout the project area. These high grades outline the presence of ore shoots developed within the veins. The ore shoots appear to be controlled by dilational jogs and/or vein intersections. A total of 544 samples were collected in 1999-2000, and assayed an average 6.51 grams/ton gold.
Pilot Production Activities
DynaMexico, conducting activities through its operating sister companies MinerasDyna and DynaOperaciones, mined high-grade veins at the San Pablo area of SJG from mid 2003 to June 2006. 18,250 Oz. gold was produced and sold from mill feed tonnage of 42,000 tons, at an average grade of approximately 15-20 g/t. Production costs were reported at approx. < $ 175. / Oz. Au in this small scale, pilot production operation.
|
Mined Tonnage
|
42,500 tons
|
|
Production (Oz Au)
|
18,250 Oz
|
|
Average Grade
|
15-20 g/t
|
|
Recovery Efficiency (Plant)
|
85%
|
|
Recovery in Concentrate (Sales)
|
90%
|
|
Production Cost (Average, 4 Years)
|
$175 / Oz
|
The small scale mining and production activities at SJG consisted of improvements to an existing mill, including the installation of a gravity / flotation processing circuit, and initial test runs with tailings were completed in 2002. Actual mining at the higher grade San Pablo area of the property commenced in March 2003.
Suspension of Production Activities
The Company initiated the test production activity in 2003 at the time gold prices were depressed, and when exploration funding opportunities, while available, were deemed to be too dilutive by Company management. While the test production was considered successful (see results in the table above), a small scale production activity was not expected to provide the necessary capital in order to explore a project the size of SJG.
The earlier, limited-scope production activity has provided significant benefits in terms of confirming production grades, metallurgy and process, efficiency of recoveries, and production costs – all of which is valuable for larger scale production plans.
Earn In / Option Agreement – Financing of Drilling – Exploration Programs
As gold prices continued to appreciate into 2006, exploration financing opportunities increased and the Company negotiated and entered into an Earn In / Option Agreement with Goldgroup Mining Inc., dated September 1, 2006. The terms of the Earn In / Option Agreement provided for Goldgroup to furnish $18,000,000 USD financing to DynaMexico for exploration expenditures at SJG, in exchange for a 50% share interest in DynaMexico.
8
National Instrument 43-101 (“NI 43-101”) Mineral Resource Estimate
The Company received from DynaMexico on February 14, 2012 a National Instrument 43-101 (“NI 43-101”) Mineral Resource Estimate for San Jose de Gracia. The NI 43-101 Mineral Resource Estimate was prepared by Mr. Robert Sandefur, BS, MSc, P.E., a Qualified Person as defined under NI 43-101, and a senior reserve analyst for Chlumsky, Armbrust & Meyer LLC, Lakewood, CO (“CAM”). The Mineral Resource Estimate concentrates on four separate vein systems at SJG: Tres Amigos, San Pablo, La Union, and La Purisima. The Mineral Resource Estimate includes Indicated Resources at: (1) Tres Amigos of 893,000 tonnes with an average grade of 4.46 g/t, totaling 128,000 Oz. Au; and, (2) San Pablo of 1,308,000 tonnes with an average grade of 6.52 g/t, totaling 274,000 Oz. Au. The estimate also includes an Inferred Resource of 3,953,000 tonnes in aggregate for the four vein systems, with an average grade of 5.83 g/t, totaling 741,000 Oz. Au. The resource estimate is reported using a 2.0 g/t cut off, with the effective date of February 6, 2012 (the 2012 “DynaMexico-CAM SJG Mineral Resource Estimate”). (See Part 2 Item 7.)
Future Drilling – Exploration Programs
Further drilling programs at SJG are contemplated, in view of the 2012 DynaMexico-CAM SJG Mineral Resource Estimate and the recently-released formal National Instrument 43-101(“NI 43-101”) Technical Report for San Jose de Gracia (the “2012 DynaMexico Luna-CAM SJG Technical Report”).
The Company expects DynaMéxico will expand the size and scope of the resource at SJG through continued drilling and development programs at San Pablo, Tres Amigos, La Cecena, Palos Chinos, La Union, La Purisima, and La Prieta. The Company expects extensions to mineralization in all directions and down dip from the main target areas.
National Instrument 43-101 Technical Report for San Jose de Gracia
The Company received from DynaMexico on March 28, 2012 a National Instrument 43-101 (“NI 43-101”) compliant Technical Report for the San Jose de Gracia Project (the “2012 DynaMexico Luna-CAM SJG Technical Report”, the “Technical Report”), and approved by DynaResource de Mexico, SA de CV. (“DynaMexico”), the 100% owner of SJG.
The 2012 DynaMexico Luna-CAM SJG Technical Report was prepared by Mr. Ramon Luna, BS, P.Geo., of Servicios y Proyectos Mineros, Hermosillo, Mexico, and a Qualified Person as defined under NI 43-101; and by Mr. Robert Sandefur, BS, MSc, P.E., a senior reserve analyst for Chlumsky, Armbrust & Meyer LLC, Lakewood, CO., and a Qualified Person as defined under NI 43-101. The 2012 DynaMexico Luna-CAM SJG Technical Report includes as Section Fourteen (14) a Mineral Resource Estimate for SJG as prepared by Mr. Sandefur (the “2012 DynaMexico-CAM SJG 43-101 Mineral Resource Estimate”, the “Resource Estimate”).
The Company filed the Technical Report on SEDAR (www.sedar.com) on March 28, 2012.
Preliminary Economic Assessment Report
The Company anticipates that DynaMexico will commission at least one Preliminary Economic Assessment Report for the SJG Project in the second quarter, 2012.
Company Transition from Exploration to Mining – Production
The Company expects to transition its business from that of a purely exploration company, to an exploration and production company. With the foundational resource for SJG as reported in the 2012 DynaMexico-CAM SJG Mineral Resource Estimate, the Company expects DynaMexico to confirm a positive economic assessment for SJG in the Preliminary Economic Assessment Report expected to be commissioned by DynaMexico.
9
Capital Requirements
The mining industry in general requires significant capital in order to take a property from the exploration, to development to production. These costs remain a significant barrier to entry for the average company but once in production, there is a ready market for the final products, In the case of SJG, the final product would be mainly gold, the price of which is determined by global markets, so there is not a dependence on a customer base.
Gold
Gold Uses. Gold generally is used for fabrication or investment. Fabricated gold has a variety of end uses, including jewelry, electronics, dentistry, industrial and decorative uses, medals, medallions and official coins. Gold investors buy gold bullion, official coins and jewelry.
Gold Supply. A combination of current mine production, recycling and draw-down of existing gold stocks held by governments, financial institutions, industrial organizations and private individuals make up the annual gold supply. Based on public information available for the years 2008 through 2011, on average, current mine production has accounted for approximately 64% of the annual gold supply.
Gold Price. The following table presents the annual high, low and average daily afternoon fixing prices for gold over the past ten years on the London Bullion Market ($/ounce):
|
Year
|
|
High
|
|
Low
|
|
Average
|
||||||
|
2002
|
|
$
|
349
|
|
$
|
278
|
|
$
|
310
|
|||
|
2003
|
|
$
|
416
|
|
$
|
320
|
|
$
|
363
|
|||
|
2004
|
|
$
|
454
|
|
$
|
375
|
|
$
|
410
|
|||
|
2005
|
|
$
|
536
|
|
$
|
411
|
|
$
|
444
|
|||
|
2006
|
|
$
|
725
|
|
$
|
525
|
|
$
|
604
|
|||
|
2007
|
|
$
|
841
|
|
$
|
608
|
|
$
|
695
|
|||
|
2008
|
|
$
|
1,011
|
|
$
|
713
|
|
$
|
872
|
|||
|
2009
|
|
$
|
1,213
|
|
$
|
810
|
|
$
|
972
|
|||
|
2010
|
|
$
|
1,421
|
|
$
|
1,058
|
|
$
|
1,225
|
|||
|
2011
|
|
$
|
1,895
|
|
$
|
1,319
|
|
$
|
1,572
|
|||
|
2012 (through March 16, 2012)
|
|
$
|
1,751
|
|
$
|
1,598
|
|
$
|
1,683
|
|||
Source: Kitco, Reuters and the London Bullion Market Association
On March 28, 2012, the afternoon fixing gold price on the London Bullion Market was $1,665 per ounce and the spot market gold price on the New York Commodity Exchange was $1,658 per ounce.
Condition of Physical Assets and Insurance
Our business is capital intensive and requires ongoing capital investment for the replacement, modernization or expansion of equipment and facilities. We, and our subsidiaries, maintain insurance policies against property loss. Such insurance, however, contains exclusions and limitations on coverage, particularly with respect to environmental liability and political risk. There can be no assurance that claims would be paid under such insurance policies in connection with a particular event.
10
Our activities are largely outside the United States and subject to governmental regulations for the protection of the environment. We conduct our operations so as to protect public health and the environment and believe our operations are in compliance with applicable laws and regulations in all material respects. DynaMexico is involved with reclamation matters with the oversight of Semarnat, the federal environmental agency of Mexico.
ITEM 1A. RISK FACTORS.
Business Risk
The Company is involved in the business of exploration and development of resource properties, which carries the inherent risk of failure.
The exploration and development of mineral deposits involve significant risks which a combination of careful evaluation, experience and knowledge may not eliminate. There is no assurance that the Company’s exploration programs will result in further discoveries of commercial ore bodies.
Nature of Mineral Exploration and Mining
The Company’s future is dependent upon its exploration programs. The exploration and development of mineral deposits involve significant risks over significant periods of time. It is impossible to ensure that the current or proposed exploration programs on the Company’s property will result in a profitable mining operation.
Whether a mineralized deposit will be commercially viable depends on many factors, such as size and grade of the deposit, proximity to infrastructure, financing costs, regulations, environmental protection, commodities prices, taxes, political risks. The impact of these factors cannot be accurately predicted, but the combination of factors may result in the Company’s failure to provide a return on investment.
Competitive Business Conditions
The Company competes with many larger, well capitalized companies which places the Company at a competitive disadvantage.
The Company competes with many companies in the mining business, including large, established mining companies with substantial capabilities, personnel, and financial resources. There is a limited supply of desirable mineral lands available for claim-staking, lease, or acquisition in Mexico where the Company’s activities are focused. The Company may be at a competitive disadvantage in acquiring mineral properties, since it competes with companies which have greater financial resources and larger technical staffs. From time to time, specific properties or areas which would otherwise be attractive for acquisition or exploration are unavailable due to their previous acquisition by competitors or due to the Company’s lack of financial resources.
Competition in the industry extends to the technical expertise to find, advance, and operate mineral properties; the labor to operate the properties; and the capital for the purpose of funding exploration and development activities on such properties. Many competitors explore for and mine precious metals, and conduct refining and marketing operations on a world-wide basis. Such competition may make it more difficult for the Company to recruit or retain qualified employees, to obtain equipment and personnel to assist in its exploration and production activities, or to acquire the capital necessary to fund operations.
11
Government Regulations
The Company conducts its resource exploration and development activities in Mexico, subject to rules and regulations for owning and maintaining mining concessions and surface rights, environmental, water rights, hazardous wastes, explosives, reclamation, and others. There can be no certainty that the Company maintains full compliance with all government regulations.
Mexico. Exploration and development of minerals in Mexico may be carried out through Mexican companies incorporated under Mexican law by means of obtaining exploration and development (exploitation) concessions. The Company’s concessions are granted by the Mexican government, or acquired from previous owners, are filed in the Public Registry of Mining, and are scheduled to expire from 2028 through 2058. Holders of exploration concessions may, prior to the expiration of such concessions, apply for one or more development concessions covering all or part of the area covered by an exploration concession.
Environmental law in Mexico provides for general environmental policies, with specific requirements set forth under regulations of the Ministry of Environment, Natural Resources and Fishing, which regulate all environmental matters with the assistance of the National Institute of Ecology and the Procuraduria Federal de Proteccion al Ambiente.
The primary laws and regulations governing environmental protection for mining in Mexico are found in the General Law, the Ecological Technical Standards, and also in the air, water and hazardous waste regulations, among others. In order to comply with the environmental regulations, a concessionaire must obtain a series of permits during the exploration stage. Generally, these permits are issued on a timely basis after the completion of an application by a concession holder. The Company believes it is currently in full compliance with the General Law and its regulations in relation to its mineral property interests in Mexico.
Commodities Prices
Any potential economic success of the Company’s properties will depend to a large extent to the market price of commodities; the future price of which is impossible to predict.
The current value and potential value for properties obtained by the Company is directly related to the market price for gold. The market price of gold may also have a significant influence on the market price of the Company’s common stock. If the Company obtains positive drill results and a property progresses to a point where a commercial production decision can be made, the decision to put a mine in production and to commit funds necessary for that purpose would be made long before any revenue from production would be received. A decrease in the market price of gold at any time during future exploration or development may prevent a property from being economically mined or result in the write-off of assets whose value is impaired as a result of lower gold prices.
The price of gold is affected by numerous factors beyond the Company’s control, including inflation, fluctuation of the United States dollar and foreign currencies, global and regional demand, the purchase or sale of gold by central banks, and the political and economic conditions of major gold producing countries throughout the world. During the last five years, the market price of gold has fluctuated between approximately $608 and $1,895 per ounce. The volatility of gold prices represents a substantial risk which is impossible to fully eliminate. In the event gold prices decline and remain low for prolonged periods of time, the Company might be unable to explore, develop, or produce revenue from its properties.
No Revenue
The Company suspended its production activity in June 2006, and currently receives no significant revenue. There is a risk that the Company would expend available cash and funding in exploration and administration costs, and would not be able to obtain further funding to continue its work.
In June 2006, production activities at SJG were suspended, in order to focus on the exploration of the vast SJG district. Funds received by DynaMexico pursuant to the Earn In Agreement were utilized for exploration and related activities. In addition, the Company maintains overhead in the US and other costs which are not reimbursed. The Company and its subsidiaries have $2,670,933 in cash on hand, at December 31, 2011. The Company could incur exploration expenses and corporate expenses greater than the amount of available cash on hand. The Company may need to raise additional funds in order to support its activities. If the Company needs to raise additional capital, its common stock would be diluted. Further, if the Company is unable to raise funds to meet its obligations, the value of its common stock may decline.
12
Substantial Control of Chairman / Preferred Shares
The Company’s Chairman and CEO owns 100% of the Series A preferred stock, which give him the right to elect the majority of the board of directors.
K.W. (“K.D.”) Diepholz, the Company’s Chairman and CEO, owns 100% of the outstanding shares of Series A preferred stock, which hold special voting rights. As a result, Mr. Diepholz has the ability to elect the majority of the Company’s Board of Directors. Such ownership and the resultant concentration of control may have the effect of delaying, deferring or preventing a change in control of the Company, even if the transaction would be beneficial to Company stockholders as a whole.
Capital Needs
The Company may need to raise additional capital, which may not be available or may be too costly, and which, if not obtained, could cause the Company to cease operations.
The Company’s capital requirements could be greater than its operating income. The Company believes it has adequate cash on hand for the foreseeable future, but it does not have sufficient cash to indefinitely sustain operating losses. The Company’s liquidity depends on its ability to raise capital through the sale of common stock or through debt or equity offerings. Additional financing may not be available, or, if available, may be on terms unacceptable or unfavorable. If additional capital is required and not obtained, or if the Company is not able to produce revenue from operations, or otherwise operate at a profit, the value of investment in the Company could decline or be lost entirely.
Illiquid Market
The Company has a limited public market trading on the pink sheets, and an active trading market may never materialize, and an investor may not be able to sell stock.
There is currently only a limited public market for the Company’s Common Stock and there can be no assurance that a more robust trading market will develop further or be maintained in the future. An active trading market may not develop and if not the market value could decline to a value below the amount investors paid for stock. Additionally, if the market is not active or illiquid, investors may not be able to sell the securities of the Company.
Penny Stock Classification
If a public trading market for the Company’s common stock materializes, it may be classified as a ‘penny stock’ which would result in additional requirements for trading the stock. These additional requirements could affect the liquidity of the stock.
The SEC has adopted regulations which generally define a “penny stock” to be an equity security that has a market price of less than $5.00 per share, subject to specific exemptions. The market price of the Company’s Common Stock may trade at less than $5.00 per share and accordingly may be a “penny stock.” Brokers and dealers effecting transactions in “penny stock” must disclose certain information concerning the transaction, obtain a written agreement from the purchaser and determine that the purchaser is reasonably suitable to purchase the securities. These rules may restrict the ability of brokers or dealers to sell the Common Stock and may affect an investor’s ability to sell such shares.
Title Matters
No Guarantee of Title
The Company has investigated title to all mineral claims, and, to the best of its knowledge, title to all properties is in good standing. The Company has received legal opinions from legal counsel, the most recent of which is dated August 4, 2011, which confirm the title and good standing of DynaMexico and mineral claims comprising the SJG District. However, there can be no assurance of complete title, nor guarantee of title. The properties may be affected by undetected defects in title, such as the reduction in size of the mineral claims and other third party claims affecting the Company's priority rights.
13
Dependence upon Key Personnel
The Company is dependent upon the efforts and abilities of its management team.
The loss of any member of the management team could have a material adverse effect upon the business and prospects of the Company. In the event of such loss, the Company will seek suitable competent replacements, but there is no assurance that the Company will be able to retain such replacements. The Company has obtained a Key Man Life Insurance program for its Chairman and CEO, which would pay the proceeds of such policy to the Company in the event of his death.
Uncertainty of Resource Estimates
There can be no certainty that any resource estimate by the Company or its consultants would ever be realized in production.
The current resource estimates in respect of the SJG Property are based on limited information, such as historical data, drilling programs, the production activity conducted by the Company in 2003 – 2006, and various reports, manual calculations and opinions. No assurance can be given that the anticipated tonnages and grades will be achieved or that the estimated or indicated level of recovery will realized. The grade of mineralization actually recovered or produced could differ significantly from the resource estimates.
Environmental and Regulatory Concerns
The Company operates in an industry where there are significant environmental and regulatory requirements. The inability of the Company to satisfy these requirements could cause the value of its common stock to decline.
The current or future operations of the Company, including acquisition, leasing, and sales activities, involve mineral properties which require permits from various federal, state and local governmental authorities. Such future operations are and will be governed by laws and regulations governing prospecting, development, mining, production, exports, taxes, labor standards, occupational health, waste disposal, toxic substances, land use, environmental protection, mine safety and other matters. Companies engaged in the development and operation of mines and related facilities generally experience increased costs, and delays in production and other schedules as a result of the need to comply with applicable laws, regulations and permits. Additional permits and studies, which may include environmental impact studies conducted before permits can be obtained, are necessary prior to operation of properties in which the Company has interests. Required permits could adversely affect the Company's ability to negotiate agreeable acquisition, lease, or sales terms and therefore adversely affect the price of the Company’s common stock.
Competitive conditions affecting the Company could negatively impact our business.
The potential value of the Company’s mining property is directly related to the market price for gold. The price of gold may also have a significant influence on the market price of its common stock. If the Company obtains positive drill results and its property progresses to a point where a commercial production decision can be made, the decision to put a mine in production and to commit funds necessary for that purpose must be made long before any revenue is from production would be received. A decrease in the market price of gold at any time during future exploration and development may prevent the Company’s property from being economically mined or could result in the write-off of assets whose value is impaired as a result of lower gold prices. The price of gold is affected by numerous factors beyond our control, including inflation, fluctuation of the United States dollar and foreign currencies, global and regional demand, the purchase or sale of gold by central banks, and the political and economic conditions of major gold producing countries throughout the world. During the last five years, the market price of gold has fluctuated between approximately $608 and $1,895 per ounce. The volatility of gold prices represents a substantial risk which no amount of planning or technical expertise can fully eliminate. In the event gold prices decline and remain low for prolonged periods of time, we might be unable to develop our property and produce revenue.
14
Joint Ownership of DynaMéxico
DynaResource owns a 50% share interest in DynaMéxico – the 100 % owner of the SJG Project -- and the remaining 50% share interest is held by Goldgroup. As a consequence of this shared ownership, any benefits to be derived from the ownership of DynaMéxico are shared between the Company and Goldgroup.
Each of DynaResource and Goldgroup currently appoints two of the four members of the DynaMéxico board of directors; accordingly, the inherent structure of ownership and governance has the potential for deadlock that could affect operations of San José de Gracia. By way of example, the directors appointed by the Company and the directors appointed by Goldgroup may have different short or long-term objectives or goals for DynaMéxico, which could cause delays in decision making or decisions that are not necessarily in the best interest of our stockholders.
This risk is mitigated by the operational structure for the SJG Project, as a wholly owned subsidiary of DynaResource -- Mineras de DynaResource S.A. de C.V. -- maintains an exclusive operating agreement with DynaMéxico. Additionally, another wholly owned subsidiary of DynaResource -- DynaResource Operaciones de San Jose De Gracia S.A. de C.V. maintains an exclusive agreement to manage the personnel in Mexico.
This risk is also mitigated by the fact that K.W. (“K.D.”) Diepholz, the Company’s Chairman and CEO, as well as President and a member of the Board of Directors of DynaMéxico, holds a broad power of attorney granted by the shareholders of DynaMéxico. The power of attorney gives Mr. Diepholz authority superior to that of any other person or group within DynaMéxico (including the Board of Directors). The power of attorney held by Mr. Diepholz is consistent with the laws in Mexico, whose laws are based on a civil code.
Historical production of Gold at the San Jose de Gracia Property May Not be Indicative of Future Production or Revenue.
The SJG Property is a high-grade mineralized system with reported historical production of over 1 M. Oz. Gold. The production occurred in the early 1900’s, prior to the Mexican Revolution. Since the time, the property has seen small scale mining operations, from small scale local owners, to the Company’s production in 2003–2006. Due to the uncertainties associated with exploration, including variations in geology and structure, there is no assurance that the Company’s efforts will be successful in identifying mineralization in sufficient quantities to define resources or reserves, and further there is no assurance that any such resources or reserves could be developed into a commercial operation. Investors in the Company’s securities should not rely on historical operations as an indication that the SJG property will be developed into a commercial production in the future. The Company expects to incur losses unless and until such time as one or more of its properties enters into commercial production and generates sufficient revenue to fund continuing operations.
ITEM 1B. UNRESOLVED STAFF COMMENTS.
Not applicable.
ITEM 2. PROPERTIES.
Executive Offices
The Company maintains its executive offices of approximately 2,100 sq. ft., at 222 W. Las Colinas Blvd., Suite 744 East Tower, Irving, Texas 75039, at $3,840 per month, plus utility services. The Company renewed a prior 3 year lease for an additional 1 year term commencing September, 2011.
15
San Jose de Gracia Mineral Property
DynaMexico owns 100% of the mineral concessions at the San Jose de Gracia Property, located in Sinaloa State, Mexico, which is the only property in which DynaMexico retains an interest. The Company owns 50% of the outstanding shares of DynaMexico. DynaMexico holds title to 33 concessions covering approximately 69,121 hectares (170,802 acres), with no outstanding royalty or other interests.
The property is located in and around San Jose de Gracia, Sinaloa State, Mexico which is approximately 100 km northeast of Guamuchil, near the west coast of Mexico. A small airstrip is located near San Jose de Gracia, and can be accessed by a small airplane or alternatively, by dirt mountain road. Several roads on the property are accessible throughout the year, with the possible exception of July - September when the rainy season sometimes causes flooding and runoff to make the roads difficult to navigate.
SJG History
SJG reports 1,000,000 Oz. Gold historical production from a series of underground workings. 471,000 Oz. is reported produced at the La Purisima area of SJG, at an average grade of 66.7 g/t.; and 215,000 Oz. is reported produced from the La Prieta area, at an average grade of 27.6 g/t. Mineralization at SJG has been traced on surface and underground over a 15 square kilometer area.
Drilling programs at SJG were conducted by a prior partner in 1997 – 1998, primarily at the Tres Amigos area, which outlined some of the down dip potential in this area. Approximately 6,172 meters drilling was completed in 63 drill holes.
DynaMexico was formed in March 2000, for the purpose of acquiring the concessions comprising the SJG District, and to consolidate all ownership of SJG under DynaMexico. DynaMexico focused on acquisition and consolidation work through 2003, and reports a clear title and ownership to the district.
DynaMexico mined high-grade veins at the San Pablo area of SJG from mid 2003 to June 2006, in a Pilot Production operation. 18,250 Oz Gold was produced and sold, from mill feed tonnage of 42,500 tons, at an average grade of 15-20 g/t. Average production costs during the production period were reported as $175 / Oz.
Financing/Sale of Stock of Subsidiary (Earn In / Option Agreement)
On September 1, 2006 the Company signed a “Stock Purchase and Earn In Agreement” (“Earn In”) between DynaResource, Inc. and DynaMexico, (“Seller”) and Goldgroup Mining, Inc. (formerly Goldgroup Resources, Inc.), of Vancouver, British Columbia.
The Earn In provided for Goldgroup to contribute $18,000,000 on or before March 15, 2011 in exchange for fifty per cent (50%) of the total outstanding shares of DynaMexico, the 100 % owner of the San Jose de Gracia District (“SJG”). Goldgroup now holds 50% of the outstanding shares of DynaMexico.
Drilling programs conducted pursuant to the Earn In/ Option Agreement completed a total of 298 drill holes covering 68,741 meters of drilling from 2007 through March 2011. Results of the drilling activity, including the results of previous drilling in 1997-1998, appear in an “SJG Drill Intercepts Summary File through 11-298”, as Exhibit 99.1 to our Form 10-Q for the period ended June 30, 2011 filed with the SEC on August 22, 2011, and available on EDGAR at:
http://sec.gov/Archives/edgar/data/1111741/000112178111000241/ex99one.htm.
Additionally, the updated Drill Summary File is posted on the Company’s web site at www.dynaresource.com.
16
National Instrument 43-101 (“NI 43-101”) Mineral Resource Estimate for the San Jose de Gracia Property
The Company received from DynaMexico on February 14, 2012, a National Instrument 43-101 Mineral Resource Estimate for San Jose de Gracia. The NI 43-101 Resource Estimate (the “2012 DynaMexico-CAM SJG Mineral Resource Estimate”, the “Resource Estimate”) was prepared by Mr. Robert Sandefur, BS, MSc, P.E., a Qualified Person as defined under NI 43-101, and a senior reserve analyst for Chlumsky, Armbrust & Meyer LLC, Lakewood, CO. The Resource Estimate concentrates on four separate main vein systems at SJG: Tres Amigos, San Pablo, La Union, and La Purisima. The resource estimate includes Indicated Resources at: (1) Tres Amigos of 893,000 tonnes with an average grade of 4.46 g/t, totaling 128,000 Oz. Au; and (2) San Pablo of 1,308,000 tonnes with an average grade of 6.52 g/t, totaling 274,000 Oz. Au. The estimate also includes an Inferred Resource of 3,953,000 tonnes in aggregate for the four main vein systems, with an average grade of 5.83 g/t, totaling 741,000 Oz. Au. The resource estimate is reported using a 2.0 g/t cut off, with the effective date of February 6, 2012.
National Instrument 43-101 Technical Report on the San Jose de Gracia Property
The Company received from DynaMexico on March 28, 2012 a National Instrument 43-101 (“NI 43-101”) compliant Technical Report for the San Jose de Gracia Project (the “2012 DynaMexico Luna-CAM SJG Technical Report”, the “Technical Report”), and approved by DynaResource de Mexico, SA de CV. (“DynaMexico”), the 100% owner of SJG.
The 2012 DynaMexico Luna-CAM SJG Technical Report was prepared by Mr. Ramon Luna, BS, P.Geo., of Servicios y Proyectos Mineros, Hermosillo, Mexico, and a Qualified Person as defined under NI 43-101; and by Mr. Robert Sandefur, BS, MSc, P.E., a senior reserve analyst for Chlumsky, Armbrust & Meyer LLC, Lakewood, CO., and a Qualified Person as defined under NI 43-101. The 2012 DynaMexico Luna-CAM SJG Technical Report includes as Section Fourteen (14) a Mineral Resource Estimate for SJG as prepared by Mr. Sandefur (the “2012 DynaMexico-CAM SJG 43-101 Mineral Resource Estimate”, the “Resource Estimate”).
The Company filed the Technical Report on SEDAR (www.sedar.com) on March 28, 2012.
Regional Geology & Mineral Deposits
San José de Gracia lies within the Sierra Madre Occidental Gold-Silver Belt, in a second-order graben directly east of the regional-scale Grete Graben. The basement to the Sierra Madre Occidental consists of deformed Paleozoic sedimentary strata, which are non-conformably overlain by Tertiary mafic to felsic volcanic and volcaniclastic strata known as the Lower Volcanic Series (“LVS”). Strata of the LVS are recognized as being spatially related to gold and silver mineralization in the region. Volcanic and sedimentary strata are capped by a thick sequence of non-deformed Late Tertiary ignimbrites, known as the Upper Volcanic Series (“UVS”).
The Sierra Madre Occidental Gold-Silver Belt is host to a number of major epithermal precious metal camps, including the San Dimas and Batopilas Districts. The San Dimas District, located some 220 kilometers southeast of San José de Gracia, has produced in excess of 9.65 million ounces of gold and 400 million ounces of silver from high-grade, structurally hosted veins, including those at the Tayoltita Mine. In contrast, the Batopilas district, located some 100 kilometers east of San José de Gracia, has historic production of more than 5.4 million ounces of silver from high-grade veins.
Property Geology
The oldest rocks exposed at San José de Gracia are deformed Paleozoic shale, sandstone, conglomerate and minor limestone, which are non-conformably overlain by andesite and rhyodacite flows and tuffs of the LVS. Volcanic and sedimentary strata are cut by quartz-feldspar porphyry, porphyritic diorite bodies and fine-grained mafic dykes, which may be cotemporal with the LVS. Ignimbrites of the UVS are exposed at higher elevations on the property and are thought to act as a post mineralization cap rock, thereby indicating an Early to Mid Tertiary (Paleocene to Eocene) age for gold mineralization at San José de Gracia.
17
Geologic Structure
Detailed mapping within the project area has defined several stages of deformation, beginning with compression during the Laramide Orogeny which affected the Paleozoic basement and formed flat-lying reverse faults, which have been reactivated as conduits for gold-bearing fluids in the La Prieta trend (Table 2). Extension in Tertiary time led to the development of second order structures, trending south, southwest and southeast; which formed the major structural orientations for mineralization at San José de Gracia. The latest phase of deformation is characterized by late-stage extension and southwest tilting.
Mineralization & Alteration
High grade gold mineralization at San José de Gracia is hosted within andesite and rhyodacite of the LVS and underlying Paleozoic sediments as fault breccia veins and crackle breccias that exhibit multiple stages of reactivation and fluid flow, as evidenced by crustiform/colloform textures and cross cutting veins. Locally, veins exhibit sharp, clay gouge hangingwall and footwall contacts with slickensides, indicating reactivation of structurally-hosted veins subsequent to mineralization. Gold grades can also be carried within the mineralized halo adjacent to the principal veins as quartz-chlorite stockwork. In addition to vein-hosted mineralization, broad zones of un-mineralized clay alteration, developed southwest of the main mineralized trends, may overlie lower-grade, disseminated gold mineralization at depth.
Alteration at San José de Gracia is laterally and vertically zoned from discrete zones of silicification to broad zones of illite to clay alteration with increasing elevation and/or distance from the main feeder structures. Faulting and tilting of the mineralization system has affected the surface distribution of alteration and in general has exposed deeper portions of the system in the northeast and exposed shallower, more distal portions of the hydrothermal system in the southwest part of the property.
Six principal mineralized trends have been identified at San José de Gracia, from south to north. These consist of the:
|
1.
|
La Purisima Ridge trend;
|
|
2.
|
Palos Chinos trend;
|
|
3.
|
La Parilla to Veta Tierra trend (Including La Union);
|
|
4.
|
San Pablo trend;
|
|
5.
|
La Prieta trend, and
|
|
6.
|
Los Hilos to Tres Amigos trend.
|
Lab
A field laboratory is maintained within the camp facility. The Company utilized the lab for Assaying services during its production activities. Assays were performed by Company personnel for mined ore, feed ore, gravity and flotation concentrates, and tailings. The current status of the lab and equipment is care and maintenance. The Company anticipates utilizing the lab facility in the future for providing quick check assays to support the exploration works.
ITEM 3. LEGAL PROCEEDINGS
The Company is not involved in any legal proceedings.
ITEM 4. MINE SAFETY DISCLOSURES
None.
18
PART II
ITEM 5. MARKET FOR REGISTRANT’S COMMON EQUITY, RELATED STOCKHOLDER MATTERS AND ISSUER PURCHASES OF EQUITY SECURITIES
The Company’s common stock is traded on the “OTCBB” under the symbol "DYNR". The following table sets forth, for the periods indicated, the high and low bid quotations which set forth reflect inter-dealer prices, without retail mark-up or mark-down and without commissions; and may not reflect actual transactions.
|
Calendar Quarter Ending
|
Low
|
High
|
||||||
|
March 31, 2010
|
2.85 | 3.25 | ||||||
|
June 30, 2010
|
2.75 | 3.35 | ||||||
|
September 30, 2010
|
2.65 | 3.60 | ||||||
|
December 31, 2010
|
3.00 | 3.95 | ||||||
|
March 31, 2011
|
3.92 | 4.95 | ||||||
|
June 30, 2011
|
4.10 | 4.80 | ||||||
|
September 30, 2011
|
3.90 | 4.45 | ||||||
|
December 31, 2011
|
3.75 | 4.20 | ||||||
No cash dividends on the Company common stock have been declared or paid since the Company's inception. The Company had approximately 595 shareholders at December 31, 2011. This does not include shareholders that hold their shares in street name or with a broker.
During the fiscal year ended December 31, 2011, except as included in our Quarterly Reports on Form 10-Q or in our Current Reports on Form 8-K, we have not sold any equity securities not registered under the Securities Act.
During the fiscal year ended December 31, 2011, no securities of the Company were authorized for issuance under equity compensation plans.
ITEM 6. SELECTED FINANCIAL DATA
Not applicable.
19
ITEM 7. MANAGEMENT’S DISCUSSION AND ANALYSIS OF FINANCIAL CONDITION AND RESULTS OF OPERATIONS
General
The Company currently holds 50% of the outstanding shares of DynaResource de México, S.A. de C.V. (“DynaMéxico”), which owns 100% of the mineral concessions and related interest to the San José de Gracia mining District (“SJG”). SJG is currently comprised of 33 mining concessions covering approximately 69,121 hectares located in and around San José de Gracia, Sinaloa State, México (“SJG”). SJG is located on the west side of the Sierra Madre Mountains, approximately 250 kilometers inland from the port city of Los Mochis, Sinaloa; and approximately 500 kilometers north of Mazatlan, Sinaloa.
The SJG is a High-Grade Mineralized System which reports historical production of over 1 M. Oz. AU, from a series of underground workings. DynaMéxico is focused on the exploration and future exploitation of this vein-hosted, near surface, and over 400 hundred M. down – dip gold potential, that occurs within fault breccia veins; and has been traced on surface and underground over a 15 Sq. Km. area.
Prior Drilling and Exploration Activity / SJG (1997 / 1998)
A drill program was conducted at SJG in 1997 - 1998 by Golden Hemlock Explorations, Ltd., a prior partner at SJG. Approximately 6,172 meters drilling was completed in 63 core drill holes. Significant intercepts, including bonanza grades, outlined down dip potential of the Northeast section (150 Meter NE to SW extent of the Drilling) of the Los Hilos to La Cecena to Tres Amigos Trend. And, Drill Hole 97-63 confirmed down dip and extension at the Palos Chinos Area of SJG.
Surface and underground sampling in 1999 - 2000 conducted by the Company confirmed high grades in historic workings and surface exposures throughout the SJG district and project area. These high grades outlined the presence of ore shoots developed within the veins. The mineralized shoots appear to be controlled by dilational jogs and/or vein intersections. A total of 544 samples were collected in 1999-2000, and assayed an average 6.51 grams/ton (g/t) gold.
Recent Pilot Production Activity
During the period 2003 through 2006, DynaMéxico conducted underground mining and pilot production activities at SJG. The small scale production activities at SJG consisted of improvements to an existing mill, including the installation of a gravity / flotation processing circuit. Initial test runs with tailings from historical production were completed in 2002. Actual mining at the high grade San Pablo area of the SJG property commenced in March 2003. DynaMéxico produced 18,250 Oz. gold from Mid 2003 to June 2006; from mill feed tonnage of 42,500 tons, at an average grade of approximately 15-20 g/t. Production costs were reported at approx. $175. /Oz.
Recent Financing Activity
As gold prices continued to appreciate into 2006, exploration financing opportunities increased and the Company and DynaMéxico negotiated and entered into the “Earn In / Option” agreement with Goldgroup Resources, Inc. (now Goldgroup Mining Inc.), Vancouver, BC, dated September 1, 2006. The Terms of the Earn In / Option provided for $ 18 M. USD financing from Goldgroup to DynaMéxico, over four Phases (last drilling at March 2011), and including exploration related expenditures at SJG, in exchange for Goldgroup’s earning of 50% of the outstanding shares of DynaMéxico. (See Material Agreements; Earn In / Option Agreement.)
Magnetic and IP Surveys
Magnetic and IP surveys were conducted throughout the SJG district in 2009, covering an area of approximately 15 Sq. Km.
IP is the primary geophysical target at SJG, and is expected to identify pyrite-based mineralization hosting gold. Initial Survey Grid lines were located approximately perpendicular to inferred geologic strike. The data response from these grid lines indicate one or more IP sources that dip northwest. Additional grid lines were crossed with the initial lines, and appear to identify two separate IP sources.
20
Grid lines to the South appear to indicate an IP source at > 250 Meters.
Correlation between ground magnetic and IP:
In general the correlation between the Magnetic and IP response and data was excellent.
Correlation with recent Drilling Programs and known Mineralization:
The data response of the surveys correlated to the recent drilling programs and to the areas of known mineralization at SJG was excellent. Considering this excellent correlation to known mineralization, additional areas of SJG showing similar data response could be indicative of additional target areas.
Identification of Additional Resource Target Areas:
Significant survey responses were reported for the following areas; and are projected for follow up drilling:
San Pablo; Up Dip;
San Pablo; Displacement Zone;
Tres Amigos; Down Dip and Northwest;
Tres Amigos; Extension Northeast;
Orange Tree; Down Dip;
La Cecena, Los Hilos, and Tepehauje;
Palos Chinos;
La Prieta;
La Purisima; Down dip at Southeast end;
Argyllic Zone; + 250 M. Down;
Activity for the Year Ended December 31, 2011
In 2011, the Company's 50% owned subsidiary, DynaMexico continued drilling under the Earn In/Option Agreement with Goldgroup whereby an additional 59 holes were completed by March 2011.
An SJG Drill Summary File through drill holes 11-298, describing the mineralized intercepts of all core drill holes, including the drilling results of 1997, and including the recent drilling of 2007 - March 31, 2011, was filed as an Exhibit to our Form 10-Q for the period ended June 30, 2011, and is available on the SEC website at:
http://sec.gov/Archives/edgar/data/1111741/000112178111000241/ex99one.htm
In the fourth quarter 2011, DynaMéxico commissioned a National Instrument 43-101 (“43-101”) compliant Technical Report in order to define the Resources indicated by recent drilling at SJG, the results of which are explained below.
21
DynaMéxico Summary of Drilling Results
The drilling results obtained from San Jose de Gracia through March 31, 2011 (through DDH SJG 11-298) confirm the extensions of mineralization, down dip of historical workings, with confirmation of high grade gold (over 10 g/t), and including bonanza grades shoots which are consistent with historical and recent production grades. Specifically, San Pablo, Tres Amigos, La Purisima, and La Union areas have reported significant results.
National Instrument 43-101 Mineral Resource Estimate (NI 43-101) for San Jose de Gracia
The Company received from DynaMexico on February 14, 2012 a National Instrument 43-101 (“NI 43-101”) Mineral Resource Estimate for the SJG property, with an Effective Date of February 6, 2012.
The NI 43-101 Mineral Resource Estimate was prepared by Mr. Robert Sandefur, BS, MSc, P.E., a Qualified Person as defined under NI 43-101, and a senior reserve analyst for Chlumsky, Armbrust & Meyer LLC, Lakewood, CO (“CAM”). The Mineral Resource Estimate concentrates on four separate vein systems at SJG: Tres Amigos, San Pablo, La Union, and La Purisima. The Resource Estimate includes Indicated Resources at: (1) Tres Amigos of 893,000 tonnes with an average grade of 4.46 g/t, totaling 128,000 Oz. Au; and, (2) San Pablo of 1,308,000 tonnes with an average grade of 6.52 g/t, totaling 274,000 Oz. Au. The Mineral Resource Estimate also includes an Inferred Resource of 3,953,00 tonnes for the four vein systems, with an average grade of 5.83 g/t, totaling 741,000 Oz. Au. The Mineral Resource Estimate is reported using a 2.0 g/t cut off, with the effective date of February 6, 2012 (the “2012 DynaMexico-CAM SJG Mineral Resource Estimate”).
Mineral Resource and Classification for San Jose de Gracia Project
|
TRES AMIGOS VEIN
|
|||||||||||
| ORE | GRADE | CONTAINED | |||||||||
|
Cutoff
|
tonnes
|
Au g/t
|
Ag g/t
|
Cu%
|
Pb%
|
Zn%
|
Au oz
|
Ag oz
|
Cu Kgs.
|
Pb Kgs.
|
Zn Kgs.
|
|
INDICATED
|
|||||||||||
|
0.00
|
1,166,000
|
3.747
|
9.0
|
0.186
|
0.050
|
0.327
|
140,000
|
337,000
|
2,165,000
|
578,000
|
3,815,000
|
|
0.50
|
1,166,000
|
3.747
|
9.0
|
0.186
|
0.050
|
0.327
|
140,000
|
337,000
|
2,165,000
|
578,000
|
3,815,000
|
|
1.00
|
1,128,000
|
3.845
|
9.2
|
0.189
|
0.051
|
0.334
|
139,000
|
333,000
|
2,137,000
|
570,000
|
3,774,000
|
|
1.50
|
1,019,000
|
4.124
|
9.7
|
0.200
|
0.053
|
0.351
|
135,000
|
319,000
|
2,038,000
|
537,000
|
3,572,000
|
|
2.00
|
893,000
|
4.458
|
10.3
|
0.210
|
0.056
|
0.367
|
128,000
|
297,000
|
1,875,000
|
499,000
|
3,276,000
|
|
2.50
|
758,000
|
4.853
|
10.8
|
0.218
|
0.059
|
0.385
|
118,000
|
263,000
|
1,652,000
|
450,000
|
2,917,000
|
|
3.00
|
608,000
|
5.366
|
11.3
|
0.220
|
0.061
|
0.386
|
105,000
|
221,000
|
1,338,000
|
374,000
|
2,349,000
|
|
INFERRED
|
|||||||||||
|
0.00
|
1,994,000
|
4.795
|
9.3
|
0.204
|
0.050
|
0.337
|
307,000
|
595,000
|
4,073,000
|
996,000
|
6,725,000
|
|
0.50
|
1,992,000
|
4.801
|
9.3
|
0.205
|
0.050
|
0.338
|
307,000
|
595,000
|
4,073,000
|
996,000
|
6,722,000
|
|
1.00
|
1,937,000
|
4.913
|
9.5
|
0.208
|
0.051
|
0.341
|
306,000
|
589,000
|
4,028,000
|
981,000
|
6,600,000
|
|
1.50
|
1,702,000
|
5.426
|
10.3
|
0.223
|
0.055
|
0.359
|
297,000
|
561,000
|
3,799,000
|
929,000
|
6,114,000
|
|
2.00
|
1,453,000
|
6.045
|
11.0
|
0.233
|
0.055
|
0.376
|
282,000
|
514,000
|
3,390,000
|
802,000
|
5,460,000
|
|
2.50
|
1,165,000
|
6.981
|
11.5
|
0.225
|
0.061
|
0.410
|
261,000
|
432,000
|
2,617,000
|
710,000
|
4,781,000
|
|
3.00
|
950,000
|
7.933
|
11.5
|
0.204
|
0.065
|
0.432
|
242,000
|
350,000
|
1,935,000
|
620,000
|
4,107,000
|
22
|
SAN PABLO VEIN
|
|||||||||||
| ORE |
GRADE
|
CONTAINED | |||||||||
|
Cutoff
|
tonnes
|
Au g/t
|
Ag g/t
|
Cu%
|
Pb%
|
Zn%
|
Au oz
|
Ag oz
|
Cu Kgs.
|
Pb Kgs.
|
Zn Kgs.
|
|
INDICATED
|
|||||||||||
|
0.00
|
1,530,000
|
5.773
|
11.6
|
0.254
|
0.011
|
0.034
|
283,000
|
573,000
|
3,878,000
|
162,000
|
513,000
|
|
0.50
|
1,527,000
|
5.783
|
11.7
|
0.254
|
0.011
|
0.034
|
284,000
|
573,000
|
3,877,000
|
162,000
|
512,000
|
|
1.00
|
1,482,000
|
5.935
|
11.9
|
0.259
|
0.011
|
0.034
|
283,000
|
568,000
|
3,839,000
|
158,000
|
500,000
|
|
1.50
|
1,401,000
|
6.204
|
12.3
|
0.267
|
0.011
|
0.034
|
279,000
|
553,000
|
3,735,000
|
153,000
|
478,000
|
|
2.00
|
1,308,000
|
6.522
|
12.7
|
0.276
|
0.011
|
0.035
|
274,000
|
535,000
|
3,607,000
|
147,000
|
458,000
|
|
2.50
|
1,197,000
|
6.917
|
13.2
|
0.288
|
0.012
|
0.036
|
266,000
|
508,000
|
3,441,000
|
139,000
|
432,000
|
|
3.00
|
1,091,000
|
7.320
|
13.7
|
0.297
|
0.012
|
0.037
|
257,000
|
480,000
|
3,241,000
|
132,000
|
405,000
|
|
INFERRED
|
|||||||||||
|
0.00
|
860,000
|
4.179
|
8.8
|
0.159
|
0.010
|
0.031
|
115,000
|
242,000
|
1,367,000
|
84,000
|
263,000
|
|
0.50
|
842,000
|
4.262
|
8.9
|
0.162
|
0.010
|
0.031
|
115,000
|
241,000
|
1,363,000
|
84,000
|
261,000
|
|
1.00
|
756,000
|
4.653
|
9.3
|
0.168
|
0.010
|
0.030
|
113,000
|
225,000
|
1,273,000
|
74,000
|
227,000
|
|
1.50
|
614,000
|
5.445
|
10.5
|
0.188
|
0.010
|
0.030
|
108,000
|
207,000
|
1,157,000
|
60,000
|
185,000
|
|
2.00
|
532,000
|
6.016
|
11.3
|
0.202
|
0.010
|
0.030
|
103,000
|
194,000
|
1,074,000
|
51,000
|
161,000
|
|
2.50
|
463,000
|
6.583
|
11.6
|
0.215
|
0.009
|
0.031
|
98,000
|
172,000
|
997,000
|
43,000
|
143,000
|
|
3.00
|
426,000
|
6.917
|
11.9
|
0.220
|
0.009
|
0.031
|
95,000
|
163,000
|
935,000
|
40,000
|
131,000
|
|
LA UNION VEIN
|
|||||||||||
|
ORE
|
GRADE
|
CONTAINED
|
|||||||||
|
Cutoff
|
tonnes
|
Au g/t
|
Ag g/t
|
Cu%
|
Pb%
|
Zn%
|
Au oz
|
Ag oz
|
Cu Kgs.
|
Pb Kgs.
|
Zn Kgs.
|
|
INFERRED
|
|||||||||||
|
0.00
|
1,290,000
|
4.502
|
12.4
|
0.145
|
0.019
|
0.041
|
187,000
|
515,000
|
1,876,000
|
252,000
|
535,000
|
|
0.50
|
1,269,000
|
4.572
|
12.6
|
0.148
|
0.020
|
0.042
|
187,000
|
514,000
|
1,874,000
|
251,000
|
535,000
|
|
1.00
|
1,221,000
|
4.721
|
12.8
|
0.152
|
0.020
|
0.044
|
185,000
|
503,000
|
1,856,000
|
250,000
|
532,000
|
|
1.50
|
1,061,000
|
5.237
|
12.4
|
0.165
|
0.023
|
0.046
|
179,000
|
422,000
|
1,755,000
|
240,000
|
487,000
|
|
2.00
|
849,000
|
6.107
|
13.7
|
0.186
|
0.026
|
0.053
|
167,000
|
374,000
|
1,579,000
|
221,000
|
448,000
|
|
2.50
|
713,000
|
6.843
|
14.4
|
0.204
|
0.028
|
0.058
|
157,000
|
331,000
|
1,458,000
|
203,000
|
417,000
|
|
3.00
|
580,000
|
7.792
|
16.5
|
0.231
|
0.034
|
0.069
|
145,000
|
308,000
|
1,340,000
|
196,000
|
403,000
|
|
LA PURISIMA VEIN
|
|||||||||||
|
ORE
|
GRADE
|
CONTAINED
|
|||||||||
|
Cutoff
|
tonnes
|
Au g/t
|
Ag g/t
|
Cu%
|
Pb%
|
Zn%
|
Au oz
|
Ag oz
|
Cu Kgs.
|
Pb Kgs.
|
Zn Kgs.
|
|
INFERRED
|
|||||||||||
|
0.00
|
1,902,000
|
3.615
|
4.4
|
0.079
|
0.016
|
0.060
|
221,000
|
271,000
|
1,495,000
|
306,000
|
1,139,000
|
|
0.50
|
1,901,000
|
3.617
|
4.4
|
0.079
|
0.016
|
0.060
|
221,000
|
271,000
|
1,495,000
|
306,000
|
1,139,000
|
|
1.00
|
1,767,000
|
3.826
|
4.6
|
0.082
|
0.017
|
0.062
|
217,000
|
264,000
|
1,454,000
|
293,000
|
1,097,000
|
|
1.50
|
1,351,000
|
4.648
|
5.1
|
0.093
|
0.017
|
0.059
|
202,000
|
223,000
|
1,255,000
|
230,000
|
799,000
|
|
2.00
|
1,119,000
|
5.251
|
5.6
|
0.103
|
0.019
|
0.063
|
189,000
|
203,000
|
1,150,000
|
209,000
|
707,000
|
|
2.50
|
961,000
|
5.744
|
5.7
|
0.109
|
0.019
|
0.065
|
178,000
|
177,000
|
1,048,000
|
186,000
|
627,000
|
|
3.00
|
801,000
|
6.340
|
5.9
|
0.114
|
0.021
|
0.073
|
163,000
|
151,000
|
916,000
|
164,000
|
585,000
|
|
TOTAL SAN JOSE DE GRACIA
|
|||||||||||
|
ORE
|
GRADE
|
CONTAINED
|
|||||||||
|
Cutoff
|
tonnes
|
Au g/t
|
Ag g/t
|
Cu%
|
Pb%
|
Zn%
|
Au oz
|
Ag oz
|
Cu Kgs.
|
Pb Kgs.
|
Zn Kgs.
|
|
INDICATED
|
|||||||||||
|
0.00
|
2,695,000
|
4.897
|
10.495
|
0.225
|
0.028
|
0.161
|
424,000
|
910,000
|
6,043,000
|
740,000
|
4,328,000
|
|
0.50
|
2,692,000
|
4.901
|
10.505
|
0.225
|
0.028
|
0.161
|
424,000
|
909,000
|
6,042,000
|
739,000
|
4,327,000
|
|
1.00
|
2,610,000
|
5.031
|
10.734
|
0.229
|
0.028
|
0.164
|
422,000
|
901,000
|
5,976,000
|
728,000
|
4,273,000
|
|
1.50
|
2,420,000
|
5.328
|
11.209
|
0.239
|
0.029
|
0.167
|
414,000
|
872,000
|
5,773,000
|
690,000
|
4,050,000
|
|
2.00
|
2,200,000
|
5.685
|
11.8
|
0.249
|
0.029
|
0.170
|
402,000
|
831,000
|
5,482,000
|
646,000
|
3,733,000
|
|
2.50
|
1,954,000
|
6.117
|
12.270
|
0.261
|
0.030
|
0.171
|
384,000
|
771,000
|
5,093,000
|
589,000
|
3,348,000
|
|
3.00
|
1,699,000
|
6.621
|
12.838
|
0.269
|
0.030
|
0.162
|
362,000
|
701,000
|
4,579,000
|
506,000
|
2,754,000
|
|
INFERRED
|
|||||||||||
|
0.00
|
6,046,000
|
4.274
|
8.351
|
0.146
|
0.027
|
0.143
|
831,000
|
1,623,000
|
8,811,000
|
1,639,000
|
8,662,000
|
|
0.50
|
6,003,000
|
4.302
|
8.398
|
0.147
|
0.027
|
0.144
|
830,000
|
1,621,000
|
8,805,000
|
1,638,000
|
8,657,000
|
|
1.00
|
5,681,000
|
4.499
|
8.654
|
0.151
|
0.028
|
0.149
|
822,000
|
1,581,000
|
8,611,000
|
1,599,000
|
8,456,000
|
|
1.50
|
4,728,000
|
5.164
|
9.293
|
0.168
|
0.031
|
0.160
|
785,000
|
1,413,000
|
7,965,000
|
1,459,000
|
7,586,000
|
|
2.00
|
3,953,000
|
5.830
|
10.1
|
0.182
|
0.033
|
0.171
|
741,000
|
1,285,000
|
7,193,000
|
1,283,000
|
6,776,000
|
|
2.50
|
3,303,000
|
6.535
|
10.473
|
0.185
|
0.034
|
0.180
|
694,000
|
1,112,000
|
6,120,000
|
1,142,000
|
5,967,000
|
|
3.00
|
2,757,000
|
7.284
|
10.965
|
0.186
|
0.037
|
0.189
|
646,000
|
972,000
|
5,126,000
|
1,021,000
|
5,227,000
|
(Due to rounding the numbers in the above may not check exactly. Tonnes and contained metal are reported to nearest tonne, troy ounce or kilogram for comparative purposes only and do not imply this degree of precision or accuracy. This is an estimate of in situ resources only and there is no assurance that any part of these resources can be converted to reserves)
23
2012 DynaMexico-CAM SJG Mineral Resource Estimate and Selected Drill Results by Target Area
Tres Amigos
The 2012 DynaMexico-CAM SJG Mineral Resource Estimate includes Indicated Resources at Tres Amigos of 893,000 tonnes with an average grade of 4.46 g/t, totaling 128,000 Oz. Au and includes an Inferred Resource of 1,453,000 tonnes with an average grade of 6.05 g/t, totaling 282,000 Oz. Au.
|
TRES AMIGOS VEIN
|
|||||||||||
|
ORE
|
GRADE
|
CONTAINED
|
|||||||||
|
Cutoff
|
tonnes
|
Au g/t
|
Ag g/t
|
Cu%
|
Pb%
|
Zn%
|
Au oz
|
Ag oz
|
Cu Kgs.
|
Pb Kgs.
|
Zn Kgs.
|
|
INDICATED
|
|||||||||||
|
0.00
|
1,166,000
|
3.747
|
9.0
|
0.186
|
0.050
|
0.327
|
140,000
|
337,000
|
2,165,000
|
578,000
|
3,815,000
|
|
0.50
|
1,166,000
|
3.747
|
9.0
|
0.186
|
0.050
|
0.327
|
140,000
|
337,000
|
2,165,000
|
578,000
|
3,815,000
|
|
1.00
|
1,128,000
|
3.845
|
9.2
|
0.189
|
0.051
|
0.334
|
139,000
|
333,000
|
2,137,000
|
570,000
|
3,774,000
|
|
1.50
|
1,019,000
|
4.124
|
9.7
|
0.200
|
0.053
|
0.351
|
135,000
|
319,000
|
2,038,000
|
537,000
|
3,572,000
|
|
2.00
|
893,000
|
4.458
|
10.3
|
0.210
|
0.056
|
0.367
|
128,000
|
297,000
|
1,875,000
|
499,000
|
3,276,000
|
|
2.50
|
758,000
|
4.853
|
10.8
|
0.218
|
0.059
|
0.385
|
118,000
|
263,000
|
1,652,000
|
450,000
|
2,917,000
|
|
3.00
|
608,000
|
5.366
|
11.3
|
0.220
|
0.061
|
0.386
|
105,000
|
221,000
|
1,338,000
|
374,000
|
2,349,000
|
|
INFERRED
|
|||||||||||
|
0.00
|
1,994,000
|
4.795
|
9.3
|
0.204
|
0.050
|
0.337
|
307,000
|
595,000
|
4,073,000
|
996,000
|
6,725,000
|
|
0.50
|
1,992,000
|
4.801
|
9.3
|
0.205
|
0.050
|
0.338
|
307,000
|
595,000
|
4,073,000
|
996,000
|
6,722,000
|
|
1.00
|
1,937,000
|
4.913
|
9.5
|
0.208
|
0.051
|
0.341
|
306,000
|
589,000
|
4,028,000
|
981,000
|
6,600,000
|
|
1.50
|
1,702,000
|
5.426
|
10.3
|
0.223
|
0.055
|
0.359
|
297,000
|
561,000
|
3,799,000
|
929,000
|
6,114,000
|
|
2.00
|
1,453,000
|
6.045
|
11.0
|
0.233
|
0.055
|
0.376
|
282,000
|
514,000
|
3,390,000
|
802,000
|
5,460,000
|
|
2.50
|
1,165,000
|
6.981
|
11.5
|
0.225
|
0.061
|
0.410
|
261,000
|
432,000
|
2,617,000
|
710,000
|
4,781,000
|
|
3.00
|
950,000
|
7.933
|
11.5
|
0.204
|
0.065
|
0.432
|
242,000
|
350,000
|
1,935,000
|
620,000
|
4,107,000
|
Selected drill hole results for Tres Amigos follow:
|
Drill hole
|
Area
|
From m
|
To m
|
length (m)
|
Au g/t
|
Ag g/t
|
Cu%
|
Pb%
|
Zn%
|
|
97-002
|
Tres Amigos
|
42.70
|
58.20
|
15.50
|
3.99
|
15.10
|
0.38
|
0.00
|
0.00
|
|
97-006
|
Tres Amigos
|
27.80
|
29.65
|
1.85
|
6.46
|
45.50
|
1.10
|
0.03
|
0.32
|
|
97-007
|
Tres Amigos
|
57.00
|
67.00
|
10.00
|
3.41
|
12.20
|
0.09
|
0.00
|
0.00
|
|
97-009
|
Tres Amigos
|
100.00
|
102.00
|
2.00
|
13.53
|
3.10
|
0.02
|
0.01
|
0.50
|
|
97-012
|
Tres Amigos
|
24.50
|
26.20
|
1.70
|
8.57
|
34.90
|
0.39
|
1.00
|
4.30
|
|
97-013
|
Tres Amigos
|
95.00
|
107.50
|
12.50
|
20.80
|
21.80
|
0.43
|
0.06
|
0.15
|
|
97-035
|
Tres Amigos
|
126.00
|
132.00
|
6.00
|
8.84
|
14.20
|
0.28
|
0.00
|
0.13
|
|
97-037
|
Tres Amigos
|
35.90
|
37.20
|
1.30
|
11.97
|
15.00
|
0.19
|
0.22
|
3.60
|
|
97-039
|
Tres Amigos
|
40.20
|
43.20
|
3.00
|
29.50
|
44.60
|
0.58
|
0.95
|
7.45
|
|
97-040
|
Tres Amigos
|
78.00
|
80.00
|
2.00
|
14.88
|
10.90
|
0.19
|
0.17
|
0.10
|
|
97-040
|
Tres Amigos
|
92.00
|
94.00
|
2.00
|
10.81
|
16.30
|
0.38
|
0.01
|
0.78
|
|
97-040
|
Tres Amigos
|
104.00
|
108.00
|
4.00
|
7.21
|
4.80
|
0.04
|
0.00
|
0.25
|
|
97-045
|
Tres Amigos
|
100.00
|
106.00
|
6.00
|
11.46
|
3.40
|
0.03
|
0.02
|
0.17
|
|
97-047
|
Tres Amigos
|
124.94
|
132.00
|
7.06
|
7.51
|
15.40
|
0.09
|
0.27
|
3.42
|
|
97-050
|
Tres Amigos
|
78.00
|
80.00
|
2.00
|
8.53
|
10.80
|
0.05
|
0.78
|
2.00
|
|
08-102
|
Tres Amigos
|
158.66
|
162.47
|
3.81
|
5.10
|
6.60
|
0.14
|
0.01
|
0.19
|
|
08-104
|
Tres Amigos
|
67.45
|
68.80
|
1.35
|
26.20
|
327.90
|
1.60
|
0.23
|
0.01
|
|
08-113
|
Tres Amigos
|
25.10
|
26.70
|
1.60
|
13.40
|
3.20
|
0.00
|
0.01
|
0.90
|
|
08-115
|
Tres Amigos
|
153.30
|
159.00
|
5.70
|
8.31
|
8.30
|
0.17
|
0.00
|
0.07
|
|
08-116
|
Tres Amigos
|
134.80
|
138.10
|
3.30
|
21.74
|
9.90
|
0.06
|
0.04
|
0.15
|
|
08-118
|
Tres Amigos
|
27.84
|
31.88
|
4.04
|
5.18
|
30.50
|
0.38
|
0.80
|
5.68
|
|
08-118
|
Tres Amigos
|
52.65
|
53.73
|
1.08
|
13.70
|
13.90
|
0.06
|
0.98
|
4.53
|
|
10-150
|
Tres Amigos
|
285.61
|
288.49
|
2.88
|
10.93
|
14.24
|
0.32
|
0.01
|
0.03
|
|
10-150
|
Tres Amigos
|
312.80
|
321.81
|
9.01
|
3.97
|
2.35
|
0.09
|
0.00
|
0.03
|
|
10-151
|
Tres Amigos
|
208.38
|
216.20
|
7.82
|
22.19
|
14.70
|
0.36
|
0.01
|
0.06
|
|
10-152
|
Tres Amigos
|
174.42
|
175.55
|
1.13
|
9.85
|
16.68
|
0.18
|
0.05
|
0.15
|
|
10-153
|
Tres Amigos
|
207.47
|
211.10
|
3.63
|
5.36
|
12.92
|
0.33
|
0.05
|
0.23
|
|
10-154
|
Tres Amigos
|
73.00
|
74.75
|
1.75
|
21.89
|
9.30
|
0.00
|
0.00
|
0.02
|
|
10-175
|
Tres Amigos
|
135.93
|
140.00
|
4.07
|
3.41
|
8.34
|
0.15
|
0.28
|
0.56
|
|
10-175
|
Tres Amigos
|
241.59
|
245.40
|
3.81
|
6.37
|
3.41
|
0.02
|
0.00
|
0.03
|
|
10-176
|
Tres Amigos
|
221.04
|
228.91
|
7.87
|
2.00
|
7.02
|
0.18
|
0.09
|
1.02
|
|
10-177
|
Tres Amigos
|
228.63
|
245.00
|
16.37
|
10.58
|
9.75
|
0.25
|
0.02
|
0.09
|
|
10-178
|
Tres Amigos
|
222.55
|
233.45
|
10.90
|
4.22
|
8.11
|
0.31
|
0.01
|
0.13
|
|
10-179
|
Tres Amigos
|
75.3
|
77.02
|
1.72
|
105.51
|
49.60
|
0.03
|
0.01
|
0.06
|
|
10-179
|
Tres Amigos
|
174.85
|
179.52
|
4.67
|
5.70
|
15.89
|
0.11
|
0.00
|
0.16
|
|
10-226
|
Tres Amigos
|
205.05
|
213.09
|
8.04
|
18.47
|
19.77
|
0.42
|
0.13
|
0.22
|
|
10-227
|
Tres Amigos
|
176.95
|
186.75
|
9.80
|
8.42
|
11.92
|
0.41
|
0.04
|
0.33
|
|
10-228
|
Tres Amigos
|
164.31
|
167.29
|
2.98
|
3.73
|
26.21
|
0.58
|
0.09
|
0.35
|
|
10-230
|
Tres Amigos
|
244.91
|
249.45
|
4.54
|
18.09
|
15.48
|
0.53
|
0.02
|
0.03
|
|
10-231
|
Tres Amigos
|
266.70
|
269.45
|
2.75
|
8.99
|
35.18
|
0.84
|
0.00
|
0.03
|
|
10-233
|
Tres Amigos
|
177.00
|
179.40
|
2.40
|
5.42
|
2.87
|
0.03
|
0.04
|
0.41
|
|
10-234
|
Tres Amigos
|
214.61
|
217.97
|
3.36
|
15.05
|
13.45
|
0.23
|
0.01
|
0.01
|
|
10-235
|
Tres Amigos
|
147.65
|
151.15
|
3.50
|
2.95
|
0.55
|
0.01
|
0.00
|
0.01
|
|
10-237
|
Tres Amigos
|
92.44
|
92.84
|
0.40
|
883.91
|
195.00
|
0.24
|
0.77
|
5.35
|
|
11-246
|
Tres Amigos
|
107.30
|
108.20
|
0.90
|
63.85
|
10.10
|
0.03
|
0.01
|
0.01
|
|
11-257
|
Tres Amigos
|
60.84
|
63.33
|
2.49
|
5.37
|
9.28
|
0.25
|
0.01
|
0.40
|
|
11-257
|
Tres Amigos
|
92.00
|
94.66
|
2.66
|
5.00
|
6.74
|
0.25
|
0.02
|
1.16
|
|
11-260
|
Tres Amigos
|
63.40
|
71.15
|
7.75
|
7.84
|
10.68
|
0.16
|
0.12
|
2.28
|
|
11-265
|
Tres Amigos
|
47.95
|
52.17
|
4.22
|
3.07
|
2.14
|
0.07
|
0.00
|
0.08
|
|
11-271
|
Tres Amigos
|
115.40
|
120.15
|
4.75
|
13.93
|
18.56
|
0.54
|
0.02
|
0.14
|
|
11-278
|
Tres Amigos
|
66.75
|
67.40
|
0.65
|
16.34
|
2.80
|
0.02
|
0.02
|
0.08
|
|
11-280
|
Tres Amigos
|
3.05
|
4.57
|
1.52
|
10.67
|
0.50
|
0.01
|
0.00
|
0.01
|
24
San Pablo
The 2012 DynaMexico-Cam SJG Mineral Resource Estimate includes Indicated Resources at San Pablo of 1,308,000 tonnes with an average grade of 6.52 g/t, totaling 274,000 Oz. Au and includes an Inferred Resource of 532,000 tonnes with an average grade of 6.02 g/t, totaling 103,000 Oz. Au.
|
SAN PABLO VEIN
|
|||||||||||
|
ORE
|
GRADE
|
CONTAINED
|
|||||||||
|
Cutoff
|
tonnes
|
Au g/t
|
Ag g/t
|
Cu%
|
Pb%
|
Zn%
|
Au oz
|
Ag oz
|
Cu Kgs.
|
Pb Kgs.
|
Zn Kgs.
|
|
INDICATED
|
|||||||||||
|
0.00
|
1,530,000
|
5.773
|
11.6
|
0.254
|
0.011
|
0.034
|
283,000
|
573,000
|
3,878,000
|
162,000
|
513,000
|
|
0.50
|
1,527,000
|
5.783
|
11.7
|
0.254
|
0.011
|
0.034
|
284,000
|
573,000
|
3,877,000
|
162,000
|
512,000
|
|
1.00
|
1,482,000
|
5.935
|
11.9
|
0.259
|
0.011
|
0.034
|
283,000
|
568,000
|
3,839,000
|
158,000
|
500,000
|
|
1.50
|
1,401,000
|
6.204
|
12.3
|
0.267
|
0.011
|
0.034
|
279,000
|
553,000
|
3,735,000
|
153,000
|
478,000
|
|
2.00
|
1,308,000
|
6.522
|
12.7
|
0.276
|
0.011
|
0.035
|
274,000
|
535,000
|
3,607,000
|
147,000
|
458,000
|
|
2.50
|
1,197,000
|
6.917
|
13.2
|
0.288
|
0.012
|
0.036
|
266,000
|
508,000
|
3,441,000
|
139,000
|
432,000
|
|
3.00
|
1,091,000
|
7.320
|
13.7
|
0.297
|
0.012
|
0.037
|
257,000
|
480,000
|
3,241,000
|
132,000
|
405,000
|
|
INFERRED
|
|||||||||||
|
0.00
|
860,000
|
4.179
|
8.8
|
0.159
|
0.010
|
0.031
|
115,000
|
242,000
|
1,367,000
|
84,000
|
263,000
|
|
0.50
|
842,000
|
4.262
|
8.9
|
0.162
|
0.010
|
0.031
|
115,000
|
241,000
|
1,363,000
|
84,000
|
261,000
|
|
1.00
|
756,000
|
4.653
|
9.3
|
0.168
|
0.010
|
0.030
|
113,000
|
225,000
|
1,273,000
|
74,000
|
227,000
|
|
1.50
|
614,000
|
5.445
|
10.5
|
0.188
|
0.010
|
0.030
|
108,000
|
207,000
|
1,157,000
|
60,000
|
185,000
|
|
2.00
|
532,000
|
6.016
|
11.3
|
0.202
|
0.010
|
0.030
|
103,000
|
194,000
|
1,074,000
|
51,000
|
161,000
|
|
2.50
|
463,000
|
6.583
|
11.6
|
0.215
|
0.009
|
0.031
|
98,000
|
172,000
|
997,000
|
43,000
|
143,000
|
|
3.00
|
426,000
|
6.917
|
11.9
|
0.220
|
0.009
|
0.031
|
95,000
|
163,000
|
935,000
|
40,000
|
131,000
|
Selected drill hole results for San Pablo follow:
|
Drill hole
|
Area
|
From m
|
To m
|
length (m)
|
Au g/t
|
Ag g/t
|
Cu%
|
Pb%
|
Zn%
|
|
07-007
|
San Pablo
|
85.50
|
87.50
|
2.00
|
24.55
|
45.00
|
0.49
|
0.03
|
0.07
|
|
07-008
|
San Pablo
|
115.80
|
118.10
|
2.30
|
7.60
|
18.90
|
0.02
|
0.01
|
0.00
|
|
07-009
|
San Pablo
|
167.40
|
170.55
|
3.15
|
8.24
|
2.00
|
0.00
|
0.00
|
0.01
|
|
07-012
|
San Pablo
|
19.70
|
23.90
|
4.20
|
10.45
|
10.00
|
0.15
|
0.00
|
0.01
|
|
07-023
|
San Pablo
|
69.10
|
70.50
|
1.40
|
9.16
|
24.50
|
0.63
|
0.03
|
0.04
|
|
07-026
|
San Pablo
|
65.90
|
67.80
|
1.90
|
34.00
|
18.70
|
0.21
|
0.01
|
0.05
|
|
07-027
|
San Pablo
|
142.80
|
148.85
|
6.05
|
13.72
|
28.60
|
1.06
|
0.02
|
0.04
|
|
07-029
|
San Pablo
|
130.60
|
132.30
|
1.70
|
23.86
|
43.00
|
0.94
|
0.00
|
0.01
|
|
07-031
|
San Pablo
|
94.25
|
98.05
|
3.80
|
31.32
|
69.60
|
1.01
|
0.23
|
0.74
|
|
08-048
|
San Pablo
|
219.46
|
228.66
|
9.20
|
4.39
|
7.50
|
0.28
|
0.00
|
0.01
|
|
08-051
|
San Pablo
|
183.55
|
192.60
|
9.05
|
22.95
|
13.60
|
0.40
|
0.00
|
0.03
|
|
08-060
|
San Pablo
|
235.70
|
238.60
|
2.90
|
13.88
|
12.50
|
0.58
|
0.00
|
0.01
|
|
08-089
|
San Pablo
|
173.80
|
175.10
|
1.30
|
4.11
|
35.60
|
1.00
|
0.01
|
0.01
|
|
08-090
|
San Pablo
|
190.70
|
191.90
|
1.20
|
11.55
|
48.50
|
1.00
|
0.02
|
0.02
|
|
08-092
|
San Pablo
|
124.80
|
125.80
|
1.00
|
23.31
|
0.50
|
0.00
|
0.01
|
0.00
|
|
08-097
|
San Pablo
|
227.69
|
229.75
|
2.06
|
17.04
|
20.00
|
0.56
|
0.03
|
0.04
|
|
09-131
|
San Pablo
|
95.55
|
96.65
|
1.10
|
28.25
|
20.30
|
0.26
|
0.17
|
0.18
|
|
09-133
|
San Pablo
|
126.80
|
129.80
|
3.00
|
13.10
|
10.25
|
0.32
|
0.00
|
0.02
|
|
09-134
|
San Pablo
|
79.09
|
81.57
|
2.48
|
4.33
|
9.46
|
0.36
|
0.00
|
0.02
|
|
09-135
|
San Pablo
|
75.70
|
79.10
|
3.40
|
4.60
|
24.29
|
1.22
|
0.01
|
0.02
|
|
09-137
|
San Pablo
|
135.90
|
140.87
|
4.97
|
5.35
|
12.46
|
0.31
|
0.00
|
0.01
|
|
09-137
|
San Pablo
|
157.25
|
158.93
|
1.68
|
12.50
|
16.90
|
0.39
|
0.00
|
0.01
|
|
09-138
|
San Pablo
|
150.62
|
153.59
|
2.97
|
8.80
|
10.46
|
0.28
|
0.00
|
0.02
|
|
09-139
|
San Pablo
|
132.18
|
137.68
|
5.50
|
20.51
|
25.82
|
0.70
|
0.00
|
0.01
|
|
09-140
|
San Pablo
|
99.92
|
102.20
|
2.28
|
4.59
|
67.30
|
1.77
|
0.00
|
0.01
|
|
10-195
|
San Pablo
|
170.67
|
173.61
|
2.94
|
3.26
|
10.47
|
0.32
|
0.00
|
0.00
|
|
10-197
|
San Pablo
|
48.15
|
51.82
|
3.67
|
7.96
|
13.18
|
0.49
|
0.00
|
0.03
|
|
10-197
|
San Pablo
|
102.00
|
105.30
|
3.30
|
28.38
|
14.00
|
0.00
|
0.01
|
0.09
|
|
10-199
|
San Pablo
|
4.68
|
6.24
|
1.56
|
9.14
|
4.10
|
0.02
|
0.00
|
0.00
|
|
10-201
|
San Pablo
|
23.40
|
25.50
|
2.10
|
15.78
|
17.35
|
0.19
|
0.01
|
0.02
|
|
10-203
|
San Pablo
|
70.65
|
76.15
|
5.50
|
332.86*
|
143.90*
|
0.02
|
0.00
|
0.01
|
|
10-207
|
San Pablo
|
80.15
|
83.20
|
3.05
|
16.74
|
24.17
|
0.54
|
0.01
|
0.02
|
|
10-212
|
San Pablo
|
46.80
|
51.60
|
4.80
|
5.90
|
6.97
|
0.38
|
0.01
|
0.22
|
|
10-213
|
San Pablo
|
171.75
|
173.56
|
1.81
|
5.78
|
10.60
|
0.18
|
0.00
|
0.01
|
|
10-215
|
San Pablo
|
186.80
|
190.27
|
3.47
|
15.82
|
14.68
|
0.41
|
0.03
|
0.02
|
|
10-217
|
San Pablo
|
182.64
|
184.06
|
1.42
|
89.95
|
38.70
|
0.74
|
0.00
|
0.01
|
|
10-219
|
San Pablo
|
155.84
|
157.25
|
1.41
|
10.82
|
11.84
|
0.39
|
0.00
|
0.01
|
|
10-221
|
San Pablo
|
69.98
|
71.98
|
2.00
|
13.14
|
23.93
|
0.62
|
0.00
|
0.01
|
|
10-224
|
San Pablo
|
122.82
|
125.05
|
2.23
|
5.29
|
18.70
|
0.69
|
0.02
|
0.04
|
|
10-224
|
San Pablo
|
148.60
|
154.95
|
6.35
|
7.04
|
13.31
|
0.57
|
0.00
|
0.01
|
|
10-236
|
San Pablo
|
112.96
|
117.03
|
4.07
|
11.38
|
22.92
|
0.68
|
0.00
|
0.01
|
|
11-247
|
San Pablo
|
63.60
|
65.45
|
1.85
|
10.49
|
5.92
|
0.01
|
0.00
|
0.02
|
|
11-247
|
San Pablo
|
80.00
|
83.47
|
3.47
|
5.00
|
36.71
|
0.53
|
0.01
|
0.02
|
|
11-249
|
San Pablo
|
108.20
|
109.93
|
1.73
|
8.21
|
30.29
|
0.80
|
0.00
|
0.02
|
|
11-250
|
San Pablo
|
101.72
|
104.81
|
3.09
|
20.15
|
53.44
|
0.88
|
0.24
|
0.54
|
|
11-263
|
San Pablo
|
119.88
|
121.13
|
1.25
|
9.47
|
21.70
|
0.65
|
0.01
|
0.04
|
|
11-264
|
San Pablo
|
145.21
|
146.45
|
1.24
|
21.24
|
78.80
|
0.72
|
0.04
|
0.01
|
|
11-268
|
San Pablo
|
92.65
|
94.25
|
1.60
|
11.74
|
21.13
|
0.37
|
0.01
|
0.04
|
25
La Union
The 2012 DynaMexico-Cam SJG Mineral Resource Estimate includes Inferred Resources at La Union of 849,000 tonnes with an average grade of 6.11 g/t, totaling 167,000 Oz. Au.
|
LA UNION VEIN
|
|||||||||||
|
ORE
|
GRADE
|
CONTAINED
|
|||||||||
|
Cutoff
|
tonnes
|
Au g/t
|
Ag g/t
|
Cu%
|
Pb%
|
Zn%
|
Au oz
|
Ag oz
|
Cu Kgs.
|
Pb Kgs.
|
Zn Kgs.
|
|
INFERRED
|
|||||||||||
|
0.00
|
1,290,000
|
4.502
|
12.4
|
0.145
|
0.019
|
0.041
|
187,000
|
515,000
|
1,876,000
|
252,000
|
535,000
|
|
0.50
|
1,269,000
|
4.572
|
12.6
|
0.148
|
0.020
|
0.042
|
187,000
|
514,000
|
1,874,000
|
251,000
|
535,000
|
|
1.00
|
1,221,000
|
4.721
|
12.8
|
0.152
|
0.020
|
0.044
|
185,000
|
503,000
|
1,856,000
|
250,000
|
532,000
|
|
1.50
|
1,061,000
|
5.237
|
12.4
|
0.165
|
0.023
|
0.046
|
179,000
|
422,000
|
1,755,000
|
240,000
|
487,000
|
|
2.00
|
849,000
|
6.107
|
13.7
|
0.186
|
0.026
|
0.053
|
167,000
|
374,000
|
1,579,000
|
221,000
|
448,000
|
|
2.50
|
713,000
|
6.843
|
14.4
|
0.204
|
0.028
|
0.058
|
157,000
|
331,000
|
1,458,000
|
203,000
|
417,000
|
|
3.00
|
580,000
|
7.792
|
16.5
|
0.231
|
0.034
|
0.069
|
145,000
|
308,000
|
1,340,000
|
196,000
|
403,000
|
Selected drill results for La Union follow:
|
Drill hole
|
Area
|
From m
|
To m
|
length (m)
|
Au g/t
|
Ag g/t
|
Cu%
|
Pb%
|
Zn%
|
|
92-001
|
La Union
|
46.00
|
60.96
|
14.96
|
2.58
|
||||
|
97-027
|
La Union
|
20.30
|
21.30
|
1.00
|
6.14
|
12.50
|
0.05
|
0.24
|
0.04
|
|
97-029
|
La Union
|
38.10
|
41.20
|
3.10
|
3.63
|
8.60
|
0.11
|
0.02
|
0.06
|
|
97-030
|
La Union
|
75.00
|
78.10
|
3.10
|
4.62
|
9.10
|
0.50
|
0.00
|
0.01
|
|
97-031
|
La Union
|
87.00
|
91.00
|
4.00
|
2.84
|
6.70
|
0.34
|
0.00
|
0.01
|
|
97-034
|
La Union
|
45.70
|
47.70
|
2.00
|
8.87
|
4.10
|
0.14
|
0.00
|
0.01
|
|
08-061
|
La Union
|
27.80
|
31.30
|
3.50
|
2.01
|
24.80
|
0.45
|
0.22
|
0.15
|
|
08-076
|
La Union
|
32.75
|
34.85
|
2.10
|
36.09
|
47.80
|
0.43
|
0.80
|
1.06
|
|
08-080
|
La Union
|
125.30
|
128.40
|
3.10
|
4.82
|
4.40
|
0.11
|
0.00
|
0.01
|
|
09-143
|
La Union
|
55.36
|
56.76
|
1.40
|
12.08
|
8.80
|
0.13
|
0.01
|
0.01
|
|
10-208
|
La Union
|
150.61
|
152.67
|
2.06
|
6.60
|
10.30
|
0.40
|
0.00
|
0.01
|
|
10-216
|
La Union
|
39.24
|
42.20
|
2.96
|
12.36
|
3.45
|
0.06
|
0.00
|
0.01
|
|
10-218
|
La Union
|
140.01
|
141.30
|
1.29
|
8.42
|
6.41
|
0.08
|
0.00
|
0.01
|
|
10-223
|
La Union
|
29.52
|
31.14
|
1.62
|
9.90
|
6.60
|
0.02
|
0.00
|
0.02
|
|
10-223
|
La Union
|
63.90
|
67.42
|
3.52
|
10.24
|
10.69
|
0.62
|
0.00
|
0.01
|
|
11-244
|
La Union
|
73.82
|
74.86
|
1.04
|
9.79
|
65.20
|
1.42
|
0.03
|
0.37
|
|
11-252
|
La Union
|
55.25
|
59.70
|
4.45
|
4.26
|
12.05
|
0.37
|
0.01
|
0.04
|
|
11-256
|
La Union
|
51.61
|
52.85
|
1.24
|
144.08
|
138.60
|
1.06
|
1.61
|
1.78
|
|
11-256
|
La Union
|
99.93
|
101.29
|
1.36
|
9.04
|
3.30
|
0.01
|
0.00
|
0.01
|
|
11-298
|
La Union
|
49.15
|
49.85
|
0.7
|
49.39
|
20.80
|
0.20
|
0.01
|
0.03
|
26
La Purisima
The 2012 DynaMexico-CAM SJG Mineral Resource Estimate includes Inferred Resources at La Purisima of 1,119,000 tonnes with an average grade of 5.25 g/t, totaling 189,000 Oz. Au.
|
LA PURISIMA VEIN
|
|||||||||||
|
ORE
|
GRADE
|
CONTAINED
|
|||||||||
|
Cutoff
|
tonnes
|
Au g/t
|
Ag g/t
|
Cu%
|
Pb%
|
Zn%
|
Au oz
|
Ag oz
|
CuKgs.
|
Pb Kgs.
|
Zn Kgs.
|
|
INFERRED
|
|||||||||||
|
0.00
|
1,902,000
|
3.615
|
4.4
|
0.079
|
0.016
|
0.060
|
221,000
|
271,000
|
1,495,000
|
306,000
|
1,139,000
|
|
0.50
|
1,901,000
|
3.617
|
4.4
|
0.079
|
0.016
|
0.060
|
221,000
|
271,000
|
1,495,000
|
306,000
|
1,139,000
|
|
1.00
|
1,767,000
|
3.826
|
4.6
|
0.082
|
0.017
|
0.062
|
217,000
|
264,000
|
1,454,000
|
293,000
|
1,097,000
|
|
1.50
|
1,351,000
|
4.648
|
5.1
|
0.093
|
0.017
|
0.059
|
202,000
|
223,000
|
1,255,000
|
230,000
|
799,000
|
|
2.00
|
1,119,000
|
5.251
|
5.6
|
0.103
|
0.019
|
0.063
|
189,000
|
203,000
|
1,150,000
|
209,000
|
707,000
|
|
2.50
|
961,000
|
5.744
|
5.7
|
0.109
|
0.019
|
0.065
|
178,000
|
177,000
|
1,048,000
|
186,000
|
627,000
|
|
3.00
|
801,000
|
6.340
|
5.9
|
0.114
|
0.021
|
0.073
|
163,000
|
151,000
|
916,000
|
164,000
|
585,000
|
Selected drill hole results for La Purisima follow:
|
Drill hole
|
Area
|
From m
|
To m
|
length (m)
|
Au g/t
|
Ag g/t
|
Cu%
|
Pb%
|
Zn%
|
|
97-055
|
La Purisima
|
24.40
|
27.40
|
3.00
|
5.24
|
28.50
|
0.63
|
0.35
|
1.83
|
|
97-063
|
La Purisima
|
54.50
|
61.50
|
7.00
|
3.13
|
4.00
|
0.07
|
0.02
|
0.00
|
|
97-063
|
La Purisima
|
67.30
|
70.00
|
2.70
|
8.45
|
11.10
|
0.68
|
0.00
|
0.00
|
|
07-016
|
La Purisima
|
32.45
|
34.60
|
2.15
|
5.20
|
4.20
|
0.22
|
0.00
|
0.01
|
|
07-021
|
La Purisima
|
158.70
|
160.80
|
2.10
|
75.90
|
76.00
|
1.61
|
0.07
|
0.00
|
|
07-036
|
La Purisima
|
91.40
|
92.82
|
1.42
|
4.47
|
2.60
|
0.01
|
0.01
|
0.06
|
|
07-037
|
La Purisima
|
251.30
|
253.50
|
2.20
|
4.88
|
23.00
|
0.01
|
0.01
|
0.00
|
|
07-039
|
La Purisima
|
197.55
|
200.80
|
3.25
|
10.93
|
4.60
|
0.04
|
0.00
|
0.01
|
|
07-042
|
La Purisima
|
16.10
|
18.30
|
2.20
|
3.02
|
2.00
|
0.01
|
0.01
|
0.05
|
|
08-068
|
La Purisima
|
135.40
|
137.00
|
1.60
|
18.16
|
8.30
|
0.04
|
0.03
|
0.22
|
|
08-070
|
La Purisima
|
120.50
|
121.60
|
1.10
|
9.50
|
2.70
|
0.01
|
0.00
|
0.06
|
|
08-082
|
La Purisima
|
151.60
|
153.30
|
1.70
|
18.16
|
0.10
|
0.00
|
0.00
|
0.04
|
|
10-161
|
La Purisima
|
87.70
|
99.67
|
11.97
|
3.12
|
4.86
|
0.36
|
0.00
|
0.01
|
|
10-186
|
La Purisima
|
92.10
|
93.45
|
1.35
|
14.73
|
11.17
|
0.47
|
0.00
|
0.00
|
|
10-193
|
La Purisima
|
41.15
|
46.75
|
5.60
|
3.96
|
32.31
|
0.01
|
0.10
|
0.14
|
|
10-198
|
La Purisima
|
35.05
|
36.58
|
1.53
|
13.64
|
6.10
|
0.14
|
0.00
|
0.00
|
|
10-204
|
La Purisima
|
128.02
|
131.86
|
3.84
|
4.06
|
3.15
|
0.09
|
0.00
|
0.00
|
|
10-204
|
La Purisima
|
173.15
|
174.58
|
1.43
|
7.21
|
5.57
|
0.08
|
0.00
|
0.01
|
|
10-206
|
La Purisima
|
121.73
|
124.04
|
2.31
|
14.63
|
3.45
|
0.02
|
0.00
|
0.00
|
|
11-282
|
La Purisima
|
27.43
|
30.48
|
3.05
|
6.21
|
3.44
|
0.01
|
0.02
|
0.03
|
|
11-282
|
La Purisima
|
74.45
|
75.36
|
0.91
|
18.87
|
10.10
|
0.03
|
0.00
|
0.00
|
|
11-282
|
La Purisima
|
152.40
|
153.92
|
1.52
|
7.79
|
1.40
|
0.04
|
0.00
|
0.00
|
|
11-285
|
La Purisima
|
85.06
|
87.92
|
2.86
|
3.93
|
0.80
|
0.03
|
0.00
|
0.00
|
|
11-285
|
La Purisima
|
98.50
|
102.15
|
3.65
|
6.70
|
3.87
|
0.20
|
0.00
|
0.01
|
|
11-289
|
La Purisima
|
109.73
|
112.78
|
3.05
|
9.50
|
7.05
|
0.11
|
0.02
|
0.00
|
|
11-293
|
La Purisima
|
38.11
|
39.27
|
1.16
|
10.06
|
0.50
|
0.01
|
0.00
|
0.00
|
|
11-293
|
La Purisima
|
158.75
|
160.55
|
1.80
|
12.65
|
2.84
|
0.10
|
0.00
|
0.01
|
27
Block Model in Surpac
While the Company has compiled its manual calculation and internal interpretation of the resource at SJG defined by drilling and production to date; the Company also is in process of building the block model of resources defined and inferred at SJG using Surpac, (Gemcom) software. The current block model at SJG confirms inferred resources at San Pablo, Tres Amigos, La Union, Palos Chinos, and La Purisima; with portions of the inferred resource in a high grade category, and including probable resources at San Pablo and Tres Amigos, and is consistent with the CAM SJG Mineral Resource Estimate. The Company will continue this Surpac modeling work as additional drill programs are planned and completed.
National Instrument 43-101 Technical Report for San Jose de Gracia
The Company received from DynaMexico on March 28, 2012 a National Instrument 43-101 (“NI 43-101”) compliant Technical Report for the San Jose de Gracia Project (the “2012 DynaMexico Luna-CAM SJG Technical Report”, the “Technical Report”), and approved by DynaResource de Mexico, SA de CV. (“DynaMexico”), the 100% owner of SJG.
The 2012 DynaMexico Luna-CAM SJG Technical Report was prepared by Mr. Ramon Luna, BS, P.Geo., of Servicios y Proyectos Mineros, Hermosillo, Mexico, and a Qualified Person as defined under NI 43-101; and by Mr. Robert Sandefur, BS, MSc, P.E., a senior reserve analyst for Chlumsky, Armbrust & Meyer LLC, Lakewood, CO., and a Qualified Person as defined under NI 43-101. The 2012 DynaMexico Luna-CAM SJG Technical Report includes as Section Fourteen (14) a Mineral Resource Estimate for SJG as prepared by Mr. Sandefur (the “2012 DynaMexico-CAM SJG 43-101 Mineral Resource Estimate”, the “Resource Estimate”).
The Company filed the Technical Report on SEDAR (www.sedar.com) on March 28, 2012.
Preliminary Economic Assessment Report
DynaMexico approved and released the National Instrument 43-101 (“NI 43-101”) Technical Report for SJG on March 28, 2012, and the Company now expects DynaMexico to commission a Preliminary Economic Assessment Report (“PEA”) in the second quarter, 2012. The Company expects the PEA to be commissioned to and compiled by a reputable firm and pursuant to National Instrument 43-101.
Structure of Company / Operations
Activities in México are conducted by DynaMéxico, through operating agreement to the operating subsidiary of DynaResource, Inc., Mineras de DynaResource SA de CV. (“MinerasDyna”); with the management of personnel being contracted by MinerasDyna through to the personnel management subsidiary, DynaResource Operaciones, SA de CV (“DynaOperaciones”). DynaResource, Inc. management and consultants continue to manage the 3 subsidiaries in México; while Chairman / CEO K.D. Diepholz is the President of each of the 3 companies. Management and administrative fees are charged by MinerasDyna and DynaOperaciones, which are eliminated in consolidation.
Competitive Advantage
The Company, through its subsidiaries, has been conducting business in México since March 2000. During this period the Company believes it has structured its subsidiaries properly and strategically, and during which time the Company has retained key personnel and developed key relationships and support. The Company believes its experience and accomplishments in México gives it a competitive advantage, even though many competitors may be larger and have more capital resources.
Drilling Programs
Further drilling programs at SJG are projected for the latter half of 2012, but those plans will take into consideration the recent NI 43-101 2012 DynaMexico-CAM SJG Mineral Resource Estimate and the recommendations made in the 2012 DynaMexico Luna-CAM SJG 43-101 Technical Report. Further drilling may be based upon recommendations made in the anticipated PEA report. The Company expects continued drilling at SJG in order to expand resources at San Pablo, Tres Amigos, La Cecena, Palos Chinos, La Union, La Purisima, and La Prieta. And, the Company expects extensions to mineralization in all directions and down dip from the main target areas.
28
Capital contributions and Expenditures to Earn In
In 2011, Goldgroup contributed $3,999,717 USD to DynaMéxico, in the year ending December 31, 2011. The total capital contributed by Goldgroup to DynaMéxico at December 31, 2011 was $18,000,000 USD which completed Goldgroup's capital contribution obligations under the Earn In/Option Agreement.
Note Receivable – Affiliate
In the year ending December 31, 2011, the Company did not loan any additional funds to DynaResource Nevada, Inc., a Nevada Corporation (“DynaNevada”), with one operating subsidiary in México, DynaNevada de México, SA de CV (“DynaNevada de Mexico”). The total amount loaned by the Company to DynaNevada at December 31, 2010 was $750,000 USD. The terms of the Note Receivable provide for a “Convertible Loan”, repayable at 5% interest over a 3 year period, and convertible at the Company’s option into Common Stock of DynaNevada at $0.25 / Share. DynaNevada is a related entity, and through its subsidiary in México (DynaNevada de México), (“DynaNevada de Mexico”), has entered into an Option agreement with Grupo México (“IMMSA”) in México, for the exploration and development of approximately 3,000 hectares in the State of San Luis Potosi (“the Santa Gertrudis Property”). In March, 2010, DynaNevada de Mexico completed the Option with IMMSA so that it now owns 100% of Santa Gertrudis. In June, 2010, DynaNevada de Mexico acquired an additional 6,000 Hectares in the State of Sinaloa (“the San Juan Property”).
On December 31, 2010, the Company exercised its option to convert the receivable from DynaNevada into shares of common stock at a rate of $.25 per share. The Company received 3,223,040 shares, which represents approximately 19.95% shares of outstanding shares of DynaNevada. At the time of the exchange, DynaNevada’s net book value was approximately $695,000, consisting of $30,000 cash and the remainder unproven mining properties. DynaNevada has a contingent liability arising from the purchase of one of the mining properties, which Management believes has no merit. Based upon the above, Management estimated the value of the Company’s DynaNevada shares as of December 31, 2011 and 2010 to be $70,000. Management believes the impairment is temporary, and therefore an unrealized loss of $735,760 has been recorded in comprehensive income.
Competition
DynaMéxico retains 100% of the rights to concessions over the area of the San José de Gracia property and currently sees no competition for mining on the lands covered by those concessions. If DynaMéxico were to re-start production activities, the sale of gold and any bi-products would be subject to global market prices, which prices fluctuate daily. The Company was successful in selling gold concentrates produced from SJG in prior years, and the Company expects willing buyers for its produced concentrates and/or other mineral products in the future. Actual prices received by DynaMéxico would depend upon these global market prices, less processing charges and any deductions.
The Company conducted a mining and milling operation from March 2003 through June, 2006. This activity was suspended in order to focus efforts on the exploration of the vast SJG District. The Company reported no revenue in 2008 and 2007. The Company does not expect any revenues from mining and production in 2011-2012. The Company earned minimal revenue during 2011 and 2010 of $0 and $305,652 respectively for exploration services performed for a related party.
The Company’s production and exploration costs were $2,654,227 and $3,620,617 for the years ended December 31, 2011 and 2010 respectively. The exploration costs in 2011 were less than in 2010 due to less drilling.
The Company's operating expenses included two categories, a) depreciation and amortization, and b) general and administrative expenses. Operating expenses were $2,933,794 for the year ended December 31, 2011 compared to $2,285,397 for the year ended December 31, 2010. Included in these amounts was depreciation and amortization of $132,022 and $142,951 in 2011 and 2010 respectively and common stock issued for services of $1,161,189 and $901,437 in 2011 and 2010 respectively.
Other income and expenses included interest income for the year ended December 31, 2011 of $1,123 compared with $2,655 for the year ended December 31, 2010. Additionally, we had other income of $0 in 2011 compared to $883 in 2010.
29
Noncontrolling Interest
Under the terms of the Earn In Agreement, Goldgroup Mining Inc. (Goldgroup), throughout 2010, had earned and owned a 25% interest in DynaResource de Mexico, S.A. de C.V. (DynaMexico) and since March 2011, Goldgroup's ownership percentage was 50%. The applicable portion of the earnings or loss attributable to Goldgroup is offset in this section. In the year ended December 31, 2011 and 2010 the portion of the net loss attributable to Goldgroup was $1,624,783 and $804,511 respectively. The increase in the amount attributable to the non-controlling interest is due to an increase in expenses in DynaMexico and therefore an increase in the loss of which the non-controlling interest would be allocated a larger amount.
Currency Translation Income / Loss
The currency translation loss was $(307,004) for the year ended December 31, 2011 and a gain of $419,840 for the year ended December 31, 2010. These gains are caused by the fluctuation of the exchange rate between the United States dollar and the Mexican peso.
The Company’s comprehensive loss before the noncontrolling interest for the years ended December 31, 2011 and 2010 was ($4,365,309) and ($5,443,107) respectively. The decrease in the loss is attributed to less exploration activities and related costs in 2011.
Plan of Operation
The
Plan of operation for the next twelve months includes DynaMexico continuing drilling, exploration and pre-production
activities at San Jose de Gracia. The amount allocated to each of these will depend on the recommendations that DynaMexico
receives in the Preliminary Economic Assessment that DynaMexico expects to commission in mid 2012. The Company is required to
fund its general and administrative expenses in the US. The Company does not currently generate revenue. The Company believes
that cash on hand is adequate to fund our ongoing general and administrative expenses for the next 12 months. The Company
plans to seek additional capital funding during the next 12 months depending on market conditions, results of drilling
activities, plans for production or continuing exploration activities, and other circumstances.
Capital Expenditures
The Company’s primary activities relate to the exploration of SJG property through its 50% owned subsidiary DynaMexico. Drilling and other services at SJG are contracted through MinerasDyna, the operating entity, to contractors. The Company does not foresee significant capital purchases in 2012 which would have to be funded out of its current cash reserves.
Liquidity and Capital Resources
As of December 31, 2011, the Company maintained working capital of $2,625,365, comprised of current assets of $2,705,660 and current liabilities of $125,295. This represents an increase of $1,077,335 from the working capital maintained by the Company of $1,548,030 at December 31, 2010, approximately $500,000 due to additional funds contributed by Goldgroup under the Earn In / Option Agreement which were still on hand at December 31, 2011 and capital raised by the Company.
Net cash used in operations for the year ended December 31, 2011 increased to $4,268,132 from $4,255,418 for the year ended December 31, 2010.
Cash used for purchase of fixed assets was $692,203 and $115,299 for the years ended December 31, 2011 and 2010 respectively.
Cash provided by financing activities for the year ended December 31, 2011 was $6,354,303 compared to $3,567,250 for the year ended December 31, 2010. The main changes include an increase in common stock sold by the Company of approximately $1.8 million over the year ended December 31, 2010.
30
Sampling Process
The geological data contained in this report was verified by an appropriate quality control person using industry standard quality controls and quality assurance protocols utilized in exploration activities. Standard reference samples and various duplicates are inserted in each batch of assays. Drill core samples are cut by saw on site and samples splits are prepared for shipment, sealed and then shipped for assaying. Samples are sent to a certified assayer (Inspectorate Exploration & Mining Services Ltd., Vancouver, BC.) and analyzed for gold by fire assay and for silver and 34 other trace and major elements in accordance with standard industry practices.
2011 Drilling Programs
In the period September 2006 through December 31, 2011, DynaMexico completed approximately 68,741 meters drilling at San Jose de Gracia, resulting in a defined NI 43-101 Mineral Resource Estimate as described herein as the 2012 DynaMexico-CAM SJG Mineral Resource Estimate. The Company expects continued and subsequent drilling programs in 2012 in order to continue to expand resources at San Pablo, Tres Amigos, La Cecena, Palos Chinos, La Union, La Purisima, and La Prieta / Rosario / Rudolpho. The Company expects extensions to mineralization in all directions and down dip from the main target areas.
Indicated and Inferred “Resources” at San José de Gracia
The Company was informed by DynaMéxico that it had outlined significant Indicated and Inferred gold resources from drilling activity at San Pablo, Tres Amigos, La Union, and La Purisima areas of SJG as described in the recent NI 43-101 2012 DynaMexico-CAM SJG Mineral Resource Estimate. Further drilling is expected to outline additional resources at these 4 major target areas at SJG, while additional resources are also expected to be defined at La Prieta and the area Northeast of Tres Amigos. Other areas at SJG indicate clear potential to develop additional resources as well.
Preliminary Economic Assessment Report (“PEA”)
The Company expects DynaMéxico to commission and complete a Preliminary Economic Assessment Report (“PEA”) in the second and third quarter 2012.
ITEM 7A. QUANTITATIVE AND QUALITATIVE DISCLOSURES ABOUT MARKET RISK
Not applicable.
31
ITEM 8. FINANCIAL STATEMENTS AND SUPPLEMENTARY DATA
Incorporated into and forming an integral part of this Form 10-K are the audited financial statements for the Company for the years ended December 31, 2011 and 2010. The financial statements as of December 31, 2011 and 2010, of the Company included in this Form 10-K have been audited by The Hall Group, CPAs, independent registered public accountants, as set forth in their report. The financial statements have been included in reliance upon the authority of them as experts in accounting and auditing.
| Financial Statements: | ||||
|
Report of Independent Registered Public Accounting Firm
|
33 | |||
|
Consolidated Balance Sheets as of December 31, 2011 and 2010
|
34 | |||
|
Consolidated Statements of Operations for the Years Ended December 31, 2011 and 2010 and Cumulative Since Reentering the Exploration Stage (January 1, 2007) through December 31, 2011
|
35 | |||
|
Consolidated Statement of Changes in Stockholders’ Equity for the Years Ended December 31, 2011 and 2010
|
36 | |||
|
Consolidated Statements of Cash Flows for the Years Ended December 31, 2011 and 2010 and Cumulative Since Reentering the Exploration Stage (January 1, 2007) through December 31, 2011
|
37 | |||
|
Notes to the Consolidated Financial Statements for the Years Ended December 31, 2011 and 2010
|
38 | |||
32
REPORT OF INDEPENDENT REGISTERED PUBLIC ACCOUNTING FIRM
To the Board of Directors and Management of
DynaResource, Inc.
Irving, Texas
We have audited the accompanying consolidated balance sheets of DynaResource, Inc. and subsidiaries as of December 31, 2011 and 2010 and the related consolidated statements of operations, stockholders’ equity and cash flows for the years ended December 31, 2011 and 2010 and for the period since reentering the Exploration Stage (January 1, 2007) through December 31, 2011. These consolidated financial statements are the responsibility of the Company’s management. Our responsibility is to express an opinion on these financial statements based on our audits.
We conducted our audits of these financial statements in accordance with the standards of the Public Company Accounting Oversight Board (United States). Those standards require that we plan and perform the audits to obtain reasonable assurance about whether the financial statements are free of material misstatement. An audit includes examining, on a test basis, evidence supporting the amounts and disclosures in the financial statements. An audit also includes assessing the accounting principles used and significant estimates made by management, as well as evaluating the overall financial statement presentation. We believe that our audits provide a reasonable basis for our opinion.
We were not engaged to examine management’s assertion about the effectiveness of DynaResource, Inc.’s internal control over financial reporting as of December 31, 2011 and 2010 and, accordingly, we do not express an opinion thereon.
In our opinion, the consolidated financial statements referred to above present fairly, in all material respects, the financial position of DynaResource, Inc. and subsidiaries as of December 31, 2011 and 2010 and the results of its operations and its cash flows for the years ended December 31, 2011 and 2010 and for the period since reentering the Exploration Stage (January 1, 2007) through December 31, 2011 in conformity with accounting principles generally accepted in the United States of America.
The Hall Group, CPAs
Dallas, Texas
March 22, 2012
33
DYNARESOURCE, INC.
(An Exploration Stage Company)
Consolidated Balance Sheets
December 31, 2011 and 2010
|
2011
|
2010
|
|||||||
|
ASSETS
|
||||||||
|
Current Assets:
|
||||||||
|
Cash and Cash Equivalents
|
$ | 2,670,933 | $ | 1,277,065 | ||||
|
Foreign Tax Receivable
|
34,593 | 255,384 | ||||||
|
Other Current Assets
|
45,134 | 112,578 | ||||||
|
Total Current Assets
|
2,750,660 | 1,645,027 | ||||||
|
Fixed Assets:
|
||||||||
|
Mining Camp Equipment and Fixtures (Net of Accumulated Depreciation of $705,511 and $617,645)
|
967,319 | 362,882 | ||||||
|
Mining Properties (Net of Accumulated Amortization of $484,842 and $440,686)
|
4,218,525 | 4,262,681 | ||||||
|
Total Fixed Assets
|
5,185,844 | 4,625,563 | ||||||
|
Other Assets:
|
||||||||
|
Investment in Affiliate
|
70,000 | 70,000 | ||||||
|
Other Assets
|
178,178 | 162,728 | ||||||
|
Total Other Assets
|
248,178 | 232,728 | ||||||
|
TOTAL ASSETS
|
$ | 8,184,682 | $ | 6,503,318 | ||||
|
LIABILITIES AND EQUITY
|
||||||||
|
Current Liabilities:
|
||||||||
|
Accounts Payable
|
$ | 73,266 | $ | 32,225 | ||||
|
Accrued Expenses
|
52,029 | 64,772 | ||||||
|
Total Current Liabilities
|
125,295 | 96,997 | ||||||
| Long-Term Liabilities | 0 | 0 | ||||||
|
TOTAL LIABILITIES
|
$ | 125,295 | $ | 96,997 | ||||
|
Equity:
|
||||||||
| Preferred Stock, $1.00 par value, 10,000 shares authorized | ||||||||
|
1,000 and 1,000 shares issued and outstanding
|
$ | 1,000 | $ | 1,000 | ||||
|
Common Stock, $0.01 par value, 25,000,000 and 12,500,000 shares authorized
|
||||||||
|
10,602,868 and 9,763,220 shares issued and outstanding
|
106,029 | 97,632 | ||||||
|
Preferred Rights
|
40,000 | 40,000 | ||||||
|
Additional Paid In Capital
|
38,421,114 | 31,011,472 | ||||||
|
Other Comprehensive Income
|
575,600 | 405,948 | ||||||
|
Accumulated Deficit
|
(6,002,516 | ) | (6,002,516 | ) | ||||
|
Accumulated Deficit Since Reentering the Development Stage
|
(21,493,034 | ) | (17,223,915 | ) | ||||
|
Total DynaResource, Inc. Stockholders’ Equity
|
11,648,193 | 8,329,621 | ||||||
|
Noncontrolling Interest
|
(3,588,806 | ) | (1,923,300 | ) | ||||
|
TOTAL EQUITY
|
8,059,387 | 6,406,321 | ||||||
|
TOTAL LIABILITIES AND EQUITY
|
$ | 8,184,682 | $ | 6,503,318 | ||||
The accompanying notes are an integral part of these financial statements.
34
DYNARESOURCE, INC.
(An Exploration Stage Company)
Consolidated Statements of Operations
For the Years Ended December 31, 2011 and 2010
And Cumulative Since Re-entering the Development Stage (January 1, 2007)
through December 31, 2011
|
2011
|
2010
|
Cumulative Since
Reentering the Exploration Stage
(January 1, 2007 through December 31, 2011)
|
||||||||||
|
REVENUES
|
$ | 0 | $ | 305,652 | $ | 346,726 | ||||||
|
EXPLORATION EXPENSES (exclusive of depreciation and amortization shown separately below)
|
2,654,227 | 3,620,617 | 14,441,116 | |||||||||
|
GROSS PROFIT (DEFICIT)
|
(2,654,227 | ) | (3,314,965 | ) | (14,094,390 | ) | ||||||
|
OPERATING EXPENSES
|
||||||||||||
|
Depreciation and Amortization
|
132,022 | 142,951 | 723,941 | |||||||||
| Stock Issued for Services | 1,161,189 | 901,437 | 2,748,564 | |||||||||
|
General and Administrative
|
1,640,583 | 1,241,009 | 6,299,304 | |||||||||
|
TOTAL OPERATING EXPENSES
|
2,933,794 | 2,285,397 | 9,771,809 | |||||||||
|
NET OPERATING INCOME (LOSS)
|
(5,588,021 | ) | (5,600,362 | ) | (23,866,199 | ) | ||||||
|
OTHER INCOME (EXPENSE)
|
||||||||||||
|
Portfolio Income
|
1,123 | 2,655 | 21,363 | |||||||||
|
Currency Translation Gain (Loss)
|
(307,004 | ) | 419,840 | (1,467,739 | ) | |||||||
|
Other Income
|
0 | 883 | 2,987 | |||||||||
|
TOTAL OTHER INCOME (EXPENSE)
|
(305,881 | ) | 423,378 | (1,443,389 | ) | |||||||
|
NET INCOME (LOSS) BEFORE INCOME TAXES
|
(5,893,902 | ) | (5,176,984 | ) | (25,309,588 | ) | ||||||
|
Provision for Income Taxes (Expense) Benefit
|
0 | 0 | 38,259 | |||||||||
|
NET INCOME (LOSS)
|
$ | (5,893,902 | ) | $ | (5,176,984 | ) | $ | (25,271,329 | ) | |||
|
Net Loss Attributable to Non-Controlling Interest
|
1,624,783 | 804,511 | 3,548,083 | |||||||||
|
NET LOSS ATTRIBUTABLE TO DYNARESOURCE, INC. COMMON SHAREHOLDERS
|
(4,269,119 | ) | (4,372,473 | ) | (21,723,246 | ) | ||||||
|
Unrealized Loss on Securities Held for Sale
|
0 | (735,760 | ) | (735,760 | ) | |||||||
|
Unrealized Currency Translation Gain (Loss)
|
(96,190 | ) | (334,874 | ) | 971,473 | |||||||
|
TOTAL COMPREHENSIVE INCOME (LOSS)
|
(4,365,309 | ) | (5,443,107 | ) | (21,487,533 | ) | ||||||
|
Comprehensive (Income) Loss Attributable To Non-Controlling Interest
|
40,723 | 74,075 | 71,948 | |||||||||
|
COMPREHENSIVE LOSS ATTRIBUTABLE TO
|
||||||||||||
|
DYNARESOURCE, INC. COMMON SHAREHOLDERS
|
$ | (4,324,586 | ) | $ | (5,369,032 | ) | $ | (21,415,585 | ) | |||
|
EARNINGS PER SHARE, Basic and Diluted
|
||||||||||||
|
Weighted Average Shares Outstanding Basic and Diluted
|
10,052,749 | 9,513,930 | ||||||||||
|
Income (Loss) per Common Share, Basic and Diluted
|
$ | (0.4247 | ) | $ | (0.4596 | ) | ||||||
The accompanying notes are an integral part of these financial statements.
35
DYNARESOURCE, INC.
(An Exploration Stage Company)
Consolidated Statement of Changes in Stockholders’ Equity
For the Years Ended December 31, 2011 and 2010
|
Preferred
|
Common
|
Preferred
|
Additional
Paid In
|
Treasury
|
Other
Comprehensive
|
Accumulated
|
Deficit Since
Reentering
the Exploration
|
|||||||||||||||||||||||||||||||||||||
|
Shares
|
Amount
|
Shares
|
Amount
|
Rights
|
Capital
|
Stock
|
Income
|
Deficit
|
Stage
|
Totals
|
||||||||||||||||||||||||||||||||||
|
Stockholders’ Equity, January 1, 2010
|
1,000 | $ | 1,000 | 9,374,303 | $ | 93,743 | $ | 40,000 | $ | 25,475,425 | $ | (2,385 | ) | $ | 1,405,537 | $ | (6,002,516 | ) | $ | (12,851,441 | ) | $ | 8,159,363 | |||||||||||||||||||||
|
Sale of Common Shares
|
124,244 | 1,242 | 433,460 | 434,702 | ||||||||||||||||||||||||||||||||||||||||
|
Issuance of Common Shares for Services
|
264,673 | 2,647 | 898,790 | 901,437 | ||||||||||||||||||||||||||||||||||||||||
|
Treasury Stock Purchased
|
(141,689 | ) | (141,689 | ) | ||||||||||||||||||||||||||||||||||||||||
|
Treasury Stock Sold
|
71,787 | 144,074 | 215,861 | |||||||||||||||||||||||||||||||||||||||||
|
Other Comprehensive Income
|
(999,589 | ) | (999,589 | ) | ||||||||||||||||||||||||||||||||||||||||
|
DynaMexico Earn In
|
4,132,010 | 4,132,010 | ||||||||||||||||||||||||||||||||||||||||||
|
Net Income (Loss)
|
(4,372,474 | ) | (4,372,474 | ) | ||||||||||||||||||||||||||||||||||||||||
|
Stockholders’ Equity, December 31, 2010
|
1,000 | $ | 1,000 | 9,763,220 | $ | 97,632 | $ | 40,000 | $ | 31,011,472 | $ | 0 | $ | 405,948 | $ | (6,002,516 | ) | $ | (17,223,915 | ) | $ | 8,329,621 | ||||||||||||||||||||||
|
Sale of Common Shares
|
565,148 | 5,652 | 2,220,005 | 2,225,657 | ||||||||||||||||||||||||||||||||||||||||
|
Issuance of Common Shares for Services
|
274,500 | 2,745 | 1,158,444 | 1,161,189 | ||||||||||||||||||||||||||||||||||||||||
|
Common Stock Options Issued
|
31,476 | 31,476 | ||||||||||||||||||||||||||||||||||||||||||
|
Other Comprehensive Income
|
169,652 | 169,652 | ||||||||||||||||||||||||||||||||||||||||||
|
DynaMexico Earn In
|
3,999,717 | 3,999,717 | ||||||||||||||||||||||||||||||||||||||||||
|
Net Income (Loss)
|
(4,269,119 | ) | (4,269,119 | ) | ||||||||||||||||||||||||||||||||||||||||
|
Stockholders’ Equity, December 31, 2011
|
1,000 | $ | 1,000 | 10,602,868 | $ | 106,029 | $ | 40,000 | $ | 38,421,114 | $ | 0 | $ | 575,600 | $ | (6,002,516 | ) | $ | (21,493,034 | ) | $ | 11,648,193 | ||||||||||||||||||||||
The accompanying notes are an integral part of these financial statements.
36
DYNARESOURCE, INC.
(An Exploration Stage Company)
Consolidated Statements of Cash Flows
For the Years Ended December 31, 2011 and 2010
And Cumulative Since Re-entering the Development Stage (January 1, 2007)
through December 31, 2011
|
2011
|
2010
|
Cumulative Since
Reentering the Development Stage
(January 1, 2007) through December 31, 2011
|
||||||||||
|
CASH FLOWS FROM OPERATING ACTIVITIES
|
||||||||||||
|
Net Income (Loss)
|
$ | (5,893,902 | ) | $ | (5,176,984 | ) | $ | (25,271,329 | ) | |||
|
Adjustments to reconcile net loss to cash used by operating activities:
|
||||||||||||
|
Issuance of Common Stock for Services
|
1,161,189 | 901,437 | 2,748,564 | |||||||||
|
Issuance of Common Stock Options
|
31,476 | 0 | 31,476 | |||||||||
|
Issuance of Preferred Stock for Services
|
0 | 0 | 1,000 | |||||||||
|
Depreciation and Amortization
|
132,022 | 142,951 | 723,941 | |||||||||
|
Loss on Disposition of Assets
|
0 | 0 | 28,006 | |||||||||
|
Change in Operating Assets and Liabilities:
|
||||||||||||
|
Decrease in Accounts Receivable
|
0 | 0 | 199,143 | |||||||||
|
(Increase) Decrease in Foreign Tax Receivable
|
220,791 | (135,174 | ) | 14,612 | ||||||||
|
(Increase) Decrease in Accounts Receivable – Related Party
|
0 | 50,760 | 0 | |||||||||
|
(Increase) in Other Current Assets
|
67,443 | (52,380 | ) | 121,059 | ||||||||
|
(Increase) Decrease in Other Assets
|
(15,449 | ) | 878 | (178,178 | ) | |||||||
|
(Decrease) in Accounts Payable
|
41,041 | (8,361 | ) | 31,862 | ||||||||
|
Increase (Decrease) Increase in Accrued Expenses
|
(12,743 | ) | 21,455 | (52,107 | ) | |||||||
|
(Decrease) in Deferred Tax Liability
|
0 | 0 | (38,259 | ) | ||||||||
|
CASH FLOWS (USED IN) OPERATING ACTIVITIES
|
(4,268,132 | ) | (4,255,418 | ) | (21,640,210 | ) | ||||||
|
CASH FLOWS FROM INVESTING ACTIVITIES
|
||||||||||||
|
Purchase of Fixed Assets
|
(692,303 | ) | (115,299 | ) | (1,089,096 | ) | ||||||
|
Retirement of Fixed Assets
|
0 | 10,024 | 20,148 | |||||||||
|
Conversion of Note Receivable to Equity
|
0 | 750,000 | 750,000 | |||||||||
|
Investment in Affiliate
|
0 | (70,000 | ) | (70,000 | ) | |||||||
|
Note Receivable to Affiliate
|
0 | (250,000 | ) | (750,000 | ) | |||||||
|
CASH FLOWS PROVIDED BY (USED IN) INVESTING ACTIVITIES
|
(692,303 | ) | 324,725 | (1,138,948 | ) | |||||||
|
CASH FLOWS FROM FINANCING ACTIVITIES
|
||||||||||||
|
Proceeds from DynaMexico Earn In
|
3,999,717 | 4,132,010 | 17,674,712 | |||||||||
|
Proceeds from Sale of Common Stock
|
2,225,657 | 434,702 | 6,322,951 | |||||||||
|
Repurchase of Common Stock Options
|
0 | 0 | (10,000 | ) | ||||||||
|
Other Comprehensive Income (Loss)
|
128,929 | (1,073,634 | ) | 541,692 | ||||||||
|
Purchase of Treasury Stock
|
0 | (141,689 | ) | (372,479 | ) | |||||||
|
Sale of Treasury Stock
|
0 | 215,861 | 472,375 | |||||||||
|
CASH FLOWS PROVIDED BY FINANCING ACTIVITIES
|
6,354,303 | 3,567,250 | 24,629,251 | |||||||||
|
NET INCREASE (DECREASE) IN CASH
|
1,393,868 | (363,443 | ) | 1,850,093 | ||||||||
|
CASH AT BEGINNING OF PERIOD
|
1,277,065 | 1,640,508 | 820,840 | |||||||||
|
CASH AT END OF PERIOD
|
$ | 2,670,933 | $ | 1,277,065 | $ | 2,670,933 | ||||||
|
SUPPLEMENTAL DISCLOSURES
|
||||||||||||
|
Non-Cash Issuance of Common Shares for Services
|
$ | 1,161,189 | $ | 901,437 | $ | 2,748,564 | ||||||
|
Non-Cash Issuance of Preferred Shares for Services
|
$ | 0 | $ | 0 | $ | 1,000 | ||||||
|
Non-Cash Conversion of Note Receivable to Equity
|
$ | 0 | $ | 750,000 | $ | 750,000 | ||||||
|
Cash Paid During the Year for Interest Expense
|
$ | 0 | $ | 0 | $ | 0 | ||||||
|
Non-Cash Dividend of Property
|
$ | 0 | $ | 0 | $ | 129,822 | ||||||
The accompanying notes are an integral part of these financial statements.
37
DYNARESOURCE, INC.
(An Exploration Stage Company)
Notes to the Consolidated Financial Statements
December 31, 2011 and 2010
NOTE 1 – NATURE OF ACTIVITIES AND SIGNIFICANT ACCOUNTING POLICIES
Nature of Activities, History and Organization:
DynaResource, Inc. (The “Company” or “DynaResource”) was organized September 28, 1937, as a California corporation under the name of West Coast Mines, Inc. In 1998, the Company re-domiciled to Delaware and changed its name to DynaResource, Inc. The Company is in the business of acquiring, investing in, and developing precious metal properties, and the production of precious metals.
In 2000, the Company formed a wholly owned subsidiary, DynaResource de Mexico S.A. de C.V. chartered in Mexico (“DynaMexico”). This Company was formed to acquire, invest in and develop resource properties in Mexico. In 2005, the Company formed DynaResource Operaciones de San Jose De Gracia S.A. de C.V. (“DynaOperaciones”), and acquired effective control of Mineras de DynaResource, S.A de C.V. (formerly Minera Finesterre S.A. De C.V.), (“MinerasDyna”). The Company owned 25% of MinerasDyna and acquired effective control of MinerasDyna by acquiring the option to purchase the remaining 75% of the Shares of MinerasDyna. The Company finalized the option and acquisition of MinerasDyna in January 2010, and now owns 100% of MinerasDyna. The results of MinerasDyna are consolidated with those of the Company.
In January 2008, the Company transferred 15% of the ownership of DynaMexico to Goldgroup Resources Inc. (“Goldgroup”), in exchange for $3,000,000 USD cash contribution for exploration expenditures at the San Jose de Gracia property (“SJG”), and in August 2008, the Company transferred an additional 10% of the ownership of DynaMexico to Goldgroup in exchange for an additional $3,000,000 USD cash for exploration expenditures, and in March 2011, the Company transferred an additional 25% of the ownership of DynaMexico to Goldgroup in exchange for an additional $12,000,000 USD cash for exploration expenditures (See Note 6 below). Through December 31, 2011, Goldgroup has contributed $18,000,000 USD to DynaMexico, and it currently owns 50% of DynaMexico.
The Company produced approximately $7,637,150 in revenues from production activities conducted during the years ended December 31, 2003 through 2006, and suspended this activity voluntarily to concentrate its efforts on exploration and development. In accordance with that decision, as of January 1, 2007, the Company reentered the Exploration Stage and has presented its cumulative results since reentering the Exploration Stage, in accordance with Accounting Standards Codification (“ASC”) 915 “Development Stage Entities” (formerly Statement of Financial Accounting Standard (“SFAS”) No. 7, “Accounting and Reporting by Development Stage Enterprises” (“SFAS No. 7”)), and will continue this presentation until it again has revenues from operations.
The Company chose to become a voluntary reporting issuer in Canada in order to avail itself of Canadian regulations regarding reporting for mining properties, more specifically, National Instrument 43-101 (NI 43-101). This regulation sets forth standards for reporting resources in a mineral property and is a standard recognized in the mining industry.
Significant Accounting Policies:
The Company’s management selects accounting principles generally accepted in the United States of America and adopts methods for their application. The application of accounting principles requires the estimating, matching and timing of revenue and expense. The accounting policies used conform to generally accepted accounting principles which have been consistently applied in the preparation of these financial statements.
The financial statements and notes are representations of the Company’s management which is responsible for their integrity and objectivity. Management further acknowledges that it is solely responsible for adopting sound accounting practices, establishing and maintaining a system of internal accounting control and preventing and detecting fraud. The Company's system of internal accounting control is designed to assure, among other items, that 1) recorded transactions are valid; 2) valid transactions are recorded; and 3) transactions are recorded in the proper period in a timely manner to produce financial statements which present fairly the financial condition, results of operations and cash flows of the Company for the respective periods being presented.
38
Basis of Presentation:
The Company prepares its financial statements on the accrual basis of accounting in conformity with accounting principles generally accepted in the United States.
Principles of Consolidation:
The financial statements include the accounts of DynaResource, Inc. as well as DynaResource de Mexico, S.A. de C.V., DynaResource Operaciones S.A. de C.V. and Mineras de DynaResource S.A. de C.V. All significant inter-company transactions have been eliminated. All amounts are presented in U.S. Dollars unless otherwise stated.
Foreign Currency Translation:
The functional currency for the subsidiaries of the Company is the Mexican peso. As a result, the financial statements of the subsidiary have been re-measured from Mexican pesos into U.S. dollars using (i) current exchange rates for monetary asset and liability accounts, (ii) historical exchange rates for nonmonetary asset and liability accounts, (iii) historical exchange rates for revenues and expenses associated with nonmonetary assets and liabilities and (iv) the weighted average exchange rate of the reporting period for all other revenues and expenses. In addition, foreign currency transaction gains and losses resulting from U.S. dollar denominated transactions are eliminated. The resulting re-measured gain or loss is reported as a separate component of stockholders’ equity (comprehensive income (loss)).
The financial statements of the subsidiary should not be construed as representations that Mexican pesos have been, could have been or may in the future be converted into U.S. dollars at such rates or any other rates.
Relevant exchange rates used in the preparation of the financial statements for the subsidiary are as follows for the years ended December 31, 2011 and 2010 (Mexican pesos per one U.S. dollar):
|
December 31, 2011
|
||||||||
|
Current exchange rate:
|
Pesos
|
13.97 | ||||||
|
Weighted average exchange rate for the year ended:
|
Pesos
|
12.42 | ||||||
|
December 31, 2010
|
||||||||
|
Current exchange rate:
|
Pesos
|
12.39 | ||||||
|
Weighted average exchange rate for the year ended:
|
Pesos
|
12.65 | ||||||
Cash and Cash Equivalents:
The Company considers all highly liquid debt instruments with a maturity of three months or less to be cash equivalents. At times, cash balances may be in excess of the Federal Deposit Insurance Corporation (“FDIC”) insurance limits. At December 31, 2011, the Company had a balance of $216,446 that was in excess of the FDIC insurance limit and $1,042,286 which is currently insured in full under the FDIC’s temporary unlimited coverage on non-interest bearing transactions accounts, which expires on December 31, 2012. The carrying amount approximates fair market value.
39
Accounts Receivable and Allowances for Doubtful Accounts:
The allowance for accounts receivable is recorded when receivables are considered to be doubtful of collection. No allowance has been established as all receivables were deemed to be fully collectable.
Foreign Tax Receivable:
Foreign Tax Receivable (IVA) is comprised of recoverable value-added taxes charged by the Mexican government on goods and services rendered. Under certain circumstances, these taxes are recoverable by filing a tax return. Amounts paid for IVA are tracked and held as receivables until the funds are remitted. The total amount of the IVA receivable as of December 31, 2011 and 2010 are $34,593 and $255,384, respectively.
Inventory:
As the Company ceased mining production in 2006, there is no inventory as of December 31, 2011 and 2010.
Fixed Assets:
Fixed assets are carried at cost. Depreciation is provided over each asset’s estimated useful life. Upon retirement and disposal, the asset cost and related accumulated depreciation are removed from the accounts and any resulting gain or loss is included in the determination of the net income. Expenditures for geological and engineering studies, maintenance and claim renewals are charged to expense when incurred. Additions and significant improvements are capitalized and depreciated.
Mining Properties:
The Company is an ‘Exploration Stage’ company as defined in “SEC Industry Guide 7”. Mining properties consist of 33 mining concessions covering approximately 69,121 hectares, at the San Jose de Gracia property, the basis of which are deferred until the properties are brought into production, at which time they will be amortized on the unit of production method based on estimated recoverable reserves. The Company has elected to expense a minimal amount of amortization due to the effects of exploration activities on the recoverable reserves. If it is determined that the deferred costs related to a property are not recoverable over its productive life, those costs will be written down to fair value as a charge to operations in the period in which the determination is made. The amounts at which mineral properties and the related deferred costs are recorded do not necessarily reflect present or future values.
The recoverability of the book value of each property will be assessed annually for indicators of impairment such as adverse changes to any of the following:
|
·
|
estimated recoverable ounces of gold, silver or other precious minerals;
|
|
·
|
estimated future commodity prices;
|
|
·
|
Estimated expected future operating costs, capital expenditures and reclamation expenditures.
|
A write-down to fair value will be recorded when the expected future cash flow is less than the net book value of the property or when events or changes in the property indicate that carrying amounts are not recoverable. This analysis will be completed as needed, and at least annually. As of the date of this filing, no events have occurred that would require write-down of any assets. As of December 31, 2011, no indications of impairment existed.
40
Exploration Costs:
Exploration costs not directly associated with proven reserves on the mining concessions are charged to operations as incurred. Exploration, development, direct field costs and administrative costs are expensed in the period incurred.
The carrying amounts of the mining concessions are reviewed at each calendar year end to determine whether there is any indication of impairment.
As of December 31, 2011, no indications of impairment existed.
Advertising Costs:
The Company incurred no advertising costs for the years ended December 31, 2011 and 2010.
Income Taxes:
Income from the corporation is taxed at regular corporate rates per the Internal Revenue Code. Although the Company has tax loss carry-forwards (see Note 5), there is uncertainty as to utilization prior to their expiration. Accordingly, the future income tax asset amounts have been fully offset by a valuation allowance.
Use of Estimates:
In order to prepare financial statement in conformity with accounting principles generally accepted in the United States, management must make estimates, judgments and assumptions that affect the amounts reported in the financial statements and determines whether contingent assets and liabilities, if any, are disclosed in the financial statements. The ultimate resolution of issues requiring these estimates and assumptions could differ significantly from resolution currently anticipated by management and on which the financial statements are based.
Comprehensive Income:
ASC 220 “Comprehensive Income”, (formerly SFAS No. 130 “Reporting Comprehensive Income”), establishes standards for reporting and display of comprehensive income and its components in a full set of general purpose financial statements. The Company’s comprehensive income consists of net income and other comprehensive income (loss), consisting of unrealized net gains and losses on the translation of the assets and liabilities of its foreign operations. For the years ended December 31, 2011 and 2010, the Company’s components of comprehensive income were foreign currency translation adjustments and unrealized losses on securities held for sale.
Revenue Recognition:
The Company recognizes revenue in accordance with ASC 605-10, "Revenue Recognition in Financial Statements", (formerly Staff Accounting Bulletin No. 104 (“SAB 104”). Revenue is recognized when persuasive evidence of an arrangement exists, delivery or service has occurred, the sale price is fixed or determinable and receipt of payment is probable.
Revenues earned from the sale of precious metal concentrates are recognized as the title to the material is passed to the buyer upon delivery.
41
Earnings per Common Share:
Earnings (loss) per share are calculated in accordance with ASC 260 “Earnings per Share”. The weighted average number of common shares outstanding during each period is used to compute basic earnings (loss) per share. Diluted earnings per share are computed using the weighted average number of shares and potentially dilutive common shares outstanding. Dilutive potential common shares are additional common shares assumed to be exercised. Potentially dilutive common shares consist of stock options and are excluded from the diluted earnings per share computation in periods where the Company has incurred a net loss, as their effect would be considered anti-dilutive.
There were no potentially dilutive common stock equivalents as of December 31, 2011, therefore basic earnings per share equals diluted earnings per share for the year ended December 31, 2011. The Company had 25,000 options outstanding at December 31, 2011. As the Company incurred a net loss during the year ended December 31, 2011, the basic and diluted loss per common share is the same amount, as any common stock equivalents would be considered anti-dilutive.
As the Company incurred a net loss during the year ended December 31, 2010, the basic and diluted loss per common share is the same amount. As of December 31, 2010, the Company had zero stock options outstanding that could potentially have a dilutive effect on basic earnings per share in the future.
Recently Issued Accounting Pronouncements:
The Company does not expect the adoption of recently issued accounting pronouncements to have a significant impact on the Company’s results of operations, financial position or cash flow. See Note 12 for a discussion of new accounting pronouncements.
Reclassifications
Certain prior year balances have been reclassified to conform to current year presentation.
NOTE 2 – FIXED ASSETS
Fixed assets consist of the following at December 31, 2011 and 2010:
|
2011
|
2010
|
|||||||
|
Mining camp equipment and fixtures
|
$
|
1,224,540
|
$
|
546,636
|
||||
|
Transportation equipment
|
268,253
|
268,253
|
||||||
|
Lab equipment
|
14,306
|
14,306
|
||||||
|
Machinery and equipment
|
43,187
|
30,514
|
||||||
|
Office furniture and fixtures
|
76,895
|
76,895
|
||||||
|
Office equipment
|
11,673
|
11,673
|
||||||
|
Computer equipment
|
33,976
|
32,250
|
||||||
|
Sub-total
|
1,672,830
|
980,527
|
||||||
|
Less: Accumulated depreciation
|
(705,511
|
)
|
(617,645
|
)
|
||||
|
Total
|
$
|
967,319
|
$
|
362,882
|
||||
42
Depreciation has been provided over each asset’s estimated useful life. Depreciation expense was $87,866 and $93,218 for the years ended December 31, 2011 and 2010, respectively. The Company acquired a tractor during 2011 that was not in service as of December 31, 2011, and therefore, has not yet been depreciated.
NOTE 3 – MINING PROPERTIES
Mining properties consist of the following at December 31, 2011 and 2010:
|
2011
|
2010
|
|||||||
|
San Jose de Gracia (“SJG”):
|
||||||||
|
Mining Concessions
|
$
|
4,703,367
|
$
|
4,703,367
|
||||
|
Less: Accumulated Amortization
|
(484,842
|
)
|
(440,686
|
)
|
||||
|
Total Mining Properties
|
$
|
4,218,525
|
$
|
4,262,681
|
||||
Amortization expense was $44,156 and $49,733 for the years ended December 31, 2011 and 2010, respectively.
NOTE 4 – INVESTMENT IN AFFILIATE
Through December 31, 2011 the Company loaned a total of $805,760 USD to DynaResource Nevada, Inc. (“DynaNevada”), a Nevada Corporation, with one operating subsidiary in Mexico, DynaNevada de Mexico, SA de CV., (“DynaNevada de Mexico”). The terms of the Note Receivable provided for a “Convertible Loan”, repayable at 5% interest over a 3 year period, and convertible at the Company’s option into common stock of DynaNevada at $.25 / Share. DynaNevada is a related entity (affiliate), and through its subsidiary DynaNevada de Mexico, has entered into an Option agreement with Grupo Mexico (IMMSA) in Mexico, for the exploration and development of approximately 3,000 hectares in the State of San Luis Potosi (“The Santa Gertrudis Property”). DynaNevada de Mexico completed the Option with IMMSA in March 2010, so that DynaNevada de Mexico now owns 100% of the Santa Gertrudis Property. In June, 2010, DynaNevada de Mexico acquired an additional 6,000 hectares in the State of Sinaloa (the “San Juan Property”).
On December 31, 2010, the Company exercised its option to convert the note receivable and other receivable from DynaNevada into shares of common stock at a rate of $.25 per share. The Company received 3,223,040 shares, which represents approximately 19.95% of the outstanding shares of DynaNevada. At the time of the exchange, DynaNevada’s net book value was approximately $695,000, consisting of $30,000 cash and the remainder unproven mining properties. DynaNevada has a contingent liability arising from the purchase of one of the mining properties, which Management believes has no merit. Based upon the above, Management estimated the value of the Company’s DynaNevada shares as of December 31, 2011 and 2010 to be $70,000. Management believes the impairment is temporary, and therefore an unrealized loss of $735,760 has been recorded in other comprehensive income.
NOTE 5 – INCOME TAXES
The Company has adopted ASC 740-10, “Income Taxes”, which requires the use of the liability method in the computation of income tax expense and the current and deferred income taxes payable (deferred tax liability) or benefit (deferred tax asset). Valuation allowances are established when necessary to reduce deferred tax assets to the amount expected to be realized.
43
The cumulative tax effect at the expected tax rate of 34% (blended for U.S. and Mexico) of significant items comprising the Company’s net deferred tax amounts as of December 31, 2011 and 2010 are as follows:
Deferred Tax Asset Related to:
|
2011
|
2010
|
|||||||
|
Prior Year
|
$
|
5,004,276
|
$ |
3,244,101
|
||||
|
Tax Benefit for Current Year
|
2,003,927
|
1,760,175
|
||||||
|
Total Deferred Tax Asset
|
7,008,203
|
5,004,276
|
||||||
|
Less: Valuation Allowance
|
(7,008,203
|
)
|
(5,004,276
|
)
|
||||
|
Net Deferred Tax Asset
|
$
|
0
|
$
|
0
|
||||
The net deferred tax asset and benefit for the current year is generated primarily from the cumulative net operating loss carry-forward which is approximately $28,000,000 at December 31, 2011, and will expire in the years 2025 through 2030.
The realization of deferred tax benefits is contingent upon future earnings and is fully reserved at December 31, 2011.
NOTE 6 – MATERIAL AGREEMENTS
Financing/Sale of Stock of Subsidiary:
On September 1, 2006 the Company signed a “Stock Purchase and Earn In Agreement” (“Earn In”) between DynaResource and DynaMexico, (“Seller”) and Goldgroup Mining, Inc. (formerly Goldgroup Resources, Inc.), of Vancouver, British Columbia (“Goldgroup”), (“Buyer”), and Together, (“the Parties”).
The Earn In provided for Goldgroup to contribute $18,000,000 on or before March 15, 2011 in exchange for fifty per cent (50%) of the total outstanding shares of DynaMexico, the owner of the San Jose de Gracia District in northern Sinaloa Mexico (“SJG”). The remaining balance of the $18,000,000 to be contributed was completed on March 14, 2011 and Goldgroup now owns 50% of the outstanding shares of DynaMexico.
NOTE 7 – RELATED PARTY TRANSACTIONS
The Company paid $107,500 and $57,203 to Dynacap Group, Ltd. (an entity controlled by officers of the Company) for consulting and other fees in 2011 and 2010, respectively.
In addition, the Company has issued its stock to the following directors and consultants for the years ended December 31, 2011 and 2010, respectively:
|
2011
|
2010
|
|||||||
|
Directors
|
$
|
85,500
|
$
|
46,875
|
||||
|
Consultants
|
$
|
1,075,689
|
$
|
854,562
|
||||
|
Totals
|
$
|
1,161,189
|
$
|
901,437
|
||||
44
The above stock transactions were expensed as compensation in the financial statements.
During the year ended December 31, 2010, the Company’s revenue was earned from exploration services performed for a related party.
On December 31, 2010, the Company converted the Note Receivable from DynaNevada, into shares of common stock, as discussed in Note 4.
NOTE 8 – STOCKHOLDERS’ EQUITY
Preferred Stock:
The Company is authorized to issue 10,000 shares of its Series A Preferred Stock, having a par value of $1.00 per share. Holders of the Series A Preferred Stock have the right to elect a majority of the Board of Directors of the Company. In October 2007, the Company issued 1,000 shares of Series A Preferred Stock to its CEO. An aggregate of 1,000 shares of Series A Preferred Stock were outstanding at December 31, 2011 and 2010, respectively.
Common Stock:
The Company is authorized to issue 25,000,000 common shares at a par value of $0.01 per share. These shares have full voting rights. At December 31, 2011 and 2010, there were 10,602,868 and 9,763,220 shares outstanding, respectively. No dividends were paid in 2011 or 2010.
Preferred Rights:
The Company issued “Preferred Rights” and received $158,500 in 2003 and $626,000 in 2002, for the rights to percentages of revenues generated from the San Jose de Gracia Pilot Production Plant. This has been reflected as “Preferred Rights” in stockholders’ equity. As of December 31, 2004, $558,312 was repaid and as of December 31, 2005, an additional $186,188 has been repaid, leaving a current balance of $40,000 and $40,000 as of December 31, 2011 and 2010, respectively.
Stock Issuances:
During 2011, the Company issued 565,148 common shares for cash for $3.75 to $5.00 per share.
During 2011, the Company also issued 274,500 shares for $1,161,189 of consulting services. Included in this amount was 20,000 shares issued to directors for $85,500 in services.
During 2010, the Company issued 124,244 common shares for cash for $3.50 per share.
During 2010, the Company also issued 252,173 shares for $854,562 of consulting services. The Company also issued 12,500 shares to directors for $46,875 in services.
45
Treasury Stock:
During 2010, the Company repurchased 60,085 shares for $141,689 and resold 60,085 shares for $215,861.
Treasury stock is accounted for by the cost method.
Options and Warrants:
The Company had 25,000 options or warrants outstanding at December 31, 2011.
During 2011, 25,000 options were issued, none were exercised and none expired. The Company recorded expense related to the issuance of these options in accordance with the Black Scholes option pricing model.
During 2010, the Company had no options or warrants outstanding.
NOTE 9 – EMPLOYEE BENEFIT PLANS
During the years ended December 31, 2011 and 2010, there were no qualified or non-qualified employee pension, profit sharing, stock option, or other plans authorized for any class of employees.
NOTE 10 – COMMITMENTS AND CONTINGENGIES
The Company is required to pay taxes in order to maintain their concessions. Additionally, the Company is required to incur a minimum amount of expenditures each year for all concessions held. The minimum expenditures are calculated based upon the land area, as well as the age of the concessions. Amounts spent in excess of the minimum may be carried forward indefinitely over the life of the concessions, and are adjusted annually for inflation. Based on Management’s business plans, they do not anticipate any issues in meeting the minimum annual expenditures for the concessions, and the Company retains sufficient carry forward amounts to cover over 20 years of the minimum expenditure (as calculated at the 2010 minimum, adjusted for annual inflation of 4%).
In September 2008, the Company entered into a 37 month lease agreement for its corporate office. In August, 2011 the Company entered into a one year extension of the lease through August 31, 2011. In The Company paid rent expense of $52,395 and $46,230 related to this lease for the years ended December 31, 2011 and 2010.
The following is a schedule of minimum lease payments required under the existing lease as of December 31, 2011:
|
Year Ended December 31:
|
Amount
|
|||
|
2012
|
$ | 30,720 | ||
|
2013 and beyond
|
0 | |||
| $ | 30,720 | |||
46
NOTE 11 – NON-CONTROLLING INTEREST
The Company’s Non-controlling Interest recorded in the consolidated financial statements relates to a 50% interest in DynaResource de México, S.A. de C.V. Changes in Non-controlling Interest for the year ended December 31, 2011 and 2010 were as follows:
|
|
For the Year
Ended December 31,
|
|||||||
|
|
2011
|
2010
|
||||||
|
Beginning balance
|
|
$
|
(1,923,300)
|
$
|
(1,044,744)
|
|||
|
Operating income (loss)
|
|
(1,624,783)
|
(804,511)
|
|||||
|
Other comprehensive income (loss)
|
|
(40,723)
|
(74,045)
|
|||||
|
Ending balance
|
|
$
|
(3,588,806)
|
$
|
(1,923,300)
|
|||
The Company began allocating a portion of other comprehensive income (loss) to the non-controlling interest with the adoption of FASB 160 as of January 1, 2009.
NOTE 12 – RECENT ACCOUNTING PRONOUCEMENTS
In June 2011, the FASB issued Accounting Standards Update (“ASU”) No. 2011-05, “Comprehensive Income – Presentation of Comprehensive Income.” ASU No. 2011-05 eliminated the option to present the components of other comprehensive income as part of the statement of stockholders’ equity. It requires an entity to present the total of comprehensive income, the components of net income, and the components of other comprehensive income either in a single continuous statement of comprehensive income or in two separate but consecutive statements. In December, 2011, the FASB issued ASU 2011-12, “Comprehensive Income – Deferral of the Effective Date for Amendments to the Presentation of Reclassifications of Items Out of Accumulated Other Comprehensive Income in ASU 2011-05” to defer the effective date of the specific requirement to present items that are reclassified out of accumulated other comprehensive income to net income alongside their respective components of net income and other comprehensive income. All other provisions of this update, which are to be applied retrospectively, are effective for fiscal years, and interim periods within those years, beginning December 15, 2011, The Company is currently evaluating the impact that the adoption will have on their consolidated financial statements.
In December 2011, the FASB issued ASU No. 2011-11, “Balance Sheet – Disclosures about Offsetting Assets and Liabilities.” ASU 2011-11 requires entities to disclose information about offsetting and related arrangements of financial instruments and derivative instruments and will be applied retrospectively for all comparative periods presented. ASU 2011-11 is effective for annual reporting periods beginning on or after January 1, 2013, and interim periods within those annual periods. The Company is currently evaluating the impact that the adoption will have on their consolidated financial statements.
|
NOTE 13 – FAIR VALUE OF FINANCIAL INSTRUMENTS
|
In September 2006, the guidance for fair value measurements and disclosure was updated to define fair value, establish a framework for measuring fair value, and expand disclosures about fair value measurements. This guidance does not require any new fair value measurements but rather eliminates inconsistencies in guidance found in various prior accounting pronouncements. The provisions of the updated guidance were adopted January 1, 2008. In February 2008, the FASB staff issued an update to the guidance which delayed the effective date for nonfinancial assets and nonfinancial liabilities that are recognized or disclosed at fair value in the financial statements on a nonrecurring basis. The Company adopted the updated guidance for the Company’s nonfinancial assets and liabilities measured at fair value on a nonrecurring basis on January 1, 2009. The adoption of updated guidance did not have a material impact on the Company’s financial position, results of operations or cash flows.
47
In October 2008, the guidance was further updated to provide guidance on how the fair value of a financial asset is to be determined when the market for that financial asset is inactive. The guidance states that determining fair value in an inactive market depends on the facts and circumstances, requires the use of significant judgment and, in some cases, observable inputs may require significant adjustment based on unobservable data. Regardless of the valuation technique used, an entity must include appropriate risk adjustments that market participants would make for nonperformance and liquidity risks when determining fair value of an asset in an inactive market. The guidance was effective upon issuance. The Company has incorporated the principles of updated guidance in determining the fair value of financial assets when the market for those assets is not active.
In April 2009, the guidance was further updated to provide additional guidance on determining fair value when the volume and level of activity for the asset or liability have significantly decreased and identifying circumstances that indicate when a transaction is not orderly. The provisions of this updated guidance were adopted April 1, 2009. The adoption of the guidance did not have an impact on the Company’s fair value measurements.
The ASC guidance for fair value measurements and disclosure establishes a fair value hierarchy that prioritizes the inputs to valuation techniques used to measure fair value. The hierarchy gives the highest priority to unadjusted quoted prices in active markets for identical assets or liabilities (Level 1 measurements) and the lowest priority to unobservable inputs (Level 3 measurements). The three levels of the fair value hierarchy are described below:
Level 1 Inputs – Quoted prices for identical instruments in active markets.
Level 2 Inputs – Quoted prices for similar instruments in active markets; quoted prices for identical or similar instruments in markets that are not active; and model-derived valuations whose inputs are observable or whose significant value drivers are observable.
Level 3 Inputs – Instruments with primarily unobservable value drivers.
As of December 31, 2011 and 2010, the Company’s financial assets are measured at fair value using Level 3 inputs, with the exception of cash, which was valued using Level 1 inputs. There were no financial liabilities as of December 31, 2011 and 2010.
|
Fair Value Measurement at December 31, 2011 Using:
|
||||||||||||||||
|
December 31, 2011
|
Quoted Prices In
Active Markets
For Identical Assets
(Level 1)
|
Significant Other
Observable
Inputs
(Level 2)
|
Significant
Unobservable
Inputs
(Level 3)
|
|||||||||||||
|
Assets:
|
||||||||||||||||
|
Cash and Cash Equivalents
|
$ | 2,670,933 | $ | 2,670,933 | $ | - | $ | - | ||||||||
|
Investment in Affiliate
|
70,000 | - | - | 70,000 | ||||||||||||
| $ | 2,740,933 | $ | 2,670,933 | $ | - | $ | 70,000 | |||||||||
48
|
Fair Value Measurement at December 31, 2010 Using:
|
||||||||||||||||
|
December 31, 2010
|
Quoted Prices In Active Markets
For Identical Assets
(Level 1)
|
Significant Other
Observable
Inputs
(Level 2)
|
Significant
Unobservable
Inputs
(Level 3)
|
|||||||||||||
|
Assets:
|
||||||||||||||||
|
Cash and Cash Equivalents
|
$ | 1,277,065 | $ | 1,277,065 | $ | - | $ | - | ||||||||
|
Investment in Affiliate
|
70,000 | $ | - | $ | - | $ | 70,000 | |||||||||
| $ | 1,347,065 | $ | 1,277,065 | $ | - | $ | 70,000 | |||||||||
NOTE 14 – SUBSEQUENT EVENTS
On December 27, 2011, the Company's shareholders voted to increase the authorized common stock of the Company from 12,500,000 to 25,000,000 and the filing was made with the Secretary of State of Delaware in February 2012 to effect this change. The authorized preferred stock remained unchanged. The financial statements reflect this change as if it had been effectuated prior to December 31, 2011.
On March 28, 2012 DynaResource de Mexico approved and released to the Company a National Instrument 43-101 (“NI 43-101”) Technical Report for the San Jose de Gracia Property (the “2012 DynaMexico Luna-CAM SJG Technical Report”). The 2012 DynaMexico Luna-CAM SJG Technical Report was prepared by Mr. Ramon Luna, BS, P.Geo., of Servicios y Proyectos Mineros, Hermosillo, Mexico, and a Qualified Person as defined under NI 43-101; and by Mr. Robert Sandefur, BS, MSc, P.E., a senior reserve analyst for Chlumsky, Armbrust & Meyer LLC, Lakewood, CO., and a Qualified Person as defined under NI 43-101. The 2012 DynaMexico Luna-CAM SJG Technical Report includes as Section Fourteen (14) a Mineral Resource Estimate for SJG as prepared by Mr. Sandefur (the “2012 DynaMexico-CAM SJG 43-101 Mineral Resource Estimate”). The Effective Date of the 2012 DynaMexico Luna-CAM SJG Technical Report is February 6, 2012.
The Technical Report was filed by the Company on SEDAR (www.sedar.com) on March 28, 2012, and is available for review on SEDAR under the Company profile.
No other reportable subsequent events were noted.
49
ITEM 9. CHANGES IN AND DISAGREEMENTS WITH ACCOUNTANTS ON ACCOUNTING AND FINANCIAL DISCLOSURE
None.
ITEM 9A. CONTROLS AND PROCEDURES
Evaluation of Disclosure on Controls and Procedures
We carried out an evaluation of the effectiveness of the design and operation of our disclosure controls and procedures (as defined in Exchange Act Rules 13a-15(e) and 15d-15(e)) as of December 31, 2011. This evaluation was accomplished under the supervision and with the participation of our chief executive officer / principal executive officer, and chief financial officer / principal financial officer who concluded that our disclosure controls and procedures are effective to ensure that all material information required to be filed in the annual report on Form 10-K has been made known to them.
For purposes of this section, the term disclosure controls and procedures means controls and other procedures of an issuer that are designed to ensure that information required to be disclosed by the issuer in the reports that it files or submits under the Act (15 U.S.C. 78a et seg.) is recorded, processed, summarized and reported, within the time periods specified in the Commission’s rules and forms. Disclosure, controls and procedures include, without limitation, controls and procedures designed to ensure that information required to be disclosed in our reports filed under the Securities Exchange Act of 1934, as amended (the "Act") is accumulated and communicated to the issuer's management, including its principal executive and principal financial officers, or persons performing similar functions, as appropriate to allow timely decisions regarding required disclosure.
Based upon an evaluation conducted for the period ended December 31, 2011, our Chief Executive and Chief Financial Officer as of December 31, 2011 and as of the date of this Report, has concluded that as of the end of the periods covered by this report, we have identified no material weakness in our internal control.
Management’s Annual Report on Internal Control Over Financial Reporting
Our management is responsible for establishing and maintaining adequate internal control over financial reporting, as such term is defined in Rules 13a-15(f) and 15d-15(f) of the Exchange Act. Our internal control system was designed to provide reasonable assurance regarding the reliability of financial reporting and the preparation of financial statements for external purposes, in accordance with generally accepted accounting principles in the United States of America. Our internal control over financial reporting includes those policies and procedures that (i) pertain to the maintenance records that, in reasonable detail, accurately and fairly reflect the transactions and dispositions of the assets of the Company; (ii) provide reasonable assurance that transactions are recorded as necessary to permit preparation of financial statements in accordance with accounting principles generally accepted in the United States of America, and that receipts and expenditures of the Company are being made only in accordance with authorizations of management of the Company; and (iii) provide reasonable assurance regarding prevention or timely detection of unauthorized acquisition, use, or disposition of the Company’s assets that could have a material effect on the financial statements.
Because of inherent limitations, a system of internal control over financial reporting may not prevent or detect misstatements. Also, projections of any evaluation of effectiveness to future periods are subject to the risk that controls may become inadequate due to change in conditions, or that the degree of compliance with the policies or procedures may deteriorate.
Our management conducted an evaluation of the effectiveness of our internal control over financial reporting using the criteria set forth by the Committee of Sponsoring Organizations of the Treadway Commission (COSO) in Internal Control—Integrated Framework at December 31, 2011. Based on its evaluation, our management concluded that, as of December 31, 2011, our internal control over financial reporting was effective and contained no material weaknesses. A material weakness is a deficiency, or a combination of control deficiencies, in internal control over financial reporting such that there is a reasonable possibility that a material misstatement of the Company’s annual or interim financial statements will not be prevented or detected on a timely basis.
50
This annual report does not include an attestation report of the Company’s registered public accounting firm regarding internal control over financial reporting. Management’s report was not subject to the attestation by the Company’s registered public accounting firm pursuant to rules of the SEC that permit the Company to provide only management’s report in this annual report.
Changes in Internal Controls over Financial Reporting
We have not yet made any changes in our internal controls over financial reporting that occurred during the period covered by this report on Form 10-K that has materially affected, or is reasonably likely to materially affect, our internal control over financial reporting.
ITEM 9B. OTHER INFORMATION
None.
PART III
ITEM 10. DIRECTORS, EXECUTIVE OFFICERS AND CORPORATE GOVERNANCE
The following table lists the names and ages of the executive officers, directors and key consultants of the Company. The directors will continue to serve until the next annual shareholders meeting, or until their successors are elected and qualified. Mr. Diepholz, Mr. Smith, and Mr. Tidwell have been elected to serve through 2012. All officers serve at the discretion of the President, Chairman of the Board of Directors, and members of the Board of Directors.
|
Name
|
Age
|
Position
|
Held Since
|
|||
|
K. W. (K.D.) Diepholz
1303 Regency Court
Southlake, Texas 76092
|
54 |
Chairman of The Board,
CEO, Treasurer
|
May 1995
May 1997
|
|||
|
Charles Smith
709-B West Rusk #580
Rockwall, Texas 75087
|
54 |
Chief Financial Officer, Secretary and Director
|
May 2005
|
|||
|
Melvin E. Tidwell
4804 Piccadilly Place
Tyler, Texas 75703
|
65 |
Director
|
May 1994
|
|||
|
Bradford J. Saulter
7618 Straits Lane
Rowlett, Texas 75088
|
49 |
Vice President – Investor Relations
|
May 1998
|
51
K.W. Diepholz - Graduated Lake Land College; Communications and Business Emphasis; Regional Director - Fidelity Union Insurance and Investment, Dallas, Texas (1980 -1983); President - KWD Properties Corporation, Mattoon, Illinois (1983 - 1989); a privately-held Oil & Gas Exploration and Development Company involved in all phases of The Oil & Gas Business, and Various Types of Partnerships; Vice President - American Investment Retirement Corporation, Phoenix, Arizona (1990 - 1991), Involved in Program Structuring for Pension Accounts; Vice President - Ideal Securities, Inc., Dallas, Texas (1992); Program Structuring and Marketing Management; President - DP Phoenix, a Real Estate Investment Company, Phoenix, Arizona (1991 -1992); Investment Program Structuring, Real Estate Acquisitions, General Management; Director: Farm Partners, Inc., Dallas, Texas (1992 - Present); General Management of this General Partner to Precious Metals Limited Partnership; DP Group Ltd., Dallas, Texas (1993 - Present); President of this independent Marketing firm; Dynacap Group Ltd., Dallas, Texas (1992 - Present); President of this Consulting and Management firm, directing the management of certain Limited Liability Investment Companies; DynaResource, Inc. (f/k/a: West Coast Mines, Inc.), Dallas, Texas (1994 - Present); Chairman, President, Treasurer, and Director. Special skills in the areas of Business Development, Project Planning, Corporate Financing, Acquisition Analysis, Investment Program Interpretation and Structuring. Mr. Diepholz has been instrumental in the negotiations of: the acquisition of 24.9 % Net Profits Interest in the San José de Gracia in 1995; the acquisition of an additional 25 % interest in San José de Gracia in 1998; the acquisition and consolidation of 100 % of the rights to the San José de Gracia from prior owners, culminating at March, 2000; the acquisition and consolidation of several outstanding Concessions at the San José de Gracia from previous Mexican owners during 2000-3; the Direction and Management of the production operation at SJG; and the negotiation of the Stock Purchase / Earn In Agreement with Goldgroup Mining, Inc. in 2006. Mr. Diepholz is the current Chairman / Ceo of the Company; and he holds the same position with DynaResource Nevada, Inc., an affiliated Company. Mr. Diepholz is also the current President of the following subsidiaries of the Company in Mexico; DynaResource de Mexico (“DynaMexico), and holding all the Powers of Attorney for the Company, Mineras de DynaResource (“Mineras Dyna”), and DynaResource Operaciones (“DynaOperaciones”); And, Mr. Diepholz is also the President of DynaNevada de Mexico, the wholly owned subsidiary of DynaResource Nevada Inc.
Charles Smith. Mr. Smith graduated from Boston University, Boston, Massachusetts in 1979 and since that time has been a Certified Public Accountant involved in all phases of business including audit and tax matters. He is a consultant to various companies. Some of Mr. Smith’s business affiliations the past five years include: Chief Financial Officer of DynaResource, Inc. – May 2005 to present. Chairman of Dynacap Group, Ltd. - a consulting and management firm - 1992 to the present. Sole proprietor as a Certified Public Accountant - 1983 to the present. Sole officer and Director - MC Cambridge, Inc. - a financial consulting firm - 1997 to present.
Melvin E. Tidwell, P.E. - Professional Engineer, registered in California in 1977; Control Systems Engineer; Instrument Engineer on over 80 Projects Worldwide; Instrument Startup Engineer on over 50 Projects Worldwide; Affiliated / Associated with following Companies over the past 25 years: Weyerhaeuser Company, Howe-Baker Engineers, LaGloria Oil & Gas Co., IWATANI Electronics (Japan), EQM (Mexico), Kyodo Oxygen Co., Ltd. (Japan), Chin Yang Fine Chemical Co. (South Korea), Hankuk Glass Mfg. Co. (South Korea), Hunt Oil Co., Liquid Carbonics Co., Celanese Mexicana (Mexico), Grain Power Tucumcari Ltd., Jetco Chemical Inc., Claiborne Gasoline Co., Conoco, Chevron, Metano Gas (now Exxon), Union Oil, Texaco Angola, Petrofac, Alfurat (Syrian Oil Co.), Arco, Chevron / Placer Cego, Tidwell & Associates; with Engineering / Management Experience in the following Project Areas: Startup & Engineering - $ 160 Million Linerboard Paper Mill; Chief Instrument Engineer - chemical division; DEA Gas Treating & Sulfur Recovery Plant; One Part / million H2 Plant; Startup Hydrogen Plants; H2 / CO Cosorb Plant; Startup H2 / CO synthesis Gas Plant & Cold Box; Startup Ethanol Plant; Specialties Chemicals Expansion - Foxboro 200 instruments; Startup & Calibration 75,000 BPD Crude Distillation Facility; Instrument Engineer - 1st Oxygen Enrichment Cope Unit; Instrument Engineer, Startup & checkout - 30 TPD Selectox SRU; Instrument Engineer - Offshore Oil & Gas Production Facility; Lead Instrument Engineer - 60,000 BPD Oil Production Facility; Instrument Checkout, Calibration, and Inspection prior to startup - Selectox Sulfur Units (Honeywell TDC 3000 DCS) (Foxboro 760 Electronics Controllers); Startup Amine Plant and Sulfur Plant, and System Engineering (Foxboro and Westinghouse PLC); Instrument Engineer, Field Startup and Checkout - CCR, HDS, MTBE, Hydrogen and Cryogenic Plants. Founder, President - Tidwell & Associates, a private engineering consulting Firm (1993 to Present); Director – DynaResource, Inc. (f/k/a: West Coast Mines, Inc.), Dallas, (1994 to present).
Bradford J. Saulter - Attended University of Texas, Austin, Texas; Marketing Department of Metagram, Inc., a Dallas National Marketing Company; Regional Manager for Lugar, Lynch, & Associates, A Dallas Financial Services Company, Involved in Sales & Marketing of Various Investment Products; Independent Marketing Consultant; Series 22 & 63 Securities License; Vice President / Marketing - Dynacap Group Ltd. (1992 - Present); Director: Farm Partners, Inc. (1992 - Present), Vice President – Investor Relations - DynaResource, Inc., Dallas, Texas (1995 to present).
To the knowledge of the Company, no present or former director, executive officer, or person nominated to become a director or executive of the Company, or consultants to the Company, has ever:
1.) Filed a bankruptcy petition by or against any business of which such person was a general partner or executive officer whether at the time of the bankruptcy or with two years prior to that time;
2.) Had any conviction in a criminal proceeding or being subject to a pending criminal proceeding (excluding traffic violations and other minor offenses);
52
3.) Been subject to any order, judgment, or decree, not subsequently reversed, suspended or vacated, of any court of competent jurisdiction, permanently or temporarily enjoining, barring, suspending or otherwise limiting his involvement in any type of business, securities or banking activities; and,
4.) Been found by a court of competent jurisdiction (in a civil action), the Commission or the Commodity Futures Trading Commission to have violated a federal or state securities or commodities law, and the judgment has not been reversed suspended or vacated.
ITEM 11. EXECUTIVE COMPENSATION
The following officers received the following compensation for the years ended December 31, 2011 and 2010. These officers do not have employment contracts with the Company.
|
Name and principal position
|
Year
|
Salary
|
Bonus
|
Stock Awards
|
Option Awards
|
Nonequity incentive plan compensation
|
Nonqualified deferred compensation
|
All other compensation
*
|
|
K.W. Diepholz
CEO, President
|
2011
2010
|
$225,000
$225,000
|
None
None
|
None
None
|
None
None
|
None
None
|
None
None
|
$117,850
$ 53,600
|
|
Charles Smith
CFO, Secretary
|
2011
2010
|
None
$30,000
|
None
None
|
$85,500
$46,875
|
None
None
|
None
None
|
None
None
|
$ None
$ None
|
|
Bradford J. Saulter
VP – Investor Relations
|
2011
2010
|
$72,000
$72,000
|
None
None
|
None
$43,751
|
None
None
|
None
None
|
None
None
|
$28,545
$ 9,103
|
|
Melvin E. Tidwell, Director
|
2011
2010
|
None
None
|
None
None
|
$21,874
$21,874
|
None
None
|
None
None
|
None
None
|
$ None
$ None
|
* As disclosed in the financial statements, the Company paid consulting fees to Dynacap Group, Ltd. This remuneration was paid from the funds received by Dynacap.
53
|
Option Awards
|
Stock Awards
|
|||||
|
Name and principal position
|
Number of Securities Underlying Unexercised options (#) exercisable
|
Number of Securities
Underlying Unexercised
options (#) unexercisable
|
Equity
incentive plan
awards
|
Option
exercise price
|
Option
expiration date
|
Number of share
awards that have
not vested
|
|
K.W. Diepholz
CEO, President
|
None
|
None
|
None
|
N/A
|
N/A
|
None
|
|
Charles Smith
CFO, Secretary
|
None
|
None
|
None
|
N/A
|
N/A
|
None
|
|
Melvin Tidwell
Director
|
None
|
None
|
None
|
N/A
|
N/A
|
None
|
|
Bradford J. Saulter
VP – Investor Relations
|
None
|
None
|
None
|
N/A
|
N/A
|
None
|
ITEM 12. SECURITY OWNERSHIP OF CERTAIN BENEFICIAL OWNERS AND MANAGEMENT AND RELATED STOCKHOLDER MATTERS
The following table sets forth the amount and nature of beneficial ownership of each of the executive officers and directors of the Company and each person known to be a beneficial owner of more than five percent of the issued and outstanding shares of the Company as of December 31, 2011. The following table sets forth the information based on 10,602,868 common shares issued and outstanding as of December 31, 2011.
|
COMMON STOCK
|
Beneficial Owner
|
Address
|
Common Shares
|
Percent
Ownership
|
||||||||
|
Common Stock
|
K.W. (“K.D.”) Diepholz
Chairman / CEO
|
1303 Regency Court
Southlake, Texas 76092
|
1,439,915 | 13.58 | % | |||||||
|
Common Stock
|
Charles Smith
CFO; Secretary;
Director
|
709-B West Rusk #580
Rockwall, Texas 75087
|
164,150 | 1.55 | % | |||||||
|
Common Stock
|
Children of
Charles Smith, through
Smith First Family LP.;
Andrew Smith, GP
|
4247 Clairmont
Birmingham, AL 35222
|
331,250 | 3.12 | % | |||||||
|
Common Stock
|
Melvin E. Tidwell
Director;
|
4804 Picadilly Place
Tyler, Texas 75703
|
75,845 | 0.72 | % | |||||||
|
Common Stock
|
Bradford J. Saulter
VP., Investor Relations
|
7618 Straits Lane
Rowlett, Texas 75088
|
112,531 | 1.06 | % | |||||||
|
All Officers, Directors And Beneficial owners
as a Group (5 Persons)
|
2,123,691 | 20.03 | % | |||||||||
54
None of the Shares described above are subject to options which are either (a) vested, or, (b) will vest within 60 days.
The officers and directors and those 5% beneficial owners held the following options as of December 31, 2011:
None
| PREFERRED
SHARES
|
Beneficial Owner | Address | Preferred Shares | Percent Ownership | ||||
| Preferred | K.W. Diepholz |
1303 Regency Court
Southlake, TX. 76092
|
1,000 | 100 % |
ITEM 13. CERTAIN RELATIONSHIPS AND RELATED TRANSACTIONS, AND DIRECTOR INDEPENDENCE
The Company has paid cash remuneration for services to Dynacap Group Ltd., a private consulting firm. Mr. K.W. Diepholz - Chairman and CEO of the Company and Mr. Charles Smith, Chief Financial Officer, are the Managers of Dynacap Group, Ltd.
The Company has paid cash compensation as follows, to related parties or officers during the years ended December 31, 2011 and 2010:
In 2011, the Company paid $107,500 to Dynacap Group, Ltd. for consulting and other fees;
In 2010, the Company paid $57,203 to Dynacap Group, Ltd. for consulting and other fees.
The Company is not aware of any other material relationships or related transactions between the Company and any officers, directors or holders of more than five percent of any class of outstanding securities of the issuer.
55
ITEM 14. PRINCIPAL ACCOUNTING FEES AND SERVICES
(1) Audit Fees
The aggregate fees billed for professional services rendered by our auditors, for the audit of the registrant's annual financial statements and review of the financial statements included in the registrant's Form 10-K or services that are normally provided by the accountant in connection with statutory and regulatory filings or engagements for fiscal years 2011 and 2010 was $63,536 and $59,245, respectively.
(2) Audit Related Fees
None
(3) Tax Fees
None
(4) All Other Fees
None
(5) Audit Committee Policies and Procedures
The Company does not have an audit committee.
(6) If greater than 50 percent, disclose the percentage of hours expended on the principal accountant's engagement to audit the registrant's financial statements for the most recent fiscal year that were attributed to work performed by persons other than the principal accountant's full-time, permanent employees.
Not applicable.
56
PART IV
ITEM 15. EXHIBITS AND FINANCIAL STATEMENT SCHEDULES
|
No.
|
Description
|
|
|
31.1
|
Certification of the Company’s Principal Executive Officer pursuant to Section 302 of the Sarbanes-Oxley Act of 2002
|
|
|
31.2
|
Certification of the Company’s Principal Financial Officer pursuant to Section 302 of the Sarbanes-Oxley Act of 2002
|
|
|
32.1
|
Certification of the Company’s Principal Executive Officer and Principal Financial Officer pursuant to 18 U.S.C. Section 1350, as adopted pursuant to Section 906 of the Sarbanes-Oxley Act of 2002.
|
|
|
99.1
|
SJG Drill Summary File through 11-298
|
57
SIGNATURES
Pursuant to the requirements of Section 13 or 15(d) of the Securities Exchange Act of 1934, the registrant has duly caused this report to be signed on its behalf by the undersigned, thereunto duly authorized.
| DynaResource, Inc. | |||
|
|
By:
|
/s/ K.W. (“K.D.”) Diepholz | |
| K.W. Diepholz, President | |||
| (Principal Executive Officer) | |||
| By: | /s/ Charles Smith | ||
| Charles Smith, Chief Financial Officer | |||
| (Principal Financial Officer) | |||
Pursuant to the requirements of the Securities Exchange Act of 1934, this report has been signed below by the following persons on behalf of the registrant and in the capacities and on the dates indicated.
|
Signature
|
Title
|
Date
|
||
| /s/ K.W. (“K.D.” Diepholz | President, Chief Executive Officer, Chairman, Director (principal executive officer) | |||
|
K.W. (“K.D.”) Diepholz
|
March 30, 2012
|
|||
|
/s/ Charles Smith
|
Chief Financial Officer, Director (principal financial and accounting officer)
|
March 30, 2012
|
||
|
Charles Smith
|
58