Attached files
| file | filename |
|---|---|
| 8-K - CURRENT REPORT ON FORM 8-K - US ECOLOGY, INC. | usecology_8k-032012.htm |
Exhibit 99.1
1

During the course of this presentation the Company will be making forward - looking statements (as such term is defined in the Private Securities Litigation Reform Act of 1995 ) that are based on our current expectations, beliefs and assumptions about the industry and markets in which US Ecology, Inc . and its subsidiaries operate . Because such statements include risks and uncertainties, actual results may differ materially from what is expressed herein and no assurance can be given that the Company will meet its 2012 earnings estimates, successfully execute its growth strategy, or declare or pay future dividends . For information on other factors that could cause actual results to differ materially from expectations, please refer to US Ecology, Inc . ’s December 31 , 2011 Annual Report on Form 10 - K and other reports filed with the Securities and Exchange Commission . Many of the factors that will determine the Company’s future results are beyond the ability of management to control or predict . Participants should not place undue reliance on forward - looking statements, reflect management’s views only as of the date hereof . The Company undertakes no obligation to revise or update any forward - looking statements, or to make any other forward - looking statements, whether as a result of new information, future events or otherwise . Important assumptions and other important factors that could cause actual results to differ materially from those set forth in the forward - looking information include a loss of a major customer or contract, , compliance with and changes to applicable laws, rules, or regulations, access to cost effective transportation services, access to insurance, surety bonds and other financial assurances, loss of key personnel, lawsuits, labor disputes, adverse economic conditions, government funding or competitive pressures, incidents or adverse weather conditions that could limit or suspend specific operations, implementation of new technologies, market conditions, average selling prices for recycled materials, our ability to replace business from recently completed large projects, our ability to perform under required contracts, our ability to permit and contract for timely construction of new or expanded disposal cells, our willingness or ability to pay dividends and our ability to effectively close and integrate future acquisitions . 2

Own & operate hazardous and radioactive waste landfills Provide safe, secure & cost - effective hazardous and radioactive materials solutions Serving industry and government for 60 years – Large, loyal customer base 3

Transportation • Transportation Logistics support • 234 Company Owned railcars • Trucking coordination • Cross Border Expertise Treatment • Stabilization • Proprietary Treatment • Solidification • Encapsulation • Thermal Recycling Disposal • 4 hazardous waste landfills • 1 radioactive waste landfill 4

Estimated $5 billion per year market Landfill revenue represents 14% or $700 million Historically ~3.5M tons/year disposed Sources of Waste ◦ Clean - ups (Events) ◦ Recurring Activities (Base) Key Drivers ◦ Regulatory ◦ Commercial/Economic ◦ Government 5
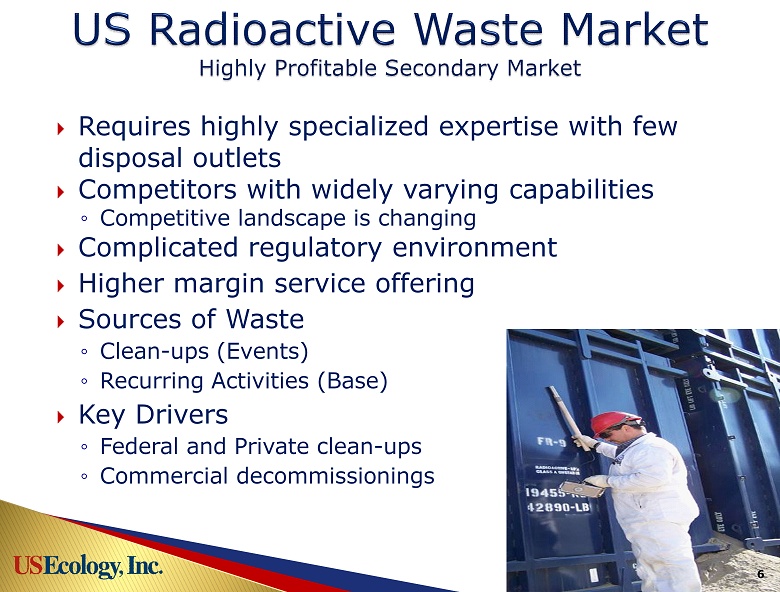
Requires highly specialized expertise with few disposal outlets Competitors with widely varying capabilities ◦ Competitive landscape is changing Complicated regulatory environment Higher margin service offering Sources of Waste ◦ Clean - ups (Events) ◦ Recurring Activities (Base) Key Drivers ◦ Federal and Private clean - ups ◦ Commercial decommissionings 6 6

7 Grand View, Idaho ◦ “Hybrid” site with both Hazardous & Radioactive capabilities ◦ Specializing in high volume treatment or direct disposal hazardous projects with decades of permitted capacity Robstown, Texas ◦ Well situated in large Gulf Coast oil and gas market and specializing in difficult - to - treat, container, and bulk waste Beatty, Nevada ◦ Great desert location serving large CA/AZ market and specializing in difficult - to - treat, container, and bulk waste Blainville, Quebec (Stablex) ◦ Located near large industrial markets; significant base business ◦ Unique permit capabilities allowing ‘niche’ waste streams Richland, WA ◦ NRC regulated Low - Level Radioactive Waste ◦ Serves NW and Rocky Mtn. Compact via Rate Regulated Revenue Requirment Irreplaceable Assets

8 Note: 1 “H” = hazardous, “NH” = non - hazardous, “PCB” = Polychlorinated biphenyls, “ NORM/NARM” = Naturally occurring and accelerator produced radioactive material , “LLRW” = Low - level radioactive waste regulated under the federal Atomic Energy Act for disposal and “LARM” = Low - activity radioactive material exempt from federal Atomic Energy Act regulation for disposal 2 Northwestern Compact: AK, HI, ID, MT, OR, UT, WA, WY; Rocky Mtn. Compact: CO, NM, NV US Ecology, Inc. Broad Service Offering Type of Waste Accepted (1) H NH Rail Customer Segment Robstown, TX (Owned) Gulf region – refinery and chemicals production waste PCB NORM/ NARM LARM LLRW Grand View, ID (Owned) All U.S. and Canada – large cleanup projects x x x x x x Blainville, Quebec (Owned/Subleased) Eastern Canada / Northeast U.S. – industrial waste – containerized and bulk x x x x x x Beatty, NV (Leased) AZ, CA, NV, UT – containerized and bulk waste x x x x Richland, WA (Subleased) x x x Northwest and Rocky Mtn. Compact (2) – radioactive waste TX Thermal Recycling (On Site Partner - operated) All U.S. and Canada – Oil bearing hazardous waste for recycling x x x x x x x

9 Beatty, NV Grand View, ID Robstown, TX Richland, WA Blainville, QC 20 Hazardous Waste Landfills ◦ We operate 4 geologically superior landfills with long lives ◦ Many competitive landfills have short lives or site specific problems (e.g. geology, climate, contamination, hostile communities, etc…) 3 Radioactive Waste Landfills accepting waste ◦ We operate 1 – NW and Rocky Mtn. compacts ◦ New West Texas facility expected on line in future Competing hazardous landfills

10 Thermal Recycling of oil bearing hazardous waste ◦ Co - located at Robstown facility ◦ Leverages existing infrastructure ◦ Internalizes recycling residuals Transportation Services ◦ 234 owned gondola railcars ◦ Hazardous & Radioactive transportation and logistics expertise Field Services ◦ US Ecology personnel located at customer locations ◦ Oversee loading, packaging, manifesting of hazardous & radioactive material Off Site Services ◦ Broker material that we cannot accept at our landfills ◦ Allows for ‘one shipment solution’ for customer

Key End - Markets ◦ Refineries, chemical and petro - chemical production, heavy manufacturers, electric utilities, steel mills, waste brokers, and government entities/agencies Base Business 61% of Revenue ◦ Strong Customer Retention Diverse Customer Base ◦ Largest account was 7% of revenue ◦ Top 10 < 38% 11

Record Treatment & Disposal (“T&D”) Revenue - $129.1 million 1.1 million tons disposed; just short of 1.2 million best (‘08) Record Adjusted EBITDA - $49.8 million 2 nd Best Operating Income - $32.4 million Cash from operations - $43.2 million ◦ $22.5 million debt reduction ◦ $13.1 million dividend payments ◦ $10.1 million capital expenditures Net Income $18.4 million; Adjusted EPS $1.06 Return metrics remain solid – 19% ROE and 12% ROIC Strong performance across all operations 12 2011 Highlights

13 Historical Revenue/Volume Underlying growth rate masked by Event business & transportation lumpiness ◦ Base Business CAGR (‘06 - ’11)= 19% ◦ Treatment & Disposal Rev. CAGR (‘06 - ’11) = 13% - 200 400 600 800 1,000 1,200 1,400 $- $20 $40 $60 $80 $100 $120 $140 $160 $180 $200 2006 2007 2008 2009 2010 2011 i n thousands of tons in millions Total Revenue/Volume Treatment and Disposal Transportation Honeywell Volume Honeywell Volume - 200 400 600 800 1,000 1,200 1,400 $- $20 $40 $60 $80 $100 $120 $140 2006 2007 2008 2009 2010 2011 i n thousands of tons in millions T&D Revenue/Volume Base Event Volume

14 Historical Op Income/EBITDA 2011 EBITDA hit record levels of $49.8 million Operating income 2 nd best in company history Industry leading EBITDA margins 3 & 5 year CAGR: • Operating income: 18% / 6% • EBITDA: 23% / 9% Strong EBITDA margin well in excess of 30% peaking at ~ 50% 0% 10% 20% 30% 40% 50% 60% $- $10 $20 $30 $40 $50 $60 2006 2007 2008 2009 2010 2011 in millions Operating Income/EBITDA Operating Income D&A (Non-Cash) EBITDA as % of T&D Rev $- $0.20 $0.40 $0.60 $0.80 $1.00 $1.20 $1.40 2006 2007 2008 2009 2010 2011 Adjusted Earnings Per Share Adjusted EPS HON EPS 2011 Adjusted EPS = $1.06 • 3yr CAGR = 19% • 5yr CAGR = 4%

15 Free Cash Flow Generation Strong free cash flow generation supporting healthy dividend, yielding ~4% in thousands 2008 2009 2010 2011 Adjusted EBITDA 44,625$ 32,472$ 30,634$ 49,849$ Interest expense (7) (2) (320) (1,604) Interest income 413 116 51 26 Cash income taxes (12,169) (4,686) (7,419) (13,360) Change in working capital (4,522) 11,952 (5,683) 6,547 Capital expenditures (13,617) (9,405) (14,190) (10,096) Free cash flow before dividend 14,723$ 30,447$ 3,073$ 31,362$ Common stock dividend (12,054) (13,068) (13,090) (13,113) Free cash flow after dividend 2,669$ 17,379$ (10,017)$ 18,249$

16 Generate sustainable increases in EPS and cash flow Drive volume thru pricing and bundling services Expand waste handling infrastructure Develop new services Aggressively manage costs Execute on our acquisition strategy Modify permits
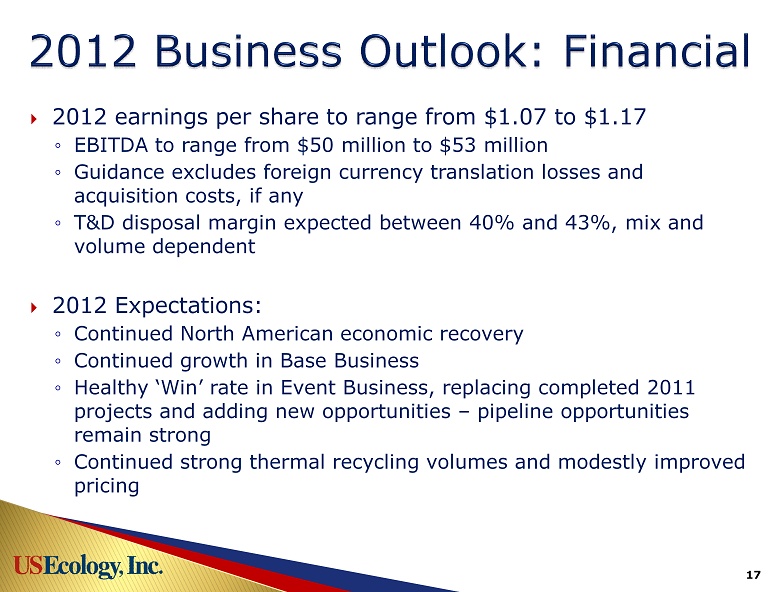
17 2012 earnings per share to range from $1.07 to $1.17 ◦ EBITDA to range from $50 million to $53 million ◦ Guidance excludes foreign currency translation losses and acquisition costs, if any ◦ T&D disposal margin expected between 40% and 43%, mix and volume dependent 2012 Expectations: ◦ Continued North American economic recovery ◦ Continued growth in Base Business ◦ Healthy ‘Win’ rate in Event Business, replacing completed 2011 projects and adding new opportunities – pipeline opportunities remain strong ◦ Continued strong thermal recycling volumes and modestly improved pricing

18 Expect Capital Expenditures to range from $18.5 to $19.5 million ◦ 2012 spending includes $1.4 million of 2011 projects ◦ New landfill construction in Idaho and Quebec (due to higher waste volumes) represents almost half of 2012 spending ◦ Continued reinvestment back into waste handling infrastructure (replacing, maintaining and upgrading plant & equipment) Strategy: Build on our successes in 2011 ◦ Drive organic growth with increased market penetration and expanded service offering – take market share ◦ Operational Excellence - Flawless execution ◦ Expand asset base through acquisitions ◦ Ongoing commitment to Health, Safety, and Compliance

Unique and irreplaceable set of disposal assets with high barriers to entry Business model is highly leveragable with earnings upside Experienced management team Return on invested capital: 12% TTM Attractive dividend yield of approximately 4% Strong balance sheet with available borrowing capacity Acquisitions part of future growth strategy 19