Attached files
| file | filename |
|---|---|
| 8-K - BARCLAYS CAPITAL CONFERENCE - WEST PHARMACEUTICAL SERVICES INC | form8k.htm |
WEST PHARMACEUTICAL SERVICES, INC.
Solutions for Injectable Drug Delivery NYSE:WST www.westpharma.com
© 2012 by West Pharmaceutical Services, Inc., Lionville, PA.
All rights reserved. This material is protected by copyright. No part of it may be reproduced, stored in a retrieval system, or transmitted in any
form or by any means, electronic, mechanical, photocopying or otherwise, without written permission of West Pharmaceutical Services, Inc.. All
trademarks and registered trademarks are property of West Pharmaceutical Services, Inc., unless noted otherwise.
form or by any means, electronic, mechanical, photocopying or otherwise, without written permission of West Pharmaceutical Services, Inc.. All
trademarks and registered trademarks are property of West Pharmaceutical Services, Inc., unless noted otherwise.
Barclays Capital Global Healthcare Conference
Miami, FL
March 13, 2012

Safe Harbor Statement
2
Cautionary Statement Under the Private Securities Litigation Reform Act of 1995
This presentation and any accompanying management commentary contain “forward-looking statements”
as that term is defined in the Private Securities Litigation Reform Act of 1995. Such statements include,
but are not limited to statements about expected financial results for 2012 and future years.
as that term is defined in the Private Securities Litigation Reform Act of 1995. Such statements include,
but are not limited to statements about expected financial results for 2012 and future years.
Each of these estimates is based on preliminary information, and actual results could differ from these
preliminary estimates. We caution investors that the risk factors listed under “Cautionary Statement” in
our press releases, as well as those set forth under the caption "Risk Factors" in our most recent Annual
Report on Form 10-K as filed with the Securities and Exchange Commission and as revised or
supplemented by our quarterly reports on Form 10-Q, could cause our actual results to differ materially
from those estimated or predicted in the forward-looking statements. You should evaluate any statement
in light of these important factors. Except as required by law or regulation, we undertake no obligation to
publicly update any forward-looking statements, whether as a result of new information, future events, or
otherwise.
Non-GAAP Financial Measures
Certain financial measures included in these presentation materials, and which may be referred to in
management’s discussion of the Company’s results and outlook, are Non-GAAP (Generally Accepted
Accounting Principles) financial measures. Please refer to the “Non-GAAP Financial Measures” and
“Notes to Non-GAAP Financial Measures” at the end of these materials for more information. Non-GAAP
financial measures should not be considered in isolation or as an alternative to such measures
determined in accordance with GAAP.

3
Pharmaceutical Packaging Systems
Pharmaceutical Delivery Systems
• A globally diverse manufacturer of
products used primarily in containing and
administering small-volume parenteral
drugs.
products used primarily in containing and
administering small-volume parenteral
drugs.
• Strong competitive position
– Substantial market shares
– Proprietary technology
– Diversified customer base
– Global footprint
– Preferred products for biologics
– Long-term customer relationships
• Stability with growth potential
• Proprietary Products
• Geographic Expansion
• Financial strength to invest
– Reliable operating cash flow
– Well capitalized
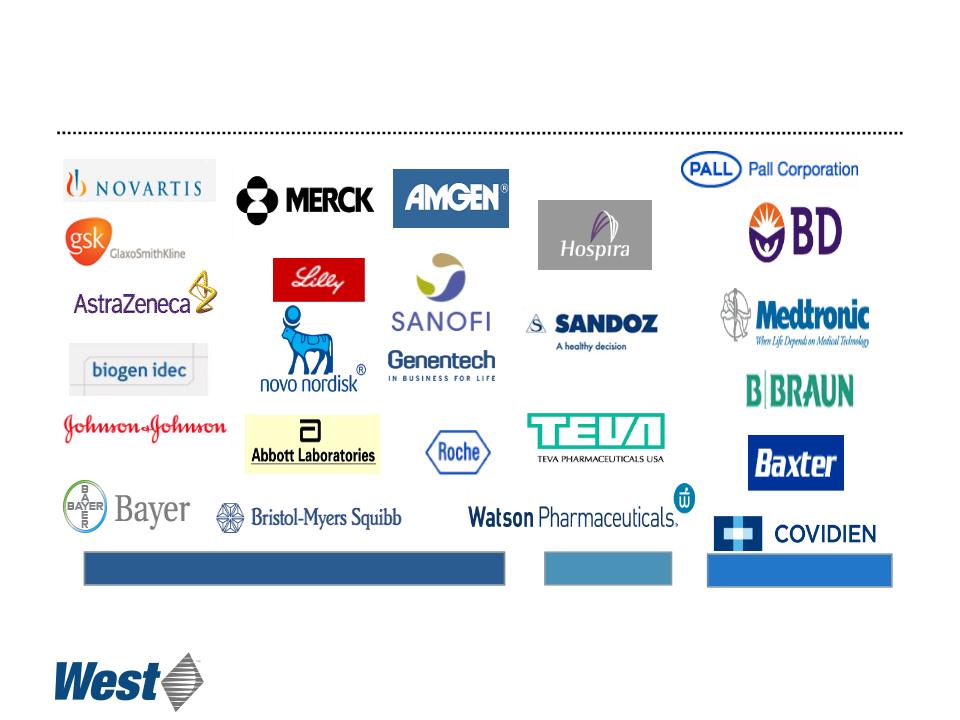
A Diverse, Stable Customer Base
(representative healthcare customers)
(representative healthcare customers)
PHARMACEUTICAL / BIOTECHNOLOGY
4
GENERIC
MEDICAL DEVICE

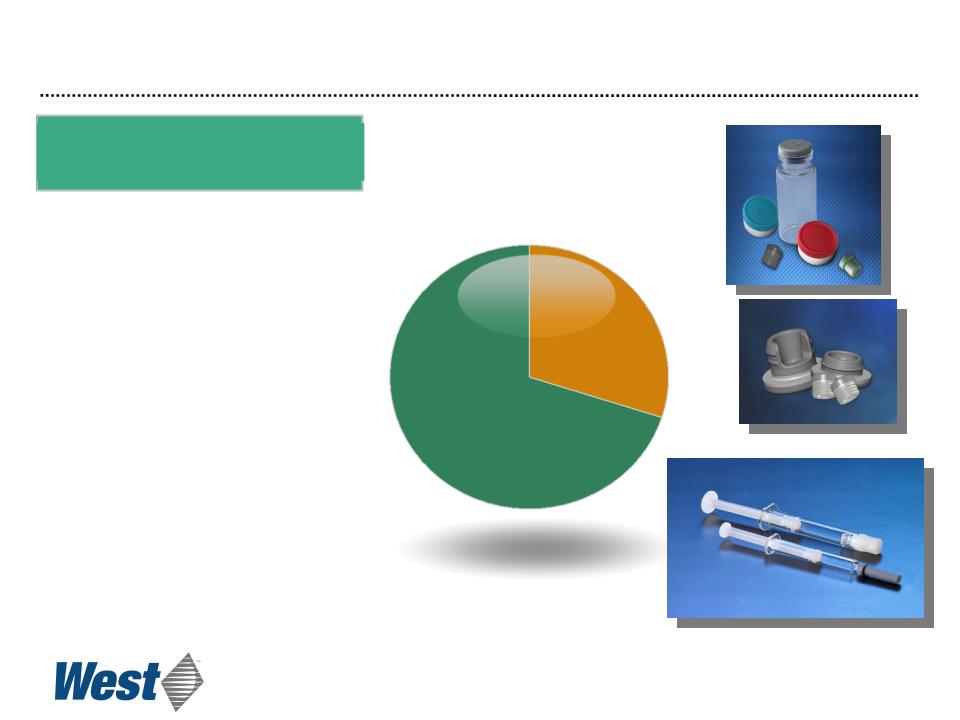
Business Segments
5
$857
$337
2011 Revenues
($ millions)
Delivery Systems
• Contract manufacturing base
• Multi-material
• Project management
• Automated assembly
• Regulated products
• Capabilities + IP = proprietary
delivery devices
delivery devices
• Proprietary devices are
expected to drive growth
expected to drive growth
Packaging Systems
• Established leadership
• Designed-in revenue base
• Diverse global capabilities
• High market shares
• Steady growth in base
• Increasing unit value of products
and geographic expansion are
expected to enhance growth
and geographic expansion are
expected to enhance growth

2011 Highlights
• 2011 results announced February 16, 2012:
– Sales increased 5.2%, excluding currency
– Gross and operating margin compressed by material costs, currency
– Mitigated by pricing actions and manufacturing savings
• Updated long-term financial targets on Q3 call
• China rubber facility under construction
• India land lease executed, approvals pending
• Vetter collaboration announced for CZ filling capacity
• Glass packaging compatibility issues generating strong interest in
alternative packaging materials, especially for biologics and other
high value drugs
alternative packaging materials, especially for biologics and other
high value drugs
6
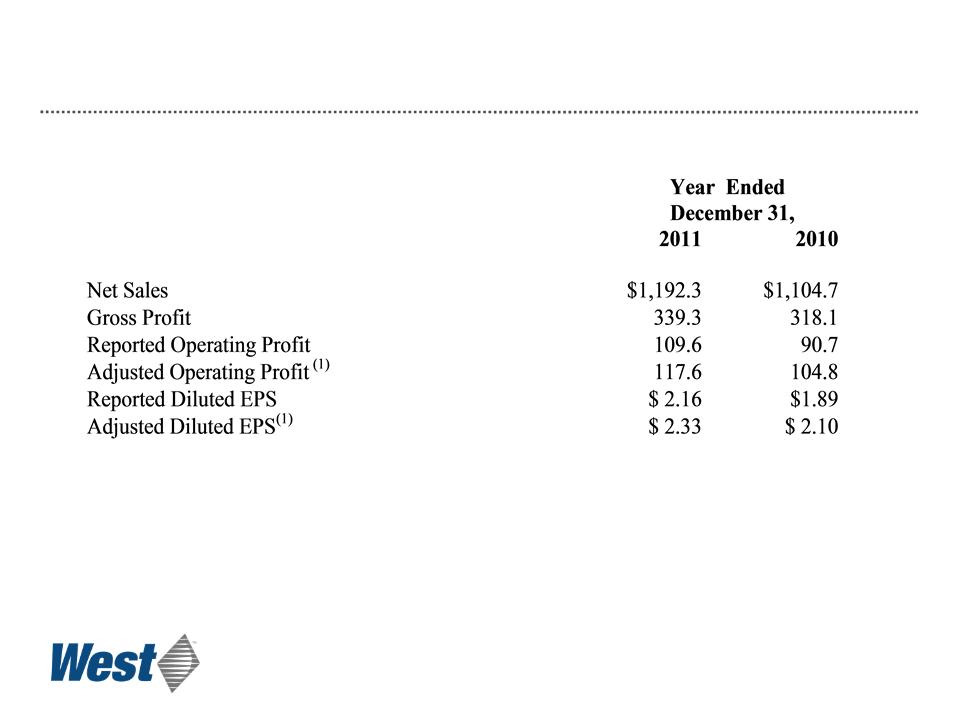
Summary Results
$ millions, except per-share data
$ millions, except per-share data
(1) These are Non-GAAP measures. For an explanation and reconciliation of these items, see “Non-GAAP Financial
Measures” and “Notes to Non-GAAP Financial Measures”(Slides 27 - 29) and “Cautionary Statement” (Slide 2).
Measures” and “Notes to Non-GAAP Financial Measures”(Slides 27 - 29) and “Cautionary Statement” (Slide 2).

Summary Balance Sheet Information
$ millions
$ millions
8

2012 Outlook and Challenges
• Expect 4% to 7% revenue growth in 2012, excluding currency
• Pharmaceutical and Device markets:
– Customer’s new product pipelines showing signs of strength
– Patent cliff front and center
– Shift to large molecule products continues
– Global shift in product sourcing (e.g., India generic growth)
– More demanding regulatory environment
• Continuing Fx and commodity price volatility
– Euro, European growth and sovereign debt
– Oil and regional political, civil and military turmoil
– Less predictable demand
9

|
($ millions, except EPS)
|
Estimated
2012 Revenue(1)
|
Estimated Gross
Profit %(1)(2) |
|
Pharmaceutical Packaging
Systems Segment |
$875 - $895
|
33.3%
|
|
|
|
|
|
Pharmaceutical Delivery
Systems Segment |
$340 - $350
|
20.1%
|
|
|
|
|
|
Consolidated
|
$1,215 - $1,245
|
29.6%
|
|
|
2012 Adjusted Diluted EPS(1)(2)
Estimate
|
|
|
|
$2.37- $2.55
|
|
(1) Guidance includes various currency exchange rate assumptions, most significantly the Euro at $1.32 for the remainder of 2012.
Actual results will vary as a result of variability of exchange rates, among other items.
Actual results will vary as a result of variability of exchange rates, among other items.

What will drive growth?
1
1
1
|
– Growth in emerging markets
– Escalating regulatory and
quality demands – Adding plants: China, India
– Expanding Westar® and
Envision® capacity, introducing NovaPure® components |
– Growth in combination products:
• safety, dosing accuracy, ease of
use, • deliver cost savings
• product differentiation
– Daikyo Crystal Zenith® products:
• Increasing awareness of glass
quality issues – Delivery technology platforms:
• SmartDose® electronic patch
injector • ConfiDose® auto-injector
– Reconstitution products
– Safety syringes
|
Daikyo Crystal Zenith® is a registered trademark of Daikyo Seiko, Ltd.
Packaging Systems
Delivery Systems

|
Category
|
Key Customers
|
Projected
Growth |
|
Diabetes
|
|
> 10 %
|
|
Oncology
|
|
> 10 %
|
|
Vaccines
|
|
> 10 %
|
|
Autoimmune
|
|
> 8%
|
|
Generics
|
|
>10%
|
IMS April 2010 Report; Business Insights 2009; GBI Research 2009
12
Therapeutic Category Growth Drivers
Packaging Segment Overview
13
2011 Revenue
($ millions)
Packaging Systems
• Market leader
• Strong recurring revenue base
• Global manufacturing
• Steady growth in base
• Future growth will be driven by:
added value per unit sold;
geographic expansion; and
growth in key therapeutic
segments
added value per unit sold;
geographic expansion; and
growth in key therapeutic
segments
$857

Pharmaceutical Packaging Systems
Packaging Components for Small Volume Parenterals
Packaging Components for Small Volume Parenterals
Plungers, Tip caps,
Needle shields for Glass
Syringes
Needle shields for Glass
Syringes
Plungers, lined seals
for Glass Cartridges
for Pens
for Glass Cartridges
for Pens
14
Primary packaging components (those that touch the drug) are typically
proprietary to West and are “designed into” customers’ drug products
proprietary to West and are “designed into” customers’ drug products

15
Standard High-Value
Products Products
Revenue Opportunity ($ per unit)
Plungers and
sleeve stoppers
sleeve stoppers
Stoppers
Seals
RU seals
Westar® RU

Faster Growth of High-Value Products
Pharmaceutical Packaging Systems
Pharmaceutical Packaging Systems
16

Delivery Systems Segment Overview
17
$337
• Contract manufacturing base
• Customer owned IP
• Project management
• Automated assembly
• Regulated products
• Proprietary Product
Development
Development
• West owned IP
• Multiple use platforms
• Focus on unmet needs for
biologics
biologics
2011 Revenue
($ millions)

Delivery Systems
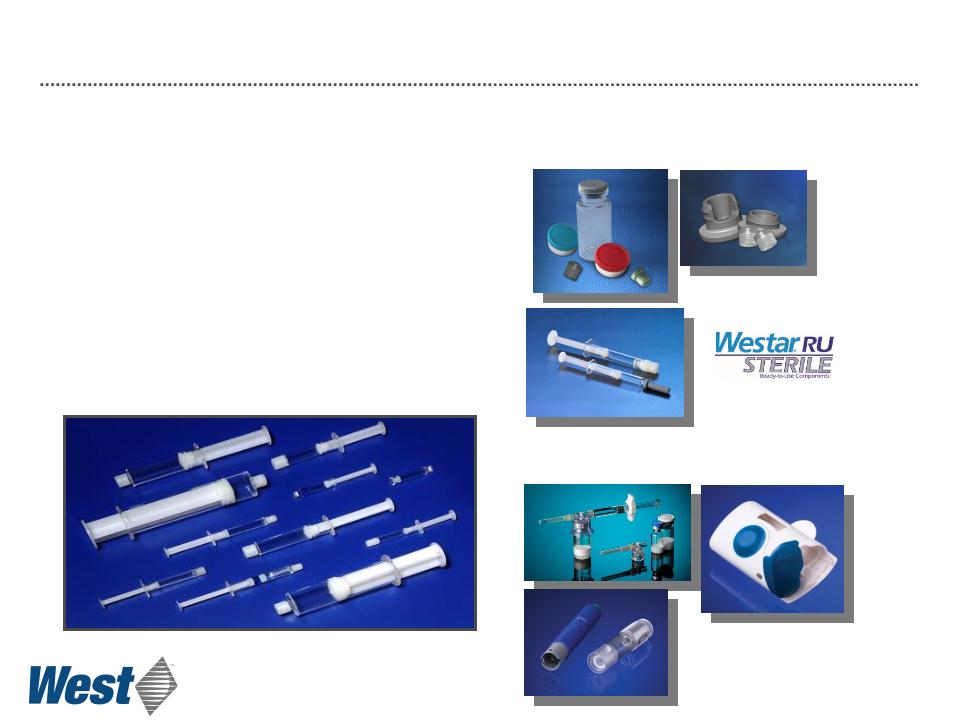
Daikyo Crystal Zenith®
Life-cycle Containment Solutions
Life-cycle Containment Solutions
18
West MixJect® and
Vial2Bag®
Vial2Bag®
Custom Manufacturing of
Components and Devices
Components and Devices
Proprietary Components, Devices and Systems
West ConfiDose®
auto-injector platform
technology
auto-injector platform
technology
SmartDose® electronic
patch injector platform
technology
patch injector platform
technology
Daikyo Crystal Zenith® is a registered trademark of Daikyo Seiko, Ltd.
19
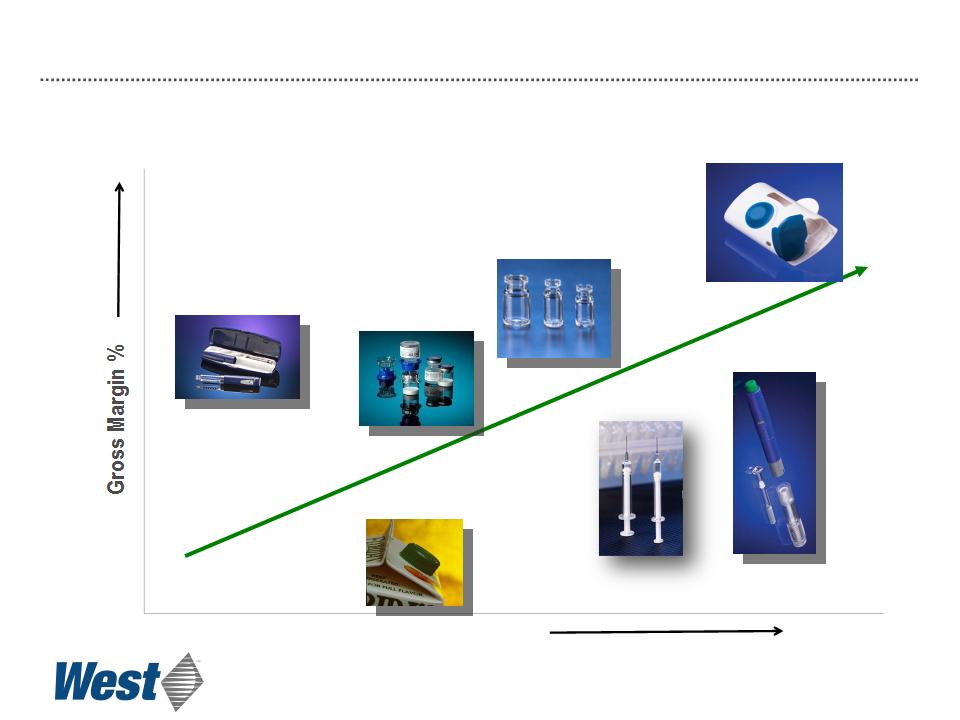
Revenue per-unit
Consumer product
manufacturing
manufacturing
Medical
device
manufacturing
device
manufacturing
Mix2Vial®
CZ vials
CZ Syringes
Effect of Increasing Proprietary Device Sales
Contract Manufacturing Proprietary Devices
Products
Auto-injector platform
technology
technology
Electronic patch
injector technology
injector technology

Concerns With Glass Syringes
• Interaction with sensitive biologics
• Protein aggregation (silicone oil)
• Residual chemicals (tungsten, glue)
• Glass flakes
• Dimensional variation
• Variable silicone distribution
• High Cost of Quality
• Breakage
• In process/handling
• Within auto-injector systems
Siliconized Glass Syringe
Crystal Zenith Syringe
20

Daikyo CZ Solution
with Daikyo Flurotec® Barrier Film
with Daikyo Flurotec® Barrier Film
• Reduces:
– drug exposure to extractables
– risk of protein aggregation caused by silicone oil in the drug product
– returns and in-process clean-ups caused by broken glass
– risk of delamination and glass-particulate contamination
• Consistent piston release and travel forces without using silicone oil
21
Flurotec® is a registered trademark of Daikyo Seiko, Ltd.

Pharma Industry Drug Life-Cycle
Management
Management
Phase I
Phase II
Phase III
Post-Market Life Cycle Management
8 - 10 years
2 - 3 years
2 - 3 years
Regulatory
Approval
Discovery
22

SmartDose®
Electronic Patch Injector Technology Platform
Programmed by PDA or PC
Dose may be customized
Applied and activated by patient
23
• Controlled, subcutaneous, micro-infusion delivery
of high volumes and high viscosity drugs
of high volumes and high viscosity drugs
• Prefilled cartridge, no need for user filling
• Based on Daikyo CZ cartridge
• Compact
• Hidden needle for safety
• Single push-button operation
Prototype Operation

24
Selected Factors That Impact Margin % in 2012(3)
(3) See “Cautionary Statement” on slide 2. This is not an exclusive list of risks associated with
forward looking statements made in or in connection with these materials.
forward looking statements made in or in connection with these materials.

Our Long-Term Focus
• Pharmaceutical Packaging Systems
– Organic growth of 3-5% per year
– Margin expansion from efficiency, product mix
– Capital investments target enhanced quality and value
• Pharmaceutical Delivery Systems
– Deliver the potential of Daikyo CZ products
– Stronger mix of healthcare-consumable contract manufacturing
– Grow proprietary safety and delivery systems
• Financial discipline
– Operating cash flow supports R&D and capital spending
– Deliver returns (ROIC) that regularly exceed cost of capital (WACC)
– Maintain quarterly dividend
– Align incentives with financial performance and value creation
25
26
Pharmaceutical Packaging Systems
Pharmaceutical Delivery Systems
• Strong competitive position
• Stability with growth potential
• New products well positioned to
meet future market needs
meet future market needs
• The financial strength to invest
Summary

27
|
|
As Reported
December 31,
2011
|
Restructuring
& related charges |
Acquisition-
related contingenci es |
Special
separation benefits |
Discrete
tax items |
Non-GAAP
December 31,
2011
|
|
Operating profit
|
$109.6
|
$5.3
|
($0.2)
|
$2.9
|
$-
|
$117.6
|
|
Interest expense, net
|
16.9
|
-
|
-
|
-
|
-
|
16.9
|
|
Income before income taxes
|
92.7
|
5.3
|
(0.2)
|
2.9
|
-
|
100.7
|
|
Income tax expense
|
23.5
|
1.8
|
-
|
1.1
|
(1.4)
|
25.0
|
|
Equity in net income of affiliated
companies |
6.3
|
-
|
-
|
-
|
-
|
6.3
|
|
Net income
|
$75.5
|
$3.5
|
($0.2)
|
$1.8
|
$1.4
|
$82.0
|
|
|
|
|
|
|
|
|
|
|
|
|
|
|
|
|
|
Net income per diluted share
|
$2.16
|
$0.09
|
($0.01)
|
$0.05
|
$0.04
|
$2.33
|
As Reported
December 31,
2010
Restructuring
and related
charges
and related
charges
Acquisition-
related
contingencies
related
contingencies
Discrete
tax items
tax items
Non-GAAP
December 31,
2010
Operating profit
$90.7
$15.9
($1.8)
$-
$104.8
Interest expense, net
16.2
-
-
-
16.2
Income before income taxes
74.5
15.9
(1.8)
-
88.6
Income tax expense
13.6
5.7
(0.2)
1.1
20.2
Equity in net income of affiliated companies
4.4
-
-
-
4.4
Net income
$65.3
$10.2
($1.6)
($1.1)
$72.8
Net income per diluted share
$1.89
$0.28
($0.04)
($0.03)
$2.10
WEST PHARMACEUTICAL SERVICES
NON-GAAP MEASURES (UNAUDITED)
(in millions, except per share data)
TWELVE MONTHS ENDED DECEMBER 31, 2011:
TWELVE MONTHS ENDED DECEMBER 31, 2010:
Please refer to the “Notes to Non-GAAP financial measures” for more information.
Non-GAAP measures are intended to explain or aid in the use of, not as a substitute for, the related GAAP financial measure.

28
For additional details, please see the attached financial schedules and Cautionary Statement.
Use of Non-GAAP Financial Measures- The preceding discussion of our results and the accompanying financial tables use non-
GAAP financial measures. West believes that these non-GAAP measures of financial results provide useful information to
management and investors regarding certain business trends relating to West’s financial condition, results of operations and the
Company’s overall performance. Our executive management team uses adjusted operating profit and adjusted diluted EPS to
evaluate the performance of the Company in terms of profitability and to compare operating results to prior periods. Adjusted
operating profit is also used to evaluate changes in the operating results of each segment and to allocate resources to our
segments. The Company believes that the use of these non-GAAP financial measures provides an additional tool for investors to
use in evaluating ongoing operating results and trends in comparing its financial measures with other companies.
Our executive management does not consider such non-GAAP measures in isolation or as an alternative to such measures
determined in accordance with GAAP. The principal limitation of such non-GAAP financial measures is that they exclude significant
expenses and income that are required by GAAP to be recorded. In addition, they are subject to inherent limitations as they reflect
the exercise of judgment by management about which items are excluded from the non-GAAP financial measures. In order to
compensate for these limitations, our executive management presents its non-GAAP financial measures in connection with its
GAAP results. We urge investors and potential investors to review the reconciliation of our non-GAAP financial measures to the
comparable GAAP financial measures, and not rely on any single financial measure to evaluate the Company’s business.
In calculating adjusted operating profit and adjusted diluted EPS, we exclude the impact of items that are not considered
representative of ongoing operations. Such items include restructuring and related costs, certain asset impairments, other
specifically identified gains or losses, and discrete income tax items. A reconciliation of these adjusted non-GAAP measures to the
comparable GAAP financial measures is included in the preceding tables.
The following is a description of the items excluded from adjusted operating profit and adjusted diluted EPS:
Restructuring and related charges: During the three and twelve months ended December 31, 2011, we incurred restructuring
and related charges of $1.0 million and $5.3 million, respectively, associated with the restructuring plan announced in December
2010. Charges associated with the plan in 2011 were primarily associated with the 2011 closure of a plant in the United States, a
reduction of operations at a manufacturing facility in England, and the elimination of certain operational and administrative functions
in other locations.
During the three and twelve months ended December 31, 2010, we incurred restructuring and related charges of $14.7 million and
$15.9 million, respectively. The majority of these charges related to the restructuring plan that our Board of Directors approved in
December 2010, which was designed to reduce our cost structure and improve operating efficiency.
$15.9 million, respectively. The majority of these charges related to the restructuring plan that our Board of Directors approved in
December 2010, which was designed to reduce our cost structure and improve operating efficiency.
(continued on next slide)
SUPPLEMENTAL INFORMATION AND NOTES TO NON-GAAP FINANCIAL MEASURES

29
|
|
Full Year 2012 Guidance (a)
|
|
|
Diluted Earnings Per Share
|
|
Adjusted guidance
|
$2.37 to $2.55
|
|
Restructuring, net of tax
|
(0.05) to (0.03)
|
|
Reported guidance
|
$2.32 to $2.52
|
(continued from prior slide)
Acquisition-related contingencies: During the three and twelve months ended December 31, 2011, we increased the liability for
contingent consideration related to our 2010 acquisition of technology used in our SmartDose™ electronic patch injector system by $0.2
million and $0.5 million, respectively. During the twelve months ended December 31, 2011, we also reduced the liability for contingent
consideration related to our July 2009 eris™ safety syringe system acquisition by $0.8 million, bringing the liability balance to zero. This
reduction reflects our assessment that none of the contractual operating targets will be achieved over the earnout period, which ends in
2014.
During the twelve months ended December 31, 2010, we reduced the liability for contingent consideration related to our July 2009 eris™
acquisition by $1.8 million to reflect our revised assessment of fair value, as affected by a reduction in the probability of attaining certain
milestones over the next four years.
acquisition by $1.8 million to reflect our revised assessment of fair value, as affected by a reduction in the probability of attaining certain
milestones over the next four years.
Special separation benefits: During the three and twelve months ended December 31, 2011, we incurred special separation benefits of
$0.8 million and $2.9 million, respectively, related to the retirement of our former President and Chief Operating Officer. These costs
consisted primarily of stock-based compensation expense and a settlement loss related to one of our non-qualified defined benefit
pension plans. The respective equity compensation arrangements were amended to allow certain of his awards to continue to vest over
the original vesting period instead of being forfeited upon separation, resulting in a revaluation of the awards and acceleration of
expense.
Discrete tax items: During the three and twelve months ended December 31, 2011, we recognized discrete tax charges of $0.6 million
and $1.4 million, respectively, the majority of which resulted from changes in certain international tax rates that affected our deferred tax
carrying values and the finalization of prior year tax returns.
and $1.4 million, respectively, the majority of which resulted from changes in certain international tax rates that affected our deferred tax
carrying values and the finalization of prior year tax returns.
During the three and twelve months ended December 31, 2010, we recognized $1.1 million in net discrete tax benefits, the majority of
which resulted from the reversal of liabilities for unrecognized tax benefits.
which resulted from the reversal of liabilities for unrecognized tax benefits.
•Reconciliation of 2012 Adjusted Guidance to 2012 Reported Guidance is as follows:
(a) Guidance includes various currency exchange rate assumptions, most significantly the Euro at $1.32 for 2012. Actual results will vary as a result of variability of
exchange rates.
exchange rates.
SUPPLEMENTAL INFORMATION AND NOTES TO NON-GAAP FINANCIAL MEASURES

WEST PHARMACEUTICAL SERVICES, INC.
Solutions for Injectable Drug Delivery NYSE:WST www.westpharma.com
© 2012 by West Pharmaceutical Services, Inc., Lionville, PA.
All rights reserved. This material is protected by copyright. No part of it may be reproduced, stored in a retrieval system, or transmitted in any
form or by any means, electronic, mechanical, photocopying or otherwise, without written permission of West Pharmaceutical Services, Inc.. All
trademarks and registered trademarks are property of West Pharmaceutical Services, Inc., unless noted otherwise.
form or by any means, electronic, mechanical, photocopying or otherwise, without written permission of West Pharmaceutical Services, Inc.. All
trademarks and registered trademarks are property of West Pharmaceutical Services, Inc., unless noted otherwise.