Attached files
| file | filename |
|---|---|
| 8-K - FORM 8-K - Kennedy-Wilson Holdings, Inc. | d314298d8k.htm |
| EX-99.1 - PRESS RELEASE - Kennedy-Wilson Holdings, Inc. | d314298dex991.htm |
Exhibit 99.2

Fourth Quarter 2011 Supplemental Financial Information
TABLE OF CONTENTS
Pro-Rata Consolidated
Statements of Operations: 3
Year ended 12/31/2011 and 12/31/2010 (Non-GAAP)
Adjusted EBITDA (Non-GAAP) 4
EBITDA by Segment (Non-GAAP) 5
Balance Sheet 6
Capitalization Summary 7
Investment Account Comparison 8
Investment Account Summary 9
Operating Performance Summary: Multifamily 10
Operating Performance Summary: Office 11
Operating Performance Summary: Loans, Loan Pools 12
Operating Performance Summary: Residential, Other 13
Debt Schedule 14
Note about Non-GAAP financial information included in this presentation
In addition to the results reported in accordance with U.S. generally accepted accounting principles (“GAAP”) included within this presentation, Kennedy Wilson Holdings, Inc. (“Kennedy Wilson”) has provided certain information, which includes non-GAAP financial measures (pro-rata consolidated statements of operation, EBITDA and Adjusted
[GRAPHIC APPEARS HERE]
EBITDA). Such information is reconciled to its closest GAAP measure in accordance with the rules of the Securities and Exchange Commission and is included within this presentation. Management believes that these non-GAAP financial measures are useful to both management and Kennedy Wilson’s shareholders in their analysis of the business and operating performance of Kennedy Wilson. Management also uses this information for operational planning and decision-making purposes. Non-GAAP financial measures are not and should not be considered a substitute for any GAAP measures. Additionally, non-GAAP financial measures as presented by Kennedy Wilson may not be comparable to similarly titled measures reported by other companies.
| 2 |
|
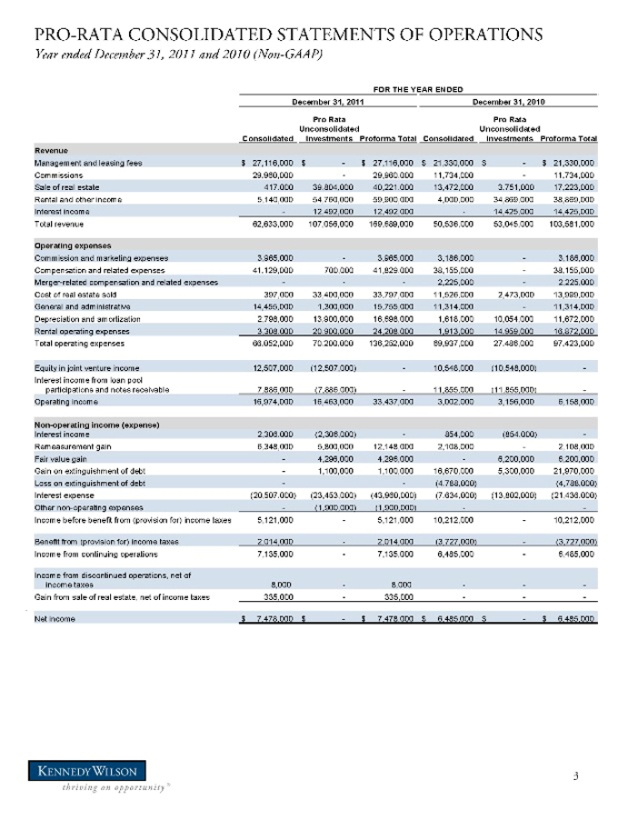
PRO-RATA CONSOLIDATED STATEMENTS OF OPERATIONS
Year ended December 31, 2011 and 2010 (Non-GAAP)
FOR THE YEAR ENDED
December 31, 2011 December 31, 2010
Pro Rata Pro Rata
Unconsolidated Unconsolidated
Consolidated Investments Proforma Total Consolidated Investments Proforma Total
Revenue
Management and leasing fees $ 27,116,000 $—$ 27,116,000 $ 21,330,000 $—$ 21,330,000
Commissions 29,960,000—29,960,000 11,734,000—11,734,000
Sale of real estate 417,000 39,804,000 40,221,000 13,472,000 3,751,000 17,223,000
Rental and other income 5,140,000 54,760,000 59,900,000 4,000,000 34,869,000 38,869,000
Interest income—12,492,000 12,492,000—14,425,000 14,425,000
Total revenue 62,633,000 107,056,000 169,689,000 50,536,000 53,045,000 103,581,000
Operating expenses
Commission and marketing expenses 3,965,000—3,965,000 3,186,000—3,186,000
Compensation and related expenses 41,129,000 700,000 41,829,000 38,155,000—38,155,000
Merger-related compensation and related expenses—— 2,225,000—2,225,000
Cost of real estate sold 397,000 33,400,000 33,797,000 11,526,000 2,473,000 13,999,000
General and administrative 14,455,000 1,300,000 15,755,000 11,314,000—11,314,000
Depreciation and amortization 2,798,000 13,900,000 16,698,000 1,618,000 10,054,000 11,672,000
Rental operating expenses 3,308,000 20,900,000 24,208,000 1,913,000 14,959,000 16,872,000
Total operating expenses 66,052,000 70,200,000 136,252,000 69,937,000 27,486,000 97,423,000
Equity in joint venture income 12,507,000(12,507,000)—10,548,000(10,548,000) -
Interest income from loan pool
participations and notes receivable 7,886,000(7,886,000)—11,855,000(11,855,000) -
Operating income 16,974,000 16,463,000 33,437,000 3,002,000 3,156,000 6,158,000
Non-operating income (expense)
Interest income 2,306,000(2,306,000)—854,000(854,000) -
Remeasurement gain 6,348,000 5,800,000 12,148,000 2,108,000—2,108,000
Fair value gain—4,296,000 4,296,000—6,200,000 6,200,000
Gain on extinguishment of debt—1,100,000 1,100,000 16,670,000 5,300,000 21,970,000
Loss on extinguishment of debt—-(4,788,000)(4,788,000)
Interest expense(20,507,000)(23,453,000)(43,960,000)(7,634,000)(13,802,000)(21,436,000)
Other non-operating expenses -(1,900,000)(1,900,000)—-
Income before benefit from (provision for) income taxes 5,121,000—5,121,000 10,212,000—10,212,000
Benefit from (provision for) income taxes 2,014,000—2,014,000(3,727,000) -(3,727,000)
Income from continuing operations 7,135,000—7,135,000 6,485,000—6,485,000
Income from discontinued operations, net of
income taxes 8,000—8,000——
Gain from sale of real estate, net of income taxes 335,000—335,000——
Net income $ 7,478,000 $—$ 7,478,000 $ 6,485,000 $—$ 6,485,000
| 3 |
|
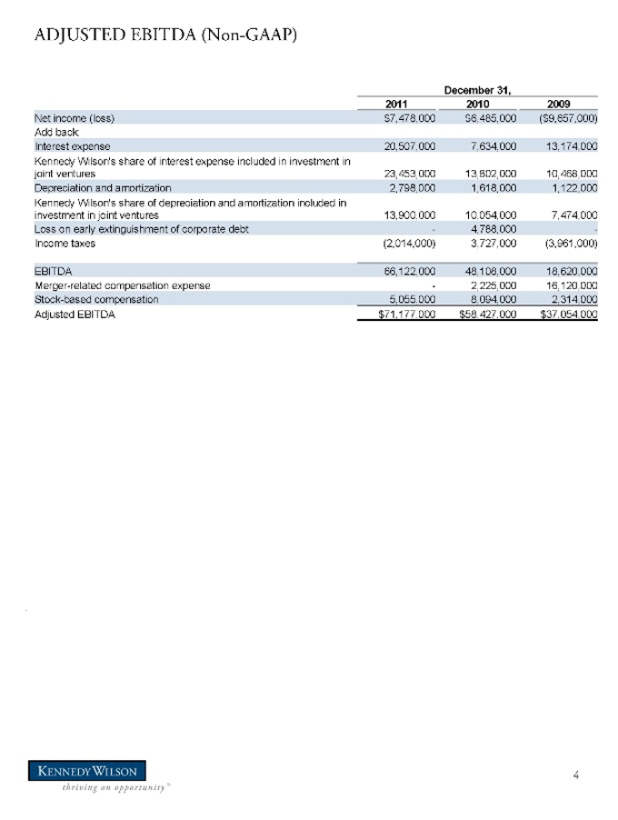
ADJUSTED EBITDA (Non-GAAP)
December 31,
2011 2010 2009
Net income (loss) $7,478,000 $6,485,000($9,657,000)
Add back:
Interest expense 20,507,000 7,634,000 13,174,000
Kennedy Wilson’s share of interest expense included in investment in
joint ventures 23,453,000 13,802,000 10,468,000
Depreciation and amortization 2,798,000 1,618,000 1,122,000
Kennedy Wilson’s share of depreciation and amortization included in
investment in joint ventures 13,900,000 10,054,000 7,474,000
Loss on early extinguishment of corporate debt—4,788,000 -
Income taxes(2,014,000) 3,727,000(3,961,000)
EBITDA 66,122,000 48,108,000 18,620,000
Merger-related compensation expense—2,225,000 16,120,000
Stock-based compensation 5,055,000 8,094,000 2,314,000
Adjusted EBITDA $71,177,000 $58,427,000 $37,054,000
| 4 |
|
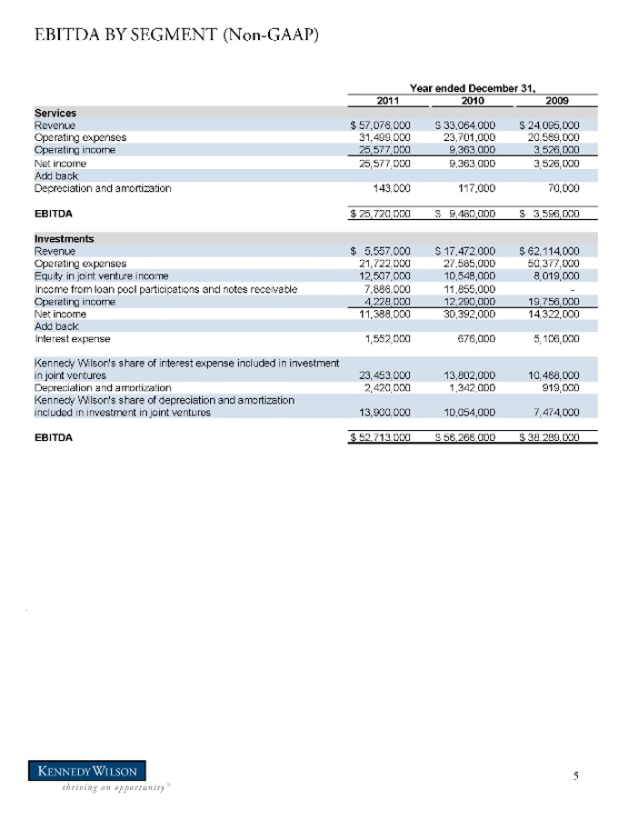
EBITDA BY SEGMENT (Non-GAAP)
Year ended December 31,
2011 2010 2009
Services
Revenue $ 57,076,000 $ 33,064,000 $ 24,095,000
Operating expenses 31,499,000 23,701,000 20,569,000
Operating income 25,577,000 9,363,000 3,526,000
Net income 25,577,000 9,363,000 3,526,000
Add back:
Depreciation and amortization 143,000 117,000 70,000
EBITDA $ 25,720,000 $ 9,480,000 $ 3,596,000
Investments
Revenue $ 5,557,000 $ 17,472,000 $ 62,114,000
Operating expenses 21,722,000 27,585,000 50,377,000
Equity in joint venture income 12,507,000 10,548,000 8,019,000
Income from loan pool participations and notes receivable 7,886,000 11,855,000 -
Operating income 4,228,000 12,290,000 19,756,000
Net income 11,388,000 30,392,000 14,322,000
Add back:
Interest expense 1,552,000 676,000 5,106,000
Kennedy Wilson’s share of interest expense included in investment
in joint ventures 23,453,000 13,802,000 10,468,000
Depreciation and amortization 2,420,000 1,342,000 919,000
Kennedy Wilson’s share of depreciation and amortization
included in investment in joint ventures 13,900,000 10,054,000 7,474,000
EBITDA $ 52,713,000 $ 56,266,000 $ 38,289,000
| 5 |
|
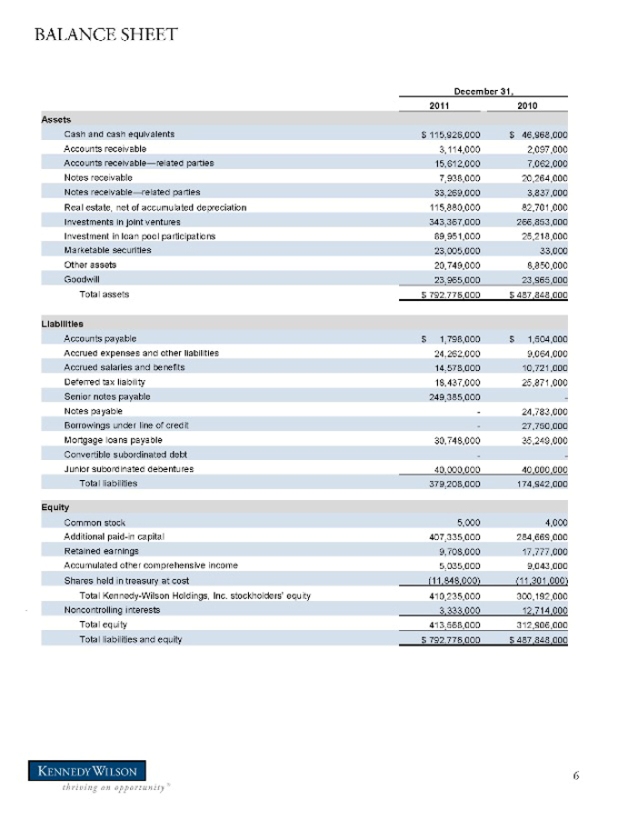
BALANCE SHEET
December 31,
2011 2010
Assets
Cash and cash equivalents $ 115,926,000 $ 46,968,000
Accounts receivable 3,114,000 2,097,000
Accounts receivable—related parties 15,612,000 7,062,000
Notes receivable 7,938,000 20,264,000
Notes receivable—related parties 33,269,000 3,837,000
Real estate, net of accumulated depreciation 115,880,000 82,701,000
Investments in joint ventures 343,367,000 266,853,000
Investment in loan pool participations 89,951,000 25,218,000
Marketable securities 23,005,000 33,000
Other assets 20,749,000 8,850,000
Goodwill 23,965,000 23,965,000
Total assets $ 792,776,000 $ 487,848,000
Liabilities
Accounts payable $ 1,798,000 $ 1,504,000
Accrued expenses and other liabilities 24,262,000 9,064,000
Accrued salaries and benefits 14,578,000 10,721,000
Deferred tax liability 18,437,000 25,871,000
Senior notes payable 249,385,000 -
Notes payable—24,783,000
Borrowings under line of credit—27,750,000
Mortgage loans payable 30,748,000 35,249,000
Convertible subordinated debt—-
Junior subordinated debentures 40,000,000 40,000,000
Total liabilities 379,208,000 174,942,000
Equity
Common stock 5,000 4,000
Additional paid-in capital 407,335,000 284,669,000
Retained earnings 9,708,000 17,777,000
Accumulated other comprehensive income 5,035,000 9,043,000
Shares held in treasury at cost(11,848,000)(11,301,000)
Total Kennedy-Wilson Holdings, Inc. stockholders’ equity 410,235,000 300,192,000
Noncontrolling interests 3,333,000 12,714,000
Total equity 413,568,000 312,906,000
Total liabilities and equity $ 792,776,000 $ 487,848,000
[GRAPHIC APPEARS HERE]
| 6 |
|
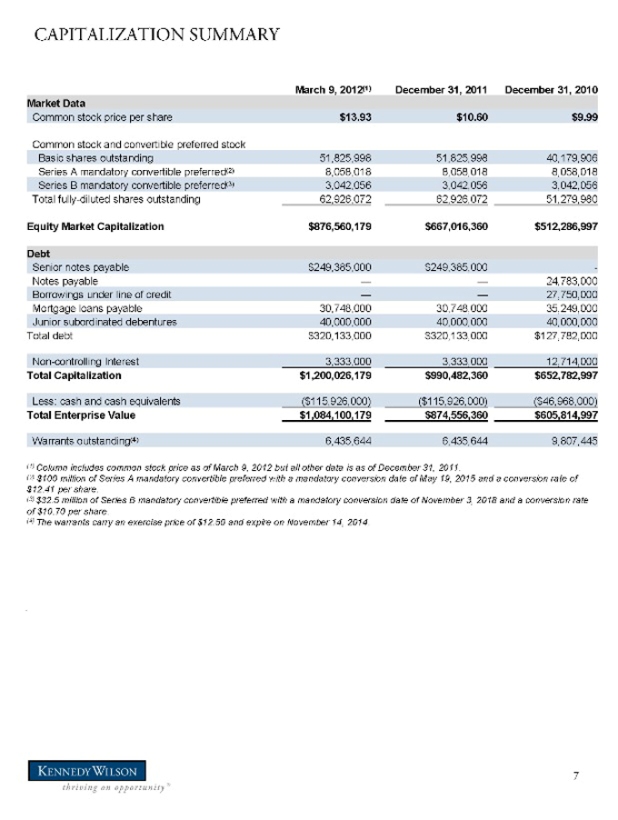
CAPITALIZATION SUMMARY
March 9, 2012(1) December 31, 2011 December 31, 2010
Market Data
Common stock price per share $13.93 $10.60 $9.99
Common stock and convertible preferred stock
Basic shares outstanding 51,825,998 51,825,998 40,179,906
Series A mandatory convertible preferred(2) 8,058,018 8,058,018 8,058,018
Series B mandatory convertible preferred(3) 3,042,056 3,042,056 3,042,056
Total fully-diluted shares outstanding 62,926,072 62,926,072 51,279,980
Equity Market Capitalization $876,560,179 $667,016,360 $512,286,997
Debt
Senior notes payable $249,385,000 $249,385,000 -
Notes payable — — 24,783,000
Borrowings under line of credit — — 27,750,000
Mortgage loans payable 30,748,000 30,748,000 35,249,000
Junior subordinated debentures 40,000,000 40,000,000 40,000,000
Total debt $320,133,000 $320,133,000 $127,782,000
Non-controlling Interest 3,333,000 3,333,000 12,714,000
Total Capitalization $1,200,026,179 $990,482,360 $652,782,997
Less: cash and cash equivalents($115,926,000)($115,926,000)($46,968,000)
Total Enterprise Value $1,084,100,179 $874,556,360 $605,814,997
Warrants outstanding(4) 6,435,644 6,435,644 9,807,445
| (1) |
|
Column includes common stock price as of March 9, 2012 but all other data is as of December 31, 2011. |
| (2) |
|
$100 million of Series A mandatory convertible preferred with a mandatory conversion date of May 19, 2015 and a conversion rate of $12.41 per share. |
| (3) |
|
$32.5 million of Series B mandatory convertible preferred with a mandatory conversion date of November 3, 2018 and a conversion rate of $10.70 per share. |
| (4) |
|
The warrants carry an exercise price of $12.50 and expire on November 14, 2014. |
| 7 |
|
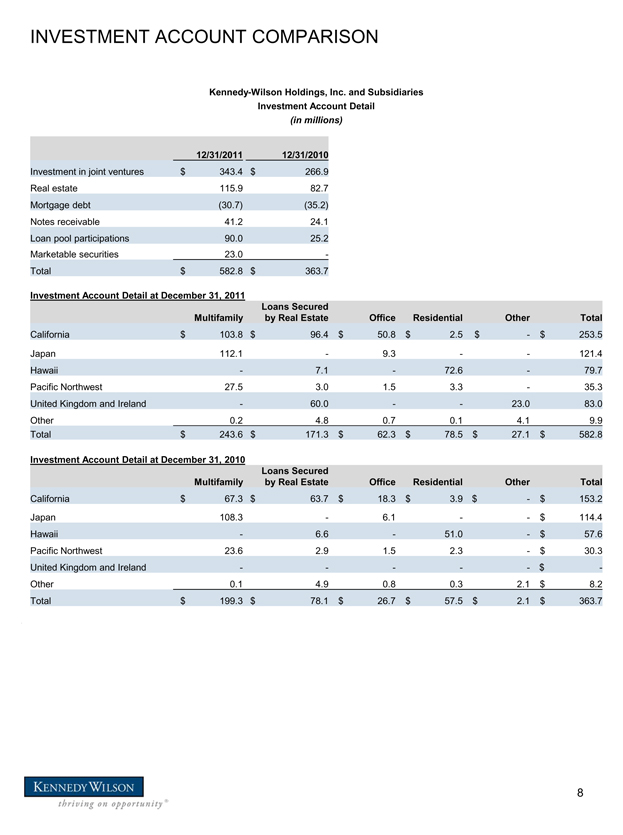
INVESTMENT ACCOUNT COMPARISON
Kennedy-Wilson Holdings, Inc. and Subsidiaries Investment Account Detail
(in millions)
12/31/2011 12/31/2010
Investment in joint ventures $ 343.4 $ 266.9 Real estate 115.9 82.7 Mortgage debt (30.7) (35.2) Notes receivable 41.2 24.1 Loan pool participations 90.0 25.2 Marketable securities 23.0 -Total $ 582.8 $ 363.7
Investment Account Detail at December 31, 2011
Loans Secured
Multifamily by Real Estate Office Residential Other Total
California $ 103.8 $ 96.4 $ 50.8 $ 2.5 $ - $ 253.5
Japan 112.1 - 9.3 - - 121.4 Hawaii - 7.1 - 72.6 - 79.7 Pacific Northwest 27.5 3.0 1.5 3.3 - 35.3 United Kingdom and Ireland - 60.0 - - 23.0 83.0 Other 0.2 4.8 0.7 0.1 4.1 9.9 Total $ 243.6 $ 171.3 $ 62.3 $ 78.5 $ 27.1 $ 582.8
Investment Account Detail at December 31, 2010
Loans Secured
Multifamily by Real Estate Office Residential Other Total
California $ 67.3 $ 63.7 $ 18.3 $ 3.9 $ - $ 153.2 Japan 108.3 - 6.1 - - $ 114.4 Hawaii - 6.6 - 51.0 - $ 57.6 Pacific Northwest 23.6 2.9 1.5 2.3 - $ 30.3 United Kingdom and Ireland - - - - - $ -Other 0.1 4.9 0.8 0.3 2.1 $ 8.2 Total $ 199.3 $ 78.1 $ 26.7 $ 57.5 $ 2.1 $ 363.7
8
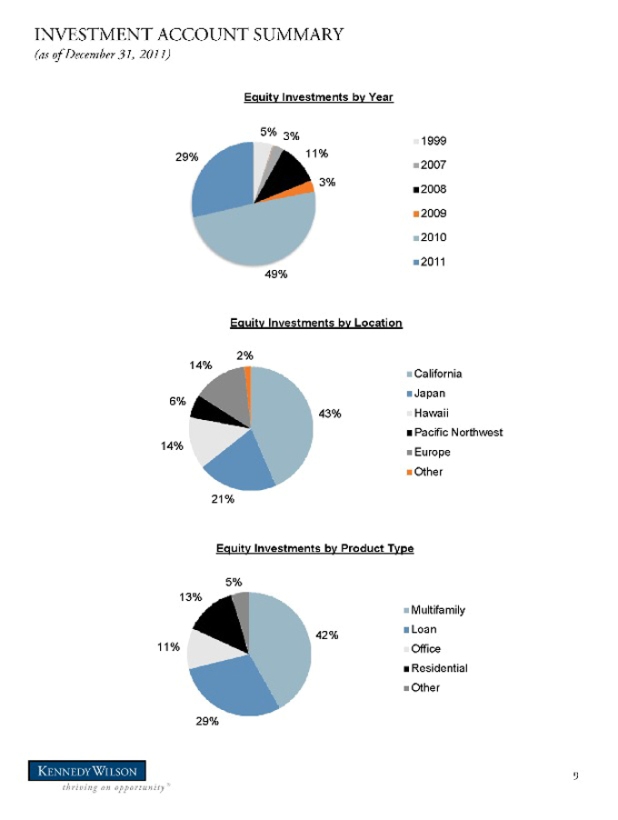
INVESTMENT ACCOUNT SUMMARY
(as of December 31, 2011)
Equity Investments by Year
5% 3% 1999
29% 11%
2007
3% 2008
2009
2010
2011
49%
[GRAPHIC APPEARS HERE]
Equity Investments by Location
2%
14% California
6% Japan
43% Hawaii
Pacific Northwest
14% Europe
Other
21%
Equity Investments by Product Type
5%
13%
Multifamily
42% Loan
11% Office
Residential
Other
[GRAPHIC APPEARS HERE] [GRAPHIC APPEARS HERE] [GRAPHIC APPEARS HERE] [GRAPHIC APPEARS HERE] [GRAPHIC APPEARS HERE] [GRAPHIC APPEARS HERE] [GRAPHIC APPEARS HERE] [GRAPHIC APPEARS HERE]
29%
9
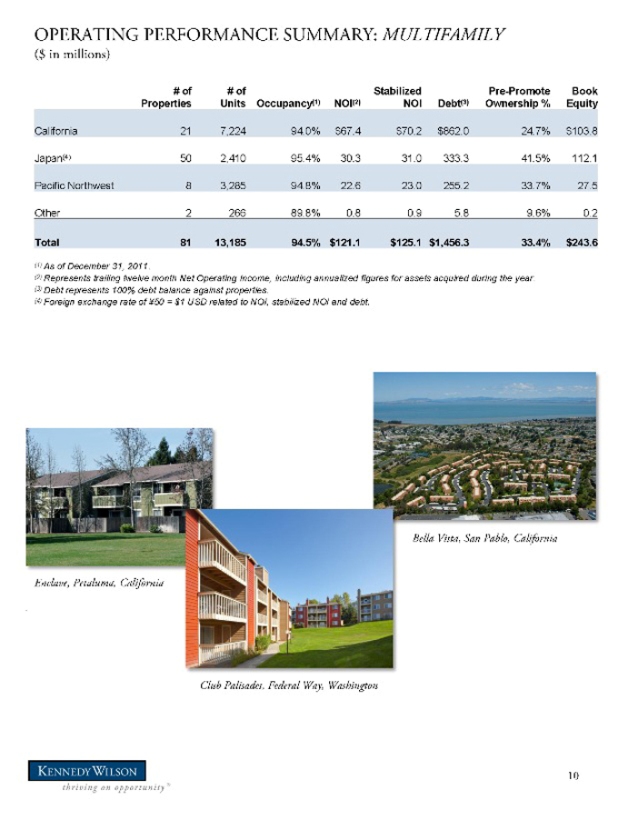
OPERATING PERFORMANCE SUMMARY: MULTIFAMILY
($ in millions)
# of # of Stabilized Pre-Promote Book
Properties Units Occupancy(1) NOI(2) NOI Debt(3) Ownership % Equity
California 21 7,224 94.0% $67.4 $70.2 $862.0 24.7% $103.8
Japan(4) 50 2,410 95.4% 30.3 31.0 333.3 41.5% 112.1
Pacific Northwest 8 3,285 94.8% 22.6 23.0 255.2 33.7% 27.5
Other 2 266 89.8% 0.8 0.9 5.8 9.6% 0.2
Total 81 13,185 94.5% $121.1 $125.1 $1,456.3 33.4% $243.6
| (1) |
|
As of December 31, 2011. |
| (2) |
|
Represents trailing twelve month Net Operating Income, including annualized figures for assets acquired during the year. |
| (3) |
|
Debt represents 100% debt balance against properties. |
| (4) |
|
Foreign exchange rate of ¥50 = $1 USD related to NOI, stabilized NOI and debt. |
Enclave, Petaluma, California
Bella Vista, San Pablo, California
Club Palisades, Federal Way, Washington
10
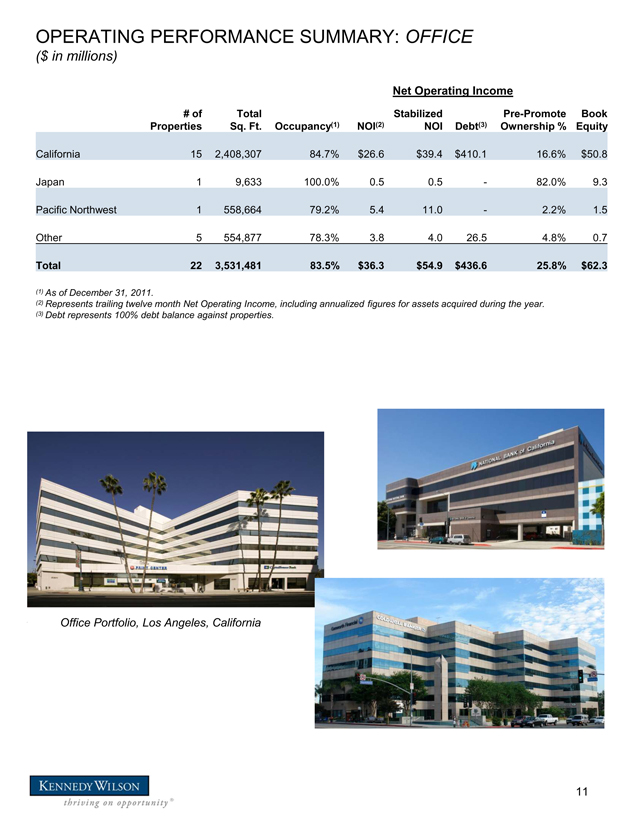
OPERATING PERFORMANCE SUMMARY: OFFICE
($ in millions)
Net Operating Income
# of Total Stabilized Pre-Promote Book Properties Sq. Ft. Occupancy(1) NOI(2) NOI Debt(3) Ownership % Equity
California 15 2,408,307 84.7% $26.6 $39.4 $410.1 16.6% $50.8 Japan 1 9,633 100.0% 0.5 0.5 - 82.0% 9.3 Pacific Northwest 1 558,664 79.2% 5.4 11.0 - 2.2% 1.5 Other 5 554,877 78.3% 3.8 4.0 26.5 4.8% 0.7
Total 22 3,531,481 83.5% $36.3 $54.9 $436.6 25.8% $62.3
(1) As of December 31, 2011.
(2) Represents trailing twelve month Net Operating Income, including annualized figures for assets acquired during the year. (3) Debt represents 100% debt balance against properties.
Office Portfolio, Los Angeles, California
11
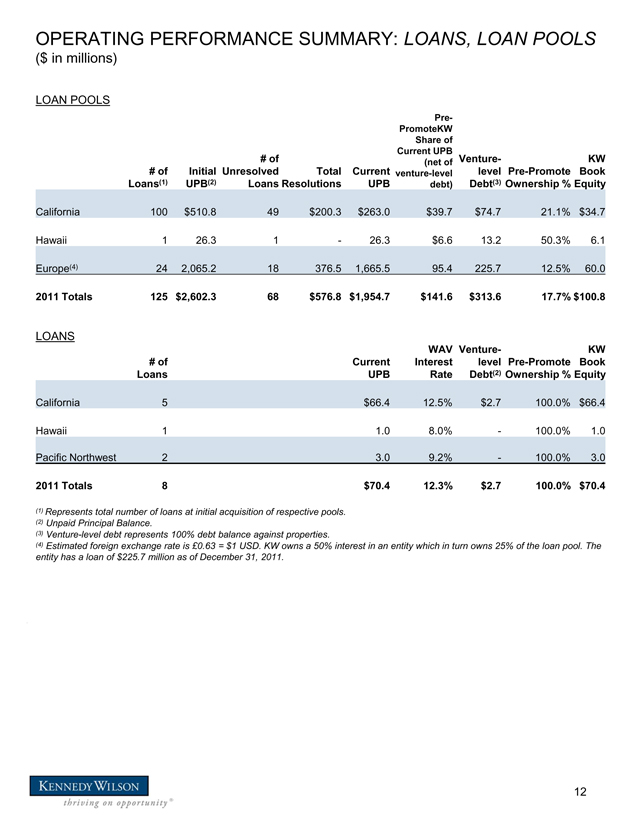
OPERATING PERFORMANCE SUMMARY: LOANS, LOAN POOLS
($ in millions)
LOAN POOLS
Pre-PromoteKW
Share of Current UPB
# of (net of Venture- KW # of Initial Unresolved Total Current venture-level level Pre-Promote Book Loans(1) UPB(2) Loans Resolutions UPB debt) Debt(3) Ownership % Equity
California 100 $510.8 49 $200.3 $263.0 $39.7 $74.7 21.1% $34.7 Hawaii 1 26.3 1 - 26.3 $6.6 13.2 50.3% 6.1 Europe(4) 24 2,065.2 18 376.5 1,665.5 95.4 225.7 12.5% 60.0
2011 Totals 125 $2,602.3 68 $576.8 $1,954.7 $141.6 $313.6 17.7% $100.8
LOANS
WAV Venture- KW # of Current Interest level Pre-Promote Book Loans UPB Rate Debt(2) Ownership % Equity
California 5 $66.4 12.5% $2.7 100.0% $66.4 Hawaii 1 1.0 8.0% - 100.0% 1.0 Pacific Northwest 2 3.0 9.2% - 100.0% 3.0
2011 Totals 8 $70.4 12.3% $2.7 100.0% $70.4
(1) Represents total number of loans at initial acquisition of respective pools. (2) Unpaid Principal Balance.
(3) Venture-level debt represents 100% debt balance against properties.
(4) Estimated foreign exchange rate is £0.63 = $1 USD. KW owns a 50% interest in an entity which in turn owns 25% of the loan pool. The entity has a loan of $225.7 million as of December 31, 2011.
12
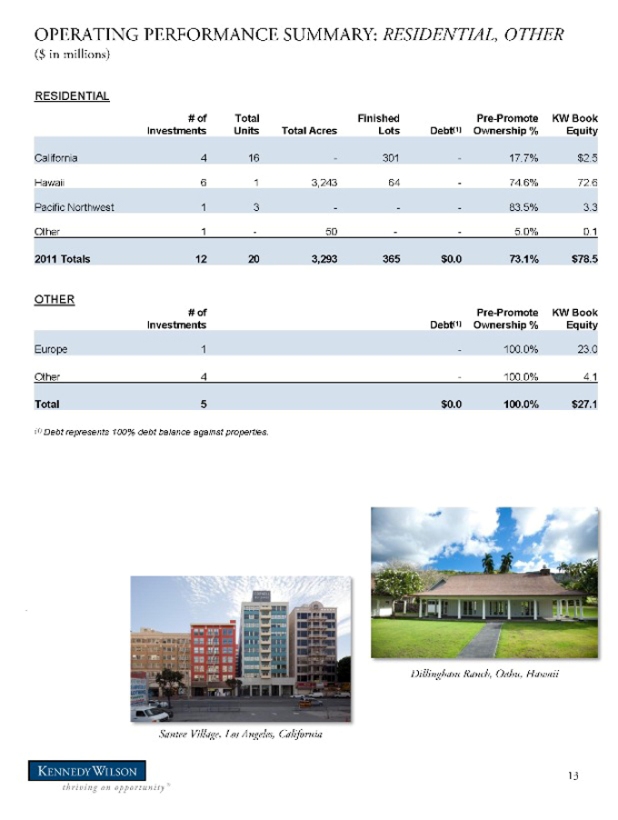
OPERATING PERFORMANCE SUMMARY: RESIDENTIAL, OTHER
($ in millions)
RESIDENTIAL
# of Total Finished Pre-Promote KW Book
Investments Units Total Acres Lots Debt(1) Ownership % Equity
California 4 16—301—17.7% $2.5
Hawaii 6 1 3,243 64—74.6% 72.6
Pacific Northwest 1 3—— 83.5% 3.3
Other 1—50—- 5.0% 0.1
2011 Totals 12 20 3,293 365 $0.0 73.1% $78.5
OTHER
# of Pre-Promote KW Book
Investments Debt(1) Ownership % Equity
Europe 1—100.0% 23.0
Other 4—100.0% 4.1
Total 5 $0.0 100.0% $27.1
| (1) |
|
Debt represents 100% debt balance against properties. |
13
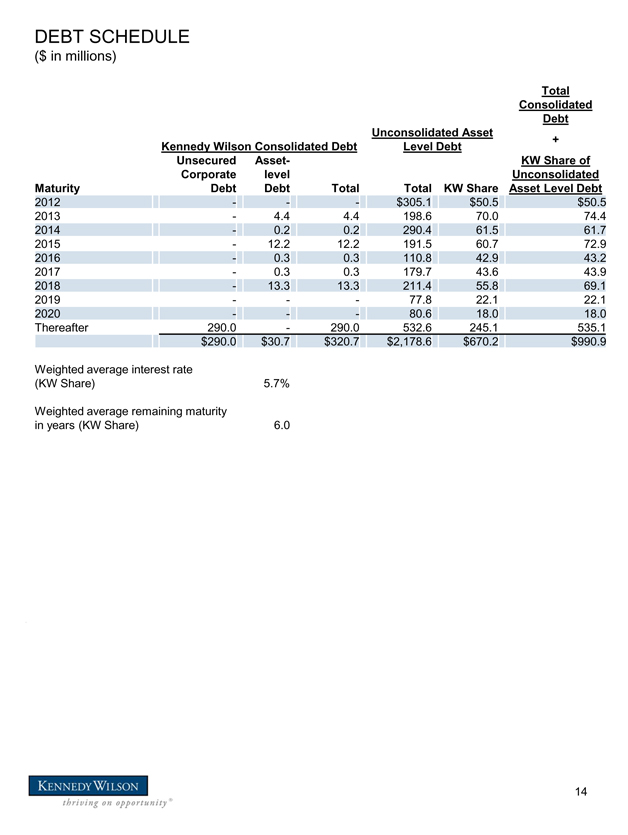
DEBT SCHEDULE
($ in millions)
Total Consolidated Debt Unconsolidated Asset + Kennedy Wilson Consolidated Debt Level Debt Unsecured Asset- KW Share of Corporate level Unconsolidated Maturity Debt Debt Total Total KW Share Asset Level Debt
2012 - - - $305.1 $50.5 $50.5 2013 - 4.4 4.4 198.6 70.0 74.4 2014 - 0.2 0.2 290.4 61.5 61.7 2015 - 12.2 12.2 191.5 60.7 72.9 2016 - 0.3 0.3 110.8 42.9 43.2 2017 - 0.3 0.3 179.7 43.6 43.9 2018 - 13.3 13.3 211.4 55.8 69.1 2019 - - - 77.8 22.1 22.1 2020 - - - 80.6 18.0 18.0 Thereafter 290.0 - 290.0 532.6 245.1 535.1
$290.0 $30.7 $320.7 $2,178.6 $670.2 $990.9
Weighted average interest rate
(KW Share) 5.7%
Weighted average remaining maturity in years (KW Share) 6.0
14