Attached files
| file | filename |
|---|---|
| 8-K - 8-K - BROADWIND, INC. | a12-6957_18k.htm |
| EX-99.1 - EX-99.1 - BROADWIND, INC. | a12-6957_1ex99d1.htm |
Exhibit 99.2
|
|
March 13, 2012 Investor Teleconference Q4 2011 Results |

|
|
Industry Data Disclaimer and Forward-Looking Statements Broadwind obtained the industry and market data used throughout this presentation from its own research, internal surveys and studies conducted by third parties, independent industry associations or general publications and other publicly available information. Independent industry publications and surveys generally state that they have obtained information from sources believed to be reliable, but do not guarantee the accuracy and completeness of such information. Forecasts are particularly likely to be inaccurate, especially over long periods of time. We are not aware of any misstatements in the industry data we have presented herein, but estimates involve risks and uncertainties and are subject to change based on various factors beyond Broadwind’s control. This presentation includes “forward-looking statements” within the meaning of the safe harbor provisions of the United States Private Securities Litigation Reform Act of 1995—that is, statements related to future, not past, events. Forward-looking statements are based on current expectations and include any statement that does not directly relate to a current or historical fact. In this context, forward-looking statements often address our expected future business and financial performance, and often contain words such as “anticipate”, “believe”, “intend”, “expect”, “plan”, “will” or other similar words. These forward-looking statements involve certain risks and uncertainties that ultimately may not prove to be accurate and are subject to change based on various factors. Actual results and future events could differ materially from those anticipated in such statements. For further discussion of risks and uncertainties, individuals should refer to Broadwind's filings with the Securities and Exchange Commission. Broadwind undertakes no obligation and does not intend to update these forward-looking statements to reflect events or circumstances occurring after this presentation. You are cautioned not to place undue reliance on these forward-looking statements, which speak only as of the date of this presentation. All forward-looking statements are qualified in their entirety by this cautionary statement. This document contains non-GAAP financial information. Broadwind’s management believes that certain non-GAAP financial measures may provide users of this financial information meaningful comparisons between current results and results in prior operating periods. Management believes that these non-GAAP financial measures can provide additional meaningful reflection of underlying trends of the business because they provide a comparison of historical information that excludes certain infrequently occurring or non-operational items that impact the overall comparability. Non-GAAP financial measures should be viewed in addition to, and not as an alternative for, the Company’s reported results prepared in accordance with GAAP. Please see Broadwind’s earnings release dated as of March 13, 2012 for a reconciliation of certain non-GAAP measures presented in this document. 2 |
|
|
Q4 Overview 3 Strong Order Flow Tower segment orders strong due to PTC expiration, including two new large turbine OEMs Continued solid order flow in Gearing and Services Reported Revenue Up 16% over Q4 2010 Strong revenue growth in Gearing, up 13% Gearing industrial revenue up 71% while wind revenue down 37% Service revenue increased 55% compared to Q4 2010 15% increase over Q3 2011 Adjusted EBITDA Loss of $1.0 Million vs. $3.9 Million Profit in Q4 2010 Lower profitability in Tower and Services Gearing adjusted EBITDA improved from Q4 2010 Positive Cash Flow from Operations |
|
|
2011 Results vs. Objectives 4 Greater Industry Diversity Greater Customer Diversity Improve Profitability Greater Customer Intimacy Objectives Results $54 million of non-wind orders in 2011 representing 33% of FY orders 2011 Gearing orders 89% industrial $7 million of weldment orders Added 3 new wind customers in 2011, representing over $80 million of orders Added 6 new > $1.0 million accounts in 2011 Implemented 18 month restructuring plan with an estimated savings ~$6 million per year Sold logistics business saving $3 million annually Improved gross profit margin by 2.5 ppts from PY Proactively developing customer scorecards to better meet expectations Added 8 new sales staff and implemented a sales automation tool |
|
|
Orders & Backlog 5 $ millions Orders ($ in millions) Order Backlog Continued growth in services with blade and technical support Gearing orders 2x over 2010, driven by Oil & Gas and mining Winning back previous industrial customers Gearing backlog represents ~6 months of sales Tower backlog is $161 million – $123 million to be shipped in 2012 Backlog decline reflects order pattern change to project approach from multi-year frame agreements Q4 11 Year 2011 2010 % Chg. 2011 2010 % Chg. Towers 50 55 -10% 92 85 +8% Gears 14 7 +103% 52 22 +133% Services 5 1 +281% 18 7 +153% Total 68 64 +7% 162 114 +42% |
|
|
Diversifying Backlog 6 2010 - $226 M 2011 - $200 M Tower Customer Gearing-Wind Gearing-Industrial Services Weldments Broadwind has reduced its customer concentration in backlog |
|
|
Long-Term Industry Drivers 7 |
|
|
PTC Impact on Towers 8 PTC scheduled to expire December 2012 Bipartisan support exists for extension But no Congressional action to date Increasing uncertainty impacting industry Broadwind’s actions: Filed US International Trade Commission case which if successful should significantly reduce foreign supplied towers Shifted portion of Texas tower capacity to weldments – already won large order in 4Q 2011 Secured first-time orders with leading OEMs in 2012 Positioned for Success Regardless of PTC Politics Actual & Forecasted Wind Installs - MWs Source: Make Consulting, December 2011 |
|
|
Rapid Industry Diversification 9 Reduces exposure to wind policy risk |
|
|
2012-2013 Deliverables Key Drivers of Transformation Gearing Complete plant consolidation Winning, and winning back, industrial customers in Oil & Gas and mining Continue positive customer experience – on-time delivery, high-quality goods Expand offering of industrial gearboxes and remanufacturing services Towers & Weldments Execution with new customers in towers – capture growing demand from US industrial manufacturing renaissance Shift capacity to support strong mining activity – qualifying on new products Sell idle South Dakota tower plant Services Execute with major customers won in 2011 Continued expansion of blade & drivetrain services business Develop turbine performance programs Profitability and Cash Flow 10 |
|
|
Consolidated Financial Results 11 Full Year sales up 36% Gross profit margin improves 2.5 percentage points over 2010 Cost containment on SGA 2011 2010 2011 2010 Revenue-$M 55.1 47.6 185.9 136.9 Gross Profit-$M 1.0 5.4 7.2 1.9 Operating Expense-$M 6.9 6.4 27.6 30.4 Impairment Expense-$M - 36.2 - 40.8 Operating Income-$M (5.9) (37.2) (20.4) (69.2) Adj. EBITDA-$M (1.0) 3.9 (2.1) (9.2) EPS Continuing- $ (0.04) (0.36) (0.18) (0.66) Q4 Full Year |
|
|
Towers and Weldments Fourth Quarter 2011 ($ in Millions) 12 Strategic Focus Unit volume down 22% from record Q4 2010 Half of 2010 tower production was higher margin “fabrication only” towers Adj. EBITDA margin also impacted by lower productivity on new tower design 2010 op income incl. $13.3M impairment Improve tower production changeover execution to support broader customer base Shift capacity to weldments to manage wind industry policy risk Stringent cost management 2011 2010 2011 2010 MW-Wind 139 255 593 518 Revenue-$M 34.6 30.3 116.9 76.2 Op Income-$M - (9.3) 5.2 (11.4) Adj. EBITDA-$M 1.6 5.6 10.4 6.8 % 4.6% 18.5% 8.9% 8.9% Q4 Full Year |
|
|
Gearing Fourth Quarter 2011 Industrial gearing sales +71%; Wind gearing sales -37% Adjusted EBITDA improved from volume growth, more profitable customer mix Profitability affected due to the absence of prior-year benefits from scrap and warranty adjustments ($ in Millions) 13 Growth in non-wind markets Improve capacity utilization Leverage gearing expertise in drivetrain services Improve margins Strategic Focus 2011 2010 2011 2010 Revenue-$M 15.6 13.9 54.3 49.0 Op Income-$M (2.2) (2.2) (10.7) (13.7) Adj. EBITDA-$M 0.4 0.3 (0.5) (4.0) % 2.6% 2.2% -0.9% -8.2% Q4 Full Year |
|
|
Services Fourth Quarter 2011 Revenue continues to grow – large project initiated in Q3, higher field service activity overall Adjusted EBITDA loss due to large project safety/training costs, higher drivetrain services expansion fixed overhead Continue to refine business model ($ in Millions) 14 Shift focus to non-routine drivetrain and blade maintenance services Develop proprietary product offerings Improve margins Strategic Focus 1H 2H 2011 4.2 12.1 2010 5.0 7.1 Services Sales ($ Millions) Q4 Full Year 2011 2010 2011 2010 Revenue-$M 5.5 3.5 16.3 12.1 Op Income-$M (1.4) (23.7) (5.2) (34.7) Adj. EBITDA-$M (1.1) (0.3) (4.0) (3.8) % -20.0% -8.6% -24.5% -31.4% |
|
|
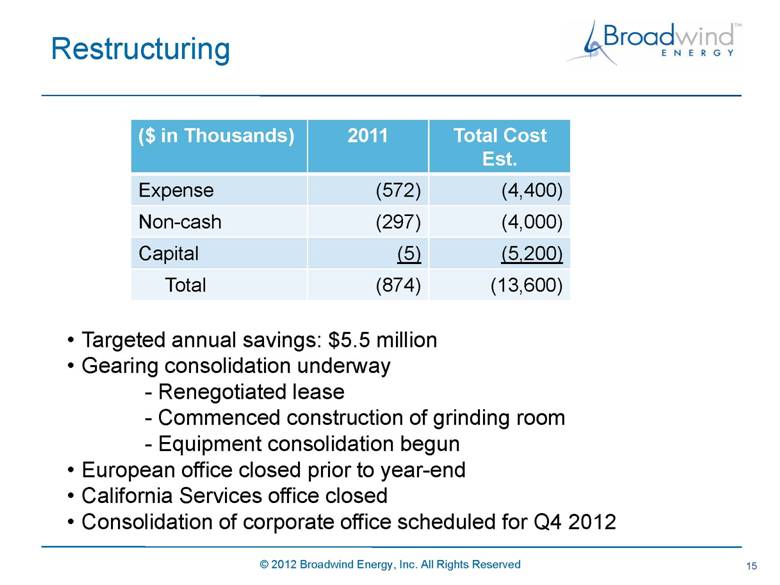
Restructuring 15 ($ in Thousands) 2011 Total Cost Est. Expense (572) (4,400) Non-cash (297) (4,000) Capital (5) (5,200) Total (874) (13,600) Targeted annual savings: $5.5 million Gearing consolidation underway - Renegotiated lease - Commenced construction of grinding room - Equipment consolidation begun European office closed prior to year-end California Services office closed Consolidation of corporate office scheduled for Q4 2012 |
|
|
Operating Working Capital 16 High 9/30 inventory balances reduced as planned Year-end working capital balance $3 million lower (better) than forecast due to timing on customer deposits |
|
|
Liquidity 17 Net debt turned negative at year-end $13.8 million debt balance includes $2.8 million which is either forgivable economic development grants or new markets tax credit financing 2012 debt and capital lease payments: $4.3 million ($ in thousands) 12/31/2011 9/30/2011 6/30/2011 12/31/2010 Lines of credit, notes payable 1,566 1,687 1,463 140 Long-term debt 5,433 5,730 9,119 11,108 Liabilities held for sale 4,833 5,083 - 4,221 Capital leases 1,940 2,094 2,344 2,768 Debt and capital lease 13,772 14,594 12,926 18,237 Cash and related assets 14,216 14,421 10,477 15,501 Net debt (444) 173 2,449 2,736 Memo: available line of credit 9,477 9,877 10,000 10,000 |
|
|
Debt vs. TTM EBITDA ($ in millions) 18 |
|
|
2012 Financial Outlook 19 ~80% of 2012 sales delivered or in backlog today Margin range widened despite PTC uncertainty Actions taken to reduce operating expenses All quarters projected to have positive EBITDA Q4 risk related to PTC expiration 2010 2011 2012E* Sales-$M 137 186 215-225 Gross Margin 1.4% 3.9% 6.5-7.5% SGA-$M 30.4 27.6 25-26 Impairment Exp-$M 40.8 0 0 Op Loss-$M (69.2) (20.4) (8) - (10) Adj. EBITDA-$M (9.2) (2.1) 8 - 10 * Excluding restructuring |
|
|
20 Broadwind Energy is committed to helping customers maximize performance of their energy and infrastructure investments— quicker, easier and smarter. |