Attached files
| file | filename |
|---|---|
| EXCEL - IDEA: XBRL DOCUMENT - ZIX CORP | Financial_Report.xls |
| EX-31.1 - SECTION 302 CEO CERTIFICATION - ZIX CORP | d279168dex311.htm |
| EX-32.1 - SECTION 906 CERTIFICATION OF CEO AND CFO - ZIX CORP | d279168dex321.htm |
| EX-31.2 - SECTION 302 CFO CERTIFICATION - ZIX CORP | d279168dex312.htm |
| EX-23.1 - CONSENT OF INDEPENDENT REGISTERED PUBLIC ACCOUNTING FIRM - ZIX CORP | d279168dex231.htm |
Table of Contents
United States
SECURITIES AND EXCHANGE COMMISSION
Washington, D.C. 20549
Form 10-K
(Mark One)
| x | ANNUAL REPORT PURSUANT TO SECTION 13 OR 15(d) OF THE SECURITIES EXCHANGE ACT OF 1934 |
For the fiscal year ended December 31, 2011
| ¨ | TRANSITION REPORT PURSUANT TO SECTION 13 OR 15(d) OF THE SECURITIES EXCHANGE ACT OF 1934 |
For the transition period from to
Commission File Number: 0-17995

Zix Corporation
(Exact Name of Registrant as Specified in its Charter)
| Texas | 75-2216818 | |
| (State or Other Jurisdiction of Incorporation or Organization) |
(I.R.S. Employer Identification Number) |
2711 N. Haskell Avenue, Suite 2200, LB 36,
Dallas, Texas 75204-2960
(Address of Principal Executive Offices)
(214) 370-2000
(Registrant’s Telephone Number, Including Area Code)
Securities Registered Pursuant to Section 12(b) of the Act:
| Title of each class of stock |
Name of each exchange on which registered | |
| Common Stock $0.01 Par Value |
NASDAQ |
Securities Registered Pursuant to Section 12(b) of the Act:
None
Indicate by check mark whether the Registrant is a well-known seasoned issuer, as defined in Rule 405 of the Securities Act.
Yes ¨ No x
Indicate by check mark whether the Registrant is not required to file reports pursuant to Section 13 or Section 15(d) of the Act. Yes ¨ No x
Indicate by check mark whether the Registrant: (1) has filed all reports required to be filed by Section 13 or 15(d) of the Securities Exchange Act of 1934 during the preceding 12 months (or for such shorter period that the Registrant was required to file such reports) and (2) has been subject to such filing requirements for the past 90 days. Yes x No ¨
Indicate by check mark whether the Registrant has submitted electronically and posted on its corporate Web site, if any, every Interactive Data File required to be submitted and posted pursuant to Rule 405 of Regulation S-T (§232.405 of this chapter) during the preceding 12 months (or for such shorter period that the registrant was required to submit and post such reports) Yes x No ¨
Indicate by check mark if disclosure of delinquent filers pursuant to Item 405 of Regulation S-K (§229.405 of this chapter) is not contained herein, and will not be contained, to the best of Registrant’s knowledge, in definitive proxy or information statements incorporated by reference in Part III of this Form 10-K or any amendment to this Form 10-K. ¨
Indicate by check mark whether the registrant is a large accelerated filer, an accelerated filer, a non-accelerated filer, or a smaller reporting company. See definitions of “large accelerated filer”, “accelerated filer” and “smaller reporting company” in Rule 12b-2 of the Exchange Act. (Check one):
| Large accelerated filer | ¨ | Accelerated filer | x | |||
| Non-accelerated filer | ¨ (Do not check if a smaller reporting company) | Smaller reporting company | ¨ | |||
Indicate by check mark whether the registrant is a shell company (as defined in Rule 12b-2 of the Exchange Act).
Yes ¨ No x
As of March 6, 2012, there were 62,880,376 shares of Zix Corporation $0.01 par value common stock outstanding. As of June 30, 2011, the aggregate market value of the shares of Zix Corporation common stock held by non-affiliates was $243,642,616.
DOCUMENTS INCORPORATED BY REFERENCE
Portions of the Registrant’s 2012 Proxy Statement are incorporated by reference into Part III of this Form 10-K.
Table of Contents
| Item 1. | 3 | |||||
| Item 1A. | 7 | |||||
| Item 1B. | 13 | |||||
| Item 2. | 13 | |||||
| Item 3. | 14 | |||||
| Item 4. | 14 | |||||
| Item 5. | 15 | |||||
| Item 6. | 16 | |||||
| Item 7. | Management’s Discussion and Analysis of Financial Condition and Results of Operations |
17 | ||||
| Item 7A. | 28 | |||||
| Item 8. | 28 | |||||
| Item 9. | Changes in and Disagreements with Accountants on Accounting and Financial Disclosure |
28 | ||||
| Item 9A. | 28 | |||||
| Item 9B. | 31 | |||||
| Item 10. | 32 | |||||
| Item 11. | 32 | |||||
| Item 12. | Security Ownership of Certain Beneficial Owners and Management and Related Stockholder Matters |
32 | ||||
| Item 13. | Certain Relationships and Related Transactions, and Director Independence |
32 | ||||
| Item 14. | 32 | |||||
| Item 15. | 32 |
2
Table of Contents
Zix Corporation (“ZixCorp®,” the “Company,” “we,” “our,” or “us”) is a leader in providing email encryption services. ZixCorp’s Email Encryption Service enables the use of secure email for sensitive information exchange primarily in the healthcare, financial services, insurance and government sectors. More than 1,200 hospitals and over 1,600 financial institutions, including some of the most influential companies and government organizations, use our Email Encryption Service. Wellpoint and the Securities and Exchange Commission (“SEC”) are among these notable customers. Our Email Encryption Service is enhanced by ZixDirectory®, which includes approximately 30 million members. ZixDirectory allows for emails to be sent seamlessly whenever possible, across the largest email encryption community in the world.
Our Email Encryption Service is a comprehensive secure messaging service, which allows an enterprise to use policy-driven rules to determine which emails should be sent securely to comply with regulations or company- defined policies. It is primarily offered as a Software-as-a-Service (“SaaS”) solution, for which customers pay an annual service subscription fee. ZixCorp’s main differentiation in the marketplace is our exceptional ease of use. The best example of this is our ability to provide transparent delivery of secure, encrypted email. Most email encryption solutions are focused on the sender. They typically introduce an added burden on receivers, often requiring additional user authentication with creation of a new user identity and password. We designed our solution to alleviate the receiver’s burden by enabling the delivery of encrypted email automatically and transparently. ZixCorp enables transparent delivery by (1) ZixDirectory, which is designed to share identities, (2) Zix’s Best Method of Delivery™, which is designed to deliver email according to the sender’s encryption policy and (3) ZixGateway®, which is an enterprise gateway that automatically decrypts the message. The result is secure encrypted email exchange that is transparent for both sender and receiver.
Our business operations and service offerings are supported by the ZixData Center™, a network operations center dedicated to secure electronic transaction processing. The operations of the ZixData Center are independently audited annually to maintain AICPA SysTrustSM certification in the areas of security, confidentiality, integrity and availability. Auditors also produce a SAS70 Type II report on the effectiveness of operational controls used over the audit period. The ZixData Center is staffed 24 hours a day with a proven 99.99% reliability rate.
Our company was incorporated in Texas in 1988. Originally named Amtech Corporation, we changed our name to ZixIt® Corporation in 1999 when we entered the encrypted email market. In 2002, we became Zix Corporation. Our executive offices are located at 2711 North Haskell Avenue, Suite 2200, LB 36, Dallas, Texas 75204-2960, (214) 370-2000.
Overview
Email is a mission-critical means of communication for enterprises. However, if email leaves a secure network environment in clear text, it can be intercepted along the path between a sender and a recipient, which permits theft, redirection, manipulation, or exposure to unauthorized parties. Failure to control and manage such risks can result in enforcement penalties for noncompliance under numerous different regulations, in addition to damaged reputation, competitive disadvantage, a loss of intellectual property or other corporate assets, exposure to negligence or liability claims, and diversion of resources to repair such damage. For example, healthcare organizations are subject to the Health Information Portability Accountability Act (“HIPAA”), as revised by the Health Information Technology for Economic and Clinical Health Act of 2009 (“HITECH ACT”). Financial institutions are subject to data privacy laws included in the Gramm-Leach-Bliley Act (“GLBA”). In addition, individual states such as Massachusetts and Nevada have enacted state laws requiring encryption of certain emails and information.
Corporations require email protection that can be used on an enterprise-wide basis, is cost-effective, quickly deployed, regularly updated to guard against obsolescence and ineffectiveness, and is easy to use. To satisfy these needs, our Email Encryption Service provides a comprehensive solution that analyzes and encrypts email communications.
Our Email Encryption Service allows a user to send encrypted email to any email user at any email address by using the ZixCorp Best Method of Delivery protocol which automatically determines the most direct and appropriate means of delivery, based on the sender’s and recipient’s communications environment and preferences. The protocol
3
Table of Contents
supports a number of encrypted email delivery mechanisms, including S/MIME, TLS, OpenPGP, “push” delivery and secure portal “pull” delivery. These last two mechanisms enable users to send messages securely to anyone with an email address, including those who do not have an encryption tool. Our Best Method of Delivery makes the technology simple for end users and provides flexibility and ease of implementation for information technology professionals. We believe the ability to send messages through different modes of delivery makes our Email Encryption Service superior to competitive offerings.
The deployment of our Email Encryption Service at the periphery of the customer’s network means our Email Encryption Service encrypts outbound email for an enterprise without the need to create, deploy or manage end user encryption keys or deploy desktop software. Our technology solutions are easy to use, easy to deploy, and can be made operational quickly.
Our service has an integrated policy management capability. This policy engine can inspect the contents of emails and apply policies that match specific industry criteria such as HIPAA, HITECH and GLBA. Customers can also build their own specific policies. This policy driven email for regulatory compliance means customers can reduce the training required of their staff and significantly reduce the risk of inadvertently sending sensitive content by regulating the method of delivery through preset policies.
Our Email Encryption Service employs a centralized directory of users called the ZixDirectory, which we consider a key differentiator of our offering. The ZixDirectory operates as a global community for email encryption, and today contains approximately 30 million members. The ZixDirectory adds members at a rate of approximately 100,000 new members per week.
Today in the healthcare industry, our Email Encryption Service is used by over thirty Blue Cross Blue Shield organizations and over 1,200 hospitals. In the financial services sector, we serve over 1,600 banks, credit unions and farm credit associations, as well as all of the Federal Financial Institutions Examination Council (“FFIEC”) regulators. We also provide service to more than twenty-five state governments covering various agencies in those states.
Competition
The most significant differentiator for ZixCorp’s Email Encryption Service as compared with our competition is ease of use. The best example of our unequalled ease of use is transparent delivery of encrypted email messages. We are able to deliver transparent email encryption as a result of our SaaS architecture, the ZixDirectory, the Best Method of Delivery and the ZixGateway. The most critical and highly differentiated component of our solution is the ZixDirectory which provides the ability to share user identities for encryption, which in turn provides interoperability between users in a community of interest such as healthcare, finance or government.
In addition, our service differs from the products and services of most of our competitors because we offer a SaaS architecture, while most of our competitors offer primarily a product-based approach that the customer builds and runs themselves. Some of our competitors have substantial information technology security and email protection products, however, our competitors’ customers tend to build and operate their own systems, and the directory of user identities each competitor creates is not shared. This practice is less desirable as different companies’ encrypted email systems are not interoperable.
Our capability to offer interoperability is particularly important when it is necessary to communicate with external networks, as is the case with the healthcare and financial services markets. Our customers become part of the ZixDirectory, a global “white pages” that enables transparent secure communications with other ZixGateway customers using our centralized key management system and overall unique approach to implementing secure e-mail. We enable secure communications with other users via TLS, Open PGP, “push” delivery and secure portal “pull” delivery mechanisms. However, we believe our unique transparent delivery is the more preferred delivery model.
Our Email Encryption Service focuses on the secure (encryption) delivery portion of the secure email market, a sub-segment of the e-mail security market. We view our primary competitors as Cisco Systems Inc., Proofpoint Inc., and McAfee, Inc. Technically, while these companies offer “send-to-anyone” encrypted email, we believe they are
4
Table of Contents
unable to offer the benefits that come from access to the ZixDirectory and from using our Best Method of Delivery protocol. Nevertheless, some of these competitors are large enterprises with substantial financial and technical resources that exceed those we possess. There are other competitors but we do not view them as particularly significant.
Regulatory Drivers
We have been successful in securing additional market penetration for our Email Encryption Service in our target vertical markets of healthcare, finance services and government. There was a significant increase in demand in the healthcare sector leading up to the April 2005 HIPAA Security Rule deadline and sales in this sector have remained generally strong since that time. The HITECH ACT within the American Recovery and Reinvestment Act of 2009 expanded the scope of HIPAA. Key elements of the HITECH ACT relating to HIPAA include increased penalties for violations, stricter and more onerous breach notification requirements, an expanded reach of the law to include previously uncovered “business associates,” and the ability for states to pursue HIPAA violations in addition to the U.S Department of Health and Human Services. Pursuant to the HITECH ACT, the Office for Civil Rights has announced plans to audit up to 150 covered entities during 2012 to assess privacy and security compliance. The Company believes these changes will continue to increase demand for email encryption by broadening the potential market and providing further incentive for potential customers to adopt email encryption technology.
Additional federal regulations promulgated under GLBA, HIPPA and HITECH and state laws and regulations across the country have enhanced security awareness in vertical markets outside of healthcare, and have prompted affected organizations to consider adopting systems that ensure data security and privacy.
Recently, state governments have begun to focus increasingly on encryption. The first state law requiring encryption of emails containing sensitive information was passed by Nevada on October 1, 2008. On March 1, 2010, new regulations in the state of Massachusetts became effective (201 CMR 17.00). The Massachusetts regulations bear the most comprehensive encryption requirements imposed on businesses by any state and, because they cover any business with a customer or business dealing in the state of Massachusetts, they reach far beyond Massachusetts’ state borders.
Even where there are no specific regulations, corporations may require email protection to adhere to evolving industry best practices for protecting sensitive information. We target the relevant regulators who themselves have placed an increased emphasis on the secure transmission of sensitive information. Our customers include all of the federal regulators who comprise the FFIEC as well as the state banking regulators in more than twenty states. Our service is also a recommended solution of the Conference of State Bank Supervisors, whose members regulate the more than 6,000 state-chartered banks in the U.S.
Sales and Marketing
We sell our Email Encryption Service through a direct sales force that focuses on larger businesses and a telesales force that focuses on small to medium-sized accounts. We also use a network of resellers and other distribution partners, including other service providers seeking an encryption offering in an original equipment manufacturing (“OEM”)-like relationship. New first year orders derived from our valued added resellers, OEM and third party distribution channels for 2011 were 52% of the total new first year orders compared to 53% in 2010. Google, Inc. continues to be our largest third party reseller representing approximately 15% of new first year orders in 2011. We now have over 170 managed security service providers and value added resellers across the U.S.
Employees
We had 127 employees as of December 31, 2011. The majority of our employees are located in Dallas, Texas; Burlington, Massachusetts; and Ottawa, Ontario, Canada.
Research and Development — Patents and Trademarks
We incurred research and development expenses from continuing operations of $5,229,000, $5,089,000, and $3,619,000 for the twelve-month periods ended December 31, 2011, 2010 and 2009, respectively.
5
Table of Contents
Over the course of 2011 we continued to make investments to strengthen our Email Encryption services through the development of a number of significant portfolio upgrades. We delivered ZixMobility which has set the new standard in simple mobile access for secure email. We also added Single Sign-on, customer web page integration, flexible form provisioning and application-driven email support features to our suite of ZixPort service capabilities. The ZixGateway appliance policy configuration and processing capabilities were expanded in a number of key areas including intelligent integration of transport layer security (TLS) technology into our comprehensive message delivery and reporting frameworks. The new TLS capabilities and the addition of the new ZixAccess inbound service were designed to support continued coverage expansion for our leading transparent message delivery network.
We have patents that protect certain elements of our core technology underlying the Email Encryption business, including one new U.S. patent issued in 2011. We have not realized any revenues from licensing any of our patents to third parties.
The following are registered trademarks of ours and certain of our subsidiaries: “ZixCorp,” “ZixGateway,” “ZixDirectory,” “ZixIt,” “ZixPort,” and “PocketScript.”
Compliance with Environmental Regulations
We have not incurred, and do not expect to incur, any material expenditures or obligations related to environmental compliance issues.
Governmental Contracts
We have contracts with many local, state and federal agencies and regulators, which in aggregate contribute approximately five percent of our annual revenue.
Significant Customers
In each of 2011, 2010, and in 2009 no single customer accounted for 10% or more of our total revenues.
Backlog
Our end user order backlog is comprised of contractual commitments that we expect to recognize as revenue in the future. Our backlog was $53,724,000 at December 31, 2011, compared to $49,911,000 at December 31, 2010.
As of December 31, 2011, our backlog is comprised of the following elements: $17,363,000 of deferred revenue that has been billed and paid, $4,622,000 billed but unpaid, and approximately $31,739,000 of unbilled contracts.
The backlog is recognized into revenue ratably as the services are performed. Approximately 57% of our total backlog at December 31, 2011 is expected to be recognized as revenue during 2012.
Seasonality
Our business is not materially impacted by seasonality.
Geographic Information
Our operations are primarily based in the U.S., with approximately 9% of our employees located in Canada. Except for a United Kingdom based data center, we do not operate in, or have dependencies on, any other foreign countries. Our revenues and orders to-date are almost entirely sourced in the U.S. and all significant corporate assets at December 31, 2011, were located in the U.S.
6
Table of Contents
Available Information
Our Internet address is www.zixcorp.com. Our Annual Report on Form 10-K, Quarterly Reports on Form 10-Q, Current Reports on Form 8-K, and amendments to those reports filed or furnished pursuant to Section 13(a) or 15(d) of the Securities Exchange Act of 1934, as amended (the “Exchange Act”), are available on our website, without charge, as soon as reasonably practicable after we electronically file such material with, or furnish it to, the SEC. The information found on our website shall not be considered to be part of this or any other report filed with or furnished to the SEC.
In addition to our website, you may read and copy any materials we file with the SEC at the SEC’s Public Reference Room at 450 Fifth Street, N.W., Washington, D.C. 20549. You may obtain information on the operation of the SEC’s Public Reference Room by calling the SEC at 1-800-SEC-0330. The SEC maintains a website that contains reports, proxy and other information statements, and other information regarding issuers, including us, that file electronically with the SEC. The address of the website is www.sec.gov.
NOTE ON FORWARD-LOOKING STATEMENTS AND RISK FACTORS
This document contains “forward-looking statements” (including the discussion appearing under the caption “Liquidity Summary” in “Item 7. Management’s Discussion and Analysis of Financial Condition and Results of Operations,” within the meaning of Section 27A of the Securities Act of 1933, as amended (the “Act”) and Section 21E of the Exchange Act. All statements other than statements of historical fact are “forward-looking statements” for purposes of federal and state securities laws, including: any projections of future business, market share, earnings, revenues, cash receipts, or other financial items; any statements of the plans, strategies, and objectives of management for future operations; any statements concerning proposed new products, services, or developments; any statements regarding future economic conditions or performance; any statements of belief; and any statements of assumptions underlying any of the foregoing. Forward-looking statements may include the words “may,” “will,” “predict,” “project,” “forecast,” “plan,” “should,” “could,” “goal,” “estimate,” “intend,” “continue,” “believe,” “expect,” “outlook,” “anticipate,” “hope,” and other similar expressions. Any forward-looking statements involve risks and uncertainties that could cause actual events or results to differ materially from the events or results described in the forward-looking statements, including, but not limited to, the risks and uncertainties described in the “Risk Factors” section above.
Although we believe that expectations reflected in any of our forward-looking statements are reasonable, actual results could differ materially from those projected or assumed in any of our forward-looking statements. Our future financial condition and results of operations, as well as any forward-looking statements, are subject to change and to inherent risks and uncertainties, such as those disclosed in this document. We do not intend, and undertake no obligation, to update any forward-looking statement.
The risks and uncertainties described below could materially and adversely affect our business, financial condition and financial results and reduce the value of an investment in our securities. This report also contains forward-looking statements and the following risks could cause our actual results to differ materially from those anticipated in such forward-looking statements.
Our business depends upon customers using email to exchange confidential information, and a significant shift of those messages to other communication channels could impair our growth prospects and negatively affect our business, financial condition and financial results.
Our customers deploy and use our products and services to easily, securely and confidentially send and receive encrypted email messages. Our business and revenue substantially depend on our current and potential customers using email to exchange sensitive information electronically. New technologies, products, or business models that could support secure communications could be disruptive to our business. If prospective or current customers were to send and receive sensitive information using technology or communication channels other than ours, our growth prospects and our business, financial condition and financial results could be materially adversely affected.
7
Table of Contents
Public key cryptography technology used in our businesses is subject to technology integrity risks that could reduce demand for our products and services and could negatively affect our business, financial condition and financial results.
Our business employs public key cryptography technology and other encryption technologies to encrypt and decrypt messages. The security afforded by encryption depends on the integrity of the private key, which is predicated on the assumption that it is very difficult to mathematically derive the private key from the related public key. Successful decryption of encrypted information, or public reports of successful decryption, whether or not true, could reduce demand for our products and services. If new methods or technologies make it easier to derive the private key from the related public key, the security of encryption services using public key cryptography technology could be impaired and our products and services could become unmarketable. That could require us to make significant changes to our services, which could increase our costs, damage our reputation, or otherwise harm our business. Any of these events could reduce our revenues, increase our expenses and materially adversely affect our business, financial condition and financial results.
The growth of our business may require significant investment in systems and infrastructure with no guarantee of revenue, which could impair our profitability and negatively affect our business, financial condition and financial results.
As our operations grow in size and scope, we may need to improve and upgrade our systems and infrastructure to offer an increasing number of customers enhanced products, services, features and functionality, while maintaining the reliability and integrity of our systems and infrastructure and pursuing reduced costs per transaction. Expanding our systems and infrastructure may require us to commit substantial financial, operational and technical resources, with no assurance that the volume of our business will increase, which could reduce our net income, deplete our cash, and materially adversely affect our business, financial condition and financial results.
We face strong competition, which could negatively affect our business, financial condition and financial results.
The markets in which we compete are characterized by rapid change and converging technologies and are very competitive. With rising demand for private and secure email communications, there is strong competition for the email encryption products and services. Our business competes with products and services offered by companies such as Axway, Cisco Systems Inc., Echoworx, McAfee, Inc., Symantec, Proofpoint, Trend Micro and Voltage Security. Strong competition requires us to develop new technology solutions and service offerings to expand the functionality and value that we offer to our customers. Some of our competitors offer email encryption services together with products and services that we do not offer, which could make our offering less attractive by comparison. As a result of the bundling of products by these competitors, it can be difficult for our customers to compare the cost of our products with competing products. In some instances, competing products may seem to be offered by our competitors at little to no additional cost to the customer. In addition, our competitors may develop technology solutions and service offerings that are perceived by customers as equivalent to, or having advantages over, our products and services. Competitors could capture a significant share in our markets, causing our sales and revenue to decline or grow more slowly. Barriers to entry are relatively low, and new ventures are often formed that create products competitive with our products. Competitive pressures could lead to price discounting or to increases in expenses such as advertising and marketing costs. Increased competition could also decrease demand for our products and services. Competition could reduce our revenues and net income and materially adversely affect our business, financial condition and financial results.
Some competitors have advantages that may allow them to compete more effectively than us, which could negatively affect our business, financial condition and financial results.
Some of our competitors have longer operating histories, more extensive operations, greater name recognition, larger technical staffs, bigger product development and acquisition budgets, established relationships with more distributors and hardware vendors, and greater financial and marketing resources than we do. These advantages might enable them (independently or through alliances) to develop and expand functionality of products and services faster than we can, to spend more money to market and distribute products and services than we can, or to offer their products and services at prices lower than ours. These advantages could reduce our revenues and net income and materially adversely affect our business, financial condition and financial results.
8
Table of Contents
We increasingly rely on third party distributors to help us market our products and services, and our failure to succeed in those relationships could negatively affect our business, financial condition and financial results.
We plan to increase the distribution of our products and services by entering into alliances with third parties who can offer our products and services along with their own products and services. Increased reliance on third parties to market and distribute our products and services exposes us to a variety of risks. For example, we have limited control over the sales cycles of third party distributors, which could increase the length of our sales cycle, cause our revenue to fluctuate unpredictably and make it difficult to accurately forecast our revenue. We may not succeed in developing or maintaining marketing alliances. Companies with which we have marketing alliances may in the future discontinue their relationships with us, form marketing alliances with our competitors, or develop and market their own products and services that compete with ours. If a significant distributor were to discontinue its relationship with us, we could experience an interruption in the distribution of our products and services and our revenues could decline. Our failure to develop, maintain and expand strategic distribution relationships could reduce our revenues and net income and materially adversely affect our business, financial condition and financial results.
Our business depends on market acceptance of our service, and our failure to achieve and maintain market penetration could negatively affect our business, financial condition and financial results.
In order to continue to operate profitably and grow, we must achieve and maintain broad market acceptance of our email encryption service at a price that provides an acceptable rate of return relative to our costs. We have been successful in selling our products and services to various high-profile customers, particularly in the healthcare, financial services and government segments of our market. The acceptance and use of our products and services by those significant customers facilitates our sales to potential customers, and an expanding base of users in the Zix Directory aids in our market penetration and expansion. We must continue to respond to evolving business models for technology offerings in order to continue to achieve market acceptance. The loss of an influential customer could impair our ability to expand the market penetration of our products and services, or cause us to reduce or increase prices, which could reduce our revenues and net income and materially adversely affect our business, financial condition and financial results.
Unfavorable economic and political environments could negatively affect our business, financial condition and financial results.
Challenging economic conditions worldwide have from time to time contributed, and may continue to contribute, to slowdowns in technology and networking industries at large, as well as in the specific markets in which we operate. If economic growth in those markets is slow, or credit is unavailable at a reasonable cost, current and potential customers may delay or reduce technology purchases, including the deployment or expansion of our products and services. This could result in reduced sales of our products and services, longer sales cycles, slower adoption of new technologies and increased price competition. In addition, adverse economic conditions could negatively affect the cash flow of our customers and distributors, which might result in failures or delays in payments to us. This could increase our credit risk exposure and delay our recognition of revenue. Specific economic trends, such as declines in the demand for PCs, services and other computing devices, or softness in corporate information technology spending, could have a more direct impact on our business. If these conditions persist, spread or deteriorate further, our business, financial condition and financial results could be materially adversely affected.
Our failure to keep pace with rapid technology changes could have a negative impact on our business, financial condition and financial results.
The markets for our products and services are characterized by rapid technological developments and frequent changes in customer requirements. We must continually improve the performance, features and reliability of our products and services, particularly in response to competitive offerings, to keep pace with these developments. We
9
Table of Contents
must ensure that our products and services address evolving operating environments, devices, industry trends, certifications and standards. For example we have been required to expand our offerings for virtual computer environments and mobile environments to support a broader range of mobile devices. We also may need to develop products that are compatible with new operating systems while remaining compatible with existing, popular operating systems. Our business could be harmed by our competitors announcing or introducing new products and services that could be perceived by customers as superior to ours. We spend considerable resources on technology research and development, but our research and development resources are more limited than many of our competitors. Our failure to introduce new or enhanced products on a timely basis, to keep pace with rapid industry, technological or market changes or to gain customer acceptance for our products and services could have a material adverse effect on our business, financial condition and financial results.
If our products do not work properly, our business, financial condition and financial results could be negatively affected and we could experience negative publicity, declining sales and legal liability.
We produce complex products that incorporate leading-edge technology, including both hardware and software, that must operate in a wide variety of technology environments. Software may contain defects or “bugs” that can interfere with expected operations. There can be no assurance that our testing programs will be adequate to detect all defects prior to the product being introduced, which might decrease customer satisfaction with our products and services. The product reengineering cost to remedy a product defect could be material to our operating results. Our inability to cure a product defect could result in the temporary or permanent withdrawal of a product or service, negative publicity, damage to our reputation, failure to achieve market acceptance, lost revenue and increased expense, any of which could have a material adverse effect on our business, financial condition and financial results.
The infrastructure supporting our business may suffer capacity constraints and business interruptions that could cause us to lose customers, increase our operating costs and could negatively affect our business, financial condition and financial results.
Our business depends on our providing our customers reliable, real-time access to our data centers and networks. Customers will not tolerate a service hampered by slow delivery times, unreliable service levels, service outages, or insufficient capacity. System capacity limits or constraints arising from unexpected increases in our volume of business or network traffic could cause interruptions, outages or delays in our services, or deterioration in their performance, or could impair our ability to process transactions. We may not be able to accurately project the rate of increase in usage of our network or to timely increase capacity to accommodate increased traffic on our network. System delays or interruptions may prevent us from efficiently providing services to our customers or other third parties, which could result in our losing customers and revenues, or incurring liabilities that could have a material adverse effect on our business, financial condition and financial results.
Our business depends substantially on our data center facilities, and their unreliability or unavailability for a significant period could cause us to lose customers and could negatively affect our business, financial condition and financial results.
Much of the computer and communications hardware upon which our businesses depend is located in our data center facilities in Dallas and Austin, Texas and in the United Kingdom. Our data centers might be damaged or interrupted by fire, flood, power loss, telecommunications failure, break-ins, cyber attacks, earthquakes, terrorist attacks, hostilities or war or other events. Computer viruses, equipment failure, denial of service attacks, and similar disruptions affecting the internet or our systems might cause service interruptions, delays and loss of critical data, and could prevent us from providing our services. Problems affecting our data center operations or our networks could result in loss of revenues, increased expenses, failure to achieve market acceptance, diversion of resources, injury to our reputation, liability and increased costs. We do not carry sufficient insurance to compensate us for all losses that may occur as a result of any of these events. The occurrence of any of these events could materially adversely affect our business, financial condition and financial results.
10
Table of Contents
Outages or problems with systems and infrastructure supplied by third parties could negatively affect our business, financial condition and financial results.
Our business relies on third-party suppliers of the telecommunications infrastructure. We use various communications service suppliers and the global internet to provide network access between our data centers, our customers and end-users of our services. If those suppliers do not enable us to provide our customers with reliable, real-time access to our systems, we may be unable to gain or retain customers. These suppliers periodically experience outages or other operational problems as a result of internal system failures or external third party actions. Any of these outages or problems could materially adversely affect our business, financial condition and financial results.
The security of our networks and data centers is critical to our business and a breach of security through a cyber attack or otherwise could cause us to lose customers and could negatively affect our business, financial condition and financial results.
We are dependent on our networks and datacenters to provide our products and services. Due to the nature of the products and services we provide and the sensitive nature of the information we collect, process, store, use and transmit, we may face cyber attacks that attempt to penetrate our networks and datacenters. To reduce the risk of a successful cyber attack, we have implemented significant physical and logical security measures to detect and identify threats, breaches and potential incidents. Despite these security measures, our networks and datacenters remain vulnerable to cyber attack. Cyber attacks and other breaches of security at our datacenters and networks could cause negative publicity, interruption of our services, damage to our reputation, unauthorized disclosure of our customers’ confidential or proprietary information (including personally identifiable information), disclosure of our intellectual property, loss of customers, lost revenue and increased expense (including potentially indemnification or warranty costs), any of which could have a material adverse effect on our business, financial condition and financial results.
Problems with enforcing our intellectual property rights or using third party intellectual property could negatively affect our business, financial condition and financial results.
We rely on a combination of contractual rights, trademarks, trade secrets, patents and copyrights to establish and protect intellectual property rights and other proprietary rights in our products and services. These intellectual property rights or other proprietary rights might be challenged, invalidated or circumvented. The steps we have taken to protect our proprietary information may not prevent its misuse, theft or misappropriation. Competitors may independently develop technologies or products that are substantially equivalent or superior to our products or that inappropriately incorporate our intellectual property rights or other proprietary technology into their products. Competitors may hire our former employees who may misappropriate our intellectual property rights or other proprietary technology. Some jurisdictions may not provide adequate legal protection of our intellectual property rights or other proprietary technology.
We may have to defend our rights in intellectual property that we use in our services, and we could be found to infringe the intellectual property rights of others, which could be disruptive and expensive to our business.
We may have to defend against claims that we or our customers are infringing the rights of third parties in patents, copyrights, trademarks and other intellectual property. If we acquire technology to include in our products from third parties, our exposure to infringement actions may increase because we must rely upon these third parties to verify the origin and ownership of such technology. Intellectual property litigation and controversies are disruptive and expensive. Even unmeritorious claims brought against us or our customers may harm our reputation and customer relationships, may cause us to incur significant legal and other fees to defend, and may have to be settled for significant amounts. Infringement claims could require us to develop non-infringing services or enter into expensive royalty or licensing arrangements. Our business, financial condition and financial results could be materially adversely affected if we are not able to develop non-infringing technology or license technology on commercially reasonable terms.
11
Table of Contents
We may face risks from using “open source” software that could negatively affect our business, financial condition and financial results.
Like many other software companies, we use “open source” software in order to take advantage of common industry building blocks and to add functionality to our products quickly and inexpensively. Open source software license terms could adversely affect our intellectual property rights in our products that include open source software. We could lose the right to use the open source code if we fail to comply with the license obligations. Using open source code could also cause us to inadvertently infringe third-party intellectual property rights or require us to publically disclose proprietary information. We have processes and controls in place that are designed to address these risks and concerns, but we cannot be sure that all open source software is submitted for approval prior to use in our products nor that our process or controls will be sufficient to mitigate all risk in this regard.
We may fail to recruit and retain key personnel, which could impair our ability to meet key objectives.
Our success depends on our ability to attract and retain highly-skilled technical, managerial, sales, and marketing personnel. Changes in key personnel may be disruptive to our business. It could be difficult, time consuming and expensive to replace key personnel. Integrating new key personnel may be difficult and costly. Volatility, lack of positive performance in our stock price or changes to our overall compensation program including our stock incentive program may adversely affect our ability to retain key employees, many of whom are compensated, in part, based on the performance of our stock price. The loss of services of any of our key personnel, the inability to retain and attract qualified personnel in the future or delays in hiring required personnel could make it difficult to meet key objectives. Any of these impairments related to our key personnel could negatively affect our business, financial condition and financial results.
Our usage of personal information, and inadvertent exposure of confidential or personal information, could cause us to violate data privacy laws or lose customers and could negatively affect our business, financial condition and financial results.
We collect, process, store, use and transmit large amounts of personally identifiable information about individuals, such as personal healthcare or financial information. Our handling of these types of data is subject to confidentiality agreements with our clients and handling of this data is increasingly subject to regulation around the world. These regulations may result in conflicting requirements and may change over time. Our business could be materially adversely affected if legal restrictions on the use of personally identifiable information are expanded or are interpreted in ways that conflict with our business practices or increase our costs. Unauthorized disclosure of personal or other confidential information (including due to a cyber attack) or other failure by us to comply with data privacy requirements could subject us to significant penalties, damages, remediation and other expenses, and damage to our reputation, any of which could have a material adverse effect on our business, financial condition and financial results.
Governmental restrictions on the sale of our products and services in non-U.S. markets could negatively affect our business, financial condition and financial results.
Exports of software solutions and services using encryption technology such as ours are generally restricted by the U.S. government. Although we have obtained U.S. government approval to export our service to almost all countries, the list of countries to which we (and our distributors) cannot export our products and services could be expanded in the future. In addition, some countries impose restrictions on the use of encryption solutions and services such as ours. The cost of compliance with U.S. and other export laws, or our failure to obtain governmental approvals to offer our products and services in non-U.S. markets, could affect our ability to sell our products and services and could impair our international expansion. We face a variety of other legal and compliance risks. If we or our distributors fail to comply with applicable law and regulations, we may become subject to penalties, fines or restrictions that could materially adversely affect our business, financial condition and financial results.
12
Table of Contents
Our financial performance could be erratic and asset impairments could negatively affect our financial condition and financial results.
Although we generate adequate cash flow from operations to pay our expenses and we expect to remain profitable, we may not continue to produce sufficient cash flow or show a profit. Our balance sheets reflect goodwill relating to our email encryption business, as well as other assets. We periodically evaluate the carrying value of our goodwill and other assets to determine if their values have been impaired, which could require us to recognize a non-cash charge to earnings. Any of these circumstances could materially adversely affect our business, financial condition and financial results.
The market price of our securities could be volatile and our securities may decline in value.
The market price of our common stock has fluctuated significantly in the past and is likely to fluctuate in the future. In addition to stock price volatility related to our business performance, our stock price may fluctuate due to events affecting our industry or our competitors, as well as general economic and political conditions or otherwise. In addition, the stock market has experienced extreme price and volume fluctuations that have affected the market price of many technology companies in general, and such fluctuations were often unrelated to the operating performance of these companies. These fluctuations have and will continue to affect smaller capitalized technology companies like us. Any of these circumstances could cause our securities to decline in value.
Exercises of options for our common stock would dilute the ownership interests of existing shareholders and could negatively affect the value of our securities.
We have a significant number of outstanding options, including options held by our employees. The exercise of options, and the resulting issuance of additional shares of our common stock, would substantially dilute the ownership interests and voting rights of our current shareholders. Issuance or sales of those additional shares could cause our securities to decline in value.
Our issuances of additional debt or equity securities could dilute the ownership interests of existing shareholders and could negatively affect the value of our securities.
We may issue additional debt or equity securities, including convertible debt, common and convertible preferred stock, and warrants to acquire common or preferred stock. Those securities could be issued in public or private transactions, at or below the then-prevailing market price of our securities. In addition, we may grant our employees shares of our common stock and options to purchase those shares. Our issuance of additional securities could substantially dilute the ownership interests and voting rights of our current shareholders. Issuance or sales of those additional shares could cause our securities to decline in value.
Item 1B. Unresolved Staff Comments
None.
During 2011 we leased properties that are considered significant to the operations of the business in the following locations: Burlington, Massachusetts; Ottawa, Ontario, Canada; the United Kingdom; and Dallas and Austin, Texas. Our Burlington employees perform sales and marketing activities. Our Ottawa employees perform both client services and sales support activities. The United Kingdom facility provides data center support for our European customers. The Dallas office is our headquarters, which includes research & development, marketing, sales and all general administrative services, and the ZixData Center. Our Austin location is used primarily for fail-over and business continuity services and is used to some extent to support normal ongoing operations. Our facilities are suitable for our current needs and are considered adequate to support expected near term growth.
13
Table of Contents
We are subject to legal proceedings, claims, and litigation against our business. While the outcome of these matters is currently not determinable, and the costs and expenses of defending these matters may be significant, we currently do not expect that the ultimate costs to resolve these matters will have a material adverse effect on our consolidated financial statements.
Item 4. Mine Safety Disclosures
Not applicable.
14
Table of Contents
Item 5. Market for Registrant’s Common Equity, Related Stockholder Matters and Issuer Purchases of Equity Securities
Our common stock trades on The Nasdaq Stock Market under the symbol ZIXI. The table below shows the high and low sales prices by quarter for fiscal 2011 and 2010.
| 2011 | 2010 | |||||||||||||||
| Quarter Ended |
High | Low | High | Low | ||||||||||||
| March 31 |
$ | 4.88 | $ | 3.28 | $ | 2.51 | $ | 1.69 | ||||||||
| June 30 |
$ | 4.05 | $ | 2.98 | $ | 2.70 | $ | 2.09 | ||||||||
| September 30 |
$ | 4.21 | $ | 2.66 | $ | 2.94 | $ | 2.10 | ||||||||
| December 31 |
$ | 3.00 | $ | 2.16 | $ | 4.55 | $ | 2.70 | ||||||||
At March 6, 2012, there were 62,880,376 shares of common stock outstanding held by 479 stockholders of record. On that date, the last reported sales price of the common stock was $2.88.
We have not paid any cash dividends on our common stock and do not anticipate doing so in the foreseeable future.
For information regarding stock-based compensation awards outstanding and available for future grants, see “Item 12. Security Ownership of Certain Beneficial Owners and Management and Related Stockholder Matters.”
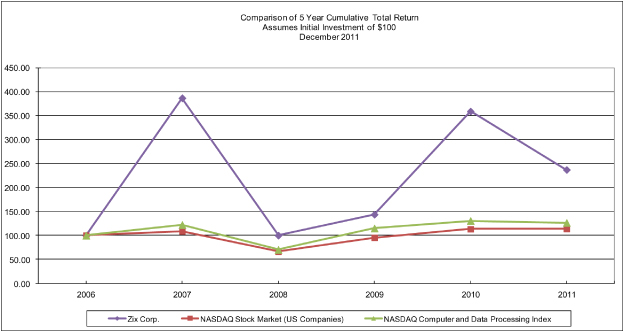
Performance Graph
The following graph compares the cumulative total return of an investment in our common stock over the five-year period ended December 31, 2011, as compared with the cumulative total return of an investment in (i) the Center for Research in Securities Prices (“CRSP”) Total Return Index for Nasdaq Stock Market (U.S. companies) and (ii) the CRSP Total Return Index for Nasdaq Computer and Data Processing Stocks. The comparison assumes $100 was invested on December 31, 2006, in our common stock and in each of the two indices and assumes reinvestment of dividends, if any. The stock price performance on the following graph is not necessarily indicative of future stock performance. A listing of the companies comprising each of the CRSP- NASDAQ indices used in the following graph is available, without charge, upon written request.
15
Table of Contents
Sale of Unregistered Securities
None.
Purchases of Equity Securities by the Issuer
| Period | Total Number of Shares Purchased |
Average Price Paid per Share |
Total Number of Shares Purchased as part of Publicly Announced Plans or Programs1 |
Maximum Number (or Approximate Dollar Value) of Shares (or Units) that May Yet Be Purchased Under the Plans or Programs |
||||||||||||
| October 1, 2011 to October 31, 2011 |
0 | — | 0 | $ | 0,000 | |||||||||||
| November 1, 2011 to November 30, 2011 |
1,181,706 | $ | 2.72 | 1,181,706 | $ | 11,791,000 | ||||||||||
| December 1, 2011 to December 31, 2011 |
1,002,647 | $ | 2.78 | 1,002,647 | $ | 9,000,000 | ||||||||||
|
|
|
|
|
|
|
|
|
|||||||||
| Total |
2,184,353 | $ | 2.75 | 2,184,353 | $ | 9,000,000 | ||||||||||
|
|
|
|
|
|
|
|
|
|||||||||
| 1 | The shares were repurchased under the $15 million stock repurchase program announced November 9, 2011. No shares were purchased other than through publicly announced programs during the periods shown. |
Item 6. Selected Financial Data
The following selected financial data should be read in conjunction with “Item 7. Management’s Discussion and Analysis of Financial Condition and Results of Operations,” the consolidated financial statements and notes thereto. No cash dividends were declared in any of the five years shown below:
| Year Ended December 31, | ||||||||||||||||||||
| 2011 | 2010 | 2009 | 2008 | 2007 | ||||||||||||||||
| (In thousands, except per share data) | ||||||||||||||||||||
| Statement of Operations Data: |
||||||||||||||||||||
| Revenues |
$ | 38,145 | $ | 33,066 | $ | 26,407 | $ | 22,604 | $ | 17,982 | ||||||||||
| Cost of revenues |
7,211 | 6,468 | 4,576 | 4,105 | 4,361 | |||||||||||||||
|
|
|
|
|
|
|
|
|
|
|
|||||||||||
| Gross margin |
30,934 | 26,598 | 21,831 | 18,499 | 13,621 | |||||||||||||||
| Research and development expenses |
5,229 | 5,089 | 3,619 | 2,677 | 2,748 | |||||||||||||||
| Selling, general and administrative expenses |
15,128 | 16,363 | 15,927 | 14,237 | 13,530 | |||||||||||||||
| Customer deposit forfeiture (1) |
— | — | — | — | (2,000 | ) | ||||||||||||||
| Loss on extinguishment of convertible debt (2) |
— | — | — | — | 255 | |||||||||||||||
| Interest expense |
7 | 22 | 21 | — | 171 | |||||||||||||||
| Income tax (benefit) expense to continuing operations (3) |
(11,889 | ) | (35,500 | ) | 67 | 42 | 181 | |||||||||||||
| Income (loss) from continuing operations |
22,554 | 40,720 | 2,411 | 2,149 | (724 | ) | ||||||||||||||
| Basic income (loss) per common share from continuing operations |
$ | 0.34 | $ | 0.63 | $ | 0.04 | $ | 0.03 | $ | (0.01 | ) | |||||||||
| Diluted income (loss) per common share from continuing operations |
$ | 0.34 | $ | 0.61 | $ | 0.04 | $ | 0.03 | $ | (0.01 | ) | |||||||||
| Shares used in computing basic income (loss) per common share |
65,439 | 64,401 | 63,422 | 62,982 | 60,424 | |||||||||||||||
| Shares used in computing diluted income (loss) per common share |
67,262 | 66,742 | 64,051 | 65,856 | 60,424 | |||||||||||||||
| Statements of Cash Flows Data: |
||||||||||||||||||||
| Net cash flows provided by (used for): |
||||||||||||||||||||
| Operating activities |
$ | 13,219 | $ | 7,190 | $ | 603 | $ | 2,064 | $ | (1,443 | ) | |||||||||
| Investing activities |
(1,471 | ) | (1,467 | ) | (1,138 | ) | 493 | (3,155 | ) | |||||||||||
16
Table of Contents
| Financing activities |
(15,687 | ) | 5,609 | 577 | 164 | 2,339 | ||||||||||||||
| Balance Sheet Data: |
||||||||||||||||||||
| Cash, Cash Equivalents and Marketable Securities |
$ | 20,680 | $ | 24,619 | $ | 13,312 | $ | 13,245 | $ | 12,258 | ||||||||||
| Working capital (deficit)(4) |
5,497 | 9,822 | (3,283 | ) | (3,010 | ) | (979 | ) | ||||||||||||
| Total assets |
77,552 | 66,852 | 19,748 | 19,357 | 19,474 | |||||||||||||||
| Debt obligations |
— | 186 | 312 | — | — | |||||||||||||||
| Stockholders’ equity (deficit) |
57,757 | 46,887 | (1,989 | ) | (1,303 | ) | (289 | ) |
Operations Data in the preceding table excludes all activity of the discontinued operations.
| (1) | A Master Services Agreement was entered into with sanofi-aventis for $4.0 million in January 2004 calling for our performance on various future services to be defined over the course of the agreement. Because the services to be provided to sanofi-aventis had not been defined, the payment was recorded as a customer deposit. Because sanofi-aventis failed to define or request services as the contracted delivery date expired in 2007, the corresponding customer deposit was classified as a forfeiture. |
| (2) | The $255,000 loss on extinguishment of debt in 2007 resulted from the restructuring of a note with sanofi-aventis. |
| (3) | The $11.9 million and $35.5 million tax benefits in 2011 and 2010 resulted from the release of a portion of our deferred tax asset valuation allowance. Based on analysis of both projected and current earnings excluding discontinued operations, we have estimated these tax assets as likely to be utilized prior to expiration. See “Income Taxes” in “Item 7. Management’s Discussion and Analysis of Financial Condition and Results of Operations.” |
| (4) | Working capital includes deferred revenue totaling $16.6 million, $15.3 million, $14.5 million, $15.0 million and $12.6 million as of December 31, 2011, 2010, 2009, 2008, and 2007 respectively. |
Item 7. Management’s Discussion and Analysis of Financial Condition and Results of Operations
Forward-Looking Statements
The following discussion and analysis contains forward-looking statements about trends, uncertainties and our plans and expectations of what may happen in the future. Forward-looking statements involve risks and uncertainties that could cause actual events or results to differ materially from the events or results described in the forward-looking statements, including risks and uncertainties described above in “Item 1A. Risk Factors.” Readers are cautioned not to place undue reliance on forward-looking statements. The forward-looking statements are based upon information available to us on the date of this report. We undertake no obligation to publicly update or revise any forward-looking statements, whether as a result of new information, future events or otherwise.
Overview
We are a leader in providing secure email encryption in a SaaS model. Our email encryption service delivers information in a secure manner, enabling the use of Internet-based email for the safe delivery of sensitive information, especially for customers in the healthcare, finance, insurance, and government sectors. A core competency is our ability to deliver this complex service offering with a high level of availability, reliability, integrity and security.
The Company is encouraged by 2011 results and our success is based on continuing to build a solid and predictable business based on our successful subscription business model. Additionally, our results indicate we are transitioning to become a part of mainstream demand for email encryption as data security and integrity issues continue to make headline news. We are also benefiting from a trend toward the use of a powerful cloud-based offering along with the growing need for regulatory compliance.
Our key performance metrics improved compared to the prior year and we reported improved financial performance driven by continued growth in our Email Encryption business. The Company’s operating income for 2011 was $10.6 million, an increase of $5.4 million over prior year, driven by 15% growth in revenue.
Our net income in 2011 included a tax benefit of $11.8 million resulting from a decrease in the Company’s deferred tax asset valuation allowance. This compares to a decrease in our deferred tax asset valuation and resulting tax benefit of $35.3 million in 2010. Net income for 2011 and 2010 excluding the impact of this tax benefit was $10.8 million and $5.9 million, respectively.
17
Table of Contents
Strategy and Focus Areas
The Company’s email encryption subscription service continued to grow in 2011 by adding new customers while retaining a high percentage of existing customers. Our subscription model initially required large up-front investment to establish the service, but over time, the fixed set-up costs are exceeded by the recurring subscription and transaction fees, and incremental costs to add new users are relatively low.
Over the course of 2011 we continued to make investments to strengthen our Email Encryption services through the development of a number of significant portfolio upgrades. We delivered ZixMobility which has set the new standard in simple mobile access for secure email. We also added Single Sign-on, customer web page integration, flexible form provisioning and application-driven email support features to our suite of ZixPort service capabilities. The ZixGateway appliance policy configuration and processing capabilities were expanded in a number of key areas including intelligent integration of transport layer security (TLS) technology into our comprehensive message delivery and reporting frameworks. The new TLS capabilities and the addition of the new ZixAccess inbound service were designed to support continued coverage expansion for our leading transparent message delivery network.
Operationally, our success is primarily dependent upon the following key metrics:
| • | New subscriptions (termed “New First Year Orders” (“NFYO”)) for the Email Encryption Service; |
| • | Retention of subscribers to the Email Encryption Service; |
| • | Total orders (includes NFYO’s, second and third years on multi-year orders and renewals), and; |
| • | Our ability to increase business volume with minimal cost increases. |
Known trends regarding these key metrics and their implication on our current and future capital requirements are discussed throughout this “Management’s Discussion and Analysis of Financial Condition and Results of Operations” (“MD&A”).
There are no assurances we will be successful in our efforts to achieve these key metrics. Our continued growth depends on the timely development and market acceptance of our products and services. See “Item 1A. Risk Factors” for more information on the risks relative to our operations and future prospects.
Discontinued Operations
On December 31, 2010, Zix Corporation completed the previously announced (see Current Reports filed on Form 8-K dated December 8, 2009 and Form 8-K/A dated January 6, 2010) wind down of its e-Prescribing business and discontinued operating this line of business. This business had previously been reported as a segment. The wind down of this business entailed the fulfillment of existing contracts. Assets used by this segment, primarily business computer servers, were compatible with the remaining business, Email Encryption, and were therefore absorbed by our remaining business. As a result, no gain or loss on disposal of assets was incurred. Prior to the completion of the wind down, this business line had been a reportable segment. The following table summarizes the components of the Income (loss) from discontinued operations presented in our Statement of Operations for 2010 and 2009. There was no activity relating to e-Prescribing in 2011.
| Year Ended December 31, | ||||||||
| 2010 | 2009 | |||||||
| Revenues |
$ | 2,632,000 | $ | 4,244,000 | ||||
| Cost of revenues |
1,266,000 | 4,808,000 | ||||||
|
|
|
|
|
|||||
| Gross margin |
1,366,000 | (564,000 | ) | |||||
| Research and development expenses |
300,000 | 3,329,000 | ||||||
| Selling, general and administrative expenses |
304,000 | 2,953,000 | ||||||
|
|
|
|
|
|||||
| Income (loss) before income taxes |
$ | 762,000 | $ | (6,846,000 | ) | |||
|
|
|
|
|
|||||
In December of 2009, the Company announced it would wind down the e-Prescribing business and exit the business by December 31, 2010. During 2010 we reduced the costs of operating this business and transferred shared resources to the remaining business while meeting the requirements of our existing contracts. We also discontinued
18
Table of Contents
our recruiting efforts for new e-Prescribing deployments and reduced the associated recruitment and deployment expenses. Additionally, customers requesting to renew existing contracts set to expire during 2010 were renewed to terminate no later than December 31, 2010. These actions resulted in significantly lower costs and lower revenue in 2010 compared to 2009 for the e-Prescribing business. The 2010 income before income taxes of $762,000 resulted primarily from the continued recognition of deferred revenue during the year while reducing expenses in cost of revenues, research and development, and SG&A.
Unless specifically noted, the financial information contained and discussed in our MD&A is that of our continuing operations only.
Revenue
Revenue increased by 15% in 2011 compared with 2010. Our growth was driven by our successful subscription model that continues to yield steady additions to the subscriber base coupled with a high rate of renewing existing customers.
Operating Margins
For the year ended December 31, 2011, our gross profit of $30.9 million increased 16% compared to 2010. This increase was primarily driven by increased revenue. Our 2011 operating income of $10.6 million improved $5.4 million over the prior year. Income from continuing operations for 2011 included a $11.8 million reduction to the Company’s deferred tax asset valuation allowance. This reduction was recorded as a tax benefit in 2011. Income from continuing operations for 2010 included a $35.3 million reduction to the Company’s deferred tax asset valuation allowance, also recorded as a tax benefit in 2010. Income from continuing operations for 2011 and 2010 excluding the impact of this tax benefit was $10.8 million and $5.9 million, respectively.
Other Financial Highlights
| • | Email Encryption backlog was $53.7 million at the end of 2011, compared with $49.9 million at the end of 2010 |
| • | Total orders for 2011 were $42.3 million, an increase of 4% from the 2010 total orders of $40.8 million |
| • | Our deferred revenue at the end of 2011 was $17.4 million, compared with $16.8 million at the end of 2010 |
| • | We generated cash flows from operations of $13.2 million during fiscal 2011. Our cash and cash equivalents were $20.7 million at the end of 2011, compared with $24.6 million at the end of 2010. Our decline in cash was the result of $21.0 million spent in 2011 to repurchase our stock. |
| • | Our shared, cloud-based ZixDirectory now has over 30 million members including some of the most respected institutions in the country |
Critical Accounting Policies and Estimates
In preparing our consolidated financial statements, we make estimates, assumptions and judgments that can have a significant impact on revenue, income (loss) from operations and net income (loss), as well as the value of certain assets and liabilities on our consolidated balance sheet. The application of our critical accounting policies requires an evaluation of a number of complex criteria and significant accounting judgments by us. Management bases its estimates on historical experience and on various other assumptions that are believed to be reasonable under the circumstances, the results of which form the basis for making judgments about the carrying values of assets and liabilities. We evaluate our estimates on a regular basis and make changes accordingly. Senior management has discussed the development, selection and disclosure of these estimates with the Audit Committee of our Board of Directors. Actual results may materially differ from these estimates under different assumptions or conditions. If actual results were to differ from these estimates materially, the resulting changes could have a material adverse effect on the consolidated financial statements.
19
Table of Contents
We consider accounting policies to be critical when they require us to make assumptions about matters that are highly uncertain at the time the accounting estimate is made and when different estimates that our management reasonably have used have a material effect on the presentation of our financial condition, changes in financial condition or results of operations. Management believes the following critical accounting policies reflect our more significant estimates and assumptions used in the preparation of the consolidated financial statements.
Our critical accounting policies included the following:
| • | Revenue recognition |
| • | Income taxes |
| • | Valuation of goodwill and other intangible assets |
| • | Stock-based compensation costs |
For additional discussion of the Company’s significant accounting policies, refer to Note 2 to the consolidated financial statements.
Revenue Recognition
We develop, market, and support applications that connect, protect and deliver information in a secure manner. Our services can be placed into several key revenue categories where each category has similar revenue recognition traits: Email Encryption subscription-based services, various transaction fees and related professional services. The majority of the revenues generated are through a combination of direct sales and a network of resellers and other distribution partners.
Under all product categories and distribution models, we recognize revenue after all of the following occur:
| • | persuasive evidence of an arrangement exists, |
| • | delivery has occurred or services have been rendered, |
| • | the price is fixed and determinable, and |
| • | collectability is reasonably assured. |
When we are engaged in a complex product deployment, customer acceptance may have to occur before the transaction is considered complete. In this situation, no revenue is recognized until the customer accepts the product. Discounts provided to customers are recorded as reductions in revenue.
Our Email Encryption Service is a subscription service. Providing this service includes delivering subscribed-for software and providing secure electronic communications and customer support throughout the subscription period. Our email subscribers generally execute multiple-year contracts that are irrevocable and non-refundable in nature and require annual, up-front payments. Subscription fees received from customers are initially recorded as deferred revenue and then recognized as revenue ratably over the subscription period. We do not offer stand alone services. Further, our services primarily include manufacturer provided warranty provisions. We recorded no warranty expense in any of the presented periods.
Income Taxes
Deferred tax assets are recognized if it is “more likely than not” that the benefit of the deferred tax asset will be realized on future federal income tax returns. At December 31, 2011, we provided a valuation allowance against a significant portion, $57,384,000, of our accumulated U.S. deferred tax assets. This significant valuation allowance reflects our historical losses and the uncertainty of future taxable income sufficient to utilize net operating loss carryforwards prior to their expiration. Our total deferred tax asset not subject to a valuation allowance is valued at $50,357,000, and consists of $41,069,000 for federal net operating loss carryforwards, $6,079,000 relating to temporary timing differences between GAAP and tax-related expense, $2,341,000 relating to U.S. state income tax credits, $859,000 related to Alternative Minimum Tax credits and $9,000 for a Canadian deferred tax asset relating to temporary timing differences between GAAP and tax-related expense. If U.S. taxable income increases from its current level in a future period or if the facts and circumstances on which our estimates and assumptions are based were to change, thereby impacting the likelihood of realizing the deferred tax assets, judgment would have to be
20
Table of Contents
applied in determining the amount of valuation allowance no longer required. Reversal of all or a part of this valuation allowance could have a significant positive impact on operating results in the period that it becomes more likely than not that certain of the Company’s deferred tax assets will be realized. Alternatively, should our future income decrease from current levels, a resulting increase to all or a part of this valuation allowance could also have a significant negative impact on our operating results.
The Company previously recorded a $327,000 tax contingency liability related to tax year 2004, and that amount and the specifics therein have remained unchanged except for currency translation adjustments. As of December 31, 2010, the gross amount of our unrecognized tax benefits, inclusive of the $327,000 tax liability and $50,000 in other uncertain positions in 2008, was approximately $461,000. Because the statute of limitations expired on the returns associated with these uncertain positions, this contingency was reversed in 2011, creating a positive impact on our operating results.
Valuation of Goodwill and Other Intangible Assets
We account for the valuation of goodwill and other intangible assets after classifying intangible assets into three categories: (1) intangible assets with finite lives subject to amortization; (2) intangible assets with indefinite lives not subject to amortization; and (3) goodwill. For intangible assets with finite lives, tests for impairment must be performed if conditions exist that indicate that the carrying value may not be recoverable. For intangible assets with indefinite lives and goodwill, tests for impairment must be performed at least annually or more frequently if events or circumstances indicate that assets might be impaired.
Goodwill was $2,161,000, or 3% of total assets for the years ended December 31, 2010 and 2011.
Our goodwill is not being amortized, but we do evaluate the goodwill for impairment annually in the fourth quarter, or when there is reason to believe that the value has been diminished or impaired. Evaluations for possible impairment are based upon a comparison of the estimated fair value of the reporting unit to which the goodwill has been assigned to, versus the sum of the carrying value of the assets and liabilities of that unit including the assigned goodwill value. The fair values used in this evaluation are estimated based on the Company’s market capitalization, which is based on the outstanding stock and market price of the stock. Impairment is deemed to exist if the net book value of the unit exceeds its estimated fair value. We have evaluated our goodwill and determined no impairment is required.
Stock-based Compensation
We have non-qualified stock options outstanding to employees, directors, and third parties under various stock option plans. The plans require the exercise price of options granted under these plans to equal or exceed the fair market value of the Company’s common stock on the date of grant. The options, subject to termination of employment, generally expire ten years from the date of grant. Employee options typically vest pro-rata and quarterly over three years. Option grants to employees, officers and directors frequently contain accelerated vesting provisions upon the occurrence of a change of control, as defined in the applicable option agreements. We use the straight-line amortization method for recognizing stock option compensation costs. Our share-based awards are limited to stock options.
Full Year 2011 Summary of Operations
Financial
| • | Revenue for 2011 was $38,145,000 compared with $33,066,000 in 2010 and $26,407,000 in 2009. |
| • | Gross margin for 2011 was $30,934,000 or 81% of revenues compared to $26,598,000 or 80% of revenues in 2010 and $21,831,000 or 83% of revenues in 2009. |
| • | Income from continuing operations for the year 2011 was $22,554,000 compared with income from continuing operations of $40,720,000 in 2010 and $2,411,000 in 2009. |
21
Table of Contents
| • | Net income for the year 2011 was $22,554,000 compared with net income of $41,213,000 in 2010 and a net loss of $4,435,000 in 2009. Included in net income for 2011 was a reduction in our deferred tax asset valuation allowance of $11,800,000 which was recorded as a tax benefit. The tax benefit recorded on the reduction of our deferred tax valuation allowance in 2010 was $35,300,000. |
| • | Unrestricted cash was $20,680,000 on December 31, 2011. |
Results of Operations
Revenue
The following table sets forth a year-over-year comparison of our total revenues:
| Year Ended December 31, | Variance 2011 vs. 2010 |
Variance 2010 vs. 2009 |
||||||||||||||||||||||||||
| 2011 | 2010 | 2009 | $ | % | $ | % | ||||||||||||||||||||||
| Revenues |
$ | 38,145,000 | $ | 33,066,000 | $ | 26,407,000 | $ | 5,079,000 | 15 | % | $ | 6,659,000 | 25 | % | ||||||||||||||
Our growth model seeks to continually add new users to the subscriber base, while at the same time retaining a high percentage of existing subscribers whose subscriptions are up for renewal. Our customer retention rates were greater than 90% for the periods presented. The 15% growth in 2011 compared to 2010 was lower than the 25% achieved in 2010 compared to 2009 due to lower NFYOs in 2011 compared to 2010. The drop in NFYOs in 2011 compared to 2010 is attributable primarily to uncertainty in the overall economy and related slower growth in our served market coupled with several one time events in early 2011 including a sales reorganization.
Across all periods presented, revenue increases were driven primarily by strong performances in our three core vertical sales markets: healthcare, finance and government and other non-core markets. Additionally, sales continued from a wide base of distributors – new first year orders derived from our value added resellers, OEM and third party distribution channels for 2011 was 52% of the total NFYO compared to 53% in 2010. We measure additions to the subscriber base by NFYO, which is defined as the portion of new orders that are expected to be recognized into revenue in the first twelve months of the contract. NFYOs are summarized in the table below:
| Year Ended December 31, | ||||||||||||
| 2011 | 2010 | 2009 | ||||||||||
| New first year order value |
$ | 7,081,000 | $ | 8,670,000 | $ | 6,478,000 | ||||||
Our go-to-market selling strategy seeks primarily multiple-year subscription contracts with the fees paid annually at the inception of each year of service. As a result, a high percentage of customers subscribe to the Email Encryption Service for a three-year term versus a one-year term. We expect this preference for a longer contract term by a high percentage of our customers to continue in 2012, as we have priced our services in a manner that encourages longer-term contractual commitments from customers.
Our list pricing has remained generally consistent during the periods shown above. We have continued to experience some market pricing pressure resulting in additional discount percentages off our list price during this period. There are no assurances that potential increased competition in this market or other factors will not result in future price erosion. Price erosion, should it occur, could have a dampening effect on the revenue derived from our new orders.
Revenue Outlook:
With our continued focus on sectors such as healthcare, financial services, insurance, government, and expansion into other non-core markets, along with the increased use of indirect OEM distribution and value-added reseller channels, we expect to see the business increase its new first year orders in 2012 and fuel a continued increase in our year-over-year revenue.
22
Table of Contents
Backlog and Orders
Backlog — Our order backlog was $53.7 million at December 31, 2011 compared to $49.9 million at the end of 2010. The backlog is comprised of contractually bound agreements that we expect to amortize into revenue. As of December 31, 2011, the backlog was comprised of the following elements: $17,363,000 of deferred revenue that has been billed and paid, $4,622,000 billed but unpaid, and approximately $31,739,000 of unbilled contracts.
The backlog is recognized into revenue ratably as the services are performed. Approximately 57% of the total backlog is expected to be recognized as revenue during the next twelve months.
Orders — Total orders in 2011 were $42,302,000 compared with $40,763,000 in 2010. Total orders are comprised of contract renewals, NFYOs, and in the case of new multi-year contracts, the years beyond the first year of service.
Cost of Revenues
The following table sets forth a year-over-year comparison of the cost of revenues.
| Year Ended December 31, | Variance 2011 vs. 2010 |
Variance 2010 vs. 2009 |
||||||||||||||||||||||||||
| 2011 | 2010 | 2009 | $ | % | $ | % | ||||||||||||||||||||||
| Cost of revenues |
$ | 7,211,000 | $ | 6,468,000 | $ | 4,576,000 | $ | 743,000 | 11 | % | $ | 1,892,000 | 41 | % | ||||||||||||||
Cost of revenues is comprised of costs related to operating and maintaining the ZixData Center, a field deployment team, customer service and support and the amortization of Company-owned, customer-based computer appliances. A significant portion of the total cost of revenues relates to the ZixData Center, which currently has excess capacity. Accordingly, cost of revenues is relatively fixed and is therefore expected to grow at a slower pace than revenue. The increase in 2011 of $743,000 resulted primarily from shifting shared and fixed costs previously absorbed by the e-Prescribing product line. Personnel and other costs remained relatively flat year over year.
During 2010, we wound down the operations of our e-Prescribing product line and transitioned a significant amount of shared resource costs from e-Prescribing to Email Encryption. Additionally, we shifted fixed costs that were previously absorbed by e-Prescribing. The cost of revenues increase in 2010 compared to 2009 resulted primarily from this shifting of shared resource costs and allocated fixed costs.
Research and Development Expenses
The following table sets forth a year-over-year comparison of our research and development expenses from continuing operations:
| Year Ended December 31, | Variance 2011 vs. 2010 |
Variance 2010 vs. 2009 |
||||||||||||||||||||||||||
| 2011 | 2010 | 2009 | $ | % | $ | % | ||||||||||||||||||||||
| Research and development expenses |
$ | 5,229,000 | $ | 5,089,000 | $ | 3,619,000 | $ | 140,000 | 3 | % | $ | 1,470,000 | 41 | % | ||||||||||||||
Research and development expenses consist primarily of salary, benefits and stock-based compensation for our development staff, and other costs associated with improving our existing products and services and developing new products and services. The increase in expenses in 2011 compared to 2010 resulted primarily from costs associated with shifting resources from e-Prescribing to Email Encryption, approximately $300,000. These costs were partially offset by lower stock-based compensation expense of $115,000 and other small reductions across various research and development expenses.
During 2010 we wound down the e-Prescribing operation and shifted previously shared resources and the related expenses to the remaining business, Email Encryption. Additionally, we shifted fixed expenses previously absorbed by e-Prescribing to Email Encryption. The year over year increase in research and development expenses for 2010 compared to 2009 resulted primarily from this shifting of shared resource costs and fixed expenses to Email Encryption.
23
Table of Contents
Selling, General and Administrative Expenses
The following table sets forth a year-over-year comparison of our selling, general and administrative expenses from continuing operations:
| Year Ended December 31, | Variance 2011 vs. 2010 |
Variance 2010 vs. 2009 |
||||||||||||||||||||||||||
| 2011 | 2010 | 2009 | $ | % | $ | % | ||||||||||||||||||||||
| Selling, general and administrative expenses |
$ | 15,128,000 | $ | 16,363,000 | $ | 15,927,000 | $ | (1,235,000 | ) | (8 | %) | $ | 436,000 | 3 | % | |||||||||||||
Selling, general and administrative expenses consist primarily of salary, commissions, travel, stock-based compensation and benefits for marketing, selling and executive and administrative personnel. Also included are costs associated with advertising and promotions and fees for professional services and other general corporate activities.
The decrease in 2011 compared to 2010 resulted primarily from lower commissions and bonuses on lower NFYOs ($1,229,000), lower stock-based compensation expense ($1,013,000), and lower severance expenses ($247,000). These reductions were partially offset by increased professional fees ($831,000) including commissions paid to repurchase our stock and the shift of shared and fixed costs in 2011 previously allocated the e-Prescribing ($556,000). The small remaining variance ($113,000) consists of relatively minor changes in various other SG&A expenses none of which were materially significant.
The increase in 2010 compared to 2009 resulted primarily from higher marketing expenses, sales commissions and travel expenses due primarily to sales growth. These increases were partially offset by lower severance and professional fees, both related to the wind down of the e-Prescribing business.
Interest Expense
Interest expense for 2011, 2010 and 2009 was $7,000, $22,000 and $21,000 respectively, consisting of interest related to a license subscription promissory note payable.
Investment and Other Income
Investment and other income was $95,000, $96,000, and $214,000 for the years ended December 31, 2011, 2010, and 2009, respectively. The decreasing amounts in all years presented was primarily driven by lower interest rates.
Income Taxes
Our Company or one of our subsidiaries files income tax returns in the U.S. federal jurisdiction and various states and in the Canadian federal and provincial jurisdictions. We recognize and measure uncertain tax positions using a two-step approach. The first step is to evaluate the tax position for recognition by determining if the weight of available evidence indicates that it is more likely than not that the position will be sustained on audit, including resolution of related appeals or litigation processes, if any. The second step is to measure the tax benefit as the largest amount that is more than 50% likely of being realized upon settlement.
The Company’s income tax (benefit) expense for 2011, 2010, and 2009 of ($11,889,000), ($35,231,000), and $67,000, respectively, represents refundable U.S. Alternative Minimum Tax, U.S. research and development credits, non-U.S. taxes payable related to the operations of the Company’s Canadian subsidiary established in late 2002, state income taxes, and reversals of a portion of the Company’s historical valuation allowance.
Significant judgment is required in determining any valuation allowance recorded against deferred tax assets. In assessing the need for a valuation allowance, we consider available evidence, including past earnings, estimates of future taxable income, and the feasibility of tax planning strategies. At December 31, 2011, the Company partially reserved its U.S. net deferred tax assets due to the uncertainty of future taxable income sufficient to utilize net loss carryforwards prior to their expiration. The portion of the Company’s deferred tax asset not reserved was $50,357,000. The majority of this unreserved portion related to $41,069,000 U.S. net operating losses (“NOLs”) because we believe the Company will generate sufficient taxable income in future years to utilize these NOLs prior
24
Table of Contents
to their expiration. The remaining balance consists of $6,079,000 relating to temporary timing differences between GAAP and tax-related expense, $2,341,000 relating to U.S. state income tax credits, $859,000 related to Alternative Minimum Tax credits, and $9,000 of our Canadian deferred tax asset relating to temporary timing differences between GAAP and tax-related expense.
We have determined that utilization of existing net operating losses against future taxable income is not limited by Section 382 of the Internal Revenue Code. Future ownership changes, however, may limit the company’s ability to fully utilize its existing net operating loss carryforwards against any future taxable income.
If we begin to generate additional U.S. taxable income in a future period or if the facts and circumstances on which our current estimates and assumptions are based were to change, thereby impacting the likelihood of realizing a greater or lesser amount of our deferred tax assets, judgment would have to be applied in determining the amount of valuation allowance required. Adjusting our valuation allowance could have a significant positive impact on operating results in the period that it becomes more likely than not that an additional portion of our deferred tax assets will or will not be realized.
Our provision for income taxes is subject to volatility and could be adversely impacted by earnings being lower or higher than anticipated; by tax effects of nondeductible compensation; or by changes in tax laws, regulations, or accounting principles, including accounting for uncertain tax positions or interpretations. Significant judgment is required to determine the recognition and measurement applicable to all income tax positions. This includes the potential recovery of previously paid taxes, which if settled unfavorably could adversely affect our provision for income taxes or additional paid-in capital. In addition, our income tax returns are subject to examination by the Internal Revenue Service and other tax authorities. We regularly assess the likelihood of adverse outcomes resulting from these examinations to determine the adequacy of our provision for income.
Net Income (Loss)
Income from continuing operations – In 2011, the Company’s income from continuing operations was $22,554,000 compared to $40,720,000 and $2,411,000 in 2010 and 2009, respectively. The 2011 amount included a tax benefit of $11,800,000 resulting from a decrease in the deferred tax valuation allowance. The tax benefit resulting from the decrease in the deferred tax valuation allowance was $35,300,000 in 2010.
Income (loss) from discontinued operations – The Company exited the e-Prescribing business at December 31, 2010 and therefore had no activity from discontinued operations in 2011. In 2010, income from discontinued operations was $493,000 compared to a loss from discontinued operations of $6,846,000 in 2009. The income improvement in 2010 compared to 2009 resulted primarily from recognizing remaining deferred revenue during the wind down when most of the costs associated with the discontinued e-Prescribing business had been eliminated or transferred to our remaining business, Email Encryption.
Net Income (loss) – The Company generated net income of $22,554,000 in 2011 compared to net income of $41,213,000 in 2010 and a net loss of ($4,435,000) in 2009. The net income in 2011 included a decrease in the Company’s deferred tax asset valuation allowance resulting in a tax benefit of $11,800,000. The decrease in the deferred tax valuation allowance in 2010 resulted in a $35,300,000 tax benefit. The following table summarizes this and other components included in the net income (loss) for these three years.
| Year Ended December 31, | ||||||||||||
| 2011 | 2010 | 2009 | ||||||||||
| Other Components included in Net Income (Loss): |
||||||||||||
| Non-recurring severance payments |
$ | — | $ | 358,000 | $ | 1,451,000 | ||||||
| Decrease in the deferred tax asset valuation allowance |
(11,800,000 | ) | (35,300,000 | ) | — | |||||||
| Decrease in Canadian uncertain tax position liability |
(450,000 | ) | — | — | ||||||||
| Expenses related to the strategic review of the e-Prescribing business |
— | 164,000 | 393,000 | |||||||||
|
|
|
|
|
|
|
|||||||
| Total |
$ | (12,250,000 | ) | $ | (34,778,000 | ) | $ | 1,844,000 | ||||
|
|
|
|
|
|
|
|||||||
25
Table of Contents
Liquidity and Capital Resources
Overview
Based on our 2011 financial results and current expectations, we believe our cash and cash equivalents, and cash generated from operations, will satisfy our working capital needs, capital expenditures, investment requirements, contractual obligations, commitments, future customer financings, and other liquidity requirements associated with our operations through at least the next twelve months. We plan for and measure our liquidity and capital resources through an annual budgeting process. At December 31, 2011, our cash and cash equivalents totaled $20.7 million and we held no debt.
For the year ended December 31, 2011, we achieved a 15% growth in revenue, 81% gross margin and strong cash collections leading to improved financial performance. This improvement was primarily driven from increased revenues while holding our costs relatively flat. We expect this trend to continue in the foreseeable future, and believe a significant portion of our spending is discretionary and flexible and that we have the ability to adjust overall cash spending to react, as needed, to any shortfalls in projected cash.
Sources and Uses of Cash
| Years Ended December 31, | ||||||||||||
| 2011 | 2010 | 2009 | ||||||||||
| Net cash provided by operations |
$ | 13,219,000 | $ | 7,190,000 | $ | 603,000 | ||||||
| Net cash used in investing activities |
$ | (1,471,000 | ) | $ | (1,467,000 | ) | $ | (1,138,000 | ) | |||
| Net cash provided by (used in) financing activities |
$ | (15,687,000 | ) | $ | 5,609,000 | $ | 577,000 | |||||
For 2011 and 2010, our primary source of liquidity from operations was the collection of revenue in advance from our customers, accounts receivable from our customers, and the management of the timing of payments to our vendors and service providers.
Cash used in our investing activities in 2011 related to purchases of various computing equipment primarily to satisfy customer contracts. Approximately 30% of these capital purchases were for computer servers, which are required to deliver our services.
Cash used in financing activities in 2011 included $21,000,000 used to repurchase our common stock and $186,000 to fund a small promissory note associated with computer operating system licenses. These usages were partially offset by $5,500,000 received from the exercise of stock options and warrants. The cash provided from financing activities in 2010 was due to the exercise of stock options and warrants.
Options and Warrants of ZixCorp Common Stock
We have significant options outstanding that are currently vested. There is no assurance that any of these options will be exercised; therefore the extent of future cash inflow from additional option activity is not certain. The following table summarizes the options that were outstanding as of December 31, 2011. The vested options are a subset of the outstanding options. The value of the options is the number of options exercisable into shares multiplied by the exercise price for each share.
| Summary of Outstanding Options | ||||||||||||||||
| Exercise Price Range |
Outstanding Options |
Total Value
of Outstanding Options |
Vested
Options (included in outstanding options) |
Total Value
of Vested Options |
||||||||||||
| $1.11 - $1.99 |
1,346,067 | $ | 2,065,000 | 1,247,682 | $ | 1,891,000 | ||||||||||
| $2.00 - $3.49 |
1,035,048 | 2,734,000 | 854,965 | 2,328,000 | ||||||||||||
| $3.50 - $4.99 |
2,943,800 | 12,728,000 | 2,492,042 | 10,986,000 | ||||||||||||
| $5.00 - $5.99 |
495,927 | 2,519,000 | 495,927 | 2,519,000 | ||||||||||||
| $6.00 - $8.99 |
533,816 | 3,494,000 | 533,816 | 3,494,000 | ||||||||||||
| $9.00 - $11.00 |
792,792 | 8,496,000 | 792,792 | 8,496,000 | ||||||||||||
|
|
|
|
|
|
|
|
|
|||||||||
| Total |
7,147,450 | $ | 32,036,000 | 6,417,224 | $ | 29,714,000 | ||||||||||
|
|
|
|
|
|
|
|
|
|||||||||
26
Table of Contents
The following table summarizes the warrants for common stock that were outstanding as of December 31, 2011. The value of the warrants is the number of warrants exercisable into shares multiplied by the exercise price for each share.
| Summary of Outstanding Warrants | ||||||||
| Exercise Price Range |
Outstanding Warrants |
Total Value of Outstanding Warrants |
Vested Warrants (included in outstanding warrants) |
Total Value of Vested Warrants | ||||
| $4.48 |
145,853 | $653,000 | 145,853 | $653,000 | ||||
All 145,853 warrants remaining at December 31, 2011, expired in January 2012.
Liquidity Summary
Based on our current 2012 budget plans, we believe we have adequate resources and liquidity to sustain operations for the next twelve months.
Off-Balance Sheet Arrangements
None.
Contractual Obligations and Contingent Liabilities and Commitments
We have total contractual obligations over the next year of $1,236,000 and $3,089,000 over the next three years primarily consisting of various operating office lease agreements.
A summary of our fixed contractual obligations and commitments at December 31, 2011, is as follows:
| Payments Due by Period | ||||||||||||||||||||
| Total | 1 Year | 2-3 Years | 4-5 Years | > 5 Years | ||||||||||||||||
| Operating leases |
$ | 3,339,000 | $ | 1,236,000 | $ | 1,853,000 | $ | 250,000 | $ | — | ||||||||||
We have severance agreements with certain employees which would require us to pay approximately $1,599,000 if all such employees separated from employment with our Company following a change of control, as defined in the severance agreements.
New Accounting Standards
Testing for Goodwill Impairment
In September 2011, the Financial Accounting Standards Board (“FASB”) amended guidance on testing goodwill for impairment. Under the new guidance, entities testing goodwill for impairment have the option of performing a qualitative assessment before calculating the fair value of a reporting unit in step 1 of the goodwill impairment test. If entities determine, on the basis of qualitative factors, that the fair value of a reporting unit is more likely than not less than the carrying value amount, the two-step impairment test would be required. Otherwise, further testing would not be needed. The new guidance does not change how goodwill is calculated, nor does it revise the requirement to test goodwill annually for impairment or between tests if events or circumstances warrant. The amended guidance is effective for us for fiscal year 2012, with earlier adoption permitted. We do not anticipate that this new guidance will have a material impact on our consolidated financial statements.
Presentation of Other Comprehensive Income
In June 2011, the FASB issued guidance that requires entities to report components of comprehensive income in either a continuous statement of comprehensive income or two separate but consecutive statements. The guidance removes the option to present the components of other comprehensive income (“OCI”) as part of the statement of
27
Table of Contents
equity. This guidance is effective for us for fiscal year 2012, and must be applied retrospectively for all periods presented in the financial statements. The new guidance does not apply to entities that have no items of OCI in any period presented. We do not anticipate that this new guidance will have a material impact on our consolidated financial statements.
Revenue Recognition
In October 2009, the FASB issued guidance on revenue recognition that became effective January 1, 2011. Under the new guidance tangible products that have software components that are essential to the functionality of the tangible product will no longer be within the scope of the software revenue recognition guidance; such software-enabled products will now be subject to other relevant revenue recognition guidance. Additionally, the FASB issued authoritative guidance on revenue arrangements with multiple deliverables that are outside the scope of the software revenue recognition guidance. Under the new guidance, when vendor specific objective evidence or third party evidence for deliverables in an arrangement cannot be determined, a best estimate of the selling price is required to separate deliverables and allocate arrangement consideration using the relative selling price method. The new guidance includes new disclosure requirements on how the application of the relative selling price method affects the timing and amount of revenue recognition. This guidance did not have a material impact on our consolidated financial statements.
Item 7A. Quantitative and Qualitative Disclosures About Market Risk
We do not believe that we face exposure to material market risk with respect to our cash, cash equivalents and restricted cash investments, which totaled $20,680,000 and $24,619,000 at December 31, 2011 and 2010, respectively. We held no marketable securities as of December 31, 2011 and 2010.
Item 8. Financial Statements and Supplementary Data
The information required by this Item 8 begins on page F-1 of this Annual Report.
Item 9. Changes in and Disagreements with Accountants on Accounting and Financial Disclosure
None.
Item 9A. Controls and Procedures
Effectiveness of Disclosure Controls and Procedure
In accordance with Rule 13a-15(b) of the Exchange Act, as of the end of the period covered by this Annual Report on Form 10-K, management evaluated, with the participation of our principal executive officer and principal accounting officer, the effectiveness of the design and operation of the Company’s disclosure controls and procedures (as defined in Rule 13a-15(e) under the Exchange Act). Based on their evaluation of these disclosure controls and procedures, they have concluded that our disclosure controls and procedures were effective as of the date of such evaluation.
Certifications of our principal executive officer and our principal accounting officer, which are required in accordance with Rule 13a- 14 of the Exchange Act, are attached as exhibits to this Annual Report. This “Controls and Procedures” section includes the information concerning controls evaluation referred to in the certifications, and it should be read in conjunction with the certifications for a more complete understanding of the topics presented.
Management’s Annual Report on Internal Control Over Financial Reporting
Management is responsible for establishing and maintaining adequate internal control over financial reporting, as such term is defined in Exchange Act Rule 13a-15(f). Because of its inherent limitations, internal control over financial reporting may not prevent or detect misstatements. Also, projections of any evaluation of effectiveness to future periods are subject to risk that controls may become inadequate because of changes in conditions, or that the degree of compliance with the policies or procedures may deteriorate.
28
Table of Contents
Management assessed the effectiveness of our internal control over financial reporting as of December 31, 2011. In making this assessment, management used the criteria set forth by the Committee of Sponsoring Organizations of the Treadway Commission in “Internal Control—Integrated Framework”. Based on this assessment, our management concluded that, as of December 31, 2011, our internal control over financial reporting was effective based on those criteria.
The effectiveness of our internal control over financial reporting as of December 31, 2011, has been audited by Whitley Penn LLP, an independent registered public accounting firm, as stated in their report which is included herein.
Changes in Internal Controls over Financial Reporting
During the three months ended December 31, 2011, there have been no changes in our internal control over financial reporting identified in connection with the evaluation described above that have materially affected or are reasonably likely to materially affect internal control over financial reporting.
29
Table of Contents
REPORT OF INDEPENDENT REGISTERED PUBLIC ACCOUNTING FIRM
To the Board of Directors and Stockholders
Zix Corporation
We have audited Zix Corporation and subsidiaries’ (the “Company”) internal control over financial reporting as of December 31, 2011 based on criteria established in Internal Control—Integrated Framework issued by the Committee of Sponsoring Organizations of the Treadway Commission. The Company’s management is responsible for maintaining effective internal control over financial reporting and for its assessment of the effectiveness of internal control over financial reporting included in the accompanying Management’s Report on Internal Control Over Financial Reporting. Our responsibility is to express an opinion on the Company’s internal control over financial reporting based on our audit.
We conducted our audit in accordance with the standards of the Public Company Accounting Oversight Board (United States). Those standards require that we plan and perform the audit to obtain reasonable assurance about whether effective internal control over financial reporting was maintained in all material respects. Our audit of internal control over financial reporting included obtaining an understanding of internal control over financial reporting, assessing the risk that a material weakness exists, and testing and evaluating the design and operating effectiveness of internal control based on the assessed risk. Our audit also included performing such other procedures as we considered necessary in the circumstances. We believe that our audit provides a reasonable basis for our opinion.
A company’s internal control over financial reporting is a process designed to provide reasonable assurance regarding the reliability of financial reporting and the preparation of financial statements for external purposes in accordance with generally accepted accounting principles. A company’s internal control over financial reporting includes those policies and procedures that (1) pertain to the maintenance of records that, in reasonable detail, accurately and fairly reflect the transactions and dispositions of the assets of the company; (2) provide reasonable assurance that transactions are recorded as necessary to permit preparation of financial statements in accordance with generally accepted accounting principles, and that receipts and expenditures of the company are being made only in accordance with authorizations of management and directors of the company; and (3) provide reasonable assurance regarding prevention or timely detection of unauthorized acquisition, use, or disposition of the company’s assets that could have a material effect on the financial statements.
Because of its inherent limitations, internal control over financial reporting may not prevent or detect misstatements. Also, projections of any evaluation of effectiveness to future periods are subject to the risk that controls may become inadequate because of changes in conditions, or that the degree of compliance with the policies or procedures may deteriorate.
In our opinion, the Company maintained, in all material respects, effective internal control over financial reporting as of December 31, 2011, based on criteria established in Internal Control—Integrated Framework issued by the Committee of Sponsoring Organizations of the Treadway Commission.
We have also audited, in accordance with the standards of the Public Company Accounting Oversight Board (United States), the consolidated balance sheets of the Company as of December 31, 2011 and 2010, and the related consolidated statements of operations, changes in stockholders’ equity (deficit), and cash flows for each of the three years in the period ended December 31, 2011, and our report dated March 9, 2012, expressed an unqualified opinion on those consolidated financial statements.
/s/ WHITLEY PENN LLP
Dallas, Texas
March 9, 2012
30
Table of Contents
None.
31
Table of Contents
Item 10. Directors, Executive Officers and Corporate Governance
Certain information required by this Item 10 is incorporated by reference from our Proxy Statement related to the 2012 Annual Meeting of Stockholders under the sections “OTHER INFORMATION YOU NEED TO MAKE AN INFORMED DECISION — Directors, Executive Officers and Significant Employees” and “Section 16(a) Beneficial Ownership Reporting Compliance,” and “CORPORATE GOVERNANCE — Code of Ethics,” and “Nominating and Corporate Governance Committee, Selection of Director Nominees,” and “Audit Committee.”
The board of directors has adopted a Code of Conduct and Code of Ethics that applies to all directors, officers and employees of the Company. A copy of this document is available on our website at www.zixcorp.com under “Corporate Governance.” Any waiver or amendment of the code of ethics with respect to our chief executive officer and senior financial officers will be publicly disclosed as required by applicable law and regulation, including by posting the waiver on our website.
Item 11. Executive Compensation
The information required by this Item 11, including certain information pertaining to Company securities authorized for issuance under equity compensation plans, is incorporated by reference from our Proxy Statement related to the 2012 Annual Meeting of Stockholders under the section “COMPENSATION OF DIRECTORS AND EXECUTIVE OFFICERS.”
Item 12. Security Ownership of Certain Beneficial Owners and Management and Related Stockholder Matters
The information required by this Item 12 is incorporated by reference from our Proxy Statement related to the 2012 Annual Meeting of Stockholders under the section “SECURITY OWNERSHIP OF CERTAIN BENEFICIAL OWNERS AND MANAGEMENT” and “COMPENSATION OF DIRECTORS AND EXECUTIVE OFFICERS — Equity Compensation Plan Information.”
Item 13. Certain Relationships and Related Transactions, and Director Independence
The information required by this Item 13 is incorporated by reference from our Proxy Statement related to the 2012 Annual Meeting of Stockholders under the section “COMPENSATION OF DIRECTORS AND EXECUTIVE OFFICERS — Certain Relationships and Related Transactions” and “CORPORATE GOVERNANCE — Corporate Governance Requirements and Board Member Independence.”
Item 14. Principal Accountant Fees and Services
The information required by this Item 14 is incorporated by reference from our Proxy Statement related to the 2012 Annual Meeting of Stockholders under the section “INDEPENDENT REGISTERED PUBLIC ACCOUNTANTS.”
Item 15. Exhibits and Financial Statement Schedules
(a)(1) Financial Statements
See Index to Consolidated Financial Statements on page F-1 hereof.
(a)(2) Financial Statement Schedules
All schedules for which provision is made in the applicable accounting regulations of the SEC have been omitted because of the absence of the conditions under which they are required or because the information required is included in the consolidated financial statements or notes thereto.
32
Table of Contents
(a)(3) Exhibits
| Exhibit Number |
Description | |||
| 3.1 | — | Restated Articles of Incorporation of Zix Corporation, as filed with the Texas Secretary of State on November 10, 2005. Filed as Exhibit 3.1 to Zix Corporation’s Annual Report on Form 10-K for the year ended December 31, 2005, and incorporated herein by reference. | ||
| 3.2 | — | Amended and Restated Bylaws of Zix Corporation, dated September 13, 2011. Filed as Exhibit 3.1 to Zix Corporation’s Current Report on Form 8-K, dated September 19, 2011, and incorporated herein by reference. | ||
| 10.1† | — | 1992 Stock Option Plan of Zix Corporation (Amended and Restated as of August 2000). Filed as Exhibit 10.2 to Zix Corporation’s Annual Report on Form 10-K for the year ended December 31, 2003, and incorporated herein by reference. | ||
| 10.2† | — | 1995 Long-Term Incentive Plan of Zix Corporation (Amended and Restated as of September 20, 2000). Filed as Exhibit 10.3 to Zix Corporation’s Quarterly Report on Form 10-Q for the quarterly period ended September 30, 2000, and incorporated herein by reference. | ||
| 10.3† | — | Zix Corporation 1999 Directors’ Stock Option Plan (Amended and Restated as of August 1, 2002). Filed as Exhibit 10.1 to Zix Corporation’s Quarterly Report on Form 10-Q for the quarterly period ended June 30, 2002, and incorporated herein by reference. | ||
| 10.4† | — | Zix Corporation 2001 Employee Stock Option Plan (Amended and Restated as of June 7, 2007). Filed as Exhibit 10.6 to Zix Corporation’s Report on Form 8-K, filed June 12, 2007, and incorporated herein by reference. | ||
| 10.5† | — | Zix Corporation’s 2001 Stock Option Plan (Amended and Restated as of June 7, 2007). Filed as Exhibit 10.5 to Zix Corporation’s Report on Form 8-K, filed June 12, 2007, and incorporated herein by reference. | ||
| 10.6† | — | Zix Corporation’s 2003 New Employee Stock Option Plan (Amended and Restated as of June 7, 2007). Filed as Exhibit 10.4 to Zix Corporation’s Report on Form 8-K, filed June 12, 2007, and incorporated herein by reference. | ||
| 10.7† | — | Zix Corporation 2004 Stock Option Plan (Amended and Restated as of June 7, 2007). Filed as Exhibit 10.3 to Zix Corporation’s Report on Form 8-K, filed June 12, 2007, and incorporated herein by reference. | ||
| 10.8† | — | Zix Corporation 2004 Stock Option Plan (Amended and Restated as of May 25, 2005). Filed as Exhibit 10.1 to Zix Corporation’s Registration Statement on Form S-8 (Registration No. 333-126576), dated July 13, 2005, and incorporated herein by reference. | ||
| 10.9† | — | Zix Corporation 2004 Directors’ Stock Option Plan, dated May 6, 2004. Filed as Exhibit 10.2 to Zix Corporation’s Quarterly Report on Form 10-Q for the quarterly period ended March 31, 2004, and incorporated herein by reference. | ||
| 10.10† | — | Zix Corporation 2006 Directors’ Stock Option Plan (Amended and Restated as of June 7, 2007) Filed as Exhibit 10.1 to Zix Corporation’s Current Report on Form 8-K, filed June 12, 2007, and incorporated herein by reference. | ||
| 10.11† | — | Form of Stock Option Agreement (with no “change in control” provision) for Zix Corporation Stock Option Plans. Filed as Exhibit 10.2 to Zix Corporation’s Registration Statement on Form S-8 (Registration No. 333-126576), dated July 13, 2005, and incorporated herein by reference. | ||
| 10.12† | — | Form of Stock Option Agreement (with “change in control” provision) for Zix Corporation Stock Option Plans. Filed as Exhibit 10.3 to Zix Corporation’s Registration Statement on Form S-8 (Registration No. 333-126576), dated July 13, 2005, and incorporated herein by reference. | ||
| 10.13† | — | Form of Stock Option Agreement (with “acceleration event” provision) for Zix Corporation Stock Option Plans and applicable to option agreements held by the Company’s chief executive officer and direct reports. Filed as Exhibit 10.17 to Zix Corporation’s Annual Report on Form 10-K for the year ended December 31, 2007, and incorporated herein by reference. | ||
| 10.14 | — | Zix Corporation 401(k) Retirement Plan. Filed as Exhibit 10.10 to Zix Corporation’s Annual Report on Form 10-K for the year ended December 31, 2003, and incorporated herein by reference. | ||
33
Table of Contents
| Exhibit Number |
Description | |||
| 10.15 | — | Adoption Agreement relating to Zix Corporation 401(k) Retirement Plan. Filed as Exhibit 10.11 to Zix Corporation’s Annual Report on Form 10-K for the year ended December 31, 2003, and incorporated herein by reference. | ||
| 10.16† | — | Form of Zix Corporation Outside Director Stock Option Agreement. Filed as Exhibit 10.3 to Zix Corporation’s Quarterly Report on Form 10-Q for the quarterly period ended June 30, 2004, and incorporated herein by reference. | ||
| 10.17† | — | Amended and Restated Severance Agreement, entered into as of December 18, 2008, between Zix Corporation and Richard D. Spurr (amended for I.R.C. 409A compliance purposes). Filed as Exhibit 10.27 to Zix Corporation’s Annual Report on Form 10-K for the year ended December 31, 2008, and incorporated herein by reference. | ||
| 10.18† | — | Amended and Restated Severance Agreement, entered into as of December 30, 2008, between Zix Corporation and David J. Robertson (amended for I.R.C. 409A compliance purposes). Filed as Exhibit 10.30 to Zix Corporation’s Annual Report on Form 10-K for the year ended December 31, 2008, and incorporated herein by reference. | ||
| 10.19 | — | Lease Agreement, dated December 29, 2003, between Zix Corporation and 7-Eleven, Inc. (excluding exhibits) (relating to Zix Corporation’s Dallas, Texas facilities). Filed as Exhibit 10.24 to Zix Corporation’s Annual Report on Form 10-K for the year ended December 31, 2003, and incorporated herein by reference. | ||
| 10.20 | — | Letter of Agreement dated September 12, 2006 between MITEM Corporation and Zix Corporation. Filed as Exhibit 10.2 to Zix Corporation’s Quarterly Report on Form 10-Q for the period ended September 30, 2006, and incorporated herein by reference. | ||
| 10.21† | — | Separation Pay Agreement, entered into as of February 8, 2010, between Zix Corporation and James F. Brashear. Filed as Exhibit 10.40 to Zix Corporation’s Annual Report on Form 10-K for the year ended December 31, 2009, and incorporated herein by reference. | ||
| 10.22† | — | Form of Zix Corporation Outside Director Stock Option Agreement. Filed as Exhibit 10.1 to Zix Corporation’s Quarterly Report on Form 10-Q for the period ended June 30, 2010, and incorporated herein by reference. | ||
| 10.23† | — | Form of Zix Corporation Employee Stock Option Agreement. Filed as Exhibit 10.2 to Zix Corporation’s Quarterly Report on Form 10-Q for the period ended June 30, 2010, and incorporated herein by reference. | ||
| 10.24† | — | Form of Director Indemnification Agreement. Filed as Exhibit 10.1 to Zix Corporation’s Current Report on Form 8-K dated December 20, 2010, and incorporated herein by reference. | ||
| 10.25† | — | Form of Executive Termination Benefits Agreement. Filed as Exhibit 10.1 to Zix Corporation’s Quarterly Report on Form 10-Q for the period ended June 30, 2011, and incorporated herein by reference. | ||
| 10.26† | — | Description of Zix Corporation 2011 Variable Compensation Plan. Filed as Exhibit 10.2 to Zix Corporation’s Quarterly Report on Form 10-Q for the period ended June 30, 2011, and incorporated herein by reference. | ||
| 10.27 | — | Lease, dated April 9, 2009, between ZixCorp Canada, Inc. and Zix Corporation and Elk Property Management Limited (relating to Zix Corporation’s Ottawa, Canada offices). Filed as Exhibit 10.1 to Zix Corporation’s Quarterly Report on Form 10-Q for the quarterly period ended March 31, 2009, and incorporated herein by reference. | ||
| 21.1 | — | Subsidiaries of Zix Corporation. Filed as Exhibit 21.1 to Zix Corporation’s Annual Report on Form 10-K dated December 31, 2009, and incorporated herein by reference. | ||
| 23.1* | — | Consent of Independent Registered Public Accounting Firm (Whitley Penn LLP). | ||
| 31.1* | — | Certification of Richard D. Spurr, President and Chief Executive Officer of the Company, pursuant to Section 302 of the Sarbanes-Oxley Act of 2002. | ||
| 31.2* | — | Certification of Michael W. English, Chief Financial Officer (Principal Financial Officer and Principal Accounting Officer) of the Company, pursuant to Section 302 of the Sarbanes-Oxley Act of 2002. | ||
34
Table of Contents
| Exhibit Number |
Description | |||
| 32.1** | — | Certification of Richard D. Spurr and Michael W. English, pursuant to 18 U.S.C. Section 1350, as adopted, pursuant to Section 906 of the Sarbanes-Oxley Act of 2002. | ||
| 99.1 | — | Order and Final Judgment, United States District Court, Cause No. 3-04-CV-1931-K, Northern District of Texas, Dallas Division (dated June 16, 2008). Filed as Exhibit 99.1 to the Zix Corporation Current Report on Form 8-K, filed June 17, 2008, and incorporated herein by reference. | ||
| 101.1*** | — | 101. INS (XBRL Instance Document)
101. SCH (XBRL Taxonomy Extension Schema Document)
101. CAL (XBRL Calculation Linkbase Document)
101. LAB (XBRL Taxonomy Label Linkbase Document)
101. DEF (XBRL Taxonomy Linkbase Document)
101. PRE (XBRL Taxonomy Presentation Linkbase Document) | ||
| * | Filed herewith. |
| ** | Furnished herewith. |
| *** | In accordance with Rule 406T of Regulation S-T, the XBRL related information shall not be deemed to be “filed” for purposes of Section 18 of the Exchange Act, or otherwise subject to the liability of that section, and shall not be part of any registration statement or other document filed under the Securities Act or the Exchange Act, except as shall be expressly set forth by specific reference in such filing. |
| † | Management contract or compensatory plan or arrangement. |
35
Table of Contents
SIGNATURES
Pursuant to the requirements of Section 13 or 15(d) of the Securities Exchange Act of 1934, the Registrant has duly caused this report to be signed on its behalf by the undersigned, thereunto duly authorized, in the city of Dallas, state of Texas, on March 9, 2012.
| ZIX CORPORATION | ||
| By: | /s/ MICHAEL W. ENGLISH | |
| Michael W. English | ||
| Chief Financial Officer (Principal Financial Officer and Principal Accounting Officer) | ||
Pursuant to the requirements of the Securities Exchange Act of 1934, this report has been signed below by the following persons on behalf of the Registrant and in the capacities indicated on March 9, 2012.
| Signature |
Title | |
| /s/ RICHARD D. SPURR |
Chairman, Chief Executive Officer, President and Director | |
| (Richard D. Spurr) | (Principal Executive Officer) | |
| /s/ MICHAEL W. ENGLISH |
Chief Financial Officer | |
| (Michael W. English) | (Principal Financial Officer and Principal Accounting Officer) | |
| /s/ ROBERT C. HAUSMANN |
Director | |
| (Robert C. Hausmann) | ||
| /s/ JAMES S. MARSTON |
Director | |
| (James S. Marston) | ||
| /s/ MARIBESS L. MILLER |
Director | |
| (Maribess L. Miller) | ||
| /s/ ANTONIO R. SANCHEZ III |
Director | |
| (Antonio R. Sanchez III) | ||
| /s/ TAHER ELGAMAL |
Director | |
| (Taher Elgamal) | ||
36
Table of Contents
INDEX TO CONSOLIDATED FINANCIAL STATEMENTS
Table of Contents
REPORT OF INDEPENDENT REGISTERED PUBLIC ACCOUNTING FIRM
To the Board of Directors and Stockholders
Zix Corporation
We have audited the accompanying consolidated balance sheets of Zix Corporation and subsidiaries (the “Company”), as of December 31, 2011 and 2010, and the related consolidated statements of operations, changes in stockholders’ equity (deficit), and cash flows for each of the three years in the period ended December 31, 2011. The Company’s management is responsible for these financial statements. Our responsibility is to express an opinion on these financial statements based on our audits.
We conducted our audits in accordance with the standards of the Public Company Accounting Oversight Board (United States). Those standards require that we plan and perform the audit to obtain reasonable assurance about whether the financial statements are free of material misstatement. Our audits of the financial statements included examining, on a test basis, evidence supporting the amounts and disclosures in the financial statements, assessing the accounting principles used and significant estimates made by management, and evaluating the overall financial statement presentation. We believe that our audits provide a reasonable basis for our opinion.
In our opinion, the consolidated financial statements referred to above present fairly, in all material respects, the financial position of the Company, as of December 31, 2011 and 2010, and the results of their operations and their cash flows for each of the three years in the period ended December 31, 2011, in conformity with accounting principles generally accepted in the United States of America.
We also have audited, in accordance with the standards of the Public Company Accounting Oversight Board (United States), the Company’s internal control over financial reporting as of December 31, 2011, based on criteria established in Internal Control—Integrated Framework issued by the Committee of Sponsoring Organizations of the Treadway Commission, and our report dated March 9, 2012 expressed an unqualified opinion.
/s/ WHITLEY PENN LLP
Dallas, Texas
March 9, 2012
F-2
Table of Contents
ZIX CORPORATION
| December 31, | ||||||||
| 2011 | 2010 | |||||||
| ASSETS | ||||||||
| Current assets: |
||||||||
| Cash and cash equivalents |
$ | 20,680,000 | $ | 24,619,000 | ||||
| Receivables, net |
704,000 | 1,344,000 | ||||||
| Prepaid and other current assets |
1,422,000 | 1,115,000 | ||||||
| Deferred tax assets |
1,551,000 | 1,056,000 | ||||||
|
|
|
|
|
|||||
| Total current assets |
24,357,000 | 28,134,000 | ||||||
| Property and equipment, net |
2,228,000 | 2,209,000 | ||||||
| Goodwill |
2,161,000 | 2,161,000 | ||||||
| Deferred tax assets |
48,806,000 | 34,304,000 | ||||||
| Other assets |
— | 44,000 | ||||||
|
|
|
|
|
|||||
| Total assets |
$ | 77,552,000 | $ | 66,852,000 | ||||
|
|
|
|
|
|||||
| LIABILITIES AND STOCKHOLDERS’ EQUITY | ||||||||
| Current liabilities: |
||||||||
| Accounts payable |
$ | 396,000 | $ | 562,000 | ||||
| Accrued expenses |
1,896,000 | 2,282,000 | ||||||
| Deferred revenue |
16,568,000 | 15,331,000 | ||||||
| License subscription note payable |
— | 137,000 | ||||||
|
|
|
|
|
|||||
| Total current liabilities |
18,860,000 | 18,312,000 | ||||||
| Long-term liabilities: |
||||||||
| Deferred revenue |
795,000 | 1,439,000 | ||||||
| License subscription note payable |
— | 49,000 | ||||||
| Deferred rent |
140,000 | 165,000 | ||||||
|
|
|
|
|
|||||
| Total long-term liabilities |
935,000 | 1,653,000 | ||||||
|
|
|
|
|
|||||
| Total liabilities |
19,795,000 | 19,965,000 | ||||||
|
|
|
|
|
|||||
| Commitments and contingencies (Note 17) |
||||||||
| Stockholders’ equity: |
||||||||
| Preferred stock, $1 par value, 10,000,000 shares authorized; none issued and outstanding |
— | — | ||||||
| Common stock, $0.01 par value, 175,000,000 shares authorized; 72,639,465 issued and 63,819,531 outstanding in 2011 and 69,505,919 issued and 67,178,738 outstanding in 2010 |
726,000 | 695,000 | ||||||
| Additional paid-in capital |
354,265,000 | 344,981,000 | ||||||
| Treasury stock, at cost; 8,819,934 common shares in 2011 and 2,327,181 common shares in 2010 |
(32,506,000 | ) | (11,507,000 | ) | ||||
| Accumulated deficit |
(264,728,000 | ) | (287,282,000 | ) | ||||
|
|
|
|
|
|||||
| Total stockholders’ equity |
57,757,000 | 46,887,000 | ||||||
|
|
|
|
|
|||||
| Total liabilities and stockholders’ equity |
$ | 77,552,000 | $ | 66,852,000 | ||||
|
|
|
|
|
|||||
See notes to consolidated financial statements.
F-3
Table of Contents
ZIX CORPORATION
CONSOLIDATED STATEMENTS OF OPERATIONS
| Year Ended December 31, | ||||||||||||
| 2011 | 2010 | 2009 | ||||||||||
| Revenues |
$ | 38,145,000 | $ | 33,066,000 | $ | 26,407,000 | ||||||
| Cost of revenues |
7,211,000 | 6,468,000 | 4,576,000 | |||||||||
|
|
|
|
|
|
|
|||||||
| Gross margin |
30,934,000 | 26,598,000 | 21,831,000 | |||||||||
| Research and development expenses |
5,229,000 | 5,089,000 | 3,619,000 | |||||||||
| Selling, general and administrative expenses |
15,128,000 | 16,363,000 | 15,927,000 | |||||||||
|
|
|
|
|
|
|
|||||||
| Operating income |
10,577,000 | 5,146,000 | 2,285,000 | |||||||||
| Other income (expense): |
||||||||||||
| Investment and other income |
95,000 | 96,000 | 214,000 | |||||||||
| Interest expense |
(7,000 | ) | (22,000 | ) | (21,000 | ) | ||||||
|
|
|
|
|
|
|
|||||||
| Total other income |
88,000 | 74,000 | 193,000 | |||||||||
|
|
|
|
|
|
|
|||||||
| Income from continuing operations before income taxes |
10,665,000 | 5,220,000 | 2,478,000 | |||||||||
| Income tax benefit (expense) |
11,889,000 | 35,500,000 | (67,000 | ) | ||||||||
|
|
|
|
|
|
|
|||||||
| Income from continuing operations |
$ | 22,554,000 | $ | 40,720,000 | $ | 2,411,000 | ||||||
|
|
|
|
|
|
|
|||||||
| Income (loss) from discontinued operations before income taxes |
— | 762,000 | (6,846,000 | ) | ||||||||
| Income tax expense |
— | (269,000 | ) | — | ||||||||
|
|
|
|
|
|
|
|||||||
| Income (loss) from discontinued operations |
$ | — | $ | 493,000 | $ | (6,846,000 | ) | |||||
|
|
|
|
|
|
|
|||||||
| Net income (loss) |
$ | 22,554,000 | $ | 41,213,000 | $ | (4,435,000 | ) | |||||
|
|
|
|
|
|
|
|||||||
| Basic income (loss) per common share: |
||||||||||||
| Income from continuing operations |
$ | 0.34 | $ | 0.63 | $ | 0.04 | ||||||
|
|
|
|
|
|
|
|||||||
| Income (loss) from discontinued operations |
$ | — | $ | 0.01 | $ | (0.11 | ) | |||||
|
|
|
|
|
|
|
|||||||
| Net income (loss) |
$ | 0.34 | $ | 0.64 | $ | (0.07 | ) | |||||
|
|
|
|
|
|
|
|||||||
| Diluted income (loss) per common share: |
||||||||||||
| Income from continuing operations |
$ | 0.34 | $ | 0.61 | $ | 0.04 | ||||||
|
|
|
|
|
|
|
|||||||
| Income (loss) from discontinued operations |
$ | — | $ | 0.01 | $ | (0.11 | ) | |||||
|
|
|
|
|
|
|
|||||||
| Net income (loss) |
$ | 0.34 | $ | 0.62 | $ | (0.07 | ) | |||||
|
|
|
|
|
|
|
|||||||
| Weighted average shares outstanding |
||||||||||||
| Basic common shares outstanding |
65,439,078 | 64,401,384 | 63,422,088 | |||||||||
|
|
|
|
|
|
|
|||||||
| Diluted common shares outstanding |
67,261,514 | 66,741,681 | 64,050,751 | |||||||||
|
|
|
|
|
|
|
|||||||
See notes to consolidated financial statements.
F-4
Table of Contents
ZIX CORPORATION
CONSOLIDATED STATEMENTS OF STOCKHOLDERS’ EQUITY (DEFICIT)
| Stockholders’ Equity (Deficit) | ||||||||||||||||||||||||
| Common Stock | Additional Paid-In |
Treasury | Accumulated | Total Stockholders’ |
||||||||||||||||||||
| Shares | Amount | Capital | Stock | Deficit | Equity (Deficit) | |||||||||||||||||||
| Balance, December 31, 2008 |
65,646,663 | $ | 656,000 | $ | 333,608,000 | $ | (11,507,000 | ) | $ | (324,060,000 | ) | $ | (1,303,000 | ) | ||||||||||
| Issuance of common stock upon exercise of stock options |
11,743 | 1,000 | 18,000 | — | — | 19,000 | ||||||||||||||||||
| Issuance of common stock upon exercise of warrants |
395,366 | 4,000 | 632,000 | — | — | 636,000 | ||||||||||||||||||
| Employee stock-based compensation costs |
— | — | 3,063,000 | — | — | 3,063,000 | ||||||||||||||||||
| Non-employee stock-based compensation |
— | — | 31,000 | — | — | 31,000 | ||||||||||||||||||
| Net loss |
— | — | — | — | (4,435,000 | ) | (4,435,000 | ) | ||||||||||||||||
|
|
|
|
|
|
|
|
|
|
|
|
|
|||||||||||||
| Balance, December 31, 2009 |
66,053,772 | 661,000 | 337,352,000 | (11,507,000 | ) | (328,495,000 | ) | (1,989,000 | ) | |||||||||||||||
| Issuance of common stock upon exercise of stock options |
1,537,147 | 15,000 | 2,771,000 | — | — | 2,786,000 | ||||||||||||||||||
| Issuance of common stock upon exercise of warrants |
1,915,000 | 19,000 | 2,930,000 | — | — | 2,949,000 | ||||||||||||||||||
| Employee stock-based compensation costs |
— | — | 1,886,000 | — | — | 1,886,000 | ||||||||||||||||||
| Non-employee stock-based compensation |
— | — | 42,000 | — | — | 42,000 | ||||||||||||||||||
| Net income |
— | — | — | — | 41,213,000 | 41,213,000 | ||||||||||||||||||
|
|
|
|
|
|
|
|
|
|
|
|
|
|||||||||||||
| Balance, December 31, 2010 |
69,505,919 | 695,000 | 344,981,000 | (11,507,000 | ) | (287,282,000 | ) | 46,887,000 | ||||||||||||||||
| Issuance of common stock upon exercise of stock options |
725,936 | 7,000 | 1,784,000 | — | — | 1,791,000 | ||||||||||||||||||
| Issuance of common stock upon exercise of warrants |
2,407,610 | 24,000 | 3,683,000 | — | — | 3,707,000 | ||||||||||||||||||
| Employee stock-based compensation costs |
— | — | 569,000 | — | — | 569,000 | ||||||||||||||||||
| Non-employee stock-based compensation |
— | — | 48,000 | — | — | 48,000 | ||||||||||||||||||
| Stock option exercise excess tax benefit |
— | — | 3,200,000 | — | — | 3,200,000 | ||||||||||||||||||
| Treasury repurchase program |
— | — | — | (20,999,000 | ) | — | (20,999,000 | ) | ||||||||||||||||
| Net income |
— | — | — | — | 22,554,000 | 22,554,000 | ||||||||||||||||||
|
|
|
|
|
|
|
|
|
|
|
|
|
|||||||||||||
| Balance, December 31, 2011 |
72,639,465 | $ | 726,000 | $ | 354,265,000 | $ | (32,506,000 | ) | $ | (264,728,000 | ) | $ | 57,757,000 | |||||||||||
|
|
|
|
|
|
|
|
|
|
|
|
|
|||||||||||||
See notes to consolidated financial statements.
F-5
Table of Contents
ZIX CORPORATION
CONSOLIDATED STATEMENTS OF CASH FLOWS
| Year Ended December 31, | ||||||||||||
| 2011 | 2010 | 2009 | ||||||||||
| Operating activities: |
||||||||||||
| Net income (loss) |
$ | 22,554,000 | $ | 41,213,000 | $ | (4,435,000 | ) | |||||
| Non-cash items in net income (loss): |
||||||||||||
| Depreciation and amortization |
1,373,000 | 1,402,000 | 1,328,000 | |||||||||
| Employee stock-based compensation expense |
569,000 | 1,886,000 | 3,063,000 | |||||||||
| Non-employee stock-based compensation |
48,000 | 42,000 | 31,000 | |||||||||
| Changes in deferred taxes |
(11,796,000 | ) | (35,290,000 | ) | 4,000 | |||||||
| Changes in operating assets and liabilities: |
||||||||||||
| Receivables |
640,000 | (584,000 | ) | (284,000 | ) | |||||||
| Prepaid and other assets |
(264,000 | ) | 150,000 | 220,000 | ||||||||
| Accounts payable |
(87,000 | ) | (190,000 | ) | 168,000 | |||||||
| Deferred revenue |
593,000 | (529,000 | ) | (145,000 | ) | |||||||
| Accrued and other liabilities |
(411,000 | ) | (910,000 | ) | 653,000 | |||||||
|
|
|
|
|
|
|
|||||||
| Net cash provided by operating activities |
13,219,000 | 7,190,000 | 603,000 | |||||||||
| Investing activities: |
||||||||||||
| Purchases of property and equipment |
(1,471,000 | ) | (1,492,000 | ) | (1,141,000 | ) | ||||||
| Sales (purchases) of marketable securities |
— | 25,000 | (25,000 | ) | ||||||||
| Restricted cash investments, net |
— | — | 28,000 | |||||||||
|
|
|
|
|
|
|
|||||||
| Net cash used in investing activities |
(1,471,000 | ) | (1,467,000 | ) | (1,138,000 | ) | ||||||
| Financing activities: |
||||||||||||
| Proceeds from exercise of stock options |
1,791,000 | 2,786,000 | 19,000 | |||||||||
| Proceeds from exercise of warrants |
3,707,000 | 2,949,000 | 636,000 | |||||||||
| Payment of license subscription note payable |
(186,000 | ) | (126,000 | ) | (78,000 | ) | ||||||
| Treasury stock |
(20,999,000 | ) | — | — | ||||||||
|
|
|
|
|
|
|
|||||||
| Net cash provided by (used in) financing activities |
(15,687,000 | ) | 5,609,000 | 577,000 | ||||||||
|
|
|
|
|
|
|
|||||||
| Increase (decrease) in cash and cash equivalents |
(3,939,000 | ) | 11,332,000 | 42,000 | ||||||||
| Cash and cash equivalents, beginning of year |
24,619,000 | 13,287,000 | 13,245,000 | |||||||||
|
|
|
|
|
|
|
|||||||
| Cash and cash equivalents, end of year |
$ | 20,680,000 | $ | 24,619,000 | $ | 13,287,000 | ||||||
|
|
|
|
|
|
|
|||||||
See notes to consolidated financial statements.
F-6
Table of Contents
ZIX CORPORATION
NOTES TO CONSOLIDATED FINANCIAL STATEMENTS
1. Company Overview
Zix Corporation (“ZixCorp,” the “Company,” “we,” “our,” “us”) provides email encryption solutions in a SaaS model. These solutions connect, protect and deliver information in a secure manner, enabling secure email exchange in the healthcare, finance, insurance and government sectors.
In 2009 we announced the planned exit of our e-Prescribing business to be completed by December 31, 2010. The wind down of this business was completed on schedule and the Company successfully exited this business on December 31, 2010. The e-Prescribing business has been reclassified as a discontinued operation on a retrospective basis in the Company’s Statements of Operations included in this Form 10-K. There were no significant assets or liabilities related to the discontinued operations at December 31, 2011 or 2010.
2. Summary of Significant Accounting Policies
Basis of Presentation — The accompanying consolidated financial statements include the accounts of all our wholly-owned subsidiaries and are prepared in accordance with accounting principles generally accepted in the United States of America. All inter-company accounts and transactions have been eliminated in consolidation.
Use of Estimates — The preparation of consolidated financial statements in conformity with accounting principles generally accepted in the United States of America requires management to make estimates and assumptions that affect the reported amount of assets and liabilities and disclosure of contingent assets and liabilities at the date of the consolidated financial statements and the reported amounts of revenue and expenses during the reported period. Our significant estimates include primarily those required in the valuation or impairment analysis of goodwill and property and equipment, revenue recognition, allowances for doubtful accounts, stock-based compensation, litigation accruals, valuation allowances for deferred tax assets and tax accruals. Although we believe that adequate accruals have been made for unsettled issues, additional gains or losses could occur in future years from resolutions of outstanding matters. Actual results could differ materially from original estimates.
Cash Equivalents — Cash investments with maturities of three months or less when purchased are considered cash equivalents.
Fair Value of Financial Instruments —The Company does not measure the fair value of any financial instrument other than cash equivalents, options and warrants. The carrying values of other financial instruments (receivables and accounts payable) are not recorded at fair value but approximate fair values primarily due to their short-term nature. The carrying values of other current assets and accrued expenses are also not recorded at fair value, but approximate fair values primarily due to their short-term nature.
Valuation of Property and Equipment — The accounting policies and estimates relating to property and equipment are considered significant because of the potential impact that impairment, obsolescence, or change in an asset’s useful life could have on the Company’s operating results.
We record an impairment charge on the assets to be held and used when we determine based upon certain triggering events that the carrying value of property and equipment may not be recoverable based on expected undiscounted cash flows attributable to such assets. The amount of a potential impairment is determined by comparing the carrying amount of the asset to either the value determined from a projected discounted cash flow method, using a discount rate that is considered to be commensurate with the risk inherent in the Company’s current business model or the estimated fair market value. Assumptions are made with respect to future net cash flows expected to be generated by the related asset. An impairment charge would be recorded for an amount by which the carrying value of the asset exceeded the discounted projected net cash flows or estimated fair market value. Also, even where a current impairment charge is not necessary, the remaining useful lives are evaluated. No impairment was recorded for any of the periods presented.
F-7
Table of Contents
Property and equipment are recorded at cost and depreciated or amortized using the straight-line method over their estimated useful lives as follows: computer and office equipment and software — three years; leasehold improvements — the shorter of five years or the lease term; and furniture and fixtures — five years.
Goodwill — We account for the valuation of goodwill and other intangible assets after classifying intangible assets into three categories: (1) intangible assets with finite lives subject to amortization; (2) intangible assets with indefinite lives not subject to amortization; and (3) goodwill. For intangible assets with finite lives, tests for impairment must be performed if conditions exist that indicate the carrying value may not be recoverable. For intangible assets with indefinite lives and goodwill, tests for impairment must be performed at least annually or more frequently if events or circumstances indicate that assets might be impaired.
Goodwill was $2,161,000, or 3% of total assets for the years ended December 31, 2011 and 2010.
Our goodwill is not being amortized, but we do evaluate the goodwill for impairment annually in the fourth quarter, or when there is reason to believe that the value has been diminished or impaired. Evaluations for possible impairment are based upon a comparison of the estimated fair value of the reporting unit to which the goodwill has been assigned to, versus the sum of the carrying value of the assets and liabilities of that unit including the assigned goodwill value. The fair values used in this evaluation are estimated based on the Company’s market capitalization, which is based on the outstanding stock and market price of the stock. Impairment is deemed to exist if the net book value of the unit exceeds its estimated fair value. No impairment was recorded for any of the periods presented.
Deferred Tax Assets — Deferred tax assets are recognized if it is “more likely than not” that the benefit of the deferred tax asset will be realized on future federal income tax returns. At December 31, 2011, we provided a valuation allowance against a significant portion, $57,384,000, of our accumulated U.S. deferred tax assets, reflecting our historical losses and the uncertainty of future taxable income sufficient to utilize net operating loss carryforwards prior to their expiration. Our total deferred tax asset not subject to a valuation allowance is valued at $50,357,000, and consists of $41,069,000 for federal net operating loss carryforwards, $6,079,000 relating to temporary timing differences between GAAP and tax-related expense, $2,341,000 relating to U.S. state income tax credits, $859,000 related to Alternative Minimum Tax credits and $9,000 for a Canadian deferred tax asset relating to temporary timing differences between GAAP and tax-related expense. If U.S. taxable income increases from its current level in a future period or if the facts and circumstances on which our estimates and assumptions are based were to change, thereby impacting the likelihood of realizing the deferred tax assets, judgment would have to be applied in determining the amount of valuation allowance no longer required. Reversal of all or a part of this valuation allowance could have a significant positive impact on operating results in the period that it becomes more likely than not that certain of the Company’s deferred tax assets will be realized. Alternatively, should our future income decrease from current levels, a resulting increase to all or a part of this valuation allowance could also have a significant negative impact on our operating results.
Leases — A leased asset whose lease terms meet the criteria for capitalization is recorded as an asset and depreciated. If a lease does not meet the criteria for capitalization, it is classified as an operating lease and payments are recorded as rent expense. For 2011 and 2010 we had no leases that qualified as capital leases. Lease renewal options which we are “reasonably assured” of using and the related payments are taken into account when initially classifying and recording the lease as a capital lease obligation or as straight-line rent if an operating lease. We have no renewal options which are “reasonably assured” of exercising as of December 31, 2011. Funds provided by the lessor for leasehold improvements are recorded as a deferred lease incentive and amortized as a reduction of rent expense over the lease term.
Revenue Recognition — We develop, market, and support applications that connect, protect and deliver information in a secure manner. Our services can be placed into several key revenue categories where each category has similar revenue recognition traits: Email Encryption subscription-based services, various transaction fees and related professional services. The majority of the revenues generated are through a combination of direct sales and a network of resellers and other distribution partners.
F-8
Table of Contents
Under all product categories and distribution models, we recognize revenue after all of the following occur:
| • | persuasive evidence of an arrangement exists, |
| • | delivery has occurred or services have been rendered, |
| • | the price is fixed and determinable, and |
| • | collectability is reasonably assured. |
When we are engaged in a complex product deployment, customer acceptance may have to occur before the transaction is considered complete. In this situation, no revenue is recognized until the customer accepts the product. Discounts provided to customers are recorded as reductions in revenue.
Our email encryption service is a subscription service. Providing this service includes delivering subscribed-for software and providing secure electronic communications and customer support throughout the subscription period. Our email subscribers generally execute multiple-year contracts that are irrevocable and non-refundable in nature and require annual, up-front payments. Subscription fees received from customers are initially recorded as deferred revenue and then recognized as revenue ratably over the subscription period. We do not offer stand alone services. Further, our services primarily include manufacturer provided warranty provisions. We recorded no warranty expense in any of the presented periods.
The discontinued e-Prescribing service was also a subscription service. Some of these services incorporated transaction fees per event occurrence or when predetermined usage levels had been reached. These transaction fees were recognized as revenue when the transaction occurred or when a predetermined usage level had been achieved, and when the amounts were fixed and determinable.
Software Development Costs — Costs incurred in the development and testing of software used in the Company’s Email Encryption Services related to research, project planning, training, maintenance and general and administrative activities, and overhead costs are expensed as incurred. The costs of relatively minor upgrades and enhancements to the software are also expensed as incurred.
Costs for the development of new software solutions and substantial enhancements to existing software solutions are expensed as incurred until technological feasibility has been established, at which time any additional costs would be capitalized. No research and development costs have been capitalized because we believe that technological feasibility is established concurrent with general release to customers.
Advertising Expense — Advertising costs are expensed as incurred. Our continuing operations include advertising expense of $544,000, $361,000, and $278,000 in 2011, 2010, and 2009, respectively.
Stock-Based Compensation — We currently use the straight-line amortization method for recognizing stock option compensation costs. The measurement and recognition of compensation expense for all share-based payment awards made to our employees, directors or outside service providers are based on the estimated fair value of the awards on the grant dates. The grant date fair value is estimated using either an option-pricing model which is consistent with the terms of the award or a market observed price, if such a price exists. Such cost is recognized over the period during which an employee, director or outside service provider is required to provide service in exchange for the award, i.e., “the requisite service period” (which is usually the vesting period). We also estimate the number of instruments that will ultimately be earned, rather than accounting for forfeitures as they occur.
Earnings Per Share (“EPS”) — Basic EPS is based on the weighted average number of common shares outstanding during each period. Diluted EPS adjusts Basic EPS for the effects of dilutive common stock equivalents outstanding during each period using the treasury stock method.
New Accounting Standards
Testing for Goodwill Impairment
In September 2011, the Financial Accounting Standards Board (“FASB”) amended guidance on testing goodwill for impairment. Under the new guidance, entities testing goodwill for impairment have the option of performing a qualitative assessment before calculating the fair value of a reporting unit in step 1 of the goodwill impairment test. If entities determine, on the basis of qualitative factors, that the fair value of a reporting unit is more likely than not less than the carrying value amount, the two-step impairment test would be required. Otherwise, further testing
F-9
Table of Contents
would not be needed. The new guidance does not change how goodwill is calculated, nor does it revise the requirement to test goodwill annually for impairment or between tests if events or circumstances warrant. The amended guidance is effective for us for fiscal year 2012, with earlier adoption permitted. We do not anticipate that this new guidance will have a material impact on our consolidated financial statements.
Presentation of Other Comprehensive Income
In June 2011, the FASB issued guidance that requires entities to report components of comprehensive income in either a continuous statement of comprehensive income or two separate but consecutive statements. The guidance removes the option to present the components of other comprehensive income (“OCI”) as part of the statement of equity. This guidance is effective for us for fiscal year 2012, and must be applied retrospectively for all periods presented in the financial statements. The new guidance does not apply to entities that have no items of OCI in any period presented. We do not anticipate that this new guidance will have a material impact on our consolidated financial statements.
Revenue Recognition
In October 2009, the FASB issued guidance on revenue recognition that became effective January 1, 2011. Under the new guidance tangible products that have software components that are essential to the functionality of the tangible product will no longer be within the scope of the software revenue recognition guidance; such software-enabled products will now be subject to other relevant revenue recognition guidance. Additionally, the FASB issued authoritative guidance on revenue arrangements with multiple deliverables that are outside the scope of the software revenue recognition guidance. Under the new guidance, when vendor specific objective evidence (“VSOE”) or third party evidence for deliverables in an arrangement cannot be determined, a best estimate of the selling price is required to separate deliverables and allocate arrangement consideration using the relative selling price method. The new guidance includes new disclosure requirements on how the application of the relative selling price method affects the timing and amount of revenue recognition. This guidance did not have a material impact on our consolidated financial statements.
3. Discontinued Operations
On December 31, 2010, Zix Corporation completed the previously announced (see Current Reports filed on Form 8-K dated December 8, 2009 and Form 8-K/A dated January 6, 2010) wind down of its e-Prescribing business, and discontinued operating this line of business. After completing a full strategic review of the e-Prescribing business and exploring its viability and contribution to increasing shareholder value, the Board of Directors and management decided to exit the e-Prescribing business. This decision allowed us to shift resources to Email Encryption.
The wind down of the business entailed the fulfillment of existing contracts. Assets previously used by this segment were absorbed by Email Encryption. As a result, no gain or loss on disposal of assets was incurred. Prior to the completion of the wind down, this business line had been a reportable segment. The following table summarizes the components of the Income (loss) from discontinued operations presented in our Statement of Operations for 2010 and 2009. There was no activity relating to e-Prescribing in 2011.
| Year Ended December 31, | ||||||||
| 2010 | 2009 | |||||||
| Revenues |
$ | 2,632,000 | $ | 4,244,000 | ||||
| Cost of revenues |
1,266,000 | 4,808,000 | ||||||
|
|
|
|
|
|||||
| Gross margin |
1,366,000 | (564,000 | ) | |||||
| Research and development expenses |
300,000 | 3,329,000 | ||||||
| Selling, general and administrative expenses |
304,000 | 2,953,000 | ||||||
|
|
|
|
|
|||||
| Income (loss) before income taxes |
$ | 762,000 | $ | (6,846,000 | ) | |||
|
|
|
|
|
|||||
During 2010 we reduced the costs of operating this business and transferred shared resources to the remaining business while meeting the requirements of our existing contracts. We also discontinued our recruiting efforts for the new e-Prescribing deployments and reduced the associated recruitment and deployment expenses. Additionally, customers requesting to renew existing contracts set to expire during 2010 were renewed to terminate no later than December 31, 2010. These actions resulted in significantly lower costs and lower revenue in 2010 compared to 2009.
F-10
Table of Contents
4. Stock Options and Stock-based Employee Compensation
Below is a summary of common stock options outstanding at December 31, 2011:
| Authorized Shares |
Options Outstanding |
Options Vested |
Available for Grant |
|||||||||||||
| Employee and Director Stock Option Plans: |
||||||||||||||||
| 1992 Stock Option Plan |
450,000 | 8,333 | 8,333 | — | ||||||||||||
| 1995 Long-term Incentive Plan |
1,825,000 | 740,000 | 740,000 | — | ||||||||||||
| 1999 Director’s Stock Option Plan |
975,000 | 194,502 | 194,502 | — | ||||||||||||
| 2001 Stock Option Plan |
2,525,000 | 1,317,216 | 1,297,582 | — | ||||||||||||
| 2001 Employee Stock Option Plan |
300,000 | 130,440 | 130,440 | — | ||||||||||||
| 2003 New Employee Stock Option Plan |
500,000 | 117,900 | 67,733 | 178,094 | ||||||||||||
| 2004 Stock Option Plan |
5,000,000 | 3,117,383 | 2,539,464 | 594,671 | ||||||||||||
| 2004 Director’s Stock Option Plan |
300,000 | 160,000 | 160,000 | — | ||||||||||||
| 2006 Director’s Stock Option Plan |
1,100,000 | 586,676 | 504,170 | 221,524 | ||||||||||||
|
|
|
|
|
|
|
|
|
|||||||||
| Total employee and director stock option plans |
12,975,000 | 6,372,450 | 5,642,224 | 994,289 | ||||||||||||
| Executive Stock Option Agreements: |
||||||||||||||||
| Richard D. Spurr, Chairman, President and CEO |
650,000 | 650,000 | 650,000 | — | ||||||||||||
| Other executive stock option agreements |
450,000 | 125,000 | 125,000 | — | ||||||||||||
|
|
|
|
|
|
|
|
|
|||||||||
| Total executive stock option agreements |
1,100,000 | 775,000 | 775,000 | — | ||||||||||||
|
|
|
|
|
|
|
|
|
|||||||||
| Total |
14,075,000 | 7,147,450 | 6,417,224 | 994,289 | ||||||||||||
|
|
|
|
|
|
|
|
|
|||||||||
Under all of our stock option plans, new shares are issued when options are exercised.
Employee and Director Stock Option Plans
We have non-qualified stock options outstanding to employees, directors, and third parties under various stock option plans. The plans require the exercise price of options granted under these plans to equal or exceed the fair market value of the Company’s common stock on the date of grant. The options, subject to termination of employment, generally expire ten years from the date of grant. Employee options typically vest pro-rata and quarterly over three years. Option grants to employees, officers and directors frequently contain accelerated vesting provisions upon the occurrence of a change of control, as defined in the applicable option agreements.
Executive Stock Option Agreements:
Richard D. Spurr — In January 2004, Mr. Richard D. Spurr was appointed president and chief operating officer of the Company. Mr. Spurr received non-shareholder approved options to acquire 650,000 shares of ZixCorp common stock at an exercise price of $10.80 per share. These options vested 25% in April 2004 and the remaining balance vested ratably on a quarterly basis through January 2007. At December 31, 2011, all 650,000 options were still outstanding. Mr. Spurr was appointed Chief Executive Officer in March 2005, and Chairman of the Board in February 2006.
Other Executive Stock Option Agreements — In 2001 and 2002, non-shareholder approved options to purchase 450,000 shares of common stock were granted to key Company executives, which became fully vested in March 2005. At December 31, 2011, 125,000 of these options remained outstanding with an exercise price of $5.25 per share.
Other Stock Option Agreements:
From time to time we may grant stock options to consultants, contractors and other third parties for services provided to the Company. These options are expensed based on their fair values as calculated by using the Black-Scholes Option Pricing Model (“BSOPM”). At December 31, 2011, options outstanding to non-employees were 205,000, which were granted from employee stock option plans.
F-11
Table of Contents
Accounting Treatment
We use the straight-line amortization method for recognizing stock option compensation costs. Our share-based awards are limited to stock options.
For the twelve months ended December 31, 2011, 2010, and 2009, respectively, the total stock-based compensation expense was recorded to the following line items of our consolidated statement of operations:
| Year Ended December 31, | ||||||||||||
| 2011 | 2010 | 2009 | ||||||||||
| Cost of revenues |
$ | 71,000 | $ | 161,000 | $ | 132,000 | ||||||
| Research and development expenses |
68,000 | 183,000 | 169,000 | |||||||||
| Selling, general and administrative expenses |
430,000 | 1,449,000 | 2,006,000 | |||||||||
| Discontinued operations |
— | 93,000 | 756,000 | |||||||||
|
|
|
|
|
|
|
|||||||
| Stock-based compensation expense |
$ | 569,000 | $ | 1,886,000 | $ | 3,063,000 | ||||||
|
|
|
|
|
|
|
|||||||
There were 725,936 stock options exercised for the twelve months ended December 31, 2011. As a result of these stock option exercises, there was $100,000 excess tax benefits recorded in 2011. For the comparative period in 2010, there were 1,537,147 stock option exercises. A deferred tax asset totaling $179,000 and $595,000 resulting from stock-based compensation expenses was recorded for the twelve months ended December 31, 2011 and 2010, respectively.
As of December 31, 2011, there was $1,335,000 of total unrecognized stock-based compensation related to non-vested share-based compensation awards granted under the stock option plans. This cost is expected to be recognized over a weighted average period of 1.0 years.
During the third quarter of 2009, the Company converted to a new third party stock option system. Although both the new and the legacy systems record the same expense over the life of fully vested stock options, the timing difference created by the two different systems required that we align the two systems upon conversion. In the third quarter of 2009 our stock compensation expense includes a non-recurring, non-cash “true-up” of $482,000 in stock-based compensation expense which was the amount of the forfeiture expense related to vesting options previously deferred in the legacy system most of which was included in SG&A expenses.
We used the BSOPM to determine the fair value of option grants made during 2011, 2010, and 2009. On January 1, 2006, we elected to use the “simplified” method to calculate the estimated life of options granted to employees. The use of the “simplified” method has been extended until such time when we have sufficient information to make more refined estimates on the estimated life of our options. The expected stock price volatility was calculated by averaging the historical volatility of the Company’s common stock over a term equal to the expected life of the options.
The following weighted average assumptions were applied in determining the fair value of options granted during the respective periods:
| Year Ended December 31, | ||||||||||||
| 2011 | 2010 | 2009 | ||||||||||
| Risk-free interest rate |
1.81 | % | 2.79 | % | 2.20 | % | ||||||
| Expected option life (years) |
5.8 | 5.8 | 5.7 | |||||||||
| Expected stock price volatility |
75 | % | 79 | % | 79 | % | ||||||
| Expected dividend yield |
— | — | — | |||||||||
| Fair value of options granted |
$ | 2.48 | $ | 1.36 | $ | 0.84 | ||||||
The assumptions used in the BSOPM valuation are critical as a change in any given factor could have a material impact on the financial results of the Company.
F-12
Table of Contents
Stock Option Activity
The following is a summary of all stock option transactions for the three years ended December 31, 2011:
| Shares | Weighted Average Exercise Price |
Weighted Average Remaining Contractual Term (Yrs) |
||||||||||
| Outstanding at January 1, 2009 |
10,039,367 | $ | 4.76 | |||||||||
| Granted at market price |
196,684 | $ | 1.49 | |||||||||
| Cancelled or expired |
(653,196 | ) | $ | 9.15 | ||||||||
| Exercised |
(11,743 | ) | $ | 1.55 | ||||||||
|
|
|
|||||||||||
| Outstanding at December 31, 2009 |
9,571,112 | $ | 4.40 | |||||||||
| Granted at market price |
724,072 | $ | 1.98 | |||||||||
| Cancelled or expired |
(1,111,145 | ) | $ | 6.29 | ||||||||
| Exercised |
(1,537,147 | ) | $ | 1.82 | ||||||||
|
|
|
|||||||||||
| Outstanding at December 31, 2010 |
7,646,892 | $ | 4.42 | |||||||||
| Granted at market price |
536,500 | $ | 3.83 | |||||||||
| Cancelled or expired |
(310,006 | ) | $ | 6.41 | ||||||||
| Exercised |
(725,936 | ) | $ | 2.46 | ||||||||
|
|
|
|||||||||||
| Outstanding at December 31, 2011 |
7,147,450 | $ | 4.48 | 4.45 | ||||||||
|
|
|
|
|
|
|
|||||||
| Options exercisable at December 31, 2011 |
6,417,224 | $ | 4.63 | 3.94 | ||||||||
|
|
|
|
|
|
|
|||||||
At December 31, 2011, we had 1,878,020 options outstanding and 1,624,719 options exercisable in which the exercise price was lower than the market value of the Company’s common stock. The aggregate intrinsic value of these options was $2,038,000 and $1,821,000, respectively. At December 31, 2010, we had 3,907,804 options outstanding and 3,305,267 options exercisable in which the exercise price was lower than the market value of the Company’s common stock. The aggregate intrinsic value of these options was $7,009,000 and $5,550,000, respectively.
The total intrinsic value of options exercised during the years ended December 31, 2011 and 2010, was $1,077,000 and $2,209,000, respectively.
Summarized information about stock options outstanding at December 31, 2011, is as follows:
| Options Outstanding | Options Exercisable | |||||||||||||||||||
| Range of Exercise Prices |
Number Outstanding |
Weighted
Average Remaining Contractual Life |
Weighted Average Exercise Price |
Number Exercisable |
Weighted Average Exercise Price |
|||||||||||||||
| $1.11 - $1.99 |
1,346,067 | 5.42 | $ | 1.53 | 1,247,682 | $ | 1.52 | |||||||||||||
| $2.00 - $3.49 |
1,035,048 | 5.46 | $ | 2.64 | 854,965 | $ | 2.72 | |||||||||||||
| $3.50 - $4.99 |
2,943,800 | 5.06 | $ | 4.32 | 2,492,042 | $ | 4.41 | |||||||||||||
| $5.00 - $5.99 |
495,927 | 1.83 | $ | 5.08 | 495,927 | $ | 5.08 | |||||||||||||
| $6.00 - $8.99 |
533,816 | 2.50 | $ | 6.54 | 533,816 | $ | 6.54 | |||||||||||||
| $9.00 - $11.00 |
792,792 | 2.14 | $ | 10.72 | 792,792 | $ | 10.72 | |||||||||||||
|
|
|
|
|
|||||||||||||||||
| 7,147,450 | 4.45 | $ | 4.48 | 6,417,224 | $ | 4.63 | ||||||||||||||
|
|
|
|
|
|||||||||||||||||
There were 7,034,356 and 8,620,793 exercisable options at December 31, 2010 and 2009, respectively.
Reserved Common Stock
At December 31, 2011, we held no shares of common stock in reserve for potential future grants in lieu of cash compensation to employees.
F-13
Table of Contents
5. Supplemental Cash Flow Information
Supplemental information relating to interest, taxes, and noncash activities:
| Year Ended December 31, | ||||||||||||
| 2011 | 2010 | 2009 | ||||||||||
| Cash interest paid |
$ | 7,000 | $ | 22,000 | $ | 21,000 | ||||||
|
|
|
|
|
|
|
|||||||
| Income tax payments |
$ | 225,000 | $ | 262,000 | $ | 196,000 | ||||||
|
|
|
|
|
|
|
|||||||
| Payables related to purchases of capitalized assets |
$ | 79,000 | $ | 17,000 | $ | 89,000 | ||||||
|
|
|
|
|
|
|
|||||||
| Excess tax benefit on exercise of employee stock options |
$ | 3,200,000 | $ | — | $ | — | ||||||
|
|
|
|
|
|
|
|||||||
| Assets sold to customers as part of their subscription service |
$ | — | $ | 9,000 | $ | 2,000 | ||||||
|
|
|
|
|
|
|
|||||||
| Issuance of promissory note for software license service agreement |
$ | — | $ | — | $ | 390,000 | ||||||
|
|
|
|
|
|
|
|||||||
6. Receivables, net
| December 31, | ||||||||
| 2011 | 2010 | |||||||
| Receivables |
$ | 711,000 | $ | 1,376,000 | ||||
| Allowance for returns and doubtful accounts |
(7,000 | ) | (32,000 | ) | ||||
| Note receivable |
458,000 | 476,000 | ||||||
| Allowance for note receivable |
(458,000 | ) | (476,000 | ) | ||||
|
|
|
|
|
|||||
| Receivables, net |
$ | 704,000 | $ | 1,344,000 | ||||
|
|
|
|
|
|||||
The allowance for doubtful accounts includes all specific accounts receivable which we believe are likely not collectable based on known information. In addition, we record 2.5% of all accounts receivable greater than 90 days past due, net of those accounts specifically reserved, as a general allowance against accounts that could potentially become uncollectible.
The note receivable represents the remaining outstanding balance of an original note related to the sale of a product line in 2005 in the amount of $540,000. This was fully reserved at the time of the sale as the note’s collectability was not assured. The note receivable is fully reserved at December 31, 2011.
7. Prepaid and other current assets
| December 31, | ||||||||
| 2011 | 2010 | |||||||
| Prepaid insurance, maintenance, software licenses and other |
$ | 1,141,000 | $ | 1,046,000 | ||||
| Deferred Commissions |
186,000 | — | ||||||
| Tax-related |
95,000 | 69,000 | ||||||
|
|
|
|
|
|||||
| Prepaid and other current assets |
$ | 1,422,000 | $ | 1,115,000 | ||||
|
|
|
|
|
|||||
8. Property and Equipment
| December 31, | ||||||||
| 2011 | 2010 | |||||||
| Computer and office equipment and software |
$ | 23,958,000 | $ | 24,173,000 | ||||
| Leasehold improvements |
4,986,000 | 4,894,000 | ||||||
| Furniture and fixtures |
1,465,000 | 1,371,000 | ||||||
|
|
|
|
|
|||||
| 30,409,000 | 30,438,000 | |||||||
| Less accumulated depreciation and amortization |
(28,181,000 | ) | (28,229,000 | ) | ||||
|
|
|
|
|
|||||
| $ | 2,228,000 | $ | 2,209,000 | |||||
|
|
|
|
|
|||||
Our continuing operations include depreciation and amortization expense related to property and equipment of $1,373,000, $1,281,000, and $1,017,000 in 2011, 2010, and 2009, respectfully.
9. Goodwill
At December 31, 2011 and 2010, we had goodwill totaling $2,161,000. We evaluate goodwill for impairment annually in the fourth quarter, or when there is reason to believe that the value has been diminished or impaired. There were no impairment indicators to the goodwill recorded as of December 31, 2011.
F-14
Table of Contents
10. Accrued Expenses
| December 31, | ||||||||
| 2011 | 2010 | |||||||
| Employee compensation and benefits |
$ | 932,000 | $ | 818,000 | ||||
| Professional fees |
373,000 | 492,000 | ||||||
| Taxes |
230,000 | 641,000 | ||||||
| Other |
361,000 | 331,000 | ||||||
|
|
|
|
|
|||||
| Total accrued expenses |
$ | 1,896,000 | $ | 2,282,000 | ||||
|
|
|
|
|
|||||
11. Fair Value Measurements
FASB guidance regarding fair value measurement establishes a three-tier fair value hierarchy, which prioritizes the inputs used in measuring fair value. These tiers include: Level 1, defined as observable inputs such as quoted prices in active markets for identical assets or liabilities; Level 2, defined as inputs other than quoted prices for similar assets and liabilities in active markets that are either directly or indirectly observable; and Level 3, defined as unobservable inputs for which little or no market data exists, therefore requiring an entity to develop its own assumptions.
For certain of the Company’s financial instruments, including cash and cash equivalents, trade receivables, and accounts payable, the fair values approximate carrying values due to the short-term maturities of these instruments. The carrying values of other current assets and accrued expenses are also not recorded at fair value, but approximate fair values primarily due to their short-term nature.
12. Notes Payable
License Subscription Note Payable
We entered into a financing agreement with CIT Financial in May 2009 to fund the purchase of computer software licenses. The note was for $390,000 and was non-interest bearing (imputed interest at 8.6%). The note was payable in 36 equal monthly installments of $12,000 per month with the final payment originally scheduled for April 2012, but we instead paid the remaining balance of the note July 2011.
13. April 2006 Private Placement of Common Stock
On April 5, 2006, we sold, in a private placement transaction, an aggregate of 9,930,000 units consisting of (i) one share of common stock of the Company, par value $0.01 per share and (ii) a related warrant to purchase 0.60 of one share of common stock. The units were sold for a purchase price of $1.19 per unit. Total proceeds from the transaction were $11,817,000 (net proceeds to us were $10,964,000 after $853,000 of cash transaction costs). The net proceeds were used for working capital and general corporate purposes, including funding our business plan.
The transaction resulted in our issuing 9,930,000 shares of common stock and 5,958,000 warrants to purchase our common stock. The warrants had a 66-month term and unexercised options expired October 2011. The exercise price of the warrants was $1.54 per share. The warrants contained anti-dilution protection for stock splits and similar events, but did not contain any price-based anti-dilution adjustments. If any of the 5,958,000 warrants issued to investors in this transaction were exercised at any time, the underwriters received additional transaction fees totaling 1% of the proceeds received from the warrant exercise. During 2011, 2,407,610 warrants were exercised, generating cash proceeds of approximately $3,708,000 and fees payable to the underwriters of approximately $37,000. During 2010, 1,915,000 warrants were exercised, generating cash proceeds of approximately $2,949,000 and fees payable to the underwriters of approximately $29,000. During 2009, 65,190 warrants were exercised, generating cash proceeds of approximately $100,000 and fees payable to the underwriters of approximately $1,000.
The potential future payments to the transaction underwriters were considered a contingent liability and recorded as an accrued expense. This contingent liability was revalued each quarter with the change in valuation recorded as a gain or loss in the statement of operations. Due to the expiration of the warrants in October 2011, there was no contingent liability at December 31, 2011. The total liability recorded was $36,000 and $60,000 at December 31, 2010 and 2009, respectively, and was included in accrued expenses.
F-15
Table of Contents
14. Equity Financing Arrangements and Related Warrants
Warrants Summary
Below is a summary of warrant activity during 2011:
| Warrant Grants: |
December
31, 2010 Warrants Outstanding |
Warrants Issued |
Warrants Expired |
Warrants Exercised |
December
31, 2011 Warrants Outstanding |
Exercise Price |
Warrant Expiration |
|||||||||||||||||||||
| 2006 private placement of common stock (See Note 13) |
2,432,810 | — | (25,200 | ) | (2,407,610 | ) | — | $ | 1.54 | Oct 2011 | ||||||||||||||||||
| Promissory note payable |
145,853 | — | — | — | 145,853 | 4.48 | Jan 2012 | |||||||||||||||||||||
|
|
|
|
|
|
|
|
|
|
|
|||||||||||||||||||
| Total |
2,578,663 | — | (25,200 | ) | (2,407,610 | ) | 145,853 | |||||||||||||||||||||
|
|
|
|
|
|
|
|
|
|
|
|||||||||||||||||||
All 145,853 warrants remaining at December 31, 2011, expired in January 2012.
15. Earnings Per Share and Potential Dilution
Basic earnings per share are computed using the weighted average number of common shares outstanding for the period. The dilutive effect of potential common shares outstanding is included in diluted earnings per share. The computations for basic and diluted earnings per share for the years ended December 31, 2011, 2010, and 2009, are as follows:
| Year Ended December 31, | ||||||||||||
| 2011 | 2010 | 2009 | ||||||||||
| Basic weighted average shares |
65,439,078 | 64,401,384 | 63,422,088 | |||||||||
| Effect of dilutive securities: |
||||||||||||
| Employee and director stock options |
943,634 | 913,670 | 211,185 | |||||||||
| Warrants |
878,802 | 1,426,627 | 417,478 | |||||||||
|
|
|
|
|
|
|
|||||||
| Potential dilutive common shares |
67,261,514 | 66,741,681 | 64,050,751 | |||||||||
|
|
|
|
|
|
|
|||||||
For the years ended December 31, 2011, 2010, and 2009, weighted average shares related to certain stock options of 4,640,713, 6,648,077, and 8,518,982 respectively, were excluded from the calculation of diluted earnings per share because the stock options were anti-dilutive. Anti-dilutive warrants of 145,853, 2,134,544, and 7,677,196 for the years ended December 31, 2011, 2010, and 2009, respectively, were also excluded from the calculation.
16. Significant Customers
In 2011, 2010, and 2009, no single customer accounted for 10% or more of our revenues.
17. Commitments and Contingencies
Leases
We lease office facilities under non-cancelable operating lease agreements. Our continuing operations includes rent expense for these operating leases of $1,346,000, $1,288,000, and $1,334,000 in 2011, 2010, and 2009, respectively.
A summary of our fixed contractual obligations and commitments at December 31, 2011, is as follows:
| 2012 | 2013 | 2014 | 2015 | 2016 | Thereafter | Total | ||||||||||||||||||||||
| Operating leases |
$ | 1,236,000 | $ | 1,035,000 | $ | 818,000 | $ | 157,000 | $ | 93,000 | $ | — | $ | 3,339,000 | ||||||||||||||
Claims and Proceedings
We are subject to legal proceedings, claims, and litigation against our business. While the outcome of these matters is currently not determinable and the costs and expenses of defending these matters may be significant, we currently do not expect that the ultimate costs to resolve these matters will have a material adverse effect on our consolidated financial statements.
F-16
Table of Contents
18. Income Taxes
Components of the income taxes are as follows:
| 2011 | 2010 | 2009 | ||||||||||
| Current: |
||||||||||||
| U.S. |
$ | 122,000 | $ | (99,000 | ) | $ | (95,000 | ) | ||||
| State |
163,000 | 33,000 | (20,000 | ) | ||||||||
| Foreign |
(378,000 | ) | 126,000 | 179,000 | ||||||||
| Deferred |
||||||||||||
| Federal |
(9,800,000 | ) | (35,300,000 | ) | — | |||||||
| State |
(2,000,000 | ) | — | — | ||||||||
| Foreign |
4,000 | 9,000 | 3,000 | |||||||||
|
|
|
|
|
|
|
|||||||
| Income tax (benefit) expense |
(11,889,000 | ) | (35,231,000 | ) | 67,000 | |||||||
| Discontinued operations |
— | 269,000 | — | |||||||||
|
|
|
|
|
|
|
|||||||
| Continuing operations |
$ | (11,889,000 | ) | $ | (35,500,000 | ) | $ | 67,000 | ||||
|
|
|
|
|
|
|
|||||||
A reconciliation of the expected U.S. tax (benefit) expense to income taxes is as follows:
| 2011 | 2010 | 2009 | ||||||||||
| Expected tax (benefit) expense at U.S. statutory rate |
$ | 3,753,000 | $ | 1,988,000 | $ | (1,527,000 | ) | |||||
| Decrease in valuations allowance- Operations |
(3,357,000 | ) | (2,574,000 | ) | — | |||||||
| Decrease in valuations allowance- Other |
(9,900,000 | ) | (35,300,000 | ) | — | |||||||
| Unbenefited U.S. losses, net |
— | — | 1,546,000 | |||||||||
| Nondeductible expense and nontaxable income |
(125,000 | ) | 141,000 | (19,000 | ) | |||||||
| Refundable U.S. research credits |
— | (50,000 | ) | (95,000 | ) | |||||||
| State income taxes |
(1,878,000 | ) | (80,000 | ) | (20,000 | ) | ||||||
| Foreign income taxes |
(374,000 | ) | 134,000 | 182,000 | ||||||||
| Other |
(8,000 | ) | 510,000 | — | ||||||||
|
|
|
|
|
|
|
|||||||
| Income tax (benefit) expense |
(11,889,000 | ) | (35,231,000 | ) | 67,000 | |||||||
| Discontinued operations |
— | 269,000 | — | |||||||||
|
|
|
|
|
|
|
|||||||
| Continuing operations |
$ | (11,889,000 | ) | $ | (35,500,000 | ) | $ | 67,000 | ||||
|
|
|
|
|
|
|
|||||||
Deferred income taxes reflect the net tax effects of temporary differences between the carrying amounts of assets and liabilities for financial reporting purposes and the amounts used for income tax purposes. Components of our deferred income taxes as of December 31, 2011 and 2010 are as follows:
| 2011 | 2010 | |||||||
| Deferred tax assets: |
||||||||
| Nondeductible reserves |
$ | 157,000 | $ | 176,000 | ||||
| U.S. net operating loss carryforwards |
93,984,000 | 97,308,000 | ||||||
| State net operating loss carryforwards |
770,000 | 128,000 | ||||||
| Tax credit carryforwards |
5,461,000 | 5,343,000 | ||||||
| Stock-based compensation |
3,806,000 | 4,049,000 | ||||||
| Intangible assets |
1,864,000 | 2,335,000 | ||||||
| Depreciable assets |
1,471,000 | 1,184,000 | ||||||
| Unrecognized gain on derivatives |
— | 13,000 | ||||||
| Other assets |
543,000 | 527,000 | ||||||
|
|
|
|
|
|||||
| Total deferred tax assets |
108,056,000 | 111,063,000 | ||||||
| Deferred tax liabilities: |
||||||||
| Prepaid expenses |
(324,000 | ) | (351,000 | ) | ||||
|
|
|
|
|
|||||
| Total deferred tax assets |
107,732,000 | 110,712,000 | ||||||
|
|
|
|
|
|||||
| Less valuation allowance |
(57,384,000 | ) | (75,352,000 | ) | ||||
|
|
|
|
|
|||||
| Net deferred income taxes |
$ | 50,348,000 | $ | 35,360,000 | ||||
|
|
|
|
|
|||||
F-17
Table of Contents
The Company has partially reserved its U.S. net deferred tax assets in 2011 and 2010 due to the uncertainty of future taxable income. The Company has U.S. net operating loss carryforwards of approximately $276,000,000 which begin to expire in 2019. The Company has state credits that net of federal tax expense total $2,071,000 which can be utilized through 2027 and state net operating losses that have various expiration dates. The Company also has tax credit carryforwards of approximately $3,390,000 consisting of business tax credits which began to expire in 2011 and alternative minimum tax credits which do not expire.
In 2010, the Company achieved positive earnings and successfully discontinued operations of its e-Prescribing segment. Based on the weight of available objective evidence, including the Company’s history of positive earnings from continuing operations and successful exit from e-Prescribing, management believes that it is more likely than not that a portion of the deferred tax asset will be realized. Accordingly, the Company reduced its valuation allowance by $15,000,000 in 2011 and $35,300,000 in 2010. The benefit from the 2011 reduction was recorded in part as an $11,800,000 income tax benefit and in part as a $3,200,000 increase to our additional paid in capital. The segregation of the release was due to the reduction related to historical employee stock option exercises.
We have determined that utilization of existing net operating losses against future taxable income is not limited by Section 382 of the Internal Revenue Code. Future ownership changes, however, may limit the company’s ability to fully utilize its existing net operating loss carryforwards against any future taxable income.
The Company previously recorded a $327,000 tax contingency liability related to tax year 2004, and that amount and the specifics therein remained unchanged except for currency translation adjustments. As of December 31, 2010, the gross amount of our unrecognized tax benefits, inclusive of the $327,000 tax liability and $50,000 in other uncertain positions in 2008, was approximately $461,000. Included in this balance were tax positions which, if recognized, would impact our effective tax rate. Because the statute of limitations expired on the returns associated with these uncertain tax positions, this contingency was reversed in 2011, resulting in the recognition of an income tax benefit and positive impact on our 2011 operating results.
A reconciliation of the changes in the gross balance of unrecognized tax benefits amounts during 2011 follows:
| Unrecognized Tax Benefits |
||||
| Balance at December 31, 2009 |
$ | 440,000 | ||
| Change in beginning balance due to currency fluctuation |
21,000 | |||
| Additions based on tax positions related to current year |
— | |||
| Decreases based on tax positions related to current year |
— | |||
| Additions based on tax positions related to prior years |
— | |||
| Decreases based on tax positions related to prior years |
— | |||
| Additions based on tax positions related to settlements |
— | |||
| Decreases related to lapse of statute of limitations |
— | |||
|
|
|
|||
| Balance at December 31, 2010 |
461,000 | |||
| Change in beginning balance due to currency fluctuation |
— | |||
| Additions based on tax positions related to current year |
— | |||
| Decreases based on tax positions related to current year |
— | |||
| Additions based on tax positions related to prior years |
— | |||
| Decreases based on tax positions related to prior years |
— | |||
| Additions based on tax positions related to settlements |
— | |||
| Decreases related to lapse of statute of limitations |
(461,000 | ) | ||
|
|
|
|||
| Balance at December 31, 2011 |
$ | 0 | ||
|
|
|
|||
We record accrued interest and penalties related to unrecognized tax benefits in selling, general and administrative expense. There was an insignificant amount of interest expense and penalties accrued or recognized related to unrecognized tax benefits for the years ended December 31, 2011 and 2010.
The Company or one of our subsidiaries files income tax returns in the U.S. federal jurisdiction and various states and in the Canadian federal and provincial jurisdictions. We have not taken a tax position that, if challenged, would have a material effect on the financial statements or the effective tax rate for the twelve-months ended December 31, 2011, or during the prior three years. We have determined it is not reasonably possible for the amounts of unrecognized tax benefits to significantly increase or decrease within the next twelve months. We are currently subject to a three-year statute of limitations by major tax jurisdictions.
F-18
Table of Contents
19. Employee Benefit Plan
401(k) Plan — We have a retirement savings plan structured under Section 401(k) of the Internal Revenue Code covering substantially all of our U.S. employees. Under the plan, contributions are voluntarily made by employees, and we may provide contributions based on the employees’ contributions. Our operating income includes $185,000 and $210,000, in 2011 and 2010, respectively, for net contributions from continuing operations to this plan. Our operating losses include $245,000 in 2009 for net contributions from continuing operations to this plan.
20. ZixCorp Repurchase Program
On March 7, 2011, the Company announced that its board of directors approved a share repurchase program that enabled the company to purchase up to $15 million of its shares of common stock from time to time in the open market. We completed the share repurchase program during the first week of July 2011. In total, 4,308,400 shares valued at approximately $15,000,000 were transferred to the Company through this initiative.
On November 9, 2011, the Company announced that its board of directors approved a second share repurchase program that enables the company to purchase up to $15 million of its shares of common stock from time to time in the open market. The amount and timing of specific repurchases are subject to market conditions, applicable legal requirements and other factors. The share purchases will be funded from existing cash resources and may be suspended or discontinued at any time, however, the share repurchase program will expire on June 30, 2012. The Company repurchased 2,184,353 shares at an aggregate cost of $6,000,000 under this second program during the year ended December 31, 2011.
21. Quarterly Results of Operations (Unaudited)
The following is a summary of the quarterly results of operations for the years ended December 31, 2011 and 2010:
| Quarter Ended | ||||||||||||||||
| March 31 | June 30 | September 30 | December 31 | |||||||||||||
| 2011 |
||||||||||||||||
| Revenues |
$ | 9,271,000 | $ | 9,431,000 | $ | 9,558,000 | $ | 9,885,000 | ||||||||
| Gross margin |
7,454,000 | 7,675,000 | 7,769,000 | 8,036,000 | ||||||||||||
| Income from continuing operations |
2,399,000 | 2,617,000 | 2,571,000 | 14,967,000 | ||||||||||||
| Basic income from continuing operations per common share* |
0.04 | 0.04 | 0.04 | 0.23 | ||||||||||||
| Diluted income from continuing operations per common share* |
0.03 | 0.04 | 0.04 | 0.23 | ||||||||||||
| Income from discontinued operations |
— | — | — | — | ||||||||||||
| Basic income from discontinued operations per common share* |
— | — | — | — | ||||||||||||
| Diluted income from discontinued per common share* |
— | — | — | — | ||||||||||||
| Net income |
2,399,000 | 2,617,000 | 2,571,000 | 14,967,000 | ||||||||||||
| Basic net income per common share* |
0.04 | 0.04 | 0.04 | 0.23 | ||||||||||||
| Diluted net income per common share* |
0.03 | 0.04 | 0.04 | 0.23 | ||||||||||||
| 2010 |
||||||||||||||||
| Revenues |
$ | 7,479,000 | $ | 8,194,000 | $ | 8,548,000 | $ | 8,845,000 | ||||||||
| Gross margin |
5,977,000 | 6,624,000 | 6,886,000 | 7,111,000 | ||||||||||||
| Income from continuing operations |
524,000 | 1,379,000 | 1,671,000 | 37,146,000 | ||||||||||||
| Basic income from continuing operations per common share* |
0.01 | 0.02 | 0.03 | 0.57 | ||||||||||||
| Diluted income from continuing operations per common share* |
0.01 | 0.02 | 0.03 | 0.54 | ||||||||||||
| Income from discontinued operations |
188,000 | 122,000 | 97,000 | 86,000 | ||||||||||||
| Basic income from discontinued operations per common share* |
0.00 | 0.00 | 0.00 | 0.00 | ||||||||||||
F-19
Table of Contents
| Diluted income from discontinued per common share* |
0.00 | 0.00 | 0.00 | 0.00 | ||||||||||||
| Net income |
712,000 | 1,501,000 | 1,768,000 | 37,232,000 | ||||||||||||
| Basic net income per common share* |
0.01 | 0.02 | 0.03 | 0.57 | ||||||||||||
| Diluted net income per common share* |
0.01 | 0.02 | 0.03 | 0.54 |
| * | Net loss per share is calculated independently for each quarter. The sum of Net loss per share for each quarter does not equal the total Net loss per share for the year due to rounding differences. |
F-20