Attached files
| file | filename |
|---|---|
| EX-31.1 - CERTIFICATION OF PRINCIPAL EXECUTIVE OFFICER - INSEEGO CORP. | d269358dex311.htm |
| EX-31.2 - CERTIFICATION OF PRINCIPAL FINANCIAL OFFICER - INSEEGO CORP. | d269358dex312.htm |
| EX-23.1 - CONSENT OF INDEPENDENT REGISTERED PUBLIC ACCOUNTING FIRM - INSEEGO CORP. | d269358dex231.htm |
| EXCEL - IDEA: XBRL DOCUMENT - INSEEGO CORP. | Financial_Report.xls |
| EX-21 - SUBSIDIARIES OF NOVATEL WIRELESS, INC. - INSEEGO CORP. | d269358dex21.htm |
| EX-32.1 - CERTIFICATION OF PRINCIPAL EXECUTIVE OFFICER AND PRINCIPAL FINANCIAL OFFICER - INSEEGO CORP. | d269358dex321.htm |
Table of Contents
UNITED STATES
SECURITIES AND EXCHANGE COMMISSION
Washington, DC 20549
FORM 10-K
| x | ANNUAL REPORT PURSUANT TO SECTION 13 OR 15(d) OF THE |
| SECURITIES EXCHANGE ACT OF 1934 |
For fiscal year ended December 31, 2011
OR
| ¨ | TRANSITION REPORT PURSUANT TO SECTION 13 OR 15(d) OF THE SECURITIES EXCHANGE ACT OF 1934 |
For the transition period from to
Commission file number: 000-31659
NOVATEL WIRELESS, INC.
(exact name of registrant as specified in its charter)
| Delaware | 86-0824673 | |
| (State or Other Jurisdiction of Incorporation or Organization) |
(I.R.S. Employer Identification No.) | |
| 9645 Scranton Road San Diego, California |
92121 | |
| (Address of Principal Executive Offices) | (zip code) | |
Registrant’s telephone number, including area code: (858) 320-8800
Securities registered pursuant to Section 12(b) of the Act: None
Securities registered pursuant to Section 12(g) of the Act:
Common Stock, par value $.001 per share
Indicate by check mark if the Registrant is a well-known seasoned issuer, as defined in Rule 405 of the Securities Act. Yes ¨ No x
Indicate by check mark if the Registrant is not required to file reports pursuant to Section 13 or Section 15(d) of the Act. Yes ¨ No x
Indicate by check mark whether the Registrant (1) has filed all reports required to be filed by Section 13 or 15(d) of the Securities Exchange Act of 1934 during the preceding 12 months (or for such shorter period that the Registrant was required to file such reports), and (2) has been subject to such filing requirements for the past 90 days. Yes x No ¨
Indicate by check mark whether the Registrant has submitted electronically and posted on its corporate Website, if any, every Interactive Data File required to be submitted and posted pursuant to Rule 405 of Regulation S-T during the preceding 12 months (or for such shorter period that the Registrant was required to submit and post such files). Yes x No ¨
Indicate by check mark if disclosure of delinquent filers pursuant to Item 405 of Regulation S-K is not contained herein, and will not be contained, to the best of Registrant’s knowledge, in definitive proxy or information statements incorporated by reference in Part III of this Form 10-K or any amendment to this Form 10-K. x
Indicate by check mark whether the Registrant is a large accelerated filer, an accelerated filer, a non-accelerated filer, or a smaller reporting company. See the definitions of “large accelerated filer,” “accelerated filer” and “smaller reporting company” in Rule 12b-2 of the Exchange Act. (Check one):
Large accelerated filer ¨ Accelerated filer x Non-Accelerated filer ¨ Smaller Reporting Company ¨
Indicate by check mark whether the Registrant is a shell company (as defined in Rule 12b-2 of the Exchange Act). Yes ¨ No x
The aggregate market value of the voting common stock held by non-affiliates of the Registrant, based on the closing price of the Registrant’s common stock on June 30, 2011, as reported by The Nasdaq Global Select Market, was approximately $106,826,791. For the purposes of this calculation, shares owned by officers and directors (and their affiliates) have been excluded. This exclusion is not intended, nor shall it be deemed, to be an admission that such persons are affiliates of the Registrant. The Registrant does not have any non-voting stock issued or outstanding.
The number of shares of the Registrant’s common stock outstanding as of March 1, 2012 was 32,279,593.
DOCUMENTS INCORPORATED BY REFERENCE
Portions of the Registrant’s definitive proxy statement for the 2012 Annual Meeting of Stockholders to be filed with the Securities and Exchange Commission pursuant to Regulation 14A are incorporated by reference into Part III of this Form 10-K to the extent stated herein.
Table of Contents
Table of Contents
Forward-Looking Statements
This report contains forward-looking statements within the meaning of Section 27A of the Securities Act of 1933 and Section 21E of the Securities Exchange Act of 1934. You should not place undue reliance on these statements. These forward-looking statements include statements that reflect the views of our senior management with respect to our current expectations, assumptions, estimates and projections about Novatel Wireless and our industry. Statements that include the words “may,” “could,” “should,” “would,” “estimate,” “anticipate,” “believe,” “expect,” “preliminary,” “intend,” “plan,” “project,” “outlook,” “will” and similar words and phrases identify forward-looking statements. Forward-looking statements address matters that involve risks and uncertainties that could cause actual results to differ materially from those anticipated in these forward-looking statements as of the date of this report. We believe that these factors include the following:
| • | our ability to compete in the market for wireless broadband data access products; |
| • | our ability to develop and timely introduce new products successfully; |
| • | our ability to integrate the operations of Enfora and any other business, products, technologies or personnel that we may acquire in the future; |
| • | the continuing impact of uncertain global economic conditions on the demand for our products; |
| • | our ability to introduce and sell new products that comply with current and evolving industry standards, including 3G and 4G standards, and government regulations; |
| • | our ability to develop and maintain strategic relationships to expand into new markets; |
| • | our dependence on a small number of customers for a substantial portion of our revenues; |
| • | demand for broadband wireless access to enterprise networks and the Internet; |
| • | the marketability of our products is dependent on wireless telecommunication operators delivering acceptable wireless services; |
| • | our ability to properly manage the growth of our business to avoid significant strains on our management and operations and disruptions to our business; |
| • | our reliance on third parties to procure components and manufacture our products; |
| • | our ability to accurately forecast customer demand and order the manufacture and timely delivery of sufficient product quantities; |
| • | our reliance on sole source suppliers for some components used in our products; |
| • | the outcome of pending or future litigation, including the current class action securities litigation and intellectual property litigation; |
| • | infringement claims with respect to intellectual property contained in our products; |
| • | our continued ability to license necessary third-party technology for the development and sale of our products; |
| • | risks associated with doing business abroad, including foreign currency risks; |
| • | the risk of introducing new products that could contain errors or defects; and |
| • | our ability to hire, retain and manage additional qualified personnel to maintain and expand our business. |
The foregoing factors should not be construed as exhaustive and should be read together with the other cautionary statements included in this and other reports we file with the Securities and Exchange Commission, including the information in “Item 1A. Risk Factors” in Part I of this report. If one or more events related to these or other risks or uncertainties materialize, or if our underlying assumptions prove to be incorrect, actual results may differ materially from what we anticipate.
Table of Contents
Trademarks
“Novatel Wireless”, the Novatel Wireless logo, “MiFi”, “MiFi Intelligent Mobile Hotspot”, “MiFi OS”, “MiFi Home”, “MobiLink”, “Ovation,” “Expedite”, “MiFi.Freedom. My Way”, “Conversa”, “NovaSpeed”, “NovaCore” and “NovaDrive” are trademarks of Novatel Wireless, Inc. “Enfora”, the Enfora logo, “Spider”, “Enabling Information Anywhere”, “Enabler”, “eWide” and “N4A” are trademarks of Enfora, Inc. Other trademarks, trade names or service marks used in this report are the property of their respective owners.
Table of Contents
PART I
| Item 1. | Business |
Overview
We are a provider of intelligent wireless solutions for the worldwide mobile communications market. Our broad range of products principally includes intelligent mobile hotspots, USB modems, embedded PCI and wireless PC-card modems, and communications and applications software. In addition, our Enfora division provides asset-management solutions utilizing intelligent platforms, customized service-delivery software, and machine-to-machine, or M2M, communications devices.
Our products currently operate on every major cellular wireless technology platform. Our mobile hotspots, embedded modules, and modems provide subscribers with secure and convenient high-speed access to corporate, public and personal information through the Internet and enterprise networks. Our M2M products enable devices to communicate with each other and with server or cloud-based application infrastructure.
Our mobile-hotspot and modem customer base is comprised of wireless operators, including AT&T, Bell Mobility, Sprint, Verizon Wireless, and Virgin Mobile; laptop PC and other original equipment manufacturers, or OEMs, including Dell and Hewlett-Packard; as well as distributors and various companies in other vertical markets. Our M2M customer base is comprised of transportation companies, industrial companies, manufacturers of medical devices and geographical-location devices and providers of security systems. We have strategic relationships with several of these customers for technology development and marketing.
On November 30, 2010, we completed our acquisition of Enfora, Inc., a provider of intelligent asset-management solutions utilizing wireless technology and M2M communications. The acquisition of Enfora diversifies our customer based and product lines into adjacent markets and advances our strategy of providing intelligent devices to more end markets—enterprise, customer and vertical applications.
For the years ended December 31, 2011, 2010, and 2009, net revenues recognized from sales of our products were $402.9 million, $338.9 million, and $337.4 million, respectively.
We were incorporated in 1996 under the laws of the State of Delaware.
Our Strategy
Our objective is to be a leading provider of intelligent wireless solutions. The key elements of our strategy are to:
| • | Broaden Our Product Offerings. We intend to diversify and continue to broaden our product lines in the following areas: intelligent mobile hotspots, communications and applications software, USB modems, embedded modules, asset-management solutions utilizing intelligent M2M platforms that combine hardware and customized service-delivery software, and M2M communications devices. |
| • | Expand Our Wireless Product Offerings Worldwide. We intend to continue expanding our portfolio of wireless products with leading wireless operators and OEMs worldwide. Our products operate on every major wireless technology platform, including Second Generation (2G) networks: GSM, CDMA, GPRS; Third Generation (3G) networks: EV-DO, HSDPA and HSUPA; and Fourth Generation (4G) networks: LTE, dual carrier HSPA+, and WiMAX. |
| • | Lead the Intelligent Mobile Hotspot Product Category. We developed the MiFi® Intelligent Mobile Hotspot, a new category in wireless mobile data devices. In May 2009, the first nationwide commercial deployment of MiFi hotspots was launched by Verizon Wireless. Since that time, approximately 20 additional operators around the world have commercially launched MiFi for both 3G and 4G technologies. We have multiple versions of MiFi hotspots currently in development and we plan to continue to be a leader in innovative MiFi products and software applications. |
1
Table of Contents
| • | Capitalize on Our Direct Relationships with Wireless Operators. We intend to continue to capitalize on our direct relationships with wireless operators in order to increase our worldwide market position. In the United States and internationally, we are working closely with wireless operators to provide intelligent devices that will optimize their high-speed 4G wireless data networks. We are also working with wireless operators to expand the opportunities for M2M communications solutions. |
| • | Leverage Strategic Relationships. We believe that strategic relationships with wireless carriers and enterprises that utilize mobile computing technology are critical to our ability to leverage sales opportunities and ensure that our technology investments address customer needs. Through strategic relationships, we believe that we can increase market penetration and differentiate our products by leveraging resources, including sales, marketing, and distribution systems. We are also addressing new market opportunities through innovation with our strategic partners. |
| • | Continue to Target Key Vertical Market Opportunities and Penetrate New Markets. We believe that continuing developments in wireless technologies will create additional vertical market opportunities and more applications for our products. Currently, we market our wireless access and M2M solutions to key vertical industry segments by offering innovative products that are intended to increase productivity, reduce costs and create operational efficiencies. |
| • | Increase the Value of Our Products. We will continue to add new features, functionality and intellectual property to our products and develop new services and software applications to enhance the overall value and ease of use that our products provide to our customers and end users. |
| • | Acquire Companies that Accelerate the Growth of Our Business. We will continue to seek strategic acquisitions of companies in closely aligned businesses and technologies that will provide synergistic growth in revenue and profitability. |
Our Segments
We operate in the wireless-data industry in the following reportable segments:
| • | Mobile Computing Products—includes our MiFi products, USB and PC-card modems and embedded modules that enable data transmission and services via cellular wireless networks. |
| • | M2M Products and Solutions—includes our intelligent M2M communications devices and modules, and asset-management solutions utilizing platforms that combine communications devices and customized service-delivery software. |
For additional information on our segments, see Note 12 to our consolidated financial statements.
Mobile Computing Products
We have a growing portfolio of leading-edge technology solutions that enable data transmission and services via cellular wireless networks. In 2011, we upgraded our line of hotspots, modems, and embedded modules to 4G, including LTE, dual-carrier HSPA+, and WiMAX.
Below are major Mobile Computing product lines:
MiFi® Intelligent Mobile Hotspot is our flagship product. Introduced in 2009, it has quickly become a leading brand in mobile communications. MiFi hotspots are gaining acceptance as the best connectivity option for Wi-Fi-enabled devices such as the iPad, Kindle, tablets, PCs, MP3 players, and gaming devices. MiFi hotspots function by connecting to a cellular-wireless network and creating a secure Wi-Fi signal that can connect to as many as 10 devices simultaneously. We have sold more than three million MiFi devices since launching this product family. MiFi hotspots accounted for 63%, 49%, and 24% of revenue in 2011, 2010, and 2009, respectively.
2
Table of Contents
Our strategy for the MiFi platform is to add additional features beyond basic connectivity. For example, our MiFi OS enables on-board application processing and storage that has the capability to run software applications. We are optimistic that the MiFi OS will become a platform for a wide range of applications that will interface with the rapidly growing number of Wi-Fi-enabled devices.
Modems continue to be widely-used to access wireless broadband networks. We introduced USB and PC-Card modems in North America, and continue to provide the most advanced wireless access in the industry. USB and PC-Card Modems accounted for 20%, 46%, and 50% of revenue in 2011, 2010, and 2009 respectively.
Embedded Modules are utilized in a wide range of computing devices, such as laptop PCs, netbooks, tablets, and various other electronic products to provide wireless broadband access. Embedded modules accounted for 4%, 3%, and 26% of revenue in 2011, 2010, and 2009, respectively.
We expect embedded modules to be a source of revenue growth in 2012. A variety of new electronic devices, designed to utilize high-speed, 4G technology, offer new opportunities to provide embedded modules to OEMs. We are aggressively pursuing these opportunities, and are providing 4G embedded modules to a number of major manufacturers.
Communications Software includes a growing family of software products designed with mobile needs in mind.
Our MobiLink mobile communications software suite, which resides on a mobile computing device, is an object-oriented application that enables quick and simple access to advanced connectivity features such as SMS, multimedia messaging and virtual private networking. MobiLink also offers video telephony and wireless local area network, or WLAN, management capabilities. MobiLink is engineered to work with all of our wireless modems.
The MiFi DLNA® Server operates on MiFi hotspots equipped with MiFi OS, such as the MiFi 2372. It enables you to access and play movies, music and photos anywhere, anytime, on any DLNA-capable device. The MiFi DLNA Server connects devices to provide easy instant access to your media.
M2M Products and Solutions
Our M2M product line was acquired in connection with the Enfora acquisition. These products operate primarily on 2G wireless technology. We are applying our expertise in 3G and 4G technologies to expand the Enfora product line, improve performance, and strengthen the competitive advantages of our solutions. M2M products and solutions accounted for 11%, 2%, and 0% of revenue in 2011, 2010, and 2009, respectively. M2M product lines consist of the following:
Spider® MT, SA & AT Integrated Solutions & Accessories bring together essential elements for monitoring and managing mobile and fixed assets, vehicle tracking and telemetric functions, along with workforce tracking and management. These solutions are based on the N4A distributed intelligent architecture, which improves the way enterprise clients manage their assets through a robust series of software management tools. We add value by developing solutions to meet the needs of specific customers with a particular emphasis on select vertical markets including: transportation & logistics, security & asset tracking, industrial automation & smart grid, and remote patient monitoring. These solutions can be scaled from a small fleet customer to company-wide enterprise deployments.
Enabler® III & HS Embedded Solutions are integrated into various products or equipment so that those assets may communicate with other computers. These “machine-to-machine” applications enable back-end IT systems to receive data from remote assets. A common example is vehicle modules that transmit data about location, engine conditions, and abnormal situations to critical decision support or monitoring systems.
3
Table of Contents
N4A™ Software and Design Services include our N4A Communications & Management Software, or CMS, royalties for intellectual property, and design services that we provide to other companies, primarily for asset management solutions. In 2011, we launched the N4A CMS 3.0 platform, a next-generation service delivery platform that eases the development, deployment, and operation of asset-management applications. N4A CMS 3.0 provides a standardized, scalable way to connect and manage remote assets and improve business operations. The platform supports on-premise server or cloud-based deployment and is the basis for delivery of a wide range of M2M services.
Customers
Our customer base is comprised of wireless operators, distributors, OEMs, and various companies in vertical markets. Our wireless-operator customers include AT&T, Bell Mobility, Sprint Nextel, Verizon Wireless, and Virgin Mobile. OEM customers include Dell and Hewlett-Packard. The acquisition of Enfora significantly diversified our customer base, adding approximately 120 customers, including Alarm.com, Linear Technology and Skypatrol.
We also have strategic technology, development and marketing relationships with several of our customers.
Our strong customer relationships provide us with the opportunity to expand our market reach and sales.
| • | Wireless Operators and Distributors. By working closely with our wireless operator and distributor customers, we are able to drive demand for our products by combining our expertise in wireless technologies with our customers’ sales and marketing reach over a global subscriber base. Our customers also provide us with important services, including field trial participation, technical support, wireless data marketing and access to additional indirect distribution channels. |
| • | OEMs. Our OEM customers integrate our products into devices that they manufacture and sell through their own direct sales forces and indirect distribution channels. Our products are capable of being integrated into a broad range of devices, including laptop PCs, tablets, notebooks, netbooks, and other devices that utilize wireless-data capabilities. We seek to build strong relationships with our OEM partners by working closely with them and providing radio frequency, or RF, design consulting, performance optimization, software integration and customization and application engineering support during the integration of our products. |
| • | M2M customers. We believe the M2M market provides substantial opportunities for growth. Machine-to-machine and smart-systems technologies are being integrated into a growing number of manufactured devices and machines—whether fixed, movable or fully mobile. We have strong positions in many of the high-growth segments of the M2M market. These include transportation, industrial automation, energy, security, and healthcare. We expect to work with these customers to develop customized solutions that incorporate our software and other intellectual property, providing significant product differentiation. |
Strategic Relationships
We continue to develop and maintain strategic relationships with wireless and computer industry leaders like Dell, QUALCOMM, Sprint Nextel, Verizon Wireless, Virgin Mobile, and Vodafone. Enfora has strategic relationships with Texas Instruments, Delta Mobile and major software vendors. Through strategic relationships, we have been able to increase market penetration by leveraging the resources and technology of our channel partners.
Sales and Marketing
We sell our Mobile Computing Products primarily to wireless operators either directly or through strategic relationships, as well as to OEM partners and distributors located worldwide. Most of our Mobile Computing Products are sold directly by our sales force, or to a lesser degree, through distributors.
4
Table of Contents
In order to maintain strong sales relationships, we provide co-marketing, trade show support, product training and demo units for merchandising. We are also engaged in a wide variety of activities, such as awareness and lead-generation programs, as well as product marketing. Other marketing initiatives include public relations, seminars and co-branding with partners.
We sell our M2M Products and Solutions primarily to enterprises in the following industries: transportation; energy and industrial automation; security and safety; and medical monitoring. We sell our M2M Products and Solutions through our own direct sales force and through distributors.
A significant portion of our revenue comes from a small number of customers.
A substantial majority of our revenue is derived from sales in the U.S. See Note 12 to our consolidated financial statements for a discussion of our revenue and asset concentrations by geographic location.
Our revenues from sales to Verizon Wireless, Sprint (including Virgin Mobile), and AT&T represented approximately 51%, 13%, and 8%, respectively, of our total revenues for the year ended December 31, 2011.
Product Research and Development
Our research and development efforts are focused on developing innovative new wireless products and improving the functionality, design and performance of our existing products. Our research and development expenses for the years ended December 31, 2011, 2010, and 2009 were $61.4 million, $48.9 million, and $44.9 million, respectively. The increase in 2011 was due primarily to the acquisition of Enfora. We did not recover any costs from vendor-funded development contracts during these years.
In both segments, we intend to continue to identify and respond to our customers’ needs by introducing new product designs with an emphasis on supporting cutting edge wireless data technology, ease-of-use, performance, weight, cost and power consumption.
We manage our products through a structured life-cycle process, from identifying initial customer requirements through development and commercial introduction to eventual phase-out. During product development, emphasis is placed on innovation, time-to-market, performance, meeting industry standards and customer-product specifications, ease of integration, cost reduction, manufacturability, quality and reliability.
Our product development efforts leverage our core expertise in the following key technology areas:
| • | Advanced Radio Frequency and Hardware Design. Advanced RF design is a key technology that determines the performance of wireless devices. We have specialized in 700/800/900/1800/1900/2100 and 2500 MHz designs for digital cellular, packet data, CDMA, HSPA, WiMAX, and LTE technology. Our expertise in RF, baseband, and firmware technology contributes to the performance, cost advantages and small size of our products. |
| • | Miniaturization and System Integration. Our expertise includes the integration of RF and baseband chipsets and printed circuit board, or PCB technologies. We will continue to augment our miniaturization technology, working to further reduce the size and cost of current and future products. |
| • | Software Development. We specialize in integrating and customizing 3G and 4G software to meet carrier and regulatory requirements. We supply end-to-end solutions to enable our customers to achieve a time-to-market advantage. This includes firmware that runs on a modem processor, drivers for various host operating systems, software development kits, or SDK, modem-manager software that controls modem operation, and server applications for over-the-air updates. |
| • | Embedded Operating System. We have developed an embedded operating system that runs applications on our mobile hotspot products and allows us to introduce innovative applications. |
5
Table of Contents
| • | M2M Solutions. We have developed customized asset-tracking systems and service-delivery platforms that utilize advanced radio-frequency technology and specialized software that interfaces with the information technology systems of our customers. |
Manufacturing and Operations
The hardware used in our solutions is produced by contract manufacturers. Their services include component procurement, assembly, testing, quality control and fulfillment. We currently have manufacturing agreements in place with the following companies:
Mobile Computing Products
| • | LG Innotek Co., Ltd, or “LG Innotek” |
| • | Inventec Appliances Corporation |
| • | Hon Hai Precision Industry Co., Ltd. |
M2M Products and Solutions
| • | Benchmark Electronics |
These contract manufacturers are located in China, Thailand, and Korea, and are able to produce our products using modern state-of-the-art equipment and facilities and relatively low-cost labor.
We outsource our manufacturing in an effort to:
| • | focus on our core competencies of design, development and marketing; |
| • | minimize our capital expenditures and lease obligations; |
| • | realize manufacturing economies of scale; |
| • | achieve production scalability by adjusting manufacturing volumes to meet changes in demand; and |
| • | access best-in-class component procurement and manufacturing resources. |
We believe that additional manufacturing efficiencies are realized due to our product architecture and our commitment to process design. Direct materials for our products consist of custom tooled parts such as printed circuit boards, molded plastic components and fabricated metal components, semi-custom parts such as batteries and cables, as well as industry-standard components such as Application Specific Integrated Circuits or ASICs, RF power amplifiers, flash memory, transistors, integrated circuits, piezo-electric filters, duplexers, inductors, resistors and capacitors. Many of the components used in our products are similar to those used in cellular telephone handsets, helping to reduce our component costs through the use of standard parts.
Our operations organization manages our relationships with the contract manufacturers as well as other key suppliers. Our operations team focuses on supply chain management, quality, cost optimization, customer order management and new product introduction.
Intellectual Property
Mobile Computing Products
Our wireless broadband access solutions rely on and benefit from our portfolio of intellectual property, including patents and trademarks. We currently own 37 United States patents, three of which are also registered in Canada. In addition, we currently have 39 patent applications pending. From time to time, we also seek to have our patents registered in selected foreign jurisdictions. The patents that we currently own expire at various times between 2012 and 2029.
6
Table of Contents
We have licensed software and other intellectual property for use in our products from third-parties, such as QUALCOMM. In the case of QUALCOMM, these licenses allow us to manufacture CDMA, UMTS, HSPA, EV-DO, and LTE-based wireless modems and to sell or distribute them worldwide. In connection with such sales, we pay royalties to QUALCOMM. The license from QUALCOMM does not have a specified term and may be terminated by us or by QUALCOMM for cause or upon the occurrence of other specified events. In addition, we may terminate the licenses for any reason upon 60 days prior written notice. We have also granted to QUALCOMM a nontransferable, worldwide, nonexclusive, fully-paid and royalty-free license to use, in connection with wireless communications applications, certain of our intellectual property that incorporates the technology licensed to us by QUALCOMM. This license allows QUALCOMM to make, use, sell or dispose of such products and the related components.
We also hold a number of trademarks including Expedite, MiFi, MiFi OS, MiFi Intelligent Mobile Hotspot, MobiLink, Ovation, Conversa, NovaSpeed, NovaCore and NovaDrive.
M2M Products and Solutions
Our M2M products and solutions incorporate patents, licensed technology, and trade secrets gained from our deep experience providing customized solutions to our customers.
We currently own three United States patents related to M2M products and solutions. In addition, we currently have 14 patent applications pending. From time to time, we also seek to have our patents registered in selected foreign jurisdictions. The patents that we currently own expire at various times between 2020 and 2021.
We have licensed software and other intellectual property for use in our products from various third-parties, such as Ericsson and Interdigital Communications Corporation. These licenses allow us to use the licensed intellectual property for the worldwide manufacture and sale of GSM-based wireless devices. We pay royalties in connection with such sales. The licenses do not have a specified term and may be terminated by either party for cause or upon the occurrence of other specified events.
We also hold a number of trademarks including Enfora, Spider, Enabling Information Anywhere, Enabler, eWide, and N4A.
Backlog
We do not believe that backlog is currently a meaningful indicator of our future business prospects due to the many variables, some of which are outside of our control, which could cause the actual volume of our product shipments to differ from those that comprise our backlog. Additionally, we sometimes have relatively short lead times between receipt of customer purchase orders and shipment of products.
Competition
The market for wireless broadband access and M2M solutions is rapidly evolving and highly competitive. It is likely to continue to be significantly affected by the evolution of new wireless technology standards, additional companies entering the market, new product introductions and the product pricing and other market activities of industry participants.
We believe the principal competitive factors impacting the market for our products are price, form factor, time-to-market, features and functionality, performance, quality, and brand. To maintain and improve our competitive position, we must continue to develop new products and solutions, expand our customer base, grow our distribution network, and leverage our strategic relationships and our investment in R&D.
7
Table of Contents
Our products compete with a variety of devices, including other wireless modems and mobile hotspots, wireless handsets, wireless handheld computing devices and M2M wireless solutions. Our current competitors include:
| • | wireless data modem and mobile hotspot providers, such as Huawei, ZTE, Sierra Wireless, PCD, Sony-Ericsson, LG Innotek and Samsung; |
| • | wireless handset and infrastructure manufacturers, such as Motorola, Nokia, Siemens and Sony-Ericsson; |
| • | wireless M2M solution providers, such as Sierra Wireless, Telit Wireless Solutions, Gemalto and Huawei; and |
| • | wireless chipset providers, such as QUALCOMM, Motorola and Ericsson. |
We believe that we have advantages over each of our primary competitors due in varying measure to the technical and engineering design of our products, the broad range of customized solutions that we offer, the ease-of-use of our products, our ability to adapt our products to specific customer needs and our competitive pricing. As the market for wireless data solutions expands, other entrants may seek to compete with us either directly or indirectly.
Employees
As of December 31, 2011, we had 488 employees. By segment, Mobile Computing Products had 379 employees, including corporate functions, and M2M Products and Solutions had 109 employees. By function, we had 260 in research and development, 105 in sales and marketing, 62 in operations, and 61 in general and administrative functions. We also use the services of consultants and temporary workers from time to time. Our employees are not represented by any collective bargaining unit and we consider our relationship with our employees to be good.
Website Access to SEC Filings
We maintain an Internet website at www.novatelwireless.com. The information contained on our website or that can be accessed through our website does not constitute a part of this report. We make available, free of charge through our Internet website, our annual reports on Form 10-K, quarterly reports on Form 10-Q, current reports on Form 8-K, and amendments to those reports filed or furnished pursuant to Section 13(a) or 15(d) of the Securities Exchange Act of 1934, as amended, or the Exchange Act, as soon as reasonably practicable after we electronically file or furnish this information to the Securities and Exchange Commission, or SEC.
8
Table of Contents
| Item 1A. | Risk Factors |
An investment in our common stock involves various risks. Before deciding to purchase, hold or sell our common stock, you should carefully consider the risks described below in addition to the other cautionary statements and risks described elsewhere in this report and in the documents incorporated by reference herein and therein. The risks and uncertainties described below are those that we currently deem to be material, and do not represent all of the risks that we face. Additional risks and uncertainties not presently known to us or that we currently do not consider material may in the future become material and impair our business operations. If any of the following risks actually occur, our business could be materially harmed, and our financial condition and results of operations could be materially and adversely affected. As a result, the trading price of our securities could decline, and you might lose all or part of your investment. You should also refer to the other information contained in this Form 10-K, including our financial statements and the related notes.
The market for wireless broadband data access products and services is rapidly evolving and highly competitive. We may be unable to compete effectively.
The market for wireless broadband data access products and services is rapidly evolving and highly competitive. We expect competition to continue to increase and intensify. Many of our competitors or potential competitors have significantly greater financial, technical, operational and marketing resources than we do. These competitors, for example, may be able to respond more rapidly or more effectively than we can to new or emerging technologies, changes in customer requirements, supplier related developments, or a shift in the business landscape. They also may devote greater or more effective resources than we do to the development, manufacture, promotion, sale, and post-sale support of their respective products and services.
Many of our current and potential competitors have more extensive customer bases and broader customer, supplier and other industry relationships that they can leverage to establish competitive dealings with many of our current and potential customers. Some of these companies also have more established and larger customer support organizations than we do. In addition, these companies may adopt more aggressive pricing policies or offer more attractive terms to customers than they currently do, or than we are able to do. They may bundle their competitive products with broader product offerings and may introduce new products and enhancements. Current and potential competitors might merge or otherwise establish cooperative relationships among themselves or with third parties to enhance their products or market position. In addition, at any time any given customer or supplier of ours could elect to enter our then existing line of business and thereafter compete with us, whether directly or indirectly. As a result, it is possible that new competitors or new or otherwise enhanced relationships among existing competitors may emerge and rapidly acquire significant market share to the detriment of our business.
Our products compete with a variety of devices, including other wireless modems and mobile hotspots, wireless handsets, wireless handheld computing devices and M2M wireless solutions. Our current competitors include:
| • | wireless data modem and mobile hotspot providers, such as Huawei, ZTE, Sierra Wireless, PCD, Sony-Ericsson, LG Innotek and Samsung; |
| • | wireless handset and infrastructure manufacturers, such as Motorola, Nokia, Siemens and Sony-Ericsson; |
| • | wireless M2M solution providers, such as Sierra Wireless, Telit Wireless Solutions, Gemalto and Huawei; and |
| • | wireless chipset providers, such as QUALCOMM, Motorola and Ericsson. |
We expect our competitors to continue to improve the features and performance of their current products and to introduce new products, services and technologies which, if successful, could reduce our sales and the market acceptance of our products, generate increased price competition and make our products obsolete. For our
9
Table of Contents
products to remain competitive, we must, among other things, continue to invest significant resources (financial, human and otherwise) in, among other things, research and development, sales and marketing, and customer support. We cannot be sure that we will have or will continue to have sufficient resources to make these investments or that we will be able to make the technological advances necessary for our products to remain competitive. Increased competition could result in price reductions, fewer or smaller customer orders, reduced product margins and loss of our market share. Our failure to compete successfully could seriously harm our business, financial condition and results of operations.
If we fail to develop and timely introduce new products successfully, we may lose key customers or product orders and our business could be harmed.
The development of new wireless data products requires technological innovation that can be difficult, lengthy and costly. In addition, wireless operators require that wireless data systems deployed on their networks comply with their own technical and product performance standards, which may differ from the standards our products are required to meet for other operators. This increases the complexity and might impact the timing of the product development and customer approval process. In addition, as we introduce new products or new versions of our existing products, our current customers may not require or desire the technological innovations of these products and may not purchase them or might purchase them in smaller quantities than we had expected.
Further, as part of our business, we may enter into contracts with some customers in which we would agree to develop products that we would sell to that customer. Our ability to generate future revenue and operating income under any such contracts would depend upon, among other factors, our ability to timely and profitably develop products that are suitable for manufacturing in a cost effective manner and that meet defined product design, technical and performance specifications.
If we are unable to successfully manage these risks or meet required delivery specifications or deadlines in connection with one or more of our key contracts, we may lose key customers or orders and our business could be harmed.
Any acquisitions we make could disrupt our business and harm our financial condition and results of operations.
As part of our business strategy, we review and intend to continue to review, acquisition opportunities that we believe would be advantageous or complementary to the development of our business. In November 2010, we completed our acquisition of Enfora. We may acquire additional businesses, assets, or technologies in the future. If we make any acquisitions, we could take any or all of the following actions, any one of which could adversely affect our business, financial condition, results of operations or share price:
| • | use a substantial portion of our available cash; |
| • | incur substantial debt, which may not be available to us on favorable terms and may adversely affect our liquidity; |
| • | issue equity or equity-based securities that would dilute existing stockholders’ percentage ownership; |
| • | assume contingent liabilities; and |
| • | take substantial charges in connection with acquired assets. |
Acquisitions, including the Enfora acquisition, also entail numerous other risks, including: difficulties in assimilating acquired operations, products, technologies and personnel; unanticipated costs; diversion of management’s attention from existing operations; adverse effects on existing business relationships with suppliers and customers; risks of entering markets in which we have limited or no prior experience; and potential loss of key employees from either our existing business or the acquired organization. Acquisitions may result in
10
Table of Contents
substantial accounting charges for restructuring and other expenses, amortization of purchased technology and intangible assets and stock-based compensation expense, any of which could materially adversely affect our operating results. We may not be able to realize the anticipated benefits of or successfully integrate with our existing business the businesses, products, technologies or personnel that we acquire, and our failure to do so could harm our business and operating results.
Weakness or deterioration in global economic conditions could have a material adverse effect on our results of operations and financial condition.
As a result of weak or deteriorating economic conditions globally, we could experience lower demand for our products, which could adversely impact our results of operations.
Additionally, there could be a number of related effects on our business resulting from weak economic conditions, including the insolvency of one or more of our parts suppliers resulting in product launch or product delivery delays, customer insolvencies resulting in that customer’s inability to order products from us or pay for already delivered product, an inability on the part of our customers to obtain credit to finance purchases of our products and reduced demand by the ultimate end-users of our products.
Although we continue to monitor market conditions, we cannot predict future market conditions or their impact on demand for our products.
Our failure to predict carrier and end user customer preferences among the many evolving wireless industry standards could hurt our ability to introduce and sell new products.
In our industry, it is critical to our success that we accurately anticipate evolving wireless technology standards and that our products comply with these standards in relevant respects. We are currently focused on engineering and manufacturing products that comply with several different wireless standards. Any failure of our products to comply with any one of these or future applicable standards could prevent or delay their introduction and require costly and time-consuming engineering changes. Additionally, if an insufficient number of wireless operators or subscribers adopt the standards to which we engineer our products, then sales of our new products designed to those standards could be materially harmed.
If we fail to develop and maintain strategic relationships, we may not be able to penetrate new markets.
A key element of our business strategy is to penetrate new markets by developing new products through strategic relationships with industry participants in wireless communications. We are currently investing, and plan to continue to invest, significant resources to develop these relationships. We believe that our success in penetrating new markets for our products will depend, in part, on our ability to develop and maintain these relationships and to cultivate additional or alternative relationships. There can be no assurance, however, that we will be able to develop additional strategic relationships, that existing relationships will survive and successfully achieve their purposes or that the companies with whom we have strategic relationships will not form competing arrangements with others or determine to compete unilaterally with us.
We expect to continue to depend upon only a small number of our customers for a substantial portion of our revenues. Our business could be negatively affected by an adverse change in our dealings with these customers.
A significant portion of our net revenues come from only a few customers. Our revenue could be materially adversely affected if we are unable to retain the level of business of any of our significant customers and if we are unable to offset this loss fully from alternative customers. We expect that a small number of customers will continue to account for a substantial portion of our revenue for the foreseeable future and any impairment of our relationship with, or the material financial impairment of, these customers could adversely affect our business.
11
Table of Contents
In addition, a majority of our current customers purchase our products pursuant to contracts that do not require them to purchase any specific minimum quantity of units other than the number of units ordered on an individual purchase order that might be issued to us from time to time. These customers have no contractual obligation to continue to purchase our products and if they do not continue to make purchases consistent with their historical purchase levels, our net revenue would decline if we are unable to increase sales from other existing or new customers.
In light of the limited number of leading wireless operators and OEMs that form our primary customer base, many of whom are already customers, it would be difficult to replace revenue resulting from the loss of any significant existing customer or from a material reduction in the volume of business we conduct with any significant existing customer. Consolidation among our customers may further concentrate our business to a more limited number of customers and expose us to increased risks relating to dependence on a limited number of customers, which dependence could adversely affect our operating results.
We have had to qualify, and are required to maintain our status, as a supplier for each of our customers. This is a lengthy process that involves the inspection and approval by each customer of our engineering, documentation, manufacturing and quality control procedures before that customer will place volume orders. Attempts to lessen the adverse effect of any loss of, or any material reduction in the volume of business we conduct with, any significant existing customer through the rapid addition of one or more new customers would be difficult because of these qualification requirements. Consequently, our business and operating results could be adversely affected by the loss of, or any material reduction in the volume of business we conduct with, any existing significant customer.
The sale of our products depends on the demand for broadband wireless access to enterprise networks and the internet.
The markets for broadband wireless access solutions are rapidly evolving, both technologically and competitively, and the successful sale of related products and services depends in part on the strength of the demand for wireless access to both enterprise networks and the Internet. At times, market demand for both wireless products and wireless access services for the transmission of data developed at a slower rate than we had anticipated and as a result our product sales did not generate sufficient revenue to cover our corresponding operating costs. The failure of these markets to continue to grow at the rate that we currently anticipate may adversely impact the growth in the demand for our products and our concomitant rate of growth, and as a result, our business, financial condition and results of operations may be harmed.
The marketability of our products may suffer if wireless telecommunications operators do not deliver acceptable wireless services.
The success of our business depends, in part, on the capacity, affordability, reliability and prevalence of wireless data networks provided by wireless telecommunications operators and on which our products operate. Currently, various wireless telecommunications operators, either individually or jointly with us, sell our products in connection with the sale of their wireless data services to their customers. Growth in demand for wireless data access may be limited if, for example, wireless telecommunications operators cease or materially curtail operations, fail to offer services that customers consider valuable at acceptable prices, fail to maintain sufficient capacity to meet demand for wireless data access, delay the expansion of their wireless networks and services, fail to offer and maintain reliable wireless network services or fail to market their services effectively.
In addition, our future growth depends on the successful deployment of next generation wireless data networks provided by third parties, including those networks for which we are currently developing products. If these next generation networks are not deployed or widely accepted, or if deployment is delayed, there will be no market for the products we are developing to operate on these networks. If any of these events occurs, or if for any other reason the demand for wireless data access fails to grow, sales of our products will decline or remain stagnant and our business could be harmed.
12
Table of Contents
If we do not properly manage the development of our business, we may experience significant strains on our management and operations and disruptions in our business.
Various risks arise if companies and industries quickly evolve. If our business or industry develops more quickly than our ability to respond, our ability to meet customer demand in a timely and efficient manner could be challenged. We may also experience development, certification or production delays as we seek to meet increased demand for our products or unanticipated product requirements. Our failure to properly manage the developments that we or our industry might experience could negatively impact our ability to execute on our operating plan then in effect and, accordingly, could have an adverse impact on our business, our cash flow and results of operations, and our reputation with our current or potential customers.
We currently rely on third parties to manufacture our products, which exposes us to a number of risks and uncertainties outside our control.
We currently outsource our manufacturing to LG Innotek, Inventec Appliances Corporation, Hon Hai Precision Industry Co., Ltd., and Benchmark Electronics. If one of these third-party manufacturers were to experience delays, disruptions, capacity constraints or quality control problems in its manufacturing operations, product shipments to our customers could be delayed or rejected by them or our customers could consequently elect to cancel the underlying product purchase order. These disruptions would negatively impact our revenues, competitive position and reputation. Further, if we are unable to manage successfully our relationship with a manufacturer, the quality and availability of our products may be harmed. None of our third-party manufacturers is obligated to supply us with a specific quantity of products, except as may be provided in a particular purchase order that we may submit to them and that has been accepted. Our third-party manufacturers could under some circumstances decline to accept new purchase orders from us or otherwise reduce their business with us. If a manufacturer stopped manufacturing our products for any reason or reduced manufacturing capacity, we may be unable to replace the lost manufacturing capacity on a timely and comparatively cost effective basis, which would adversely impact our operations. In addition, we generally do not enter into a long-term contracts with our manufacturers. As a result, we are subject to price increases due to the availability and price volatility in the marketplace of the components and materials needed to manufacture our products. If a third-party manufacturer were to negatively change the product pricing and other terms under which it agrees to manufacture for us and we are unable to locate a suitable alternative manufacturer, our manufacturing costs could significantly increase.
Because we outsource the manufacture of all of our products, the cost, quality and availability of third-party manufacturing operations are essential to the successful production and sale of our products. Our reliance on third-party manufacturers exposes us to a number of risks which are outside our control, including:
| • | unexpected increases in manufacturing costs; |
| • | interruptions in shipments if a third-party manufacturer is unable to complete production in a timely manner; |
| • | inability to control quality of finished products; |
| • | inability to control delivery schedules; |
| • | inability to control production levels and to meet minimum volume commitments to our customers; |
| • | inability to control manufacturing yield; |
| • | inability to maintain adequate manufacturing capacity; and |
| • | inability to secure adequate volumes of acceptable components at suitable prices or in a timely manner. |
Although we promote ethical business practices and our operations personnel periodically visit and monitor the operations of our manufacturers, we do not control the manufacturers or their labor practices. If our current manufacturers, or any other third-party manufacturer which we may use in the future, violate United States or
13
Table of Contents
foreign laws or regulations, we may be subjected to extra duties, significant monetary penalties, adverse publicity, the seizure and forfeiture of products that we are attempting to import or the loss of our import privileges. The effects of these factors could render the conduct of our business in a particular country undesirable or impractical and have a negative impact on our operating results.
We might forecast customer demand incorrectly and order the manufacture of excess or insufficient quantities of particular products.
We have historically placed purchase orders with our manufacturers at least three months prior to the scheduled delivery of the corresponding finished goods to our customer. In some instances, due to the length of component lead times, we might need to place manufacturing orders with our contract manufacturers solely on the basis of our receipt of a good-faith but non-binding customer forecast of the quantity and timing of the customer’s expected purchases from us. Accordingly, if the actual number and timing of delivery of units that a customer orders from us on the subsequently issued purchase order differs materially from the number of units in respect of which we contractually ordered our manufacturer to procure component parts, we might be unable to obtain adequate quantities of components in time to meet our customers’ binding delivery requirements or, alternatively, we might accumulate excess inventory that we are unable to timely use or resell, if at all. Our operating results and financial condition have been in the past and may in the future be materially adversely affected by our ability to manage our current or finished goods inventory levels and respond to short-term or unexpected shifts in customer demand as to quantities or our customer’s product delivery schedule.
We depend on sole source suppliers for some components used in our products. The availability and sale of those finished products would be harmed if any of these suppliers is not able to meet our demand and production schedule and alternative suitable components are not available on acceptable terms, if at all.
Our products contain a variety of components, some of which are procured from single suppliers. These components include both tooled parts and industry-standard parts, some of which are also used in cellular telephone handsets. From time to time, certain components used in our products have been in short supply worldwide or their anticipated commercial introduction has been delayed or their availability has been subsequently interrupted for reasons outside our control. For example, some of our product components are manufactured in Japan, which recently experienced a significant earthquake. Although to date, we have not received any reports of damage to our supplier facilities, some of these manufacturers experienced temporary suspension of production due to power outages. If there is a shortage or interruption in the availability to us of any such components, and we cannot timely obtain a commercially and technologically suitable substitute or make sufficient and timely design or other product modifications to permit the use of such a substitute component, we may not be able to timely deliver sufficient quantities of our products to satisfy our contractual obligations and particular revenue expectations. Moreover, even if we timely locate a substitute part (or locate the originally specified component from a parts broker) and its price materially exceeds the original cost of the component in our costed bill of materials, then our results of operations would be adversely affected.
We contract with a number of suppliers in Japan. As a result of the effects of the earthquake and tsunami that occurred in Japan, our Japanese suppliers may be unable to deliver sufficient quantities of components or may be unable to deliver components in a timely manner, which could have a material adverse affect on our results of operations.
We contract with a number of suppliers with operations in Thailand. Some of these suppliers have been unable to deliver sufficient quantities of components as a result of the effects of the major catastrophic flooding that began in July 2011 and still persist as of the date of this report. The Company’s M2M products are being impacted significantly by these component shortages. The shortages have limited the Company’s ability to deliver against sales opportunities, negatively impacting our results of operations.
14
Table of Contents
We are currently party to litigation that could be costly to defend and distracting to management.
As of the date of this report, a class action lawsuit has been filed on behalf of persons who allegedly purchased our common stock between February 27, 2007 and November 10, 2008. The lawsuit names us and certain of our current and former officers as defendants. The complaint alleges generally that we issued materially false and misleading statements during the relevant time period regarding the strength of our products and market share, our financial results and internal controls.
Also as of the date of this report, we have been named as a nominal defendant in a purported shareholder derivative lawsuit filed in California state court. The complaint also names as defendants certain of our current and former officers and directors. The complaint alleges claims for breach of fiduciary duties, violations of certain provisions of the California Corporations Code, unjust enrichment and gross mismanagement.
Additional litigation may be initiated against us based on the alleged false statements at issue in the pending litigation. We cannot predict the outcome of the existing lawsuits or the likelihood that further proceedings will be instituted against us. The cost of defending against these lawsuits or any future lawsuits may be high, and these legal proceedings may also result in the diversion of our management’s time and attention away from our business. In the event that there is an adverse ruling in any legal proceeding, we may be required to make payments to third parties that could harm our business or financial results.
Third parties may claim that our products, or components within our products, infringe on their intellectual property rights. These claims may result in substantial costs, diversion of resources and management attention, harm to our reputation or interference with our current or prospective customer or supplier relations.
Third parties have in the past and may claim in the future that we, or our customers or suppliers, have violated their intellectual property rights. Defending an infringement or misappropriation claim, for example, regardless of the merits or success of the claim, could result in our incurring substantial legal and other costs. These claims could also divert our engineering and other human resources and management attention and cause harm to our reputation. These claims can be difficult and costly to assess and defend. A successful infringement claim related to our products could result in, among other things, our becoming liable for damages and litigation costs or unexpected and costly engineering changes to affected products.
In addition, any finding that our products infringe (or in some instances, our customer’s reasonable conclusion that a bona fide infringement claim is likely to be made with respect to such products) could have other negative consequences. Those consequences could include prohibiting us from further use of the intellectual property, causing us to have to modify our product design, if possible, so it does not infringe, or causing us to have to license the intellectual property at issue, incurring licensing fees, some of which could be retroactive. Upon a finding of infringement, we or one of our suppliers may also have to develop a non-infringing alternative, which if available could be costly, and delay or prevent sales of affected products.
A number of putative patent infringement claims have been filed by various plaintiffs in a number of U.S. District Courts against us and/or numerous third parties, some of whom are our customers. These cases generally allege that the defendants’ use, sale and importation of specified products and/or processes constitutes infringement of certain U.S. patents allegedly owned or exclusively licensed by each plaintiff. Under certain circumstances, we may have an obligation to indemnify and/or defend our customers against these lawsuits.
Our business depends on our continued ability to license necessary third-party technology, which we may not be able to do on commercially competitive terms, if at all.
We license technology from third parties for the development of our products. We have licensed from third parties, such as QUALCOMM, software, patents and other intellectual property for use in our products and from time to time we may elect or be required to license additional intellectual property. There can be no assurance
15
Table of Contents
that we will be able to maintain our third-party licenses or that these licenses or the technologies that are the subject of these licenses will not be the subject of dispute or litigation, or that additional third-party licenses will be available to us on commercially reasonable terms, if at all. The inability to maintain or obtain third-party licenses required for our products or to develop new products and product enhancements could require us to seek to obtain substitute technology of lower quality or performance standards, if such exists, or at greater cost, which could seriously harm our competitive position, revenue and prospects.
We are subject to the risks of doing business internationally.
In addition to our manufacturing activities in Asia, a significant portion of our research and development staff is located in Canada. We also sell our products outside the U.S. These international business activities expose the Company to additional business risks, including:
| • | difficulty in managing sales, research and development operations and post-sales logistics and support across these continents; |
| • | changes in a specific country’s or region’s political or economic conditions, particularly in emerging markets, and changes in diplomatic and trade relationships; |
| • | less effective protection of intellectual property and general exposure to different legal processes, standards and expectations; |
| • | trade protection measures and import or export licensing requirements; |
| • | potentially negative consequences from changes in tax laws; |
| • | increased expenses associated with customizing products for different countries; |
| • | unexpected changes in regulatory requirements resulting in unanticipated costs and delays; |
| • | longer collection cycles and difficulties in collecting accounts receivable; |
| • | longer sales cycles; |
| • | international terrorism; |
| • | loss or damage to products in transit; |
| • | international dock strikes or other transportation delays; and |
| • | court ordered injunctions in a given jurisdiction in connection with alleged intellectual property rights infringement by our products or components contained with our products which might prohibit the importation, sale or offer for sale of our products in the jurisdiction subject to such injunction. |
Any disruption in our ability to obtain products from our foreign manufacturers or in our ability to conduct international operations and sales could have a material adverse effect on our business, financial condition and results of operations.
Our international business activities expose the Company to fluctuations in exchange rates between the United States dollar and foreign currencies which may materially affect our operating results.
A portion of our revenues are generated from sales agreements denominated in foreign currencies, and we expect to enter into additional such agreements as we expand our international customer base. Additionally, a significant portion of our research and development staff is located in Canada and paid in Canadian dollars. As a result, we are exposed to changes in foreign currency exchange rates. We attempt to manage this risk, in part, by minimizing the effects of volatility on cash flows by identifying forecasted transactions exposed to these risks and using foreign exchange forward contracts. Since there is a high correlation between the hedging instruments and the underlying exposures, the gains and losses on these underlying exposures are generally offset by reciprocal changes in the value of the hedging instruments. We use derivative financial instruments as risk
16
Table of Contents
management tools and not for trading or speculative purposes. Nevertheless, there can be no assurance that we will not incur foreign currency losses or that foreign exchange forward contracts we may enter into to reduce the risk of such losses will be successful.
Our products, including our proprietary or third party software contained in our products, may contain errors or defects, which could prevent or decrease their market acceptance and lead to unanticipated costs or other adverse business consequences.
Our products are technologically complex and must meet stringent industry, regulatory and customer requirements. We must develop our hardware and software products quickly to keep pace with the rapidly changing and technologically advanced wireless communications market. Products as sophisticated as ours may contain undetected errors or defects, especially when first introduced or when new models or versions are released. Our products may not be free from errors or defects at the time commercial shipments have begun, which could result in the rejection of our products, the loss of an existing or potential customer or the failure to obtain one, damage to our reputation, lost revenue, diverted development resources, increased customer service and support costs, unanticipated warranty claims, and the payment of monetary damages to our customers.
Our quarterly operating results may vary significantly from quarter to quarter and may cause our stock price to fluctuate.
Our future quarterly operating results may fluctuate significantly and may fall short of or exceed the expectations of securities analysts, investors or management. If this occurs, the market price of our stock could fluctuate, in some cases materially. The following factors may cause fluctuations in our operating results:
| • | Decreases in revenue or increases in operating expenses. We budget our operating expenses based on anticipated sales, and a significant portion of our sales and marketing, research and development and general and administrative costs are fixed, at least in the short term. If revenue decreases, due to pricing pressures or otherwise, or does not increase as planned and we are unable to reduce our operating costs quickly and sufficiently, our operating results could be materially adversely affected. |
| • | Product mix. The product mix of our sales affects profit margins in any given quarter. As our business evolves and the revenue from the product mix of our sales varies from quarter to quarter, our operating results will likely fluctuate in ways that might not be directly proportionate to the fluctuation in revenue. |
| • | New product introductions. As we introduce new products, the timing of these introductions within any given quarter will affect our quarterly operating results. We may have difficulty predicting the timing of new product introductions and the market acceptance of these new products. If products and services are introduced earlier or later than anticipated, or if market acceptance is unexpectedly high or low, our quarterly operating results may fluctuate unexpectedly. |
| • | Lengthy sales cycle. The length of time between the date of initial contact with a potential customer and the execution of and product delivery under a contract may take several months or longer, and is subject to delays or interruptions over which we have little or no control. The sale of our products is subject to delays from, among other things, our customers’ budgeting, product testing and vendor approval mechanics, and competitive evaluation processes that typically accompany significant information technology purchasing decisions. As a result, our ability to anticipate the timing and volume of sales to specific customers is limited, and the delay or failure to complete one or more large transactions could cause our operating results to vary significantly from quarter to quarter. |
| • | Foreign currency. We are exposed to market risk from changes in foreign currency exchange rates. In particular, fluctuations in the Euro currency may have a significant impact on our future operating results and gross margins. Our attempts to minimize the effects of volatility in foreign currencies on cash flows may not be successful. |
17
Table of Contents
Due to these and other factors, our results of operations may fluctuate substantially in the future and quarter-to-quarter comparisons may not be reliable indicators of future operating or share price performance.
We may not be able to maintain and expand our business if we are not able to hire, retain and manage additional qualified personnel.
Our success in the future depends in part on the continued contribution of our executive, technical, engineering, sales, marketing, operations and administrative personnel. The success of our acquisitions, such as Enfora, depends in part on our retention and integration of key personnel from the acquired company or business. Recruiting and retaining skilled personnel in the wireless communications industry, including software and hardware engineers, is highly competitive.
Although we may enter into employment agreements with members of our senior management and other key personnel in the future, currently only Peter Leparulo, the Company’s Chairman and CEO, is a party to an employment agreement. If we are not able to attract or retain qualified personnel in the future, or if we experience delays in hiring required personnel, particularly qualified engineers, we may not be able to maintain and expand our business.
Any changes to existing accounting pronouncements or taxation rules or practices may cause adverse fluctuations in our reported results of operations or affect how we conduct our business.
A change in accounting pronouncements or taxation rules or practices can have a significant effect on our reported results and may affect our reporting of transactions completed before the change is effective. New accounting pronouncements, taxation rules and varying interpretations of accounting pronouncements or taxation rules have occurred in the past and may occur in the future. The change to existing rules, future changes, if any, or the need for us to modify a current tax position may adversely affect our reported financial results or the way we conduct our business.
We may not be able to develop products that comply with applicable government regulations.
Our products must comply with government regulations. For example, in the United States, the Federal Communications Commission, or FCC, regulates many aspects of communications devices, including radiation of electromagnetic energy, biological safety and rules for devices to be connected to telephone networks. In addition to the federal government, some states have adopted regulations applicable to our products. Radio frequency devices, which include our modems, must be approved by obtaining equipment authorization from the FCC prior to being offered for sale. Regulatory requirements in Canada, Europe, Asia and other jurisdictions must also be met. Additionally, we cannot anticipate the effect that changes in domestic or foreign government regulations may have on our ability to develop and sell products in the future. Failure to comply with existing or evolving government regulations or to obtain timely regulatory approvals or certificates for our products could materially adversely affect our business, financial condition and results of operations or cash flows.
Failure or circumvention of our controls and procedures could seriously harm our business.
Any system of control and procedures, however well designed and operated, is based in part on certain assumptions and can provide only reasonable, and not absolute, assurances that the objectives of the controls and procedures are met. Acquired companies or businesses are likely to have different standards, controls, contracts, procedures and policies, making it more difficult to implement and harmonize company-wide financial, accounting, billing, information and other systems. Acquisitions of privately held companies, such as Enfora, and/or non-US companies are particularly challenging because their prior practices in these areas may not meet the requirements of the Sarbanes-Oxley Act and public accounting standards. The failure or circumvention of our controls, policies and procedures could have a material adverse effect on our business, results of operations and financial position.
18
Table of Contents
System security risks, data protection breaches, cyber-attacks and systems integration issues could disrupt our internal operations or information technology services provided to customers, and any such disruption could reduce our expected revenue, increase our expenses, damage our reputation and adversely affect our stock price.
Experienced computer programmers and hackers may be able to penetrate our network security and misappropriate or compromise our confidential information or that of third parties, create system disruptions or cause shutdowns. Computer programmers and hackers also may be able to develop and deploy viruses, worms, and other malicious software programs that attack our products or otherwise exploit any security vulnerabilities of our products. In addition, sophisticated hardware and software and applications that we produce or procure from third parties may contain defects in design or manufacture, including “bugs” and other problems that could unexpectedly interfere with the operation of our or our customers’ systems. The costs to us to eliminate or alleviate cyber or other security problems, bugs, viruses, worms, malicious software programs and security vulnerabilities could be significant, and our efforts to address these problems may not be successful and could result in interruptions, delays, cessation of service and loss of existing or potential customers that may impede our sales, manufacturing, distribution or other critical functions.
We manage and store various proprietary information and sensitive or confidential data relating to our business. Breaches of our security measures or the accidental loss, inadvertent disclosure or unapproved dissemination of proprietary information or sensitive or confidential data about us or our clients, including the potential loss or disclosure of such information or data as a result of fraud, trickery or other forms of deception, could expose us or our customers affected to a risk of loss or misuse of this information, result in litigation and potential liability for us, damage our brand and reputation or otherwise harm our business. In addition, the cost and operational consequences of implementing further data protection measures could be significant.
Portions of our IT infrastructure also may experience interruptions, delays or cessations of service or produce errors in connection with systems integration or migration work that takes place from time to time. We may not be successful in implementing new systems and transitioning data, which could cause business disruptions and be more expensive, time consuming, disruptive and resource-intensive. Such disruptions could adversely impact our ability to fulfill orders and interrupt other processes. Delayed sales, lower margins or lost customers resulting from these disruptions have adversely affected in the past, and in the future could adversely affect, our financial results, stock price and reputation.
We are exposed to fluctuations in the market values of our portfolio investments and in interest rates.
At December 31, 2011, we had $88.8 million in cash, cash equivalents and marketable securities. Substantially all of our marketable securities are invested in fixed income securities.
Investments in fixed-rate instruments carry a degree of interest rate risk. The market value of fixed-rate securities may be adversely impacted due to an increase in interest rates, while floating rate securities may produce less income than expected if interest rates decline. Due in part to these, factors our future investment market values and income may fall short of expectations due to changes in interest rates or if the decline in fair value of our publicly traded debt instruments is judged to be other-than-temporary.
We may also suffer losses in principal if we are forced to sell securities that decline in market value due to changes in interest rates or if declines in value are determined to be other-than-temporary.
| Item 1B. | Unresolved Staff Comments |
None
19
Table of Contents
| Item 2. | Properties |
Our principal executive offices are located in San Diego, California where we lease approximately 96,000 square feet under an arrangement that expires in December 2016. In connection with our acquisition of Enfora, Inc., we lease approximately 42,000 square feet in Richardson, Texas under a lease arrangement that expires in December 2014. In Calgary, Canada, we lease approximately 24,000 square feet for certain aspects of our research and development organization under a lease that expires in September 2012. In Basingstoke, United Kingdom, we lease approximately 4,600 square feet for our European staff under a lease agreement that expires in November 2013. In Shanghai, China, we lease approximately 1,200 square meters for our Chinese staff under a lease agreement that expires in April 2015. We also lease space in various geographic locations abroad primarily for sales and support personnel or for temporary facilities. We believe that our existing facilities are adequate to meet our current needs and that we can renew our existing leases or obtain alternative space on terms that would not have a material impact on our financial condition.
| Item 3. | Legal Proceedings |
On September 15, 2008 and September 18, 2008, two putative securities class action lawsuits were filed in the United States District Court for the Southern District of California on behalf of persons who allegedly purchased our stock between February 5, 2007 and August 19, 2008. On December 11, 2008, these lawsuits were consolidated into a single action entitled Backe v. Novatel Wireless, Inc., et al., Case No. 08-CV-01689-H (RBB) (Consolidated with Case No. 08-CV-01714-H (RBB)) (U.S.D.C., S.D. Cal.). In May 2010, the district court re-captioned the case In re Novatel Wireless Securities Litigation. The plaintiffs filed the consolidated complaint on behalf of persons who allegedly purchased our stock between February 27, 2007 and November 10, 2008. The consolidated complaint names the Company and certain of our current and former officers as defendants. The consolidated complaint alleges generally that we issued materially false and misleading statements during the relevant time period regarding the strength of our products and market share, our financial results and our internal controls. The plaintiffs are seeking an unspecified amount of damages and costs. The court has denied defendants’ motions to dismiss. In May 2010, the court entered an order granting the plaintiffs’ motion for class certification and certified a class of purchasers of our common stock between February 27, 2007 and September 15, 2008. On February 14, 2011, following extensive discovery, we filed a motion for summary judgment on all of plaintiffs’ claims. A trial date was set for May 10, 2011. On March 15, 2011, the case was reassigned to a new district judge, the Honorable Anthony J. Battaglia. Following the reassignment, the court vacated the trial date pending the court’s consideration of dispositive motions. Oral argument on the motion for summary judgment was heard by the court on June 17, 2011. On November 23, 2011, the court issued an order granting in part and denying in part the motion for summary judgment. A new trial date has not yet been set. The Company intends to defend this litigation vigorously.
On October 8, 2008, a purported shareholder, Jerry Rosenbaum, filed a derivative action in the Superior Court for the State of California, County of San Diego, against the Company, as nominal defendant, and certain of our current and former officers and directors, as defendants. Two other purported shareholders, Mark Campos and Chris Arnsdorf, separately filed substantially similar lawsuits in the same court on October 20, 2008 and November 5, 2008, respectively. On October 16, 2009, the plaintiffs filed a consolidated complaint. The consolidated complaint, Case No. 37-2008-00093576-CU-NP-CTL, alleges claims for breaches of fiduciary duties, violations of certain provisions of the California Corporations Code, unjust enrichment, and gross mismanagement. In February 2010, the court granted the defendants’ motion to stay the action pending the resolution of the federal securities class action described above. In July 2010, the parties executed a memorandum of understanding setting forth the terms to be included in a contemplated settlement. Any settlement would be subject to court approval. The memorandum of understanding does not contemplate any restitution from the defendants. Following execution of the memorandum of understanding, plaintiffs conducted certain confirmatory discovery and sought to negotiate a fee award as part of the terms to be included in a stipulation of settlement. Plaintiffs have since purported to terminate the memorandum of understanding. On January 28, 2011, the court held an informal status conference, at which plaintiffs requested that the court lift the
20
Table of Contents
stay of the action. The court declined plaintiffs’ request. Following certain additional confirmatory discovery and negotiations, on March 2, 2012, the parties executed a Stipulation of Settlement, which settlement will be submitted to the court for approval. The settlement, if approved, would require the Company to maintain and/or implement certain corporate governance measures and would provide for the payment of fees and expenses to the plaintiffs’ counsel of an amount not to exceed $900,000, $500,000 of which is expected to be paid out of insurance proceeds and $400,000 to be paid by the Company.
On September 24, 2010, NovAtel, Inc., a Canadian company (“NovAtel Canada”) filed a trademark infringement lawsuit entitled NovAtel, Inc. v. Novatel Wireless Technologies, Ltd., et al, Action No. 1001-14265 in the Court of Queens Bench of Alberta Canada, Judicial District of Calgary. The Statement of Claim alleges that Novatel Wireless Technologies, Ltd., Novatel Wireless Solutions, Inc. and Novatel Wireless, Inc., or collectively, the Company, are infringing NovAtel Canada’s purported rights in the “Novatel” trademark in breach of a settlement agreement between NovAtel Canada and the Company. The Company intends to defend this litigation vigorously.
| Item 4. | Mine Safety Disclosures |
None.
21
Table of Contents
PART II
| Item 5. | Market for Registrant’s Common Equity, Related Stockholder Matters and Issuer Purchases of Equity Securities |
Common Stock Data
Shares of our common stock are quoted and traded on The Nasdaq Global Select Market under the symbol “NVTL.” The following table sets forth, for the periods indicated, the high and low sales prices of our common stock as reported by The Nasdaq Global Select Market.
| High ($) | Low ($) | |||||||
| 2011 |
||||||||
| First quarter |
10.20 | 5.00 | ||||||
| Second quarter |
6.29 | 4.80 | ||||||
| Third quarter |
5.74 | 2.97 | ||||||
| Fourth quarter |
4.42 | 2.51 | ||||||
| 2010 |
||||||||
| First quarter |
8.86 | 6.38 | ||||||
| Second quarter |
7.32 | 5.56 | ||||||
| Third quarter |
7.95 | 5.46 | ||||||
| Fourth quarter |
11.53 | 7.96 | ||||||
Number of Stockholders of Record
Our outstanding capital stock consists of a single class of common stock. As of February 29, 2012, there were approximately 52 holders of record of our common stock. Because many of the shares of our common stock are held by brokers and other institutions on behalf of stockholders, we are unable to estimate the total number of stockholders represented by these record holders.
Dividends
We have never declared or paid cash dividends on any shares of our capital stock. We currently intend to retain all available funds for use in the operation and development of our business and, therefore, do not anticipate paying any cash dividends in the foreseeable future. Any future determination relating to our dividend policy will be made at the discretion of our board of directors and will depend on a number of factors, including future earnings, capital requirements, financial condition and future prospects and other factors the board of directors may deem relevant.
Performance Graph
The following graph compares the cumulative total stockholder return on the Company’s common stock between December 31, 2006 and December 31, 2011 with the cumulative total return of (i) the Nasdaq Stock Market (U.S.) Index or the Nasdaq Composite Index, and (ii) the Nasdaq Telecommunications Index, or the Nasdaq Telecom Index, over the same period. This graph assumes the investment of $100.00 on December 31, 2006 in the common stock of the Company, the Nasdaq Composite Index and the Nasdaq Telecom Index and assumes the reinvestment of any dividends. The stockholder return shown on the graph below should not be considered indicative of future stockholder returns and the Company will not make or endorse any predictions as to future stockholder returns.
22
Table of Contents
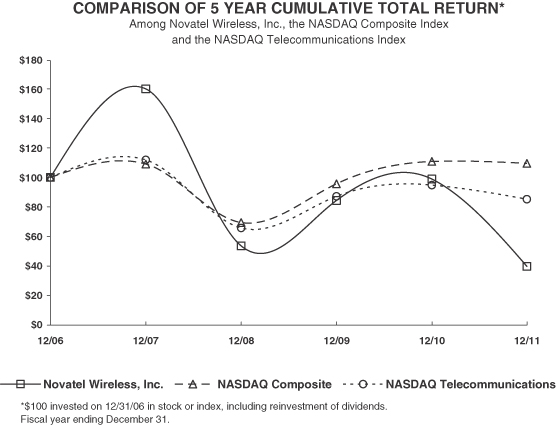
| Cumulative Total Return | ||||||||||||||||||||||||
| 12/06 | 12/07 | 12/08 | 12/09 | 12/10 | 12/11 | |||||||||||||||||||
| Novatel Wireless, Inc. |
100.00 | 167.53 | 47.98 | 82.42 | 98.76 | 32.37 | ||||||||||||||||||
| NASDAQ Composite |
100.00 | 110.26 | 65.65 | 95.19 | 112.10 | 110.81 | ||||||||||||||||||
| NASDAQ Telecommunications |
100.00 | 113.32 | 61.52 | 85.61 | 94.28 | 83.51 | ||||||||||||||||||
23
Table of Contents
| Item 6. | Selected Financial Data |
The following selected financial data should be read in conjunction with our consolidated financial statements and the related notes and “Management’s Discussion and Analysis of Financial Condition and Results of Operations” appearing elsewhere in this report. The selected consolidated statements of operations data presented below for each of the years ended December 31, 2011, 2010, and 2009, and the consolidated balance sheet data at December 31, 2011 and 2010 are derived from our consolidated financial statements included elsewhere in this report. The selected consolidated statements of operations data for the years ended December 31, 2008 and 2007 and consolidated balance sheet data at December 31, 2009, 2008, and 2007 are derived from the audited consolidated financial statements not included in this report.
| Year Ended December 31, | ||||||||||||||||||||
| 2011 | 2010 | 2009 | 2008 | 2007 | ||||||||||||||||
| (in thousands, except per share data) | ||||||||||||||||||||
| Consolidated Statements of Operations Data: |
||||||||||||||||||||
| Net revenues |
$ | 402,862 | $ | 338,942 | $ | 337,422 | $ | 320,973 | $ | 429,903 | ||||||||||
| Cost of net revenues |
318,270 | 272,648 | 249,764 | 252,231 | 299,062 | |||||||||||||||
|
|
|
|
|
|
|
|
|
|
|
|||||||||||
| Gross profit |
84,592 | 66,294 | 87,658 | 68,742 | 130,841 | |||||||||||||||
|
|
|
|
|
|
|
|
|
|
|
|||||||||||
| Operating costs and expenses: |
||||||||||||||||||||
| Research and development |
61,392 | 48,906 | 44,892 | 34,740 | 37,558 | |||||||||||||||
| Sales and marketing |
29,830 | 20,978 | 19,857 | 18,195 | 20,937 | |||||||||||||||
| General and administrative |
21,600 | 21,233 | 20,159 | 21,550 | 18,899 | |||||||||||||||
| Amortization of acquired intangibles |
2,220 | 179 | — | — | — | |||||||||||||||
| Goodwill impairment |
3,277 | — | — | — | — | |||||||||||||||
|
|
|
|
|
|
|
|
|
|
|
|||||||||||
| Total operating costs and expenses |
118,319 | 91,296 | 84,908 | 74,485 | 77,394 | |||||||||||||||
|
|
|
|
|
|
|
|
|
|
|
|||||||||||
| Operating income (loss) |
(33,727 | ) | (25,002 | ) | 2,750 | (5,743 | ) | 53,447 | ||||||||||||
| Interest and other income (expense) |
(668 | ) | (555 | ) | 1,689 | 3,553 | 6,071 | |||||||||||||
|
|
|
|
|
|
|
|
|
|
|
|||||||||||
| Income (loss) before income taxes |
(34,395 | ) | (25,557 | ) | 4,439 | (2,190 | ) | 59,518 | ||||||||||||
| Income tax expense (benefit) |
(9,503 | ) | 7,893 | 527 | (947 | ) | 20,756 | |||||||||||||
|
|
|
|
|
|
|
|
|
|
|
|||||||||||
| Net income (loss) |
$ | (24,892 | ) | $ | (33,450 | ) | $ | 3,912 | $ | (1,243 | ) | $ | 38,762 | |||||||
|
|
|
|
|
|
|
|
|
|
|
|||||||||||
| Net income (loss) per common share: |
||||||||||||||||||||
| Basic |
$ | (0.78 | ) | $ | (1.06 | ) | $ | 0.13 | $ | (0.04 | ) | $ | 1.23 | |||||||
|
|
|
|
|
|
|
|
|
|
|
|||||||||||
| Diluted |
$ | (0.78 | ) | $ | (1.06 | ) | $ | 0.13 | $ | (0.04 | ) | $ | 1.21 | |||||||
|
|
|
|
|
|
|
|
|
|
|
|||||||||||
| Weighted average shares outstanding: |
||||||||||||||||||||
| Basic |
32,043 | 31,494 | 30,648 | 31,159 | 31,389 | |||||||||||||||
|
|
|
|
|
|
|
|
|
|
|
|||||||||||
| Diluted |
32,043 | 31,494 | 31,224 | 31,159 | 32,007 | |||||||||||||||
|
|
|
|
|
|
|
|
|
|
|
|||||||||||
| December 31, | ||||||||||||||||||||
| 2011 | 2010 | 2009 | 2008 | 2007 | ||||||||||||||||
| (in thousands) | ||||||||||||||||||||
| Consolidated Balance Sheet Data: |
||||||||||||||||||||
| Cash and cash equivalents and marketable securities |
$ | 88,831 | $ | 97,826 | $ | 176,044 | $ | 143,231 | $ | 153,012 | ||||||||||
| Working capital |
81,113 | 87,174 | 149,468 | 173,153 | 198,951 | |||||||||||||||
| Total assets |
249,179 | 302,108 | 277,394 | 257,478 | 294,889 | |||||||||||||||
| Stockholders’ equity |
166,025 | 185,403 | 211,155 | 197,962 | 217,745 | |||||||||||||||
| Long-term liabilities |
4,080 | 12,886 | 15,543 | 15,663 | 15,566 | |||||||||||||||
24
Table of Contents
| Item 7. | Management’s Discussion and Analysis of Financial Condition and Results of Operations |
The following discussion of our consolidated financial condition and results of operations should be read in conjunction with our consolidated financial statements and related notes included elsewhere in this report. This report contains certain forward-looking statements relating to future events or our future financial performance. These statements are subject to risks and uncertainties which could cause actual results to differ materially from those discussed in this report. You are cautioned not to place undue reliance on this information which speaks only as of the date of this report. We are not obligated to update this information, whether as a result of new information, future events or otherwise, except to the extent we are required to by law. For a discussion of the important risks related to our business and future operating performance, see the discussion under the caption “Item 1A. Risk Factors” and under the caption “Factors Which May Influence Future Results of Operations” below. In light of these risks, uncertainties and assumptions, the forward-looking events discussed in this report might not occur.
Overview and Background
We are a provider of intelligent wireless solutions for the worldwide mobile communications market. Our broad range of products principally includes intelligent mobile hotspots, USB modems, embedded PCI and wireless PC-card modems, and communications and applications software. In addition, our Enfora division provides asset-management solutions utilizing intelligent platforms, customized service-delivery software, and machine-to-machine, or M2M, communications devices.
Our products currently operate on every major cellular wireless technology platform. Our mobile hotspots, embedded modules, and modems provide subscribers with secure and convenient high-speed access to corporate, public and personal information through the Internet and enterprise networks. Our M2M products enable devices to communicate with each other and with server- or cloud-based application infrastructure.
Our mobile-hotspot and modem customer base is comprised of wireless operators, including AT&T, Bell Mobility, Sprint Nextel, Verizon Wireless, and Virgin Mobile; laptop PC and other original equipment manufacturers, or OEMs, including Dell and Hewlett-Packard; as well as distributors and various companies in other vertical markets. Our M2M customer base is comprised of transportation companies, industrial companies, manufacturers of medical devices and geographical-location devices and providers of security systems. We have strategic relationships with several of these customers for technology development and marketing.
We sell our wireless broadband solutions primarily to wireless operators either directly or through strategic relationships, as well as to OEM partners and distributors located worldwide. Most of our mobile-computing product sales to wireless operators and OEM partners are sold directly by our sales force, or to a lesser degree, through distributors. We sell our M2M solutions primarily to enterprises in the following industries: transportation; energy and industrial automation; security and safety; and medical monitoring. We sell our M2M solutions through our direct sales force and through distributors.
We intend to continue to identify and respond to our customers’ needs by introducing new product designs with an emphasis on supporting cutting edge wide area network, or WAN, technology, ease-of-use, performance, size, weight, cost and power consumption. We manage our products through a structured life cycle process, from identifying initial customer requirements through development and commercial introduction to eventual phase-out. During product development, emphasis is placed on innovation, time-to-market, performance, meeting industry standards and customer product specifications, ease of integration, cost reduction, manufacturability, quality and reliability.
The hardware used in our solutions is produced by contract manufacturers. Their services include component procurement, assembly, testing, quality control, and fulfillment. We have agreements with LG Innotek; Inventec Appliances Corporation, or IAC; Hon Hai Precision Industry co., LTD; and Benchmark Electronics for the outsourced manufacturing of our products. Under our manufacturing agreements, contract
25
Table of Contents
manufacturers provide us with services including component procurement, product manufacturing, final assembly, testing, quality control, and fulfillment. In addition, we have an agreement with Mobiltron for certain distribution, fulfillment and repair services related to our business in Europe, the Middle East and Africa, or EMEA.
Factors Which May Influence Future Results of Operations
Net Revenues. We believe that our future net revenues will be influenced largely by the speed and breadth of the demand for wireless access to data through the use of next generation networks including demand for 3G and 4G products, 3G and 4G data access services, particularly in North America, Europe and Asia; customer acceptance for our new products that address these markets, including our MiFi line of Intelligent Mobile Hotspots; and our ability to meet customer demand. Factors that could potentially affect customer demand for our products include the following:
| • | economic environment and related market conditions; |
| • | increased competition from other wireless data modem suppliers as well as suppliers of emerging devices that contain a wireless data access feature; |
| • | demand for broadband access services and networks; |
| • | rate of change to new products; |
| • | timing of deployment of 4G networks by wireless operators; |
| • | decreased demand for EV-DO and HSPA products; and |
| • | changes in technologies. |
We anticipate introducing additional products during the next twelve months, including 4G broadband-access products, M2M solutions and software applications and platforms. We continue to develop and maintain strategic relationships with wireless and computing industry leaders like Dell, QUALCOMM, Sprint Nextel, Verizon Wireless, Virgin Mobile, Vodafone, Telefonica, Texas Instruments, Delta Mobile and major software vendors. Through strategic relationships, we have been able to increase market penetration by leveraging the resources of our channel partners, including their access to distribution resources, increased sales opportunities and market opportunities.
As a result of the extremely competitive market for wireless devices, we have experienced significant downward pressure on the average selling price of our products. This pressure has the potential to materially adversely affect our results of operations and financial condition in future periods and we cannot predict the magnitude or timing of future reductions in the average selling price of our products.
Cost of Net Revenues. All costs associated with our contract manufacturers, as well as distribution, fulfillment and repair services are included in our cost of net revenues. Cost of net revenues also includes warranty costs, amortization of intangible assets, royalties, operations group expenses, costs associated with the Company’s cancellation of purchase orders, costs related to outside services and costs related to inventory adjustments, including write downs for excess and obsolete inventory. Inventory adjustments are impacted primarily by demand for our products, which is influenced by the factors discussed above.
Operating Costs and Expenses. Many of our products target wireless operators and other customers in North America, Europe, and Asia. We will likely develop new products to serve these markets, resulting in increased research and development expenses. We have in the past and expect to continue to incur these expenses in future periods prior to recognizing net revenues from sales of these products.
Our operating costs consist of four primary categories: research and development costs; sales and marketing; general and administrative costs; and amortization of acquired intangibles.
26
Table of Contents
Research and development are at the core of our ability to produce innovative, leading-edge products. This category consists primarily of engineers and technicians who design and test our highly complex products. As we work to expand our portfolio of products and remain competitive, it may be necessary to increase our research and development costs in the future.
Sales and marketing expense consists primarily of our sales force and product-marketing professionals. In order to maintain strong sales relationships, we provide co-marketing, trade show support, product training and demo units for merchandising. We are also engaged in a wide variety of activities, such as awareness and lead generation programs as well as product marketing. Other marketing initiatives include public relations, seminars and co-branding with partners.
General and administrative expenses include primarily corporate functions such as accounting, human resources, legal, administrative support, and professional fees. This category also includes the expenses needed to operate as a publicly-traded company, including Sarbanes-Oxley compliance, SEC filings, stock-exchange fees, and investor-relations expense. General and administrative expenses have been relatively stable and are not directly related to revenue levels.
Amortization of acquired intangibles includes the amortization of customer relationships, covenant-not-to-compete agreements and trade name intangible assets purchased through the acquisition of Enfora.
As part of our business strategy, we review, and intend to continue to review, acquisition opportunities that we believe would be advantageous or complementary to the development of our business. If we make any acquisitions, we may incur substantial expenditures in conjunction with the acquisition process and the subsequent assimilation of any acquired business, products, technologies or personnel.
Merger & Acquisition Activities
Acquisition of Enfora
On November 30, 2010, the Company completed its acquisition of Enfora, a provider of intelligent asset-management solutions utilizing wireless technology and M2M communications. The acquisition of Enfora diversifies the Company’s customer base and product lines into adjacent markets and advances the Company’s strategy of providing intelligent devices to more end markets—enterprise, consumer and vertical applications. Enfora’s results of operations and estimated fair value of assets acquired and liabilities assumed are included in the Company’s consolidated financial statements from the date of acquisition.
Under the terms of the acquisition agreement, the Company paid cash consideration of $64.5 million and additional cash consideration of $13.0 million in exchange for an agreed upon amount of Enfora working capital. The Company also agreed to pay additional cash consideration, or contingent consideration, of up to $6.0 million based on the operating results of Enfora for the 15 month period from October 1, 2010 to December 31, 2011. At December 31, 2010, the estimated fair value of this contingent consideration at the acquisition date was $0.9 million, resulting in total estimated cash to be paid of $78.4 million. During the quarter ended March 31, 2011, the Company revised its estimate of contingent consideration to $0 and accordingly reflected this change as a benefit to general and administrative expenses for the quarter ended March 31, 2011. There were no changes in the fair value of the contingent consideration as of the date of this report as the Company continues to believe the operating results necessary to receive payment of the contingent consideration will not be achieved.
Cinterion
In June 2010, the Company submitted a bid to purchase certain assets of Cinterion Wireless Modules, a company in the cellular machine-to-machine communications industry. The Company was not the successful bidder at the conclusion of the process on June 28, 2010.
27
Table of Contents
In June 2010, the Company borrowed $30.0 million, net of $2.2 million in lender fees, under a bridge loan facility in connection with its bid. In accordance with bidding procedures, during June 2010, the Company deposited into escrow an amount in Euros equal to its bid price using cash and cash equivalents, proceeds from the sale of marketable securities, and borrowings under the $30.0 million bridge loan facility. The escrowed funds are reflected as a deposit of restricted funds in the accompanying consolidated statement of cash flows for the year ended December 31, 2010. The escrowed funds were returned to the Company in July 2010.
While the Company’s Euro funds were held in escrow, the Company engaged in hedging transactions to address foreign currency risk at a cost of $1.2 million, which amount was recorded in other income (expense), net, in the consolidated statement of operations during the year ended December 31, 2010.
During the second quarter ended June 30, 2010, the Company recorded a foreign currency gain of $2.9 million, which was recorded in other income (expense), net, in connection with the conversion of its Euro-denominated escrowed funds into U.S. dollars following completion of the auction on June 28, 2010.
Pursuant to authoritative accounting guidance, the $2.2 million in lender fees on the $30.0 million bridge loan facility were recorded as a discount to amounts outstanding under the facility and amortized over the stated term of the facility which was scheduled to mature on September 8, 2010. During June 2010, the Company also incurred $660,000 in professional fees attributable to the bridge facility, which were capitalized and amortized over the stated term of the facility. During the second quarter ended June 30, 2010, the Company recognized $687,000 in interest expense related to this facility, which primarily consisted of the amortization of lender and professional fees.
In connection with its bid, the Company estimated that during the second quarter of 2010, it had incurred $2.0 million in legal, advisory and professional fees unrelated to the bridge loan facility, which were recorded as accrued expenses and classified as general and administrative expenses in the consolidated statement of operations. During the third quarter of 2010, the Company reduced its estimate of professional fees by approximately $700,000 based upon information we received during the third quarter of 2010 that indicated the reduction to the original estimated liability was appropriate.
In July 2010, the Company repaid all amounts outstanding under the bridge loan facility.
28
Table of Contents
Results of Operations
The following table sets forth our consolidated statements of operations expressed as a percentage of net revenues for the periods indicated.
| Year Ended December 31, | ||||||||||||
| 2011 | 2010 | 2009 | ||||||||||
| (as a percent of net revenues) | ||||||||||||
| Net revenues |
100.0 | % | 100.0 | % | 100.0 | % | ||||||
| Cost of net revenues |
79.0 | 80.4 | 74.0 | |||||||||
|
|
|
|
|
|
|
|||||||
| Gross margin |
21.0 | 19.6 | 26.0 | |||||||||
|
|
|
|
|
|
|
|||||||
| Operating costs and expenses: |
||||||||||||
| Research and development |
15.2 | 14.4 | 13.3 | |||||||||
| Sales and marketing |
7.4 | 6.2 | 5.9 | |||||||||
| General and administrative |
5.4 | 6.3 | 6.0 | |||||||||
| Amortization of acquired intangibles |
0.6 | 0.1 | — | |||||||||
| Goodwill impairment |
0.8 | — | — | |||||||||
|
|
|
|
|
|
|
|||||||
| Total operating costs and expenses |
29.4 | 27.0 | 25.2 | |||||||||
|
|
|
|
|
|
|
|||||||
| Operating income (loss) |
(8.4 | ) | (7.4 | ) | 0.8 | |||||||
|
|
|
|
|
|
|
|||||||
| Interest income (expense), net |
0.1 | (0.7 | ) | 0.4 | ||||||||
| Other income (expense), net |
(0.3 | ) | 0.6 | 0.1 | ||||||||
|
|
|
|
|
|
|
|||||||
| Income (loss) before taxes |
(8.6 | ) | (7.5 | ) | 1.3 | |||||||
| Income tax expense (benefit) |
(2.4 | ) | 2.3 | 0.2 | ||||||||
|
|
|
|
|
|
|
|||||||
| Net income (loss) |
(6.2 | )% | (9.8 | )% | 1.1 | % | ||||||
|
|
|
|
|
|
|
|||||||
Year Ended December 31, 2011 Compared to Year Ended December 31, 2010
Net revenues. Net revenues were approximately $402.9 million during 2011, an increase of approximately $63.9 million or 18.9% compared to 2010.
The following table summarizes net revenues by reportable segment and product categories during the years ended December 31, 2011 and 2010 (in thousands):
| Year Ended December 31, | ||||||||
| 2011 | 2010 | |||||||
| Net revenues from reportable segment: |
||||||||
| Mobile Computing Products |
$ | 358,106 | $ | 332,464 | ||||
| M2M Products and Solutions |
44,756 | 6,478 | ||||||
|
|
|
|
|
|||||
| Total |
$ | 402,862 | $ | 338,942 | ||||
|
|
|
|
|
|||||
| Year Ended December 31, | ||||||||
| 2011 | 2010 | |||||||
| Net revenues from product category: |
||||||||
| Mobile Broadband Devices |
$ | 336,730 | $ | 324,740 | ||||
| Embedded Modules |
39,793 | 7,724 | ||||||
| Asset Management Solutions & Services |
26,339 | 6,478 | ||||||
|
|
|
|
|
|||||
| Total |
$ | 402,862 | $ | 338,942 | ||||
|
|
|
|
|
|||||
29
Table of Contents
Mobile Computing Products. Net revenues from our Mobile Computing Products segment for the year ended December 31, 2011 were $358.1 million, an increase of $25.6 million or 7.7% compared to the same period in 2010. The increase is primarily attributable to new product rollouts of our next generation 4G MiFi Intelligent Mobile Hotspot.
M2M Products and Solutions. Net revenues from our M2M Products and Solutions segment for the year ended December 31, 2011 were $44.8 million, an increase of $38.3 million compared with $6.5 million in revenues for the previous year. Our acquisition of Enfora occurred during the fourth quarter of 2010 and we recognized revenues from the date of acquisition. The net revenues consist primarily of 2G Global System for Mobile Communications, or GSM, embedded modules, and solutions and services.
Net revenues from M2M Products and Solutions were also constrained by supply disruptions that affected a component manufacturer in Japan and our contract manufacturer in Thailand due to natural disasters in those countries in 2011. We are taking steps to mitigate the impact related to these manufacturers, but there is a risk that we could experience further constraints in the manufacture of our products.
Product Categories. We have categorized the combined product portfolios of the mobile computing and M2M businesses into three categories (1) Mobile Broadband Devices, (2) Embedded Solutions and (3) Asset Management Solutions and Services. These categories were established due to the different markets and sales channels served. We believe this product categorization information facilitates the analysis of our operating trends and enhances our segment disclosures.
The Mobile Broadband Devices include all external data modems including PC cards, USB modems and MiFi intelligent mobile hotspots. These devices are sold primarily through wireless operator enterprise and retail channels, telecom equipment distributors and consumer retail chains.
Embedded Solutions products are wireless broadband modules and related software and services sold to manufacturers of laptop computers, tablets, and other wireless computer devices. Our products are sold directly to OEMs or through distributor channels.
Asset Management Solutions and Services are mobile intelligent wireless broadband terminal devices and communication management software, or CMS, that transmit information about the assets into which these products are integrated. These hardware and software products can be bundled or sold separately. The CMS software activates the terminal device onto the wireless network and manages its functionality.
Net revenues from our Mobile Broadband Devices category for the year ended December 31, 2011 were $336.7 million, an increase of $12.0 million or 3.5% compared to the same period in 2010. The increase in net revenues was primarily driven by higher sales of our next generation 4G MiFi products.
The Embedded Solutions category accounted for $39.8 million, or 9.9% of total net revenues for the year ended December 31, 2011, an increase of $32.1 million compared to the same period in 2010. This included $22.2 million in sales of M2M modules and $17.6 million of embedded modules for OEM computing devices.
Net revenues from Asset Management Solutions & Services were $26.3 million and accounted for approximately 6.5% of total net revenues for the year ended December 31, 2011, an increase of $19.9 million compared to the same period in 2010. These sales were predominantly comprised of integrated product hardware sales. Sales of CMS software were not significant for the year ended December 31, 2011. The increase in net revenues in Embedded Solutions and Asset Management Solutions and Services compared to the same period in 2010 were related to the Enfora acquisition and increased sales to OEM customers in the Mobile Computing Products segment.
30
Table of Contents
Cost of net revenues. Cost of net revenues for the year ended December 31, 2011 was approximately $318.3 million, or 79.0% of net revenues, as compared to approximately $272.6 million, or 80.4% of net revenues in 2010. The primary driver of the dollar increase in cost of net revenues was the increase in units sold compared to the same period in 2010. Cost of net revenues as a percentage of net revenues remained relatively flat compared to the same period last year. Cost of net revenues as a percentage of net revenues is expected to fluctuate in future quarters depending on the mix of products sold, competitive pricing, new product introduction costs and other factors.
Cost of net revenues also included approximately $39.9 million in 2011 from our M2M Products and Solutions segment, including amortization costs of $4.1 million related to purchased intangibles and a fair value inventory valuation increase of $1.8 million in connection with our Enfora acquisition.
Increased competitive pressures may continue to negatively impact the average sales prices of our products. This may require us in future periods to record inventory write downs to reflect lower of cost or market adjustments and revalue certain assets that may become impaired.
Gross profit. Gross profit for the year ended December 31, 2011 was approximately $84.6 million, or 21.0% of net revenues, as compared to approximately $66.3 million, or 19.6% of net revenues in 2010. The increase was primarily attributable to the increase in net revenues as discussed above. We expect that our gross profit percentage will continue to fluctuate from quarter to quarter depending on product mix, competitive selling prices, our ability to reduce product costs and changes in unit volume.
Research and development expenses. Research and development expenses for the year ended December 31, 2011 were approximately $61.4 million, or 15.2% of net revenues, compared to approximately $48.9 million, or 14.4% of net revenues in 2010. This increase was primarily due to an increase in salaries and related expenses due to the acquisition of Enfora, and an increase in product testing and certification costs in the current year to support expanded research and development activities. We believe that focused investments in research and development are critical to our future growth and competitive position in the marketplace and are directly related to timely development of new and enhanced products that are central to our core business strategy. As such, we expect to make further investments in research and development to remain competitive.
Research and development expenses included approximately $8.5 million in 2011 from our M2M Products and Solutions segment, compared to $837,000 in 2010.
Research and development expenses as a percentage of net revenues are expected to fluctuate in future quarters depending on the amount of revenue recognized, and potential variation in the costs associated with the development of our products, including the number and complexity of the products under development and the progress of the development activities with respect to those products. We may increase our investment in research and development to continue to provide innovative products and services.
Sales and marketing expenses. Sales and marketing expenses for the year ended December 31, 2011 were approximately $29.8 million, or 7.4% of net revenues, compared to approximately $21.0 million or 6.2% of net revenues in 2010. The increase was due primarily to an increase in salaries and related expenses due to the acquisition of Enfora, an increase in travel and related expenses, and an increase in consulting and marketing expenses to support marketing efforts for our various product launches in 2011.
Sales and marketing expenses also included approximately $8.2 million in 2011 from our M2M Products and Solutions segment related to our Enfora acquisition, compared to $825,000 in 2010.
While managing sales and marketing expenses relative to net revenues, we expect to continue to make selected investments in sales and marketing as we introduce new products, market existing products, expand our distribution channels and focus on key customers around the world.
31
Table of Contents
General and administrative expenses. General and administrative expenses for the year ended December 31, 2011 were approximately $21.6 million, or 5.4% of net revenues, compared to approximately $21.2 million, or 6.3% of net revenues in 2010. Although general and administrative expenses remained relatively flat in dollar spending for the year ended December 31, 2011 compared to the same period in 2010, general and administrative expenses decreased as a percentage of net revenues due to the increase in net revenues in 2011 as compared to 2010.
General and administrative expenses also included approximately $2.7 million in 2011 from our M2M Products and Solutions segment, compared to $350,000 in 2010.
Amortization of purchased intangible assets. The increase in amortization expense for the year ended December 31, 2011 was due to the full year 2011 amortization of purchased intangible assets from the Enfora acquisition completed during the fourth quarter of 2010.
Goodwill impairment. During the third quarter of 2011, we performed an interim assessment of impairment for goodwill and recorded an impairment charge of $3.5 million. During the fourth quarter of 2011, we completed the impairment analysis and reduced the impairment by $237,000. As a result of this assessment, which is described in Note 6 to the consolidated financial statements, we recorded a goodwill impairment of $3.3 million related to the M2M reporting unit for the year ended December 31, 2011.
Interest income (expense), net. Interest income (expense), net, for the year ended December 31, 2011 was approximately $384,000 of income, net as compared to net interest expense of approximately $2.5 million in 2010. Our net interest income during 2011 is primarily related to interest earned on our marketable securities. Our net interest expense during 2010 is primarily related to interest charges, and debt issuance costs associated with our bridge loan facility in connection with our bid acquisition to acquire Cinterion.
Other income (expense), net. Other income (expense), for the year ended December 31, 2011 decreased by approximately $3.0 million, to approximately $1.1 million of net expense, compared to approximately $2.0 million of other income, net in 2010. The net other expenses for 2011 were related to foreign currency losses on South Korean Won denominated trade payables, foreign exchange currency losses on our foreign denominated bank accounts and trade receivables, and other-than-temporary loss recognized on our marketable equity securities. The other income, net for 2010 was primarily driven by a $2.9 million foreign exchange gain realized upon conversion of the Euro-denominated bid funds into U.S. dollars in July 2010 at the conclusion of the bidding process for Cinterion. The gain was offset by $1.2 million in premiums paid for protective put options we utilized to hedge our Euro exposure during the bidding process for Cinterion in the second quarter of 2010. These puts expired unexercised on June 25, 2010.
Income tax expense (benefit). Income tax benefit was approximately $9.5 million for fiscal 2011, compared to an expense of $7.9 million in 2010. The company’s annual effective tax benefit rate in 2011 was 28%. The difference between the federal and state statutory combined benefit rate of 36% and our effective tax benefit rate for 2011 is primarily due to a $13.2 million expense related to an increase in the Company’s valuation allowance on the U.S.-based deferred tax assets generated in 2011, a $1.4 million expense related to an increase in the Company’s valuation allowance on the Canadian-based deferred tax assets and an $11.8 million income tax benefit related to uncertain tax positions. The valuation allowance and additional items impacting the 2011 income tax expense are discussed in Note 10 to the consolidated financial statements. During 2010, the Company had income tax expense of $7.9 million, predominantly relating to the full valuation allowance incurred against the Company’s U.S. based deferred tax assets.
Net loss. For the year ended December 31, 2011, we reported a net loss of approximately $24.9 million, as compared to net loss of approximately $33.4 million in 2010. As discussed above, the increase in gross profit was exceeded by an increase in operating expenses, a full year of amortization from acquired intangibles and the impairment of goodwill. However, the Company recorded a $9.5 million benefit in income taxes during 2011 as compared to a $7.9 income tax expense in 2010.
32
Table of Contents
Year Ended December 31, 2010 Compared to Year Ended December 31, 2009
Net revenues. Net revenues were approximately $338.9 million during 2010, an increase of approximately $1.5 million or 0.5% compared to 2009. For 2010, sales from our Mobile Computing Products segment amounted to $332.4 million, primarily relating to $292.9 million in EV-DO products and $35.7 million in HSPA products.
Net revenues for EV-DO product driven technology in our Mobile Computing Products segment amounted to approximately $292.9 million in 2010, an increase of approximately $1.8 million or 0.6% compared to 2009. We benefited from the strong sales of our MiFi product during 2010 that contributed to the increase in EV-DO net revenues. EV-DO products are primarily sold in the North American market and represented approximately 86.4% of net revenues in the year ended December 31, 2010 compared to 86.3% in the same period in 2009. The increase from MiFi sales was partially offset by a decline in embedded module sales due to the presence of competing products available to OEMs and the lack of significant sales to content delivery device customers during 2010.
Net revenues for High Speed Packet Access, or HSPA, product driven technology in our Mobile Computing Products segment amounted to approximately $35.7 million in 2010, a decline of approximately $8.7 million or 19.6% compared to 2009. This decrease resulted primarily from a decline in our embedded modules and Ovation product sales due to the presence of competing products available to OEMs and wireless carriers primarily located in the European market.
Net revenues also included approximately $6.5 million in 2010 from our M2M Products and Solutions segment related to our Enfora acquisition that was completed on November 30, 2010.
Cost of net revenues. Cost of net revenues for the year ended December 31, 2010 was approximately $272.6 million, or 80.4% of net revenues, as compared to approximately $249.8 million, or 74.0% of net revenues in 2009. The primary driver of the increase in cost of net revenues as a percentage of net revenues compared to 2009 was a decline in average selling prices that exceeded the rate of decrease in per unit product costs.
Cost of net revenues also included approximately $6.3 million in 2010 from our M2M Products and Solutions segment, including amortization costs of $658,000 related to purchased intangibles and a fair value inventory valuation increase of $1.2 million in connection with our Enfora acquisition.
Gross profit. Gross profit for the year ended December 31, 2010 was approximately $66.3 million, or 19.6% of net revenues, as compared to approximately $87.7 million, or 26.0% of net revenues in 2009. The decrease was primarily attributable to the changes in cost of net revenues discussed above.
Research and development expenses. Research and development expenses for the year ended December 31, 2010 were approximately $48.9 million, or 14.4% of net revenues, compared to approximately $44.9 million, or 13.3% of net revenues in 2009. This increase was primarily due to an increase in salaries and related expenses due to the acquisition of Enfora, and an increase in product testing and certification costs in the current year to support expanded research and development activities.
Research and development expenses also included approximately $837,000 in 2010 from our M2M Products and Solutions segment related to our Enfora acquisition.
Sales and marketing expenses. Sales and marketing expenses for the year ended December 31, 2010 were approximately $21.0 million, or 6.2% of net revenues, compared to approximately $19.9 million or 5.9% of net revenues in 2009. The increase was due primarily to an increase in salaries and related expenses, an increase in expenses related to cooperative marketing and advertising to support marketing efforts for our MiFi product primarily during the first quarter of 2010.
33
Table of Contents
Sales and marketing expenses also included approximately $825,000 in 2010 from our M2M Products and Solutions segment related to our Enfora acquisition.
General and administrative expenses and amortization of acquired intangibles. General and administrative expenses for the year ended December 31, 2010 were approximately $21.2 million, or 6.3% of net revenues, compared to approximately $20.2 million, or 6.0% of net revenues in 2009. The increase over the prior year was primarily related to merger and acquisition costs of $3.9 million, partially offset by reductions in other expenses in 2010. Amortization of acquired intangibles was approximately $179,000 in 2010 and was related to intangible assets purchased from Enfora.
Interest income (expense), net. Interest income (expense), net, for the year ended December 31, 2010 was approximately $2.5 million of net expense as compared to net interest income of approximately $1.4 million in 2009. Our net interest expense during 2010 is primarily related to interest charges, and debt issuance costs associated with our bridge loan facility. In addition, the Company’s interest income declined as a result of the liquidation of our investment holdings to facilitate our bid for Cinterion in the second quarter of 2010, the purchase of Enfora in the fourth quarter of 2010, and the overall decline in average yields experienced during the year ended December 31, 2010.
Other income, net. Other income, net for the year ended December 31, 2010 increased by approximately $1.6 million, to approximately $2.0 million, compared to approximately $315,000 of other income in 2009. The increase in other income was primarily driven by a $2.9 million foreign exchange gain realized upon conversion of the Euro-denominated bid funds into U.S. dollars in July 2010 at the conclusion of the bidding process for Cinterion. The gain was offset by $1.2 million in premiums paid for protective put options we utilized to hedge our Euro exposure during the bidding process for Cinterion in the second quarter of 2010. These puts expired unexercised on June 25, 2010.
Income tax expense (benefit). Income tax expense was approximately $7.9 million for fiscal 2010. The difference between the federal and state statutory combined benefit rate of 36% and our income tax expense for 2010 is primarily due to a $17.9 million increase in our valuation allowance for our deferred tax assets. The increase in the valuation allowance includes $14.8 million of valuation allowance recorded during the second quarter of 2010 against U.S.-based deferred tax assets generated prior to 2010, a $4.8 million release of U.S.-based deferred tax asset valuation allowance upon the acquisition of Enfora, and an additional $7.9 million of valuation allowance on deferred tax assets generated in 2010. The valuation allowance and additional items impacting the 2010 income tax expense are discussed in Note 10 to the consolidated financial statements. Also, we recorded a $2.9 million tax benefit related to the carryback of our net operating loss in 2010.
Net income (loss). For the year ended December 31, 2010, we reported a net loss of approximately $33.4 million, as compared to net income of approximately $3.9 million in 2009. As discussed above, net loss was negatively impacted by decreases in gross profit, increases in operating expenses and changes in our valuation allowance for deferred tax assets.
Liquidity and Capital Resources
Our principal sources of liquidity are our existing cash, cash equivalents and marketable securities and cash generated from operations.
To address short term liquidity requirements resulting from working capital changes, in July 2011, the Company entered into a margin credit facility with a bank. The use of this margin credit facility allows the Company to meet short-term cash requirements and avoid selling cash equivalents and marketable securities. Borrowings under this facility are collateralized by Company cash equivalents and marketable securities on deposit at the bank. During the three months ended September 30, 2011, the Company borrowed approximately $12.0 million and subsequently repaid all amounts in the same period. The Company had no outstanding borrowings under this facility at December 31, 2011.
34
Table of Contents
In September 2009, we filed a shelf registration statement with the Securities and Exchange Commission, or the SEC, that will allow us to sell up to $125 million of equity, debt or other securities described in the registration statement in one or more offerings by us from time to time. As set forth in the shelf registration statement, the net proceeds from the sale of our securities may be used for general corporate purposes, including working capital, capital expenditures and acquisitions. As of the date of this report, we had not issued any securities under this registration statement.
Working Capital, Cash and Cash Equivalents and Marketable Securities
The following table presents working capital, cash and cash equivalents and marketable securities:
| Year Ended December 31, (in thousands) |
||||||||||||
| 2011 | 2010 | Increase / (Decrease) |
||||||||||
| Working capital |
$ | 81,113 | $ | 87,174 | $ | (6,061 | ) | |||||
|
|
|
|
|
|
|
|||||||
| Cash and cash equivalents (1) |
$ | 47,069 | $ | 17,375 | $ | 29,694 | ||||||
| Short-term marketable securities (1) |
28,267 | 59,775 | (31,508 | ) | ||||||||
| Long-term marketable securities |
13,495 | 20,676 | (7,181 | ) | ||||||||
|
|
|
|
|
|
|
|||||||
| Total cash and cash equivalents and marketable securities |
$ | 88,831 | $ | 97,826 | $ | (8,995 | ) | |||||
|
|
|
|
|
|
|
|||||||
| (1) | Included in working capital. |
Our decrease in working capital as of December 31, 2011 compared to the prior year was primarily due to losses incurred and capital expenditures in 2011, offset by a decrease in our long-term marketable securities holdings.
As of December 31, 2011, our cash, cash equivalents and marketable securities decreased $9.0 million as compared to December 31, 2010, primarily due to capital expenditures of $6.3 million and $1.6 million of cash used in operating activities. See the discussion of cash equivalents, short and long-term marketable securities by major security type in Note 3 to the consolidated financial statements, and the discussion of market risk in Item 7A. Quantitative and Qualitative Disclosures About Market Risk.
Historical Cash Flows
The following table summarizes our consolidated statements of cash flows for the periods indicated:
| Year Ended December
31, (in thousands) |
||||||||
| 2011 | 2010 | |||||||
| Net cash provided by (used in) operating activities |
$ | (1,531 | ) | $ | 6,211 | |||
| Net cash provided by (used in) investing activities |
31,659 | (87,568 | ) | |||||
| Net cash used in financing activities |
(305 | ) | (1,116 | ) | ||||
| Effect of exchange rates on cash and cash equivalents |
(129 | ) | (177 | ) | ||||
|
|
|
|
|
|||||
| Net increase (decrease) in cash and cash equivalents |
29,694 | (82,650 | ) | |||||
| Cash and cash equivalents, beginning of year |
17,375 | 100,025 | ||||||
|
|
|
|
|
|||||
| Cash and cash equivalents, end of year |
$ | 47,069 | $ | 17,375 | ||||
|
|
|
|
|
|||||
Operating activities. Net cash used in operating activities was $1.5 million for 2011 compared to $6.2 million of net cash provided in 2010. Net cash used in operating activities for the year ended December 31, 2011 was primarily attributable to the loss incurred in 2011 and the unfavorable impact of a significant reduction in accounts payable as we paid for products purchased in the fourth quarter of 2010 to support the higher fourth quarter 2010 sales activity. The unfavorable impacts during the year ended December 31, 2011 were partially
35
Table of Contents
offset by net cash collected from accounts receivable, and non-cash charges including depreciation and amortization, goodwill impairment and share-based compensation. During 2010, the difference between our net loss of $33.4 million in 2010 and our net cash provided by operating activities of $6.2 million was primarily due to the favorable impact of non-cash charges, including changes in our valuation allowance for deferred tax assets, depreciation, amortization and share-based compensation.
Investing activities. Net cash provided in investing activities for 2011 was approximately $31.7 million compared to $87.6 million used in investing activities in 2010. The net cash provided in 2011 was primarily related to the net sales and maturities of our short and long term marketable securities of $37.9 million, partially offset by purchases of property and equipment of $6.3 million. The net cash used by investing activities in 2010 was primarily related to our acquisition of Enfora, net of cash acquired, of $72.2 million, and purchases of property and equipment of $10.8 million.
Financing activities. Net cash used in financing activities for 2011 was $305,000, compared to net cash used in financing activities of $1.1 million for 2010. Net cash used in financing activities in 2011 was primarily due to net taxes paid on vested restricted stock units, and payments of capital lease obligations. Net financing activities for 2011 also included cash borrowings and repayment of $12 million from our credit facility during the third quarter of 2011. Net cash used in financing activities in 2010 was primarily due to the $30.0 million principal repayment on July 1, 2010 of the short-term bridge loan facility, offset by the $27.8 million in net proceeds from the same debt facility.
Contractual Obligations and Commercial Commitments
The following table summarizes our contractual obligations and commercial commitments at December 31, 2011, and the effect such obligations could have on our liquidity and cash flow in future periods (in thousands):
| Payments Due by Fiscal Year | ||||||||||||||||||||||||
| 2012 | 2013 | 2014 | 2015 | 2016 | Total | |||||||||||||||||||
| Operating leases |
$ | 3,238 | $ | 2,771 | $ | 2,806 | $ | 2,354 | $ | 2,425 | $ | 13,594 | ||||||||||||
| Capital leases |
47 | — | — | — | — | 47 | ||||||||||||||||||
| Committed purchase orders |
117,209 | — | — | — | — | 117,209 | ||||||||||||||||||
|
|
|
|
|
|
|
|
|
|
|
|
|
|||||||||||||
| Total contractual obligations |
$ | 120,494 | $ | 2,771 | $ | 2,806 | $ | 2,354 | $ | 2,425 | $ | 130,850 | ||||||||||||
|
|
|
|
|
|
|
|
|
|
|
|
|
|||||||||||||
Our liability for uncertain tax benefits, including interest, as of December 31, 2011 was approximately $413,000, a decrease of approximately of $11.5 million from the same period last year. The significant decrease was primarily due to the recognition of $11.8 million of tax benefit due to the expiration of applicable statutes of limitations (see Note 10 to the consolidated financial statements). Our tax liability for uncertain tax benefits is not included in our table of contractual obligations and commercial commitments. We do not believe that we will pay such amount within one year from December 31, 2011; however, we cannot reasonably estimate the timing of future payments with respect to this liability.
Other Liquidity Needs
We expect to incur ongoing professional fees and expenses to defend litigation filed against us or related to our products, which litigation is discussed in Note 9 to our consolidated financial statements included in this report. These costs cannot be estimated at this time.
During the year ending December 31, 2012, we plan to incur approximately $10.4 million for discretionary capital expenditures, including the acquisition of additional software licenses.
36
Table of Contents
We believe our cash resources from cash and cash equivalents and marketable securities, together with anticipated cash flows from operations will be sufficient to meet our working capital needs for the next twelve months.
Our liquidity could be impaired if there is any interruption in our business operations, a material failure to satisfy our contractual commitments or a failure to generate revenue from new or existing products.
We may raise additional funds to accelerate development of new and existing services and products, to respond to competitive pressures or to acquire complementary products, businesses or technologies. There can be no assurance that any required additional financing will be available on terms favorable to us, or at all. If additional funds are raised by the issuance of equity securities, our shareholders could experience dilution of their ownership interests and securities issued may have rights senior to those of the holders of our common stock. If additional funds are raised by the issuance of debt securities, we may be subject to certain limitations on our operations. If adequate funds are not available or not available on acceptable terms, we may be unable to take advantage of acquisition opportunities, develop or enhance products or respond to competitive pressures, any of which could have a material adverse effect on our business, financial condition and results of operations.
Off-Balance Sheet Arrangements
We do not have any off-balance sheet arrangements that are material to our results of operations, financial conditions or liquidity.
Critical Accounting Policies and Estimates
The preparation of financial statements in conformity with accounting principles generally accepted in the United States of America requires management to make estimates and assumptions. These estimates and assumptions affect the reported amounts of assets, liabilities, revenues, expenses and disclosures of contingent assets and liabilities. Actual results could differ from these estimates. Critical accounting policies and significant estimates include revenue recognition, allowance for doubtful accounts receivable, provision for excess and obsolete inventory, valuation of intangible and long-lived assets including acquired intangibles and goodwill resulting from the acquisition of Enfora, valuation of contingent consideration, provision for warranty costs, litigation, income taxes, foreign exchange forward contracts, and share-based compensation expense.
Revenue Recognition. The Company’s revenue is principally generated from the sale of wireless modems to wireless operators, OEM customers and value added resellers and distributors. In addition, the Company generates revenue from the sale of asset-management solutions utilizing wireless technology and M2M communication devices to transportation and industrial companies, medical device manufacturers and security system providers. Revenue from product sales is generally recognized upon the later of transfer of title or delivery of the product to the customer. Where the transfer of title or risk of loss is contingent on the customer’s acceptance of the product, we will not recognize revenue until both title and risk of loss have transferred to the customer. We record deferred revenue for cash payments received from customers in advance of when revenue recognition criteria are met. We have granted price protection to certain customers in accordance with the provisions of the respective contracts and track pricing and other terms offered to customers buying similar products to assess compliance with these provisions. We estimate the amount of price protection for current period product sales utilizing historical experience and information regarding customer inventory levels. To date, we have not incurred material price protection obligations. Revenues from sales to certain customers are subject to cooperative advertising allowances. Cooperative advertising allowances are recorded as an operating expense to the extent that the advertising benefit is separable from the revenue transaction and the fair value of that advertising benefit is determinable. To the extent that such allowances either do not provide a separable benefit to us, or the fair value of the advertising benefit cannot be reliably estimated, such amounts are recorded as a reduction of revenue. We establish reserves for estimated product returns allowances in the period in which revenue is recognized. In estimating future product returns, we consider various factors, including our stated return policies and practices and historical trends.
37
Table of Contents
Predominantly all of the revenues represent the sale of hardware with accompanied software that is essential to the functionality of the hardware. The Company records revenue associated with the agreed upon price on hardware sales, and accrues any estimated costs of post-delivery performance obligations, such as warranty obligations. The Company considers the four basic revenue recognition criteria discussed under Staff Accounting Bulletin #104 when assessing appropriate revenue recognition as follows:
Criterion #1 — Persuasive evidence of an arrangement must exist;
Criterion #2 — Delivery has occurred;
Criterion #3 — The Company’s price to the buyer must be fixed or determinable; and,
Criterion #4 — Collectibility is reasonably assured.
Under ASU 2009-13, in multiple element arrangements, the total consideration received from customers must be allocated to the elements based on a relative selling price. The accounting guidance establishes a hierarchy to determine the selling price to be used for allocating revenue to deliverables as follows: (i) vendors specific objective evidence (VSOE), (ii) third party evidence (TPE), and (iii) best estimate of selling price (ESP). Because the Company has neither VSOE nor TPE, revenue has been based on the Company’s ESP. Amounts allocated to the delivered hardware and the related essential software are recognized at the time of the sale provided all other revenue recognition criteria have been met. Amounts allocated to other deliverables based upon ESP are recognized in the period the revenue recognition criteria have been met.
Our process for determining its ESP for deliverables without VSOE or TPE considers multiple factors that may vary depending upon the unique facts and circumstances related to each deliverable. Our prices are determined based upon cost to produce our products, expected order quantities and acceptance in the marketplace. In addition, when developing ESPs for products we may consider other factors as appropriate including the pricing of competitive alternatives if they exist, and product-specific business objectives.
We account for multiple element arrangements that primarily consist of software licenses and post contract support (PCS) by recognizing revenue for such arrangements ratably over the term of the PCS as we have not established VSOE for the PCS element.
For the years ended December 31, 2011, 2010, and 2009, we have not recorded any significant revenues from multiple element or software arrangements.
Allowance for Doubtful Accounts Receivable. We provide an allowance for our accounts receivable for estimated losses that may result from our customers’ inability to pay. We determine the amount of the allowance by analyzing known uncollectible accounts, aged receivables, economic conditions, historical losses, and changes in customer payment cycles and our customers’ credit-worthiness. Amounts later determined and specifically identified to be uncollectible are charged or written off against this allowance. To minimize the likelihood of uncollectibility, we review our customers’ credit-worthiness periodically based on credit scores generated by independent credit reporting services, our experience with our customers and the economic condition of our customers’ industries. Material differences may result in the amount and timing of expense for any period if we were to make different judgments or utilize different estimates. If the financial condition of our customers deteriorates resulting in an impairment of their ability to make payments, additional allowances may be required.
Provision for Excess and Obsolete Inventory. Inventories are stated at the lower of cost (first-in, first-out method) or market. We review the components of our inventory and our inventory purchase commitments on a regular basis for excess and obsolete inventory based on estimated future usage and sales. Write-downs in inventory value or losses on inventory purchase commitments depend on various items, including factors related to customer demand, economic and competitive conditions, technological advances or new product introductions by us or our customers that vary from our current expectations. Whenever inventory is written down, a new cost basis is established and the inventory is not subsequently written up if market conditions improve.
38
Table of Contents
We believe that, when made, the estimates we use in calculating the inventory provision are reasonable and properly reflect the risk of excess and obsolete inventory. If customer demand for our inventory is substantially less than our estimates, inventory write-downs may be required, which could have a material adverse effect on our consolidated financial statements.
Valuation of Acquired Intangible Assets. In determining the Enfora purchase price allocation, the Company considered, among other factors, its intention to use the acquired assets and the historical and estimated future demand for Enfora products and services. The estimated fair value of intangible assets was based upon the income approach. The income approach relies on an estimation of the present value of the future monetary benefits expected to flow to the owner of an asset during its remaining economic life. This approach requires a projection of the cash flow that the asset is expected to generate in the future. The projected cash flow is discounted to its present value using a rate of return, or discount rate that accounts for the time value of money and the degree of risks inherent in the asset. The expected future cash flow that is projected should include all of the economic benefits attributable to the asset, including the tax savings associated with the amortization of the intangible asset value over the tax life of the asset. The income approach may take the form of a “relief from royalty” methodology, a cost savings methodology, a “with and without” methodology, or excess earnings methodology, depending on the specific asset under consideration.
The relief-from-royalty method was used to value the trade name acquired from Enfora. The relief-from-royalty method estimates the cost savings that accrue to the owner of an intangible asset that would otherwise be required to pay royalties or license fees on revenues earned through the use of the asset. The royalty rate used is based on an analysis of empirical, market-derived royalty rates for guideline intangible assets. Typically, revenue is projected over the expected remaining useful life of the intangible asset. The royalty rate is then applied to estimate the royalty savings. The key assumptions used in valuing the existing trade name acquired are as follows: royalty rate of 2%, discount rate of 20.5%, tax rate of 40% and an economic life of approximately 10.0 years.
The developed technologies, customer relationships and backlog were valued using a form of the income approach known as the multi-period excess earnings method. Inherent in the multi-period excess earnings method is the recognition that, in most cases, all of the assets of the business, both tangible and intangible, contribute to the generation of the cash flow of the business and the net cash flows attributable to the subject asset must recognize the support of the other assets which contribute to the realization of the cash flows. The contributory asset charges are based on the fair value of the contributory assets and either pre-tax or after-tax cash flows are assessed charges representing “returns on” the contributory assets. A contributory asset charge for the use of the technology was assessed on pre-tax cash flows, while contributory asset charges for the use of the working capital, fixed assets, and assembled work force have been deducted from the after-tax cash flow in each year to determine the net future cash flow attributable to the relationships. This future cash flow was then discounted using an estimated required rate of return for the asset to determine the present value of the future cash flows attributable to the asset. The key assumptions used in valuing the developed technologies acquired were as follows: discount rate of 18.5%, tax rate of 40% and estimated average economic life of 5-10 years. The key assumptions used in valuing the customer relationships acquired are as follows: discount rate of 19.5%, tax rate of 40% and estimated average economic life of 10 years. The key assumptions used in valuing the backlog acquired are as follows: discount rate of 14.5%, tax rate of 40% and estimated average economic life of 5 months.
The covenant-not-to-compete agreements were valued using the “with or without” method. The “with or without” method measures the value of an asset as the difference between two scenarios. One scenario measures the value of a business “with” the asset. The other scenario measures the value “without” the asset. The method treats the difference between the two scenarios (with certain valuation adjustments) as the value of the asset. The key assumptions used in valuing the covenant not to compete agreements were as follows: discount rate of 20.5% and estimated average economic life of 1-2 years.
Valuation of Intangible and Long-Lived Assets. We periodically assess the valuation of intangible and long-lived assets, which requires us to make assumptions and judgments regarding the carrying value of these assets.
39
Table of Contents
We consider assets to be impaired if the carrying value may not be recoverable based upon our assessment of the following events or changes in circumstances: the asset’s ability to continue to generate income from operations and positive cash flow in future periods; loss of legal ownership or title to the asset; significant changes in our strategic business objectives and utilization of the asset; or significant negative industry or economic trends.
Our assessment includes comparing the carrying amounts of intangible and long-lived assets to their associated undiscounted expected future cash flows, which are determined using an expected cash flow model. This model requires estimates of our future revenues, profits, capital expenditures, working capital and other relevant factors. We estimate these amounts by evaluating our historical trends, current budgets, operating plans and other industry data. If the assets are considered to be impaired, the impairment charge recognized is the amount by which the asset’s carrying value exceeds its estimated fair value.
The timing and frequency of our impairment test is based on an ongoing assessment of triggering events that could reduce the fair value of our long-lived assets below their carrying value. We monitor our intangible and long-lived asset balances and conduct formal tests on at least an annual basis or earlier when impairment indicators are present. We believe that the assumptions and estimates we used to value intangible and long-lived assets were appropriate based on the information available to management. The majority of our long-lived assets are being amortized or depreciated over two to ten years. As most of these assets are associated with technology or trade conditions that may change rapidly; such changes could have an immediate impact on our impairment analysis.
Goodwill. Our goodwill resulted from the acquisition of Enfora (M2M Products and Solutions) in the fourth quarter of 2010. In accordance with the (FASB) Accounting Standards Codification (“ASC”) Topic 350, Intangibles—Goodwill and Other (“ASC Topic 350”), we will review goodwill for impairment at least annually at the beginning of the fourth quarter of each year, and more frequently if events or changes in circumstances occur that indicate a potential reduction in the fair value of the reporting unit below its carrying value.
ASC Topic 350 requires that goodwill and certain intangible assets be assessed for impairment using fair value measurement techniques. The goodwill impairment test compares the implied fair value of the reporting unit’s goodwill with the carrying amount of that goodwill to measure the amount of the impairment loss, if any. The implied fair value of goodwill is determined in the same manner as in a business combination. Determining the fair value of the implied goodwill is judgmental in nature and often involves the use of significant estimates and assumptions. These estimates and assumptions could have a significant impact on whether or not an impairment charge is recognized and also the magnitude of any such charge.
In order to perform the annual goodwill impairment analysis, we are required to estimate the fair value of our M2M Products reporting unit. The fair value is calculated as though the M2M Products and Solutions reporting unit were to be sold in its entirety in an orderly transaction between market participants, using an estimate of fair value based on a blended sum resulting from the use of two valuation methods. First, we use the guideline public company method utilizing a multiple of the reporting unit’s revenue. Second, we perform a discounted cash flow analysis using forward looking projections of an estimate of our future operating results. These approaches use significant estimates and assumptions, including the size and timing of product deployments by our customers and related projections and timing of future cash flows, discount rates reflecting the risk inherent in future cash flows, perpetual growth rates, stage of products in development, determination of appropriate market comparables and determination of whether a premium or discount should be applied to comparables. The resultant estimated fair value of our M2M Products and Solutions reporting unit is compared to the net book value of the reporting unit to assess whether any impairment exists.
Contingent Consideration. Contingent consideration is recorded at the acquisition date estimated fair value of the contingent payment for all acquisitions. The fair value of the contingent consideration is remeasured at each reporting period with any adjustments in fair value included in the Company’s consolidated statement of operations.
40
Table of Contents
Provision for Warranty Costs. We accrue warranty costs based on estimates of future warranty related replacement, repairs or rework of products. Our warranty policy generally provides one to three years of coverage for products following the date of purchase. Our policy is to accrue the estimated cost of warranty coverage as a component of cost of revenue in the consolidated statements of operations at the time revenue is recognized. In estimating our future warranty obligations we consider various relevant factors, including the historical frequency and volume of claims, and the cost to replace or repair products under warranty. The warranty provision for our products is determined by using a financial model to estimate future warranty costs. Our financial model takes into consideration actual product failure rates; estimated replacement over the contractual warranty period, repair or rework expenses; and potential risks associated with our different products. The risk levels, warranty cost information, and failure rates used within this model are reviewed throughout the year and updated, if and when, these inputs change.
We actively engage in product improvement programs and processes to limit our warranty costs, but our warranty obligation is affected by the complexity of our product, product failure rates and costs incurred to correct those product failures. The industry in which we operate is subject to rapid technological change, and as a result, we periodically introduce newer, more complex products. Depending on the quality of our product design and manufacturing, actual product failure rates or actual warranty costs could be materially greater than our estimates, which could harm our financial condition and results of operations.
Income Taxes. We recognize federal, state and foreign current tax liabilities or assets based on our estimate of taxes payable to or refundable by tax authorities in the current fiscal year. We also recognize federal, state and foreign deferred tax liabilities or assets based on our estimate of future tax effects attributable to temporary differences and carry forwards. Deferred tax assets and liabilities are measured using enacted tax rates expected to apply to taxable income in the years in which those temporary differences are expected to be recovered or settled. Deferred tax assets are reduced by valuation allowances if, based on the consideration of all available evidence, it is more-likely-than-not that some portion of the deferred tax asset will not be realized. We evaluate deferred income taxes on a quarterly basis to determine if valuation allowances are required by considering available evidence. If we are unable to generate sufficient future taxable income in certain tax jurisdictions, or if there is a material change in the actual effective tax rates or time period within which the underlying temporary differences become taxable or deductible, we could be required to increase our valuation allowance against our deferred tax assets which could result in a decrease in our effective tax rate and an adverse impact on operating results. We will continue to evaluate the level of valuation allowance required based on the remaining deferred tax assets.
The Company recognizes the impact of uncertain income tax positions on the income tax return at the largest amount that is more-likely-than-not to be sustained upon audit by the relevant taxing authority. An uncertain income tax position will not be recognized if it has less than a 50% likelihood of being sustained. Uncertain tax positions are recognized in the first subsequent financial reporting period in which that threshold is met or from changes in circumstances such as the expiration of applicable statutes of limitations.
Litigation. The Company is currently involved in certain legal proceedings. The Company will record a loss when the Company determines information available prior to the issuance of the financial statements indicates the loss is both probable and estimable. Where a liability is probable and there is a range of estimated loss with no best estimate in the range, the Company records the minimum estimated liability related to the claim. As additional information becomes available, the Company assesses the potential liability related to the Company’s pending litigation and revises its estimates, if necessary. The Company’s policy is to expense litigation costs as incurred.
Share-based Compensation Expense. We have stock incentive plans under which incentive stock options and restricted stock units have been granted to employees and non-employee members of our Board of Directors.
41
Table of Contents
We also had an employee stock purchase plan for all eligible employees. Share-based payments to employees, including grants of employee stock options, restricted stock units and employee stock purchase rights, are recognized in the financial statements based upon their respective grant date fair values.
We estimate the fair value of stock option awards and stock purchase rights on the date of grant using an option-pricing model. The value of the portion of the award that is ultimately expected to vest is principally recognized as expense ratably over the requisite service periods. We have estimated the fair value of stock options and stock purchase rights as of the date of grant or assumption using the Black-Scholes option pricing model, which was developed for use in estimating the value of traded options that have no vesting restrictions and that are freely transferable. The Black-Scholes model considers, among other factors, the expected life of the award and the expected volatility of our stock price. We evaluate the assumptions used to value stock options and stock purchase rights on a quarterly basis. Although the Black-Scholes model is an acceptable model, the fair values generated by the model may not be indicative of the actual fair values of our equity awards, as it does not consider other factors important to those awards to employees, such as continued employment, periodic vesting requirements and limited transferability.
Compensation cost associated with grants of restricted stock units are measured at fair value, which has historically been the closing price of the Company’s stock on the date of the grant.
| Item 7A. | Quantitative and Qualitative Disclosures About Market Risk |
Interest Rate Risk
Our investment portfolio is maintained in accordance with our investment policy that defines allowable investments, specifies credit quality standards and limits our credit exposure to any single issuer. The fair value of our cash equivalents and marketable debt securities is subject to change as a result of changes in market interest rates and investment risk related to the issuers’ credit worthiness. At December 31, 2011, we had $88.8 million in cash, cash equivalents and marketable securities, all of which are stated at fair value. Changes in market interest rates would not be expected to have a material impact on the fair value of our $47.1 million in cash equivalents at December 31, 2011, as these consisted of money market funds with the value of all of our cash equivalents determined based on “Level 1” inputs, which consist of quoted prices in active markets for identical assets.
At December 31, 2011, substantially all of our marketable securities are invested in fixed income products. As such, our investments in fixed-rate instruments carry a degree of interest rate risk. The market value of fixed-rate securities may be adversely impacted due to an increase in interest rates, while floating rate securities may produce less income than expected if interest rates decline. Due in part to these factors, our future investment market values and income may fall short of expectations due to changes in interest rates or if the decline in fair value of our publicly traded debt investments is judged to be other-than-temporary. Using a model that estimates the aggregate yield to maturity of our investment portfolio, we estimate that 100 basis point increase or decrease in interest rates would, however, decrease or increase, respectively, our $41.8 million in marketable securities by approximately $418,000.
However, because any debt securities we hold are classified as available-for-sale (within the meaning of ASC Topic 320), no gains or losses are realized in the income statement due to changes in interest rates unless such securities are sold prior to maturity or unless declines in value are determined to be other-than-temporary. These securities are reported at fair value with the related unrealized gains and losses included in accumulated other comprehensive income (loss), a component of shareholders’ equity, net of tax.
We do not utilize derivative instruments or other financial contracts to manage our exposure to changes in interest rates in our investment portfolio.
42
Table of Contents
Credit Risk
We maintain our cash and cash equivalents and our marketable debt securities, which include various security holdings, types and maturities, with a number of financial institutions. Although the global credit crisis appears to have abated somewhat, credit risk remains. As of the date of this report, we have not identified any significant credit risk associated with any of the financial institutions that maintain our portfolio of cash and cash equivalents and our marketable securities. However, our ability to support our working capital needs depends, in part, on our available cash, cash equivalents, and marketable securities. As a result, any significant decrease in the value of our investments may materially adversely impact our ability to support our working capital needs.
We place our cash investments in instruments that meet credit quality standards specified in our investment policy guidelines at the time the investments are made. At December 31, 2011, we have cash and cash equivalents of $47.1 million. Of this $47.1 million, $16.2 million is held in cash demand deposits and $30.9 million in cash equivalents was held in money market investments. These money market funds attempt to maintain a net asset value, or NAV, of $1 per unit of investment. Should the underlying investments held by these money market funds suffer significant losses to market value due to interest rate changes or perceived counterparty risk, the NAV of these money market funds may suffer declines below the targeted $1 NAV. We hold money market funds that target a balance of investment return and preservation of invested capital through diversified holdings. As such, we do not believe we currently have significant exposure to NAV declines for our money market holdings.
At December 31, 2011, we had $41.8 million invested in our portfolio of marketable securities. Our investment policy guidelines limit the amount of credit exposure to any one issue, issuer or type of instrument. The fair value of our marketable debt securities at December 31, 2011 was determined based on “Level 2” inputs, which were derived based on quoted prices for identical or similar assets, which had few transactions near the measurement period (see Note 3 to our consolidated financial statements).
Foreign Currency Exchange Rate Risk
We generate Euro-denominated accounts receivable from sales to customers that are members of the European Union, and we lack significant Euro-denominated purchases and trade liabilities to offset our exposure to this Euro-denominated accounts receivable activity. During the year ended December 31, 2011, Euro-denominated revenue was approximately $3.7 million which represents less than 1% of our total net revenues compared to 4.7% in the same period last year. Although we are exposed to market risk arising from changes in foreign currency exchange rates, principally the change in the value of the Euro versus the U.S. Dollar, there was also a significant decline in our net revenues in Europe year over year. As a result of the decline in net revenues, we did not enter into any foreign exchange contracts during the year ended December 31, 2011. If our net revenues increase in the foreseeable future, we may enter into foreign exchange contracts to mitigate this risk. These forward currency foreign exchange contracts would cover a portion, generally 50% to 80%, but may cover up to 100%, of our Euro-based financial assets.
At December 31, 2011, we have no outstanding forward contracts. During the year ended December 31, 2011, we recorded approximately $8,000 in unrealized foreign currency losses related to our outstanding Euro-denominated accounts receivable balances. Both the unrealized gain on the outstanding forward contracts and the unrealized losses on outstanding Euro-denominated receivables were recorded in other income (expense), net in our consolidated statement of operations.
Assuming a translation of our Euro-denominated revenue for the year ended December 31, 2011 at an average Euro-to-U.S. Dollar exchange rate of $1.39 and a uniform ten percent strengthening or weakening of this exchange rate, we estimate that income before income taxes for the year ended December 31, 2011 would increase or decrease, respectively, by approximately $365,000. This analysis does not give effect to any forward currency foreign exchange contracts that may be used to hedge foreign currency risk.
43
Table of Contents
Actual gains and losses in the future may differ materially from the hypothetical gains and losses discussed above based on fluctuations in interest and foreign currency exchange rates and our actual exposure and hedging transactions.
Our sales to non-European Union countries are typically denominated in U.S. Dollars. Competitive conditions in the markets in which we operate may limit our ability to increase prices in the event of adverse changes in currency exchange rates. Sales of these products are affected by the value of the U.S. Dollar relative to other currencies, and in particular, the Euro. Any long-term strengthening of the U.S. Dollar could depress the demand for these U.S. manufactured products, reduce sales, or cause us to reduce per unit selling prices.
| Item 8. | Financial Statements and Supplementary Data |
The index to our consolidated financial statements and the Report of Independent Registered Public Accounting Firm appears in Part IV of this report.
| Item 9. | Changes in and Disagreements With Accountants on Accounting and Financial Disclosure |
None.
| Item 9A. | Controls and Procedures |
Evaluation of Disclosure Controls and Procedures
We maintain disclosure controls and procedures (as defined in Rule 13a-15(e) under the Securities Exchange Act of 1934, as amended) that are designed to provide reasonable assurance that information required to be disclosed in our reports to the SEC is recorded, processed, summarized and reported within the time periods specified in the SEC’s rules and forms, and that such information is accumulated and communicated to our management, including our principal executive officer and our principal financial and accounting officer, as appropriate, to allow timely decisions regarding required disclosure.
As required by SEC rules, we carried out an evaluation, under the supervision and with the participation of our management, including our principal executive officer and our principal financial and accounting officer, of the effectiveness of the design and operation of our disclosure controls and procedures as of December 31, 2011, the end of the period covered by this report. Based on the foregoing, our principal executive officer and principal financial and accounting officer concluded that our disclosure controls and procedures were effective as of December 31, 2011.
Changes in Internal Control Over Financial Reporting
An evaluation was also performed under the supervision and with the participation of our management, including our principal executive officer and our principal financial and accounting officer, of any change in our internal control over financial reporting that occurred during our last fiscal quarter and that has materially affected, or is reasonably likely to materially affect, our internal control over financial reporting. The evaluation did not identify any change in our internal control over financial reporting that occurred during our latest fiscal quarter and that has materially affected, or is reasonably likely to materially affect, our internal control over financial reporting.
Management’s Annual Report on Internal Control Over Financial Reporting
Our management is responsible for establishing and maintaining adequate internal control over financial reporting, as such term is defined in Exchange Act Rules 13a-15(f) and 15d-15(f). Our internal control over financial reporting is a process designed to provide reasonable assurance regarding the reliability of financial reporting and the preparation of the financial statements for external purposes in accordance with generally accepted accounting principles. Because of its inherent limitations, internal control over financial reporting may
44
Table of Contents
not prevent or detect misstatements. Also, projections of any evaluation of effectiveness to future periods are subject to the risk that internal controls may become inadequate because of changes in conditions, or that the degree of compliance with policies and procedures may deteriorate.
Under the supervision and with the participation of our management, including our principal executive officer and principal financial officer, we conducted an evaluation of the effectiveness of our internal control over financial reporting based on the framework set forth in Internal Control—Integrated Framework issued by the Committee of Sponsoring Organizations of the Treadway Commission. Based on our evaluation under the framework in Internal Control—Integrated Framework, our management concluded that our internal control over financial reporting was effective as of December 31, 2011.
Ernst & Young LLP, the independent registered public accounting firm that audited the consolidated financial statements included in this Annual Report on Form 10-K, has also audited our internal control over financial reporting as of December 31, 2011, as stated in their report which is included herein.
| Item 9B. | Other Information |
None
45
Table of Contents
Report of Independent Registered Public Accounting Firm
The Board of Directors and Stockholders
Novatel Wireless, Inc.:
We have audited Novatel Wireless Inc.’s internal control over financial reporting as of December 31, 2011, based on criteria established in Internal Control—Integrated Framework issued by the Committee of Sponsoring Organizations of the Treadway Commission (the COSO criteria). Novatel Wireless, Inc.’s management is responsible for maintaining effective internal control over financial reporting, and for its assessment of the effectiveness of internal control over financial reporting included in the accompanying Management’s Report on Internal Control Over Financial Reporting. Our responsibility is to express an opinion on the company’s internal control over financial reporting based on our audit.
We conducted our audit in accordance with the standards of the Public Company Accounting Oversight Board (United States). Those standards require that we plan and perform the audit to obtain reasonable assurance about whether effective internal control over financial reporting was maintained in all material respects. Our audit included obtaining an understanding of internal control over financial reporting, assessing the risk that a material weakness exists, testing and evaluating the design and operating effectiveness of internal control based on the assessed risk, and performing such other procedures as we considered necessary in the circumstances. We believe that our audit provides a reasonable basis for our opinion.
A company’s internal control over financial reporting is a process designed to provide reasonable assurance regarding the reliability of financial reporting and the preparation of financial statements for external purposes in accordance with generally accepted accounting principles. A company’s internal control over financial reporting includes those policies and procedures that (1) pertain to the maintenance of records that, in reasonable detail, accurately and fairly reflect the transactions and dispositions of the assets of the company; (2) provide reasonable assurance that transactions are recorded as necessary to permit preparation of financial statements in accordance with generally accepted accounting principles, and that receipts and expenditures of the company are being made only in accordance with authorizations of management and directors of the company; and (3) provide reasonable assurance regarding prevention or timely detection of unauthorized acquisition, use, or disposition of the company’s assets that could have a material effect on the financial statements.
Because of its inherent limitations, internal control over financial reporting may not prevent or detect misstatements. Also, projections of any evaluation of effectiveness to future periods are subject to the risk that controls may become inadequate because of changes in conditions, or that the degree of compliance with the policies or procedures may deteriorate.
In our opinion, Novatel Wireless, Inc. maintained, in all material respects, effective internal control over financial reporting as of December 31, 2011, based on the COSO criteria.
We also have audited, in accordance with the standards of the Public Company Accounting Oversight Board (United States), the consolidated balance sheets of Novatel Wireless, Inc. as of December 31, 2011 and 2010, and the related consolidated statements of operations, stockholders’ equity and comprehensive income (loss), and cash flows for each of the three years in the period ended December 31, 2011 of Novatel Wireless, Inc. and our report dated March 5, 2012 expressed an unqualified opinion thereon.
/s/ ERNST & YOUNG LLP
San Diego, California
March 5, 2012
46
Table of Contents
PART III
| Item 10. | Directors, Executive Officers and Corporate Governance |
(a) Identification of Directors. The information under the caption “Election of Directors” appearing in the Proxy Statement to be filed for the 2012 Annual Meeting of Stockholders is incorporated herein by reference.
(b) Identification of Executive Officers. The information under the caption “Executive Officers” appearing in the Proxy Statement to be filed for the 2012 Annual Meeting of Stockholders is incorporated herein by reference.
(c) Compliance with Section 16(a) of the Exchange Act. The information under the caption “Section 16(a) Beneficial Ownership Reporting Compliance” appearing in the Proxy Statement to be filed for the 2012 Annual Meeting of Stockholders is incorporated herein by reference.
(d) Code of Ethics. We have adopted a Code of Business Conduct and Ethics which, together with the policies referred to therein, is applicable to all of our directors, officers and employees. The Code of Business Conduct and Ethics is intended to cover all areas of professional conduct, including conflicts of interest, disclosure obligations, insider trading and confidential information, as well as compliance with all laws, rules and regulations applicable to our business. We encourage all employees, officers and directors to promptly report any violations of any of our policies. The Code of Business Conduct and Ethics is posted on our website at www.novatelwireless.com in the Investor tab under “Corporate Governance.” In the event that a substantive amendment to, or a waiver from, a provision of the Code of Business Conduct and Ethics that applies to our principal executive officer or principal financial and accounting officer is necessary, we intend to post such information on our website.
(e) Audit Committee. The information under the caption “The Board, Its Committees and Its Compensation—Audit Committee” appearing in the Proxy Statement to be filed for the 2012 Annual Meeting of Stockholders is incorporated herein by reference.
| Item 11. | Executive Compensation |
The information under the headings “Executive Compensation,” “The Board, Its Committees and Its Compensation—Director Compensation,” “Compensation Discussion and Analysis” and “Compensation Committee Report” appearing in the Proxy Statement to be filed for the 2012 Annual Meeting of Stockholders is incorporated herein by reference.
| Item 12. | Security Ownership of Certain Beneficial Owners and Management and Related Stockholder Matters |
The information under the headings “Security Ownership of Management and Certain Beneficial Owners” and “Equity Compensation Plan Information” appearing in the Proxy Statement to be filed for the 2012 Annual Meeting of Stockholders is incorporated herein by reference.
| Item 13. | Certain Relationships and Related Transactions, and Director Independence |
The information under the headings “Review and Approval of Transactions with Related Parties” and “The Board, Its Committees and Its Compensation—Director Independence” appearing in the Proxy Statement to be filed for the 2012 Annual Meeting of Stockholders is incorporated herein by reference.
| Item 14. | Principal Accountant Fees and Services |
The information under the heading “Independent Public Accountants” appearing in the Proxy Statement to be filed for the 2012 Annual Meeting of Stockholders is incorporated herein by reference.
47
Table of Contents
PART IV
| Item 15. | Exhibits and Financial Statement Schedules |
(a) 1. Index to consolidated financial statements
See Index to consolidated financial statements on page F-1.
2. Index to financial statement schedules
The following financial statement schedules for the years ended December 31, 2011, 2010, and 2009 should be read in conjunction with the consolidated financial statements, and related notes thereto.
| Schedule |
Page | |||
| F-35 | ||||
Schedules not listed above have been omitted because they are not applicable or are not required or the information required to be set forth therein is included in the consolidated financial statements or related notes thereto.
(b) Exhibits
The following Exhibits are filed as part of, or incorporated by reference into this report:
| Exhibit Number |
Description | |
| 2.1 | Agreement and Plan of Merger, dated as of November 5, 2010, by and between Novatel Wireless, Inc., England Acquisition Corp. and Enfora, Inc. (incorporated by reference to Exhibit 2.1 to the Company’s Current Report on Form 8-K, filed on November 10, 2010). | |
| 3.1 | Amended and Restated Certificate of Incorporation (incorporated by reference to Exhibit 3.1 to the Company’s Annual Report on Form 10-K for the year ended December 31, 2000, filed March 27, 2001). | |
| 3.2 | Certificate of Amendment to Amended and Restated Certificate of Incorporation (incorporated by reference to Exhibit 3.1 to the Company’s Quarterly Report on Form 10-Q for the period ended September 30, 2002, filed November 14, 2002). | |
| 3.3 | Certificate of Amendment to Amended and Restated Certificate of Incorporation (incorporated by reference to Exhibit 3.2 to the Company’s Amendment No. 1 to Form 10-K on Form 10-K/A for the year ended December 31, 2003, filed March 31, 2004). | |
| 3.4 | Amended and Restated Certificate of Designation of Series A Convertible Preferred Stock (incorporated by reference to Exhibit 3.4 to the Company’s Amendment No. 1 to Form 10-K on Form 10-K/A for the year ended December 31, 2003, filed March 31, 2004). | |
| 3.5 | Certificate of Designation of Series B Convertible Preferred Stock (incorporated by reference to Exhibit 3.5 to the Company’s Amendment No. 1 to Form 10-K on Form 10-K/A for the year ended December 31, 2003, filed March 31, 2004). | |
| 3.6 | Bylaws (incorporated by reference to Exhibit 3.2 to the Company’s Annual Report on Form 10-K for the year ended December 31, 2000, filed on March 27, 2001). | |
| 4.1 | Amended and Restated Registration Rights Agreement, dated as of June 15, 1999, by and among the Company and certain of its stockholders (incorporated by reference to Exhibit 10.4 to the Company’s Registration Statement on Form S-1 (No. 333-42570), filed July 28, 2000, as amended). | |
48
Table of Contents
| Exhibit Number |
Description | |
| 4.2 | Form of Securities Purchase Agreement entered into in connection with the Company’s 2003 Series B Convertible Preferred Stock Financing (incorporated by reference to Exhibit 4.1 to the Company’s Current Report on Form 8-K, filed March 28, 2003). | |
| 4.3 | Registration Rights Agreement, dated as of March 12, 2003, entered into in connection with the Company’s 2003 Series B Convertible Preferred Stock Financing (incorporated by reference to Exhibit 4.8 to the Company’s Current Report on Form 8-K, filed March 28, 2003). | |
| 4.4 | Registration Rights Agreement, dated as of January 13, 2004, entered into in connection with the Company’s January 2004 Common Stock and Warrant Financing Transaction (incorporated by reference to Exhibit 10.21 to the Company’s Annual Report on Form 10-K for the year ended December 31, 2003, filed March 15, 2004). | |
| 10.1* | Amended and Restated 1997 Employee Stock Option Plan (“1997 Plan”) (incorporated by reference to Exhibit 10.1 to the Company’s Registration Statement on Form S-1 (No. 333-42570), filed July 28, 2000 as amended). | |
| 10.2* | Amended and Restated Novatel Wireless, Inc. 2000 Stock Incentive Plan (“2000 Plan”) (incorporated by reference to Exhibit 10.1 to the Company’s Quarterly Report on Form 10-Q for the quarter ended June 30, 2007, filed August 9, 2007). | |
| 10.3* | Form of Executive Officer Stock Option Agreement under the 2000 Plan (incorporated by reference to Exhibit 10.3 to the Company’s Annual Report on Form 10-K for the year ended December 31, 2005, filed March 16, 2006). | |
| 10.4* | Form of Director Stock Option Agreement under the 2000 Plan (incorporated by reference to Exhibit 10.4 to the Company’s Annual Report on Form 10-K for the year ended December 31, 2005, filed March 16, 2006). | |
| 10.5* | Form of Amendment of Stock Option Agreements, dated July 20, 2006, by and between the Company and Optionee with respect to the 1997 Plan (incorporated by reference to Exhibit 10.2 to the Company’s Quarterly Report on Form 10-Q for the period ended September 30, 2006, filed November 9, 2006). | |
| 10.6* | Form of Amendment of Stock Option Agreements, dated July 20, 2006, by and between the Company and Optionee with respect to the 2000 Plan (incorporated by reference to Exhibit 10.3 to the Company’s Quarterly Report on Form 10-Q for the period ended September 30, 2006, filed November 9, 2006). | |
| 10.7* | Form of Amendment of Stock Option Agreements, dated July 20, 2006, by and between the Company and Optionee with respect to the 2000 Plan and grants made pursuant thereto in 2004 and subsequently (incorporated by reference to Exhibit 10.4 to the Company’s Quarterly Report on Form 10-Q for the period ended September 30, 2006, filed November 9, 2006). | |
| 10.8* | Amended and Restated Novatel Wireless, Inc. 2000 Employee Stock Purchase Plan (incorporated by reference to Appendix A to the Company’s Proxy Statement on Schedule 14A filed May 2, 2011). | |
| 10.9* | Form of Restricted Share Award Agreement for restricted stock granted to non-employee directors (incorporated by reference to Exhibit 10.10 to the Company’s Quarterly Report on Form 10-Q for the period ended June 30, 2006, filed August 9, 2006). | |
| 10.10* | Form of Restricted Share Award Agreement for restricted stock granted to executive officers (incorporated by reference to Exhibit 10.11 to the Company’s Quarterly Report on Form 10-Q for the period ended June 30, 2006, filed August 9, 2006). | |
| 10.11* | Form of Indemnification Agreement by and between the Company and each of its executive officers and directors (incorporated by reference to Exhibit 10.1 to the Company’s Quarterly Report on Form 10-Q for the period ended September 30, 2009, filed November 2, 2009). | |
49
Table of Contents
| Exhibit Number |
Description | |
| 10.12* | Form of Change of Control Letter Agreement by and between the Company and certain of its executive officers (incorporated by reference to Exhibit 10.1 to the Company’s Quarterly Report on Form 10-Q for the period ended June 30, 2004, filed August 16, 2004). | |
| 10.13* | Employment Agreement, dated November 2, 2007, by and between Peter V. Leparulo and the Company (incorporated by reference to Exhibit 10.1 to the Company’s Quarterly Report on Form 10-Q for the quarter ended September 30, 2007, filed November 9, 2007). | |
| 10.14* | 2009 Omnibus Incentive Compensation Plan (incorporated by reference to Appendix B to the Company’s Proxy Statement on Schedule 14A, filed May 2, 2011). | |
| 10.15* | 2010 Senior Management Incentive Plan (incorporated by reference to Exhibit 10.1 to the Company’s Current Report on Form 8-K, filed September 13, 2010). | |
| 10.16* | Form of Severance Agreement between Novatel Wireless, Inc. and each of Kenneth G. Leddon and Robert M. Hadley (incorporated by reference to Exhibit 10.1 to the Company’s Current Report on Form 8-K, filed August 2, 2010. | |
| 10.17 | 2011 Senior Management Incentive Plan (incorporated by reference to Exhibit 10.1 to the Company’s Quarterly Report on Form 10-Q for the period ended June 30, 2011, filed on August 9, 2011). | |
| 21** | Subsidiaries of Novatel Wireless, Inc. | |
| 23.1** | Consent of Independent Registered Public Accounting Firm. | |
| 24 | Power of Attorney (See signature page). | |
| 31.1** | Certification of our Principal Executive Officer adopted pursuant to Section 302 of the Sarbanes-Oxley Act of 2002. | |
| 31.2** | Certification of our Principal Financial Officer adopted pursuant to Section 302 of the Sarbanes-Oxley Act of 2002. | |
| 32.1** | Certification of Principal Executive Officer and Principal Financial Officer pursuant to 18 U.S.C. Section 1350, as adopted pursuant to Section 906 of the Sarbanes-Oxley Act of 2002. | |
| 101 | The following financial statements and footnotes from the Novatel Wireless, Inc. Annual Report on Form 10-K for the year ended December 31, 2011 formatted in eXtensible Business Reporting Language (XBRL): (i) Consolidated Balance Sheets; (ii) Consolidated Statements of Operations; (iii) Consolidated Statements of Stockholders’ Equity and Comprehensive Income (Loss); (iv) Consolidated Statements of Cash Flows; and (v) the Notes to Consolidated Financial Statements, tagged as blocks of text. Detailed tagging of financial statement footnotes and schedules will be required in Q2 10-Q. | |
| * | Management contract, compensatory plan or arrangement |
| ** | Filed herewith |
50
Table of Contents
Pursuant to the requirements of Section 13 or 15(d) of the Securities Exchange Act of 1934, the Registrant has duly caused this report to be signed on its behalf by the undersigned, thereunto duly authorized.
| Date: March 5, 2012 |
NOVATEL WIRELESS, INC. | |||||
| By: |
/s/ PETER LEPARULO | |||||
| Peter Leparulo | ||||||
| Chairman and Chief Executive Officer (Principal Executive Officer) | ||||||
POWER OF ATTORNEY
Know all men by these presents, that each person whose signature appears below constitutes and appoints Peter Leparulo and Kenneth Leddon, or either of them, as his true and lawful attorneys-in-fact and agents, with full power of substitution, for him and in his name, place and stead, in any and all capacities, to sign any and all amendments to this Annual Report on Form 10-K, and to file the same, with all exhibits thereto, and other documents in connection therewith, with the Securities and Exchange Commission, granting unto said attorneys-in-fact and agents, full power and authority to do and perform each and every act and thing requisite and necessary to be done in connection therewith as fully to all intents and purposes as he might or could do in person, hereby ratifying and confirming all that said attorneys-in-fact and agents, or their substitute or substitutes may lawfully do or cause to be done by virtue hereof.
Pursuant to the requirements of the Securities Exchange Act of 1934, this Annual Report on Form 10-K has been signed below by the following persons on behalf of the Registrant and in the capacities and on the dates indicated.
| Signature |
Title |
Date | ||
| /s/ PETER LEPARULO Peter Leparulo |
Chairman and Chief Executive Officer (Principal Executive Officer) |
March 5, 2012 | ||
| /s/ KENNETH LEDDON Kenneth Leddon |
Senior Vice President and Chief Financial Officer (Principal Financial and Accounting Officer) |
March 5, 2012 | ||
| /s/ RUSSELL C. GERNS Russell C. Gerns |
Director |
March 5, 2012 | ||
| /s/ JAMES LEDWITH James Ledwith |
Director |
March 5, 2012 | ||
| /s/ JOHN D. WAKELIN John D. Wakelin |
Director |
March 5, 2012 | ||
| /s/ DAVID A. WERNER David A. Werner |
Director |
March 5, 2012 | ||
51
Table of Contents
INDEX TO CONSOLIDATED FINANCIAL STATEMENTS
| F-2 | ||
| F-3 | ||
| F-4 | ||
| Consolidated Statements of Stockholders’ Equity and Comprehensive Income (Loss) |
F-5 | |
| F-6 | ||
| F-7 | ||
| F-35 |
F-1
Table of Contents
Report of Independent Registered Public Accounting Firm
The Board of Directors and Stockholders
Novatel Wireless, Inc.
We have audited the accompanying consolidated balance sheets of Novatel Wireless, Inc. as of December 31, 2011 and 2010, and the related consolidated statements of operations, stockholders’ equity and comprehensive income (loss), and cash flows for each of the three years in the period ended December 31, 2011. Our audits also included the financial statement schedule for each of the three years in the period ended December 31, 2011 listed in the index at Item 15(a). These financial statements and schedule are the responsibility of the Company’s management. Our responsibility is to express an opinion on these financial statements and schedule based on our audits.
We conducted our audits in accordance with the standards of the Public Company Accounting Oversight Board (United States). Those standards require that we plan and perform the audit to obtain reasonable assurance about whether the financial statements are free of material misstatement. An audit includes examining, on a test basis, evidence supporting the amounts and disclosures in the financial statements. An audit also includes assessing the accounting principles used and significant estimates made by management, as well as evaluating the overall financial statement presentation. We believe that our audits provide a reasonable basis for our opinion.
In our opinion, the financial statements referred to above present fairly, in all material respects, the consolidated financial position of Novatel Wireless, Inc. at December 31, 2011 and 2010, and the consolidated results of its operations and its cash flows for each of the three years in the period ended December 31, 2011, in conformity with U.S. generally accepted accounting principles. Also, in our opinion, the related financial statement schedule for each of the three years in the period ended December 31, 2011, when considered in relation to the basic financial statements taken as a whole, presents fairly in all material respects the information set forth therein.
We also have audited, in accordance with the standards of the Public Company Accounting Oversight Board (United States), Novatel Wireless, Inc.’s internal control over financial reporting as of December 31, 2011, based on the criteria established in Internal Control-Integrated Framework issued by the Committee of Sponsoring Organizations of the Treadway Commission and our report dated March 5, 2012 expressed an unqualified opinion thereon.
/s/ ERNST & YOUNG LLP
San Diego, California
March 5, 2012
F-2
Table of Contents
CONSOLIDATED BALANCE SHEETS
(in thousands, except per share data)
| As of December 31, | ||||||||
| 2011 | 2010 | |||||||
| ASSETS | ||||||||
| Current assets: |
||||||||
| Cash and cash equivalents |
$ | 47,069 | $ | 17,375 | ||||
| Marketable securities |
28,267 | 59,775 | ||||||
| Accounts receivable, net of allowance for doubtful accounts of $245 in 2011 and $228 in 2010 |
36,849 | 63,570 | ||||||
| Inventories |
42,279 | 43,094 | ||||||
| Deferred tax assets, net |
2,011 | 218 | ||||||
| Prepaid expenses and other |
3,712 | 6,961 | ||||||
|
|
|
|
|
|||||
| Total current assets |
160,187 | 190,993 | ||||||
|
|
|
|
|
|||||
| Property and equipment, net of accumulated depreciation of $59,217 in 2011 and $48,223 in 2010 |
18,496 | 21,281 | ||||||
| Marketable securities |
13,495 | 20,676 | ||||||
| Intangible assets, net of accumulated amortization of $10,899 in 2011 and $4,019 in 2010 |
35,702 | 44,265 | ||||||
| Goodwill |
19,772 | 22,258 | ||||||
| Deferred tax assets, net |
1,023 | 2,103 | ||||||
| Other assets |
504 | 532 | ||||||
|
|
|
|
|
|||||
| Total assets |
$ | 249,179 | $ | 302,108 | ||||
|
|
|
|
|
|||||
| LIABILITIES AND STOCKHOLDERS’ EQUITY | ||||||||
| Current liabilities: |
||||||||
| Accounts payable |
$ | 54,030 | $ | 77,769 | ||||
| Accrued expenses |
25,044 | 26,050 | ||||||
|
|
|
|
|
|||||
| Total current liabilities |
79,074 | 103,819 | ||||||
| Capital lease obligations, long-term |
0 | 55 | ||||||
| Other long-term liabilities |
4,080 | 12,831 | ||||||
|
|
|
|
|
|||||
| Total liabilities |
83,154 | 116,705 | ||||||
|
|
|
|
|
|||||
| Commitments and contingencies |
||||||||
| Stockholders’ equity: |
||||||||
| Series A and B preferred stock, par value $0.001; 2,000 shares authorized and none outstanding |
0 | 0 | ||||||
| Common stock, par value $0.001; 50,000 shares authorized, 32,262 and 31,852 shares issued and outstanding at December 31, 2011 and 2010, respectively |
32 | 32 | ||||||
| Additional paid-in capital |
429,813 | 424,270 | ||||||
| Accumulated other comprehensive (loss) income |
(8 | ) | 21 | |||||
| Accumulated deficit |
(238,812 | ) | (213,920 | ) | ||||
|
|
|
|
|
|||||
| 191,025 | 210,403 | |||||||
| Treasury stock at cost; 2,436 common shares at December 31, 2011 and 2010 |
(25,000 | ) | (25,000 | ) | ||||
|
|
|
|
|
|||||
| Total stockholders’ equity |
166,025 | 185,403 | ||||||
|
|
|
|
|
|||||
| Total liabilities and stockholders’ equity |
$ | 249,179 | $ | 302,108 | ||||
|
|
|
|
|
|||||
See accompanying notes to consolidated financial statements
F-3
Table of Contents
CONSOLIDATED STATEMENTS OF OPERATIONS
(in thousands, except per share data)
| Year Ended December 31, | ||||||||||||
| 2011 | 2010 | 2009 | ||||||||||
| Net revenues |
$ | 402,862 | $ | 338,942 | $ | 337,422 | ||||||
| Cost of net revenues |
318,270 | 272,648 | 249,764 | |||||||||
|
|
|
|
|
|
|
|||||||
| Gross profit |
84,592 | 66,294 | 87,658 | |||||||||
|
|
|
|
|
|
|
|||||||
| Operating costs and expenses: |
||||||||||||
| Research and development |
61,392 | 48,906 | 44,892 | |||||||||
| Sales and marketing |
29,830 | 20,978 | 19,857 | |||||||||
| General and administrative |
21,600 | 21,233 | 20,159 | |||||||||
| Amortization of acquired intangibles |
2,220 | 179 | 0 | |||||||||
| Goodwill impairment |
3,277 | 0 | 0 | |||||||||
|
|
|
|
|
|
|
|||||||
| Total operating costs and expenses |
118,319 | 91,296 | 84,908 | |||||||||
|
|
|
|
|
|
|
|||||||
| Operating income (loss) |
(33,727 | ) | (25,002 | ) | 2,750 | |||||||
| Other income (expense): |
||||||||||||
| Interest income (expense), net |
384 | (2,518 | ) | 1,374 | ||||||||
| Other income (expense), net |
(1,052 | ) | 1,963 | 315 | ||||||||
|
|
|
|
|
|
|
|||||||
| Income (loss) before taxes |
(34,395 | ) | (25,557 | ) | 4,439 | |||||||
| Income tax expense (benefit) |
(9,503 | ) | 7,893 | 527 | ||||||||
|
|
|
|
|
|
|
|||||||
| Net income (loss) |
$ | (24,892 | ) | $ | (33,450 | ) | $ | 3,912 | ||||
|
|
|
|
|
|
|
|||||||
| Per share data: |
||||||||||||
| Net income (loss) per share: |
||||||||||||
| Basic |
$ | (0.78 | ) | $ | (1.06 | ) | $ | 0.13 | ||||
|
|
|
|
|
|
|
|||||||
| Diluted |
$ | (0.78 | ) | $ | (1.06 | ) | $ | 0.13 | ||||
|
|
|
|
|
|
|
|||||||
| Weighted average shares used in computation of basic and diluted net income (loss) per share: |
||||||||||||
| Basic |
32,043 | 31,494 | 30,648 | |||||||||
|
|
|
|
|
|
|
|||||||
| Diluted |
32,043 | 31,494 | 31,224 | |||||||||
|
|
|
|
|
|
|
|||||||
See accompanying notes to consolidated financial statements
F-4
Table of Contents
CONSOLIDATED STATEMENTS OF STOCKHOLDERS’ EQUITY AND COMPREHENSIVE INCOME (LOSS)
(in thousands)
| Common Stock | Additional Paid-in Capital |
Treasury Stock |
Accumulated Deficit |
Accumulated Other Comprehensive Income (Loss) |
Total Stockholders’ Equity |
Total Comprehensive Income (Loss) |
||||||||||||||||||||||||||
| Shares | Amount | |||||||||||||||||||||||||||||||
| Balance, December 31, 2008 |
30,327 | $ | 30 | $ | 407,252 | $ | (25,000 | ) | $ | (184,382 | ) | $ | 62 | $ | 197,962 | |||||||||||||||||
| Exercise of stock options, vesting of restricted stock units and shares issued under employee stock purchase plan |
765 | 1 | 2,669 | 0 | 0 | 0 | 2,670 | |||||||||||||||||||||||||
| Taxes withheld on net settled exercises |
0 | 0 | (224 | ) | 0 | 0 | 0 | (224 | ) | |||||||||||||||||||||||
| Share-based compensation |
0 | 0 | 6,882 | 0 | 0 | 0 | 6,882 | |||||||||||||||||||||||||
| Net income |
0 | 0 | 0 | 0 | 3,912 | 0 | 3,912 | $ | 3,912 | |||||||||||||||||||||||
| Other comprehensive loss: |
||||||||||||||||||||||||||||||||
| Unrealized loss on marketable securities, net of taxes |
0 | 0 | 0 | 0 | 0 | (47 | ) | (47 | ) | (47 | ) | |||||||||||||||||||||
|
|
|
|
|
|
|
|
|
|
|
|
|
|
|
|
|
|||||||||||||||||
| Total comprehensive income |
$ | 3,865 | ||||||||||||||||||||||||||||||
|
|
|
|||||||||||||||||||||||||||||||
| Balance, December 31, 2009 |
31,092 | 31 | 416,579 | (25,000 | ) | (180,470 | ) | 15 | 211,155 | |||||||||||||||||||||||
| Exercise of stock options, vesting of restricted stock units and shares issued under employee stock purchase plan |
760 | 1 | 1,490 | 0 | 0 | 0 | 1,491 | |||||||||||||||||||||||||
| Net tax effect from stock options exercised |
0 | 0 | (270 | ) | 0 | 0 | 0 | (270 | ) | |||||||||||||||||||||||
| Share-based compensation |
0 | 0 | 6,471 | 0 | 0 | 0 | 6,471 | |||||||||||||||||||||||||
| Net loss |
0 | 0 | 0 | 0 | (33,450 | ) | 0 | (33,450 | ) | $ | (33,450 | ) | ||||||||||||||||||||
| Other comprehensive income: |
||||||||||||||||||||||||||||||||
| Unrealized gain on marketable securities, net of taxes |
0 | 0 | 0 | 0 | 0 | 6 | 6 | 6 | ||||||||||||||||||||||||
|
|
|
|
|
|
|
|
|
|
|
|
|
|
|
|
|
|||||||||||||||||
| Total comprehensive loss |
$ | (33,444 | ) | |||||||||||||||||||||||||||||
|
|
|
|||||||||||||||||||||||||||||||
| Balance, December 31, 2010 |
31,852 | 32 | 424,270 | (25,000 | ) | (213,920 | ) | 21 | 185,403 | |||||||||||||||||||||||
| Exercise of stock options, vesting of restricted stock units and shares issued under employee stock purchase plan |
410 | 0 | 504 | 0 | 0 | 0 | 504 | |||||||||||||||||||||||||
| Taxes withheld on net settled vesting of restricted stock units |
0 | 0 | (700 | ) | 0 | 0 | 0 | (700 | ) | |||||||||||||||||||||||
| Net tax effect from stock options exercised |
0 | 0 | (244 | ) | 0 | 0 | 0 | (244 | ) | |||||||||||||||||||||||
| Share-based compensation |
0 | 0 | 5,983 | 0 | 0 | 0 | 5,983 | |||||||||||||||||||||||||
| Net loss |
0 | 0 | 0 | 0 | (24,892 | ) | 0 | (24,892 | ) | $ | (24,892 | ) | ||||||||||||||||||||
| Other comprehensive loss: |
||||||||||||||||||||||||||||||||
| Unrealized loss on marketable securities, net of taxes |
0 | 0 | 0 | 0 | 0 | (29 | ) | (29 | ) | (29 | ) | |||||||||||||||||||||
|
|
|
|
|
|
|
|
|
|
|
|
|
|
|
|
|
|||||||||||||||||
| Total comprehensive loss |
$ | (24,921 | ) | |||||||||||||||||||||||||||||
|
|
|
|||||||||||||||||||||||||||||||
| Balance, December 31, 2011 |
32,262 | $ | 32 | $ | 429,813 | $ | (25,000 | ) | $ | (238,812 | ) | $ | (8 | ) | $ | 166,025 | ||||||||||||||||
|
|
|
|
|
|
|
|
|
|
|
|
|
|
|
|||||||||||||||||||
See accompanying notes to consolidated financial statements
F-5
Table of Contents
CONSOLIDATED STATEMENTS OF CASH FLOWS
(in thousands)
| Year Ended December 31, | ||||||||||||
| 2011 | 2010 | 2009 | ||||||||||
| Cash flows from operating activities: |
||||||||||||
| Net income (loss) |
$ | (24,892 | ) | $ | (33,450 | ) | $ | 3,912 | ||||
| Adjustments to reconcile net income (loss) to net cash provided by (used in) operating activities: |
||||||||||||
| Amortization of debt issuance costs |
0 | 541 | 0 | |||||||||
| Loan fees recognized on extinguishment of debt |
0 | 2,370 | 0 | |||||||||
| Depreciation and amortization |
17,868 | 11,711 | 12,994 | |||||||||
| Goodwill impairment |
3,277 | 0 | 0 | |||||||||
| Gain on disposal of fixed assets |
0 | 0 | (11 | ) | ||||||||
| Impairment loss on equipment and intangible assets |
203 | 167 | 92 | |||||||||
| Provision for bad debts |
40 | 141 | 35 | |||||||||
| Net impairment loss on marketable equity securities |
346 | 0 | 0 | |||||||||
| Inventory provision |
689 | 1,874 | 2,305 | |||||||||
| Share-based compensation expense |
5,983 | 6,471 | 6,882 | |||||||||
| Excess tax benefits from equity based awards |
0 | (112 | ) | (282 | ) | |||||||
| Non-cash income tax expense (benefit) |
(9,185 | ) | 7,766 | (1,798 | ) | |||||||
| Changes in assets and liabilities: |
||||||||||||
| Accounts receivable |
26,437 | (19,963 | ) | 3,738 | ||||||||
| Inventories |
122 | (9,527 | ) | (5,514 | ) | |||||||
| Prepaid expenses and other assets |
3,661 | (2,461 | ) | 4,826 | ||||||||
| Accounts payable |
(24,293 | ) | 46,020 | 3,930 | ||||||||
| Accrued expenses, income taxes and other |
(1,787 | ) | (5,337 | ) | 5,552 | |||||||
|
|
|
|
|
|
|
|||||||
| Net cash provided by (used in) operating activities |
(1,531 | ) | 6,211 | 36,661 | ||||||||
|
|
|
|
|
|
|
|||||||
| Cash flows from investing activities: |
||||||||||||
| Purchases of property and equipment |
(5,987 | ) | (10,785 | ) | (5,770 | ) | ||||||
| Acquisition of business, net of cash acquired |
0 | (72,247 | ) | 0 | ||||||||
| Purchases of intangible assets |
(284 | ) | (110 | ) | (1,066 | ) | ||||||
| Purchases of securities |
(36,992 | ) | (178,712 | ) | (76,967 | ) | ||||||
| Securities maturities/sales |
74,922 | 174,286 | 66,399 | |||||||||
|
|
|
|
|
|
|
|||||||
| Net cash provided by (used in) investing activities |
31,659 | (87,568 | ) | (17,404 | ) | |||||||
|
|
|
|
|
|
|
|||||||
| Cash flows from financing activities: |
||||||||||||
| Proceeds from the issuance of short-term debt, net of issuance costs |
12,000 | 27,415 | 0 | |||||||||
| Principal repayments of short-term debt |
(12,000 | ) | (30,000 | ) | 0 | |||||||
| Principal payments under capital lease obligations |
(109 | ) | (134 | ) | (197 | ) | ||||||
| Proceeds from exercise of stock options and ESPP net of taxes paid on vested restricted stock units |
(196 | ) | 1,491 | 2,670 | ||||||||
| Excess tax benefits from stock options exercised |
0 | 112 | 282 | |||||||||
| Deposit of restricted funds |
0 | (188,890 | ) | 0 | ||||||||
| Remittance from restricted funds |
0 | 188,890 | 0 | |||||||||
|
|
|
|
|
|
|
|||||||
| Net cash provided by (used in) financing activities |
(305 | ) | (1,116 | ) | 2,755 | |||||||
| Effect of exchange rates on cash and cash equivalents |
(129 | ) | (177 | ) | 280 | |||||||
|
|
|
|
|
|
|
|||||||
| Net increase (decrease) in cash and cash equivalents |
29,694 | (82,650 | ) | 22,292 | ||||||||
| Cash and cash equivalents, beginning of year |
17,375 | 100,025 | 77,733 | |||||||||
|
|
|
|
|
|
|
|||||||
| Cash and cash equivalents, end of year |
$ | 47,069 | $ | 17,375 | $ | 100,025 | ||||||
|
|
|
|
|
|
|
|||||||
| Supplemental disclosures of cash flow information: |
||||||||||||
| Cash paid during the year for: |
||||||||||||
| Interest |
$ | 8 | $ | 181 | $ | 12 | ||||||
| Income taxes |
$ | 112 | $ | 299 | $ | 294 | ||||||
| Supplemental disclosures of non-cash investing activities: |
||||||||||||
| Building rent incentives to fund leasehold improvements |
$ | 1,869 | $ | 0 | $ | 0 | ||||||
| Supplemental disclosures of non-cash financing activities: |
||||||||||||
| Marketable equity securities received in settlement of note receivable |
$ | 386 | $ | 0 | $ | 0 | ||||||
| Accrued debt issuance costs |
$ | 0 | $ | 326 | $ | 0 | ||||||
See accompanying notes to unaudited consolidated financial statements.
F-6
Table of Contents
NOVATEL WIRELESS, INC.
NOTES TO CONSOLIDATED FINANCIAL STATEMENTS
| 1. | Nature of Business and Significant Accounting Policies |
Novatel Wireless, Inc. (the “Company” or “our”) is a provider of wireless broadband access solutions for the worldwide mobile communications market. Our broad range of products principally includes intelligent mobile hotspots, USB modems, embedded PCI and wireless PC-card modems, and communications and applications software. In addition, through our acquisition of Enfora, Inc. (“Enfora”) on November 30, 2010, we provide asset-management solutions utilizing wireless technology and machine-to-machine (“M2M”) communications devices.
Principles of Consolidation
The consolidated financial statements include the accounts of the Company and its wholly-owned subsidiaries. All intercompany transactions and balances have been eliminated in consolidation.
Use of Estimates
The preparation of financial statements in conformity with accounting principles generally accepted in the United States of America (“GAAP”) requires management to make estimates and assumptions. These estimates and assumptions affect the reported amounts of assets, liabilities, revenues and expenses, and disclosure of contingent liabilities. Actual results could differ materially from these estimates. Significant estimates include allowance for doubtful accounts receivable, provision for excess and obsolete inventory, valuation of intangible and long-lived assets including goodwill valuation, contingent consideration, litigation, provision for warranty costs, income taxes and share-based compensation expense.
Difficult global economic conditions, tight credit markets, volatile equity, foreign currency and energy markets and declines in consumer spending have combined to increase the uncertainty inherent in these estimates and assumptions. As future events and their effects cannot be determined with precision, actual results could differ significantly from these estimates, particularly those related to the condition of the economy.
Cash and Cash Equivalents
Cash and cash equivalents include highly liquid investments with original maturities of three months or less at the time of acquisition. Cash and cash equivalents consist of demand deposits and money market funds. Cash and cash equivalents are recorded at market value, which approximates cost. Gains and losses associated with the Company’s foreign currency denominated demand deposits are recorded as a component of other income (expense).
Allowance for Doubtful Accounts Receivable
The Company provides an allowance for its accounts receivable for estimated losses that may result from its customers’ inability to pay. The Company determines the amount of the allowance by analyzing known uncollectible accounts, aged receivables, economic conditions, historical losses, and changes in customer payment cycles and our customers’ credit-worthiness. Amounts later determined and specifically identified to be uncollectible are charged or written off against this allowance. To minimize the likelihood of uncollectibility, the Company reviews its customers’ credit-worthiness periodically based on credit scores generated by independent credit reporting services, its experience with its customers and the economic condition of its customers’ industries. Material differences may result in the amount and timing of expense for any period if the Company were to make different judgments or utilize different estimates. If the financial condition of the Company’s customers deteriorates resulting in an impairment of their ability to make payments, additional allowances may be required.
F-7
Table of Contents
Marketable Securities
Marketable securities predominantly consist of highly liquid debt investments with a maturity of greater than three months when purchased. The Company holds an insignificant amount of marketable equity securities. All of the Company’s marketable securities are treated as “available-for-sale” as defined in the accounting guidance. While it is the Company’s intent to hold its debt securities until maturity, the Company may sell certain securities for cash flow purposes. Thus, the Company’s marketable securities are classified as available-for-sale and are carried on the balance sheet at fair value with the related unrealized gains and losses included in accumulated other comprehensive income (loss), a component of stockholders’ equity. Realized gains and losses on the sale of marketable securities are determined using the specific-identification method. The Company determines the fair value of its financial assets and liabilities by reference to the hierarchy of inputs which consists of three levels: Level 1 fair values are valuations based on quoted market prices in active markets for identical assets or liabilities that the entity has the ability to access; Level 2 fair values are those valuations based on quoted prices for similar assets or liabilities, quoted prices in markets that are not active, or other inputs that are observable or can be corroborated by observable data for substantially the full term of the assets or liabilities; and Level 3 fair values are valuations based on inputs that are supported by little or no market activity and that are significant to the fair value of the assets or liabilities.
All securities whose maturity or sale is expected within one year are classified as “current” on the consolidated balance sheet. All other securities are classified as “long term” on the consolidated balance sheet.
Inventories and Provision for Excess and Obsolete Inventory
Inventories are stated at the lower of cost (first-in, first-out method) or market. Shipping and handling costs are classified as a component of cost of net revenues in the consolidated statements of operations. The Company reviews the components of its inventory and its inventory purchase commitments on a regular basis for excess and obsolete inventory based on estimated future usage and sales. Write-downs in inventory value or losses on inventory purchase commitments depend on various items, including factors related to customer demand, economic and competitive conditions, technological advances or new product introductions by the Company or its customers that vary from its current expectations. Whenever inventory is written down, a new cost basis is established and the inventory is not subsequently written up if market conditions improve.
The Company believes that, when made, the estimates used in calculating the inventory provision are reasonable and properly reflect the risk of excess and obsolete inventory. If customer demand for the Company’s inventory is substantially less than its estimates, inventory write-downs may be required, which could have a material adverse effect on its consolidated financial statements.
Property and Equipment
Property and equipment are initially stated at cost and depreciated using the straight-line method. Test equipment, computer equipment, purchased software, furniture, and fixtures and product tooling are depreciated over lives ranging from eighteen months to five years and leasehold improvements are depreciated over the shorter of the related remaining lease period or useful life. Amortization of assets held under capital leases is included in depreciation expense.
Expenditures for repairs and maintenance are expensed as incurred. Expenditures for major renewals and betterments that extend the useful lives of existing property and equipment are capitalized and depreciated. Upon retirement or disposition of property and equipment, any resulting gain or loss is recognized in the consolidated statements of operations.
Intangible Assets
Intangible assets include purchased intangible assets acquired from Enfora and the costs of non-exclusive and perpetual worldwide software technology licenses. These costs are amortized on an accelerated basis or on a
F-8
Table of Contents
straight-line basis over the estimated useful lives of the assets, depending on the anticipated utilization of the asset. The majority of intangible assets relate to the developed technologies and trade name resulting from the acquisition of Enfora. Developed technologies are amortized on a straight-line basis over their useful lives, ranging from five to eight years. Trade name is amortized on a straight-line basis over ten years.
Long-Lived Assets
The Company periodically evaluates the carrying value of the unamortized balances of its long-lived assets, including property and equipment and intangible assets, to determine whether impairment of these assets has occurred or whether a revision to the related amortization periods should be made. When the carrying value of an asset exceeds the associated undiscounted expected future cash flows, it is considered to be impaired and is written down to fair value. Fair value is determined based on an evaluation of the assets associated undiscounted future cash flows or appraised value. This evaluation is based on management’s projections of the undiscounted future cash flows associated with each class of asset. If management’s evaluation indicates that the carrying values of these assets are impaired, such impairment is recognized by a reduction of the applicable asset carrying value to its estimated fair value and the impairment is expensed as a part of continuing operations.
Goodwill
Goodwill represents the excess of the purchase price of an acquired enterprise over the fair value assigned to assets acquired and liabilities assumed in a business combination. Goodwill is allocated as of the date of the business combination to the reporting units that are expected to benefit from the synergies of the business combination. Goodwill is considered to be impaired if the Company determines that the carrying value of the reporting unit to which the goodwill has been assigned exceeds its estimated fair value. The Company performs its annual goodwill impairment test each year at the beginning of the fourth quarter, or more frequently if events or circumstances indicate that the carrying value of goodwill exceeds its fair value. The Company recorded $3.3 million, $0, and $0 of goodwill impairment during the years ended December 31, 2011, 2010, and 2009, respectively.
Contingent Consideration
Contingent consideration is recorded at the acquisition date estimated fair value for all acquisitions. The fair value of the contingent consideration is remeasured at each reporting period with any adjustments in fair value included in the Company’s consolidated statement of operations.
Revenue Recognition
The Company’s revenue is principally generated from the sale of wireless modems to wireless operators, OEM customers and value added resellers and distributors. In addition, the Company generates revenue from the sale of asset-management solutions utilizing wireless technology and M2M communication devices predominantly to transportation and industrial companies, medical device manufacturers and security system providers. Revenue from product sales is generally recognized upon the later of transfer of title or delivery of the product to the customer. Where the transfer of title or risk of loss is contingent on the customer’s acceptance of the product, we will not recognize revenue until both title and risk of loss have transferred to the customer. We record deferred revenue for cash payments received from customers in advance of when revenue recognition criteria are met. We have granted price protection to certain customers in accordance with the provisions of the respective contracts and track pricing and other terms offered to customers buying similar products to assess compliance with these provisions. We estimate the amount of price protection for current period product sales utilizing historical experience and information regarding customer inventory levels. To date, we have not incurred material price protection obligations. Revenues from sales to certain customers are subject to cooperative advertising allowances. Cooperative advertising allowances are recorded as an operating expense to the extent that the advertising benefit is separable from the revenue transaction and the fair value of that advertising benefit is determinable. To the extent that such allowances either do not provide a separable benefit
F-9
Table of Contents
to us, or the fair value of the advertising benefit cannot be reliably estimated, such amounts are recorded as a reduction of revenue. We establish reserves for estimated product returns allowances in the period in which revenue is recognized. In estimating future product returns, we consider various factors, including our stated return policies and practices and historical trends.
Predominantly all of our revenues represent the sale of hardware with accompanied software that is essential to the functionality of the hardware. The Company records revenue associated with the agreed upon price on hardware sales, and accrues any estimated costs of post-delivery performance obligations such as warranty obligations. The Company considers the four basic revenue recognition criteria discussed under Staff Accounting Bulletin #104 when assessing appropriate revenue recognition as follows:
Criterion #1—Persuasive evidence of an arrangement must exist;
Criterion #2—Delivery has occurred;
Criterion #3—The Company’s price to the buyer must be fixed or determinable; and,
Criterion #4—Collectibility is reasonably assured.
Under Financial Accounting Standards Board (“FASB”) Accounting Standards Update (“ASU”) 2009-13, in multiple element arrangements, the total consideration received from customers must be allocated to the elements, which may include hardware and non essential software elements, based on a relative selling price. The accounting guidance establishes a hierarchy to determine the selling price to be used for allocating revenue to deliverables as follows: (i) vendors specific objective evidence (VSOE), (ii) third party evidence (TPE), and (iii) best estimate of selling price (ESP). Because the Company has neither VSOE nor TPE, revenue has been based on the Company’s ESP. Amounts allocated to the delivered hardware and the related essential software are recognized at the time of the sale provided all other revenue recognition criteria have been met. Amounts allocated to other deliverables based upon ESP are recognized in the period the revenue recognition criteria have been met.
Our process for determining its ESP for deliverables without VSOE or TPE considers multiple factors that may vary depending upon the unique facts and circumstances related to each deliverable. Our prices are determined based upon cost to produce our products, expected order quantities and acceptance in the marketplace. In addition, when developing ESPs for products we may consider other factors as appropriate including the pricing of competitive alternatives if they exist, and product-specific business objectives.
We account for nonessential software licenses and related post contract support (PCS) under multiple element arrangements by recognizing revenue for such arrangements ratably over the term of the PCS as we have not established VSOE for the PCS element.
For the years ended December 31, 2011, 2010, and 2009, we have not recorded any significant revenues from multiple element or software arrangements.
Research and Development Costs
Research and development costs are expensed as incurred.
Warranty Costs
The Company accrues warranty costs based on estimates of future warranty related replacement, repairs or rework of products. Our warranty policy generally provides one to three years of coverage for products following the date of purchase. The Company’s policy is to accrue the estimated cost of warranty coverage as a component of cost of revenue in the accompanying consolidated statements of operations at the time revenue is recognized. In estimating its future warranty obligations the Company considers various factors, including the historical frequency and volume of claims, and the cost to replace or repair products under warranty. The warranty
F-10
Table of Contents
provision for its products is determined by using a financial model to estimate future warranty costs. The Company’s financial model takes into consideration actual product failure rates; estimated replacement, repair or rework expenses; and potential risks associated with our different products. The risk levels, warranty cost information, and failure rates used within this model are reviewed throughout the year and updated, if and when, these inputs change.
Income Taxes
The Company recognizes federal, state and foreign current tax liabilities or assets based on our estimate of taxes payable to or refundable by tax authorities in the current fiscal year. The Company also recognizes federal, state and foreign deferred tax liabilities or assets based on the Company’s estimate of future tax effects attributable to temporary differences and carry forwards. Deferred tax assets and liabilities are measured using enacted tax rates expected to apply to taxable income in the years in which those temporary differences are expected to be recovered or settled.
Deferred tax assets are reduced by valuation allowances if, based on the consideration of all available evidence, it is more likely than not that some portion of the deferred tax asset will not be realized. The Company evaluates deferred income taxes on a quarterly basis to determine if valuation allowances are required by considering available evidence. If the Company is unable to generate sufficient future taxable income in certain tax jurisdictions, or if there is a material change in the actual effective tax rates or time period within which the underlying temporary differences become taxable or deductible, the Company could be required to increase its valuation allowance against its deferred tax assets which could result in an increase in the Company’s effective tax rate and an adverse impact on operating results. The Company will continue to evaluate the necessity of the valuation allowance based on the remaining deferred tax assets.
The Company follows the accounting guidance related to financial statement recognition, measurement and disclosure of uncertain tax positions. The Company recognizes the impact of an uncertain income tax position on an income tax return at the largest amount that is more-likely-than-not to be sustained upon audit by the relevant taxing authority. An uncertain income tax position will not be recognized if it has less than a 50% likelihood of being sustained. Uncertain tax positions are recognized in the first subsequent financial reporting period in which that threshold is met or from changes in circumstances such as the expiration of applicable statutes of limitations.
Derivatives and Hedging
The Company’s derivative financial instruments consist solely of foreign currency forward exchange contracts. The purpose of these derivative instruments is to hedge the Company’s economic exposure associated with accounts receivable and cash balances denominated in Euros. The Company’s forward contracts do not qualify as accounting hedges. As a result, the Company marks-to-market the forward contracts and includes unrealized gains and losses in the current period as a component of other income (expense) in the consolidated statements of operations.
Litigation
The Company is currently involved in certain legal proceedings. The Company will record a loss when the Company determines information available prior to the issuance of the financial statements indicates the loss is both probable and estimable. Where a liability is probable and there is a range of estimated loss with no best estimate in the range, the Company records the minimum estimated liability related to the claim. As additional information becomes available, the Company assesses the potential liability related to the Company’s pending litigation and revises its estimates, if necessary. The Company’s policy is to expense litigation costs as incurred.
Share-Based Compensation
The Company has granted stock options to employees and restricted stock units. The Company also has an employee stock purchase plan (“ESPP”) for eligible employees. The Company measures the compensation cost
F-11
Table of Contents
associated with all share-based payments based on grant date fair values. The fair value of each employee stock option and employee stock purchase right is estimated on the date of grant using an option pricing model that meets certain requirements. The Company currently uses the Black-Scholes option pricing model to estimate the fair value of our stock options and stock purchase rights. The Black-Scholes model is considered an acceptable model but the fair values generated by it may not be indicative of the actual fair values of our equity awards as it does not consider certain factors important to those awards to employees, such as continued employment and periodic vesting requirements as well as limited transferability. The determination of the fair value of share-based payment awards utilizing the Black-Scholes model is affected by our stock price and a number of assumptions, including expected volatility, expected term, risk-free interest rate and expected dividends.
For grants of stock options, the Company uses a blend of historical and implied volatility for traded options on its stock in order to estimate the expected volatility assumption required in the Black-Scholes model. The Company’s use of a blended volatility estimate in computing the expected volatility assumption for stock options is based on its belief that while that implied volatility is representative of expected future volatility, the historical volatility over the expected term of the award is also an indicator of expected future volatility. Due to the short duration of employee stock purchase rights under our ESPP, the Company utilizes historical volatility in order to estimate the expected volatility assumption of the Black-Scholes model.
The expected term of stock options granted is estimated using the average of the vesting date, the contractual term and historical experience. The risk-free interest rate assumption is based on observed interest rates appropriate for the expected terms of our stock options and employee stock purchase rights. The dividend yield assumption is based on the Company’s history and expectation of no dividend payouts. The Company estimates forfeitures at the time of grant and revises these estimates, if necessary, in subsequent periods if actual forfeitures differ from those estimates. The Company estimates its forfeiture rate assumption for all types of share based compensation awards based historical forfeiture rates related to each category of award.
Compensation cost associated with grants of restricted stock units are measured at fair value, which has historically been the closing price of the Company’s stock on the date of grant.
The Company recognizes share-based compensation expense using the straight-line method for awards that contain only service conditions. For awards that contain performance conditions, the Company recognizes the share-based compensation expense on a straight-line basis for each vesting tranche.
The Company evaluates the assumptions used to value stock awards on a quarterly basis. If factors change and the Company employs different assumptions, share-based compensation expense may differ significantly from what it has recorded in the past. If there are any modifications or cancellations of the underlying unvested securities, the Company may be required to accelerate, increase or cancel any remaining unearned share-based compensation expense. To the extent that the Company grants additional equity securities to employees or it assumes unvested securities in connection with any acquisitions, its share-based compensation expense will be increased by the additional unearned compensation resulting from those additional grants or acquisitions.
Computation of Net Income (Loss) Per Share
The Company computes basic and diluted per share data for all periods for which a statement of operations is presented. Basic net income (loss) per share excludes dilution and is computed by dividing the net income (loss) by the weighted-average number of shares that were outstanding during the period. Diluted EPS reflects the potential dilution that could occur if securities or other contracts to acquire common stock were exercised or converted into common stock. Potential dilutive securities are excluded from the diluted EPS computation in loss periods as their effect would be anti-dilutive.
F-12
Table of Contents
Fair Value of Financial Instruments
The Company’s fair value measurements relate to its cash equivalents, marketable debt securities, and marketable equity securities, which are classified pursuant to authoritative guidance for fair value measurements. The Company places its cash equivalents and marketable debt securities in instruments that meet credit quality standards, as specified in its investment policy guidelines. These guidelines also limit the amount of credit exposure to any one issue, issuer or type of instrument.
Our financial instruments consist principally of cash and cash equivalents, short-term and long-term marketable securities, and short-term and long-term debt. The Company’s cash and cash equivalents consist of its investment in money market securities and treasury bills. The Company’s marketable securities consist primarily of government agency securities, municipal bonds, time deposits and investment-grade corporate bonds. From time to time, the Company may utilize foreign exchange forward contracts. These contracts are valued using pricing models that take into account the currency rates as of the balance sheet date.
Comprehensive Income (Loss)
Comprehensive income (loss) consists of net earnings and unrealized gains and losses on available-for-sale securities.
Recent Accounting Pronouncements
In May 2011, the FASB issued ASU 2011-04, “Fair Value Measurement (Topic 820): Amendments to Achieve Common Fair Value Measurement and Disclosure Requirements in U.S. GAAP and IFRSs.” This standard results in a common requirement between the FASB and the International Accounting Standards Board (IASB) for measuring fair value and for disclosing information about fair value measurements. ASU 2011-04 is effective for interim and annual periods beginning after December 15, 2011. We do not expect the adoption of ASU 2011-04 to have a material impact on its consolidated financial statements.
In December 2011, the FASB issued ASU No. 2011-12 “Comprehensive Income (Topic 220): Deferral of the Effective Date for Amendments to the Presentation of Reclassifications of Items Out of Accumulated Other Comprehensive Income in ASU No. 2011-05.” ASU 2011-12 indefinitely defers the requirement to present components of reclassifications of other comprehensive income on the face of the income statement, while still requiring companies to adopt the other requirements contained in ASU 2011-05, the new standard on comprehensive income. ASU 2011-05 is effective retrospectively for fiscal years, and interim periods within those years, beginning after December 15, 2011. We do not expect the adoption of ASU 2011-05 to have a material impact on the consolidated financial statements.
| 2. | Merger and Acquisition Activities in Prior Years |
Enfora
On November 30, 2010, the Company completed the acquisition of Enfora. The acquisition of Enfora diversifies the Company’s customer base and product lines into adjacent markets and advances the Company’s strategy of providing intelligent devices to all end markets—enterprise, consumer and vertical applications.
Enfora’s results of operations and estimated fair value of assets acquired and liabilities assumed were included in the Company’s consolidated financial statements beginning November 30, 2010. The revenue and operating results contributed by Enfora during the year ended December 31, 2011 are disclosed in our Segment Information and Concentrations of Risk footnote (see Note 12). Acquisition costs related to the merger of Enfora of $1.9 million were recorded and classified as general and administrative expenses in the consolidated statement of operations during the year ended December 31, 2010.
F-13
Table of Contents
Acquisition consideration
Under the terms of the acquisition agreement, the Company paid cash consideration of $64.5 million and additional cash consideration of $13.0 million in exchange for an agreed upon amount of Enfora working capital. The Company also agreed to pay additional cash consideration (“contingent consideration”) of up to $6.0 million based on the operating results of Enfora for the 15 month period from October 1, 2010 to December 31, 2011. The estimated fair value of this contingent consideration at the acquisition date was $0.9 million, resulting in total estimated cash to be paid of $78.4 million. During the quarter ended March 31, 2011, the Company revised its estimate of contingent consideration to $0 and reflected this change as a benefit to general and administrative expenses for the quarter ended March 31, 2011. There were no changes in the fair value of the contingent consideration recorded in the nine months ended December 31, 2011 as the operating results necessary to receive payment of the contingent consideration were not achieved.
Fair Value of Assets Acquired and Liabilities Assumed
The Company accounted for the transaction using the acquisition method and, accordingly, estimated the fair value of the tangible and intangible assets acquired and liabilities assumed as set forth below. During the third quarter of 2011, the Company made a $297,000 adjustment to increase Enfora net deferred tax assets, with a corresponding dollar amount decrease to goodwill, based on completed studies of available tax benefits existing as of the date of acquisition. The total purchase price is summarized below (in thousands):
| Cash and cash equivalents |
$ | 4,600 | ||
| Accounts receivables |
7,448 | |||
| Inventories |
10,469 | |||
| Property and equipment |
1,597 | |||
| Prepaid expenses and other assets |
304 | |||
| Accounts payable, accrued expenses and deferred taxes |
(12,220 | ) | ||
| Intangible assets |
42,520 | |||
| Goodwill |
23,661 | |||
|
|
|
|||
| Purchase price |
$ | 78,379 | ||
|
|
|
Actual and Pro Forma Results of Enfora Acquisition
The following table presents the unaudited pro forma financial information for the years ended December 31, 2010 and December 31, 2009. The unaudited pro forma financial information combines the results of operations of Novatel Wireless and Enfora as though the companies had been combined as of the beginning of fiscal 2009. The pro forma financial information is presented for informational purposes only and is not indicative of the results of operations that would have been achieved if the acquisition and related borrowings had taken place at the beginning of fiscal 2009. The following unaudited pro forma financial information presented includes amortization charges for acquired intangible assets, inventory fair value adjustments, eliminations of intercompany transactions, adjustments to interest expense, reduction in share-based compensation and related tax effects (in thousands, except per share data):
| 2010 | 2009 | |||||||
| Net revenue |
$ | 392,047 | $ | 389,936 | ||||
| Net loss |
(46,572 | ) | (5,863 | ) | ||||
| Basic and diluted net loss per share |
(1.48 | ) | (0.19 | ) | ||||
Cinterion
In June 2010, the Company submitted a bid to purchase certain assets of Cinterion, a company in the cellular M2M communications industry, in connection with an insolvency proceeding. The Company was not the successful
F-14
Table of Contents
bidder at the conclusion of the process on June 28, 2010. In connection with the bid, the Company borrowed $30.0 million under a bridge loan facility in June 2010 which was subsequently repaid in July 2010. The Company recognized $3.1 million of debt issuance costs related to the bridge loan facility. This amount was recorded as interest expense in the consolidated statement of operations for the year ended December 31, 2010. The Company also realized $1.7 million of foreign currency gain, net of hedging transaction costs, to address foreign currency risk also related to the bid. This amount was recorded in other income in the consolidated statement of operations during the year ended December 31, 2010. The Company also incurred $1.3 million in legal, advisory and professional fees related to the acquisition bid, which were recorded and classified as general and administrative expenses in the consolidated statement of operations during the year ended December 31, 2010.
| 3. | Fair Value Measurement of Assets and Liabilities |
Fair value is defined as the price that would be received to sell an asset or paid to transfer a liability in an orderly transaction between market participants at the measurement date (exit price). A fair value measurement reflects the assumptions market participants would use in pricing an asset or liability based on the best available information. These assumptions include the risk inherent in a particular valuation technique (such as a pricing model) and the risks inherent in the inputs to the model.
We classify our inputs to measure fair value using a three-level hierarchy that maximizes the use of observable inputs and minimizes the use of unobservable inputs by requiring that the most observable inputs be used when available. The categorization of financial instruments within the valuation hierarchy is based upon the lowest level of input that is significant to the fair value measurement. The hierarchy is prioritized into three levels (with Level 3 being the lowest) defined as follows:
Level 1: Pricing inputs are based on quoted market prices for identical assets or liabilities in active markets (e.g., NYSE). Active markets are those in which transactions for the asset or liability occur in sufficient frequency and volume to provide pricing information on an ongoing basis.
Level 2: Pricing inputs include benchmark yields, trade data, reported trades and broker dealer quotes, two-sided markets and industry & economic events, yield to maturity, Municipal Securities Rule Making Board reported trades and vendor trading platform data. Level 2 includes those financial instruments that are valued using various pricing services and broker pricing information including Electronic Communication Networks and broker feeds.
Level 3: Pricing inputs include significant inputs that are generally less observable from objective sources, including the Company’s own assumptions.
The fair value of the majority of our cash equivalents and marketable equity securities were determined based on Level 1 inputs. The fair value of our marketable debt securities was determined based on Level 2 inputs. At December 31, 2011, the Company did not have any securities in the Level 3 category. The Company reviews the fair value hierarchy classification on a quarterly basis. We validate the quoted market prices provided by our primary pricing service by comparing their assessment of the fair values of our investments by using a third party investment manager. The third party investment manager uses similar techniques to our primary pricing service to derive the pricing describe above. Changes in the observability of valuation inputs may result in a reclassification of levels for certain securities within the fair value hierarchy.
F-15
Table of Contents
The following table summarizes the Company’s financial instruments measured at fair value on a recurring basis in accordance with the authoritative guidance for fair value measurements as of December 31, 2011 (in thousands):
| Description |
Balance as of December 31, 2011 |
Level 1 | Level 2 | |||||||||
| Assets: |
||||||||||||
| Cash equivalents: |
||||||||||||
| Money market funds |
$ | 25,137 | $ | 25,137 | $ | — | ||||||
| US Treasury notes |
5,784 | — | 5,784 | |||||||||
|
|
|
|
|
|
|
|||||||
| Total cash equivalents |
30,921 | 25,137 | 5,784 | |||||||||
|
|
|
|
|
|
|
|||||||
| Short-term marketable securities: |
||||||||||||
| Corporate debenture/bonds |
8,612 | — | 8,612 | |||||||||
| Municipal bonds |
8,384 | — | 8,384 | |||||||||
| Certificates of deposit |
4,321 | — | 4,321 | |||||||||
| Government agency securities |
6,912 | — | 6,912 | |||||||||
| Marketable equity securities |
38 | 38 | — | |||||||||
|
|
|
|
|
|
|
|||||||
| Total short-term marketable securities |
28,267 | 38 | 28,229 | |||||||||
|
|
|
|
|
|
|
|||||||
| Long-term marketable securities: |
||||||||||||
| Municipal bonds |
5,969 | — | 5,969 | |||||||||
| Certificates of deposit |
3,788 | — | 3,788 | |||||||||
| Government agency securities |
3,738 | — | 3,738 | |||||||||
|
|
|
|
|
|
|
|||||||
| Total long-term marketable securities |
13,495 | — | 13,495 | |||||||||
|
|
|
|
|
|
|
|||||||
| Total financial assets |
$ | 72,683 | $ | 25,175 | $ | 47,508 | ||||||
|
|
|
|
|
|
|
|||||||
The following table summarizes the Company’s financial instruments measured at fair value on a recurring basis in accordance with the authoritative guidance for fair value measurements as of December 31, 2010 (in thousands):
| Description |
Balance as of December 31, 2010 |
Level 1 | Level 2 | Level 3 | ||||||||||||
| Assets: |
||||||||||||||||
| Cash equivalents: |
||||||||||||||||
| Money market funds |
$ | 5,380 | $ | 5,380 | $ | — | $ | — | ||||||||
|
|
|
|
|
|
|
|
|
|||||||||
| Total cash equivalents |
5,380 | 5,380 | — | — | ||||||||||||
|
|
|
|
|
|
|
|
|
|||||||||
| Short-term marketable securities: |
||||||||||||||||
| Corporate debenture/bonds |
33,384 | — | 33,384 | — | ||||||||||||
| Municipal bonds |
5,255 | — | 5,255 | — | ||||||||||||
| Certificates of deposit |
925 | — | 925 | — | ||||||||||||
| Government agency securities |
20,211 | — | 20,211 | — | ||||||||||||
|
|
|
|
|
|
|
|
|
|||||||||
| Total short-term marketable securities |
59,775 | — | 59,775 | — | ||||||||||||
|
|
|
|
|
|
|
|
|
|||||||||
F-16
Table of Contents
| Description |
Balance as of December 31, 2010 |
Level 1 | Level 2 | Level 3 | ||||||||||||
| Long-term marketable securities: |
||||||||||||||||
| Corporate debenture/bonds |
8,794 | — | 8,794 | — | ||||||||||||
| Certificates of deposit |
2,403 | — | 2,403 | — | ||||||||||||
| Government agency securities |
9,479 | — | 9,479 | — | ||||||||||||
|
|
|
|
|
|
|
|
|
|||||||||
| Total long-term marketable securities |
20,676 | — | 20,676 | — | ||||||||||||
|
|
|
|
|
|
|
|
|
|||||||||
| Total financial assets |
$ | 85,831 | $ | 5,380 | $ | 80,451 | $ | — | ||||||||
|
|
|
|
|
|
|
|
|
|||||||||
| Liabilities: |
||||||||||||||||
| Contingent consideration liability |
$ | (880 | ) | $ | — | $ | — | $ | (880 | ) | ||||||
| Foreign exchange forward contracts |
(8 | ) | — | (8 | ) | — | ||||||||||
|
|
|
|
|
|
|
|
|
|||||||||
| Total financial liabilities |
$ | (888 | ) | $ | — | $ | (8 | ) | $ | (880 | ) | |||||
|
|
|
|
|
|
|
|
|
|||||||||
There were no transfers between Level 1 and Level 2 securities during the year ended December 31, 2011 and 2010. All of our long-term marketable debt securities had maturities of between one and two years in duration at December 31, 2011.
The table below presents Level 3 activity for our contingent consideration liability for the twelve months ended December 31, 2011 (in thousands):
| Contingent consideration liability |
Level 3 | |||
| Beginning balance at January 1, 2011 |
$ | (880 | ) | |
| Adjustments |
880 | |||
|
|
|
|||
| Ending balance at December 31, 2011 |
$ | — | ||
|
|
|
|||
As of December 31, 2011, the Company had no outstanding foreign currency exchange forward contracts. At December 31, 2010, the Company recorded an unrealized loss of $8,000 on its outstanding foreign currency forward exchange contracts.
For the years ended December 31, 2011, 2010 and 2009, the Company recorded gains of $8,000, gains of $38,000 and losses of $446,000, respectively, on its Euro-denominated foreign exchange forward contracts. During the years ended December 31, 2011, 2010 and 2009, the Company recorded foreign currency gains and losses on foreign currency denominated transactions of approximately $836,000 loss, $1.7 million gain and $420,000 loss, respectively. The loss during the year ended December 31, 2011 primarily related to foreign currency losses on South Korean won denominated trade payables. The gains during the year ended December 31, 2010 primarily relate to a $2.9 million foreign currency gain realized on the liquidation of the Company’s cash holdings in Euros at the conclusion of the insolvency proceeding for the sale of Cinterion net of $1.2 million in expense to enter into several Euro-denominated put options to hedge the foreign currency risk associated with its cash holdings in Euros related to the Cinterion bid process. These put options expired unexercised on June 25, 2010.
All recorded gains and losses on foreign exchange transactions are recorded in other income (expense), net, within the consolidated statements of operations.
F-17
Table of Contents
| 4. | Financial Statement Details |
Marketable Securities
The Company’s portfolio of available-for-sale securities by contractual maturity consists of the following (in thousands):
| December 31, 2011 |
Maturity in Years |
Amortized Cost |
Gross Unrealized Gains |
Gross Unrealized Losses |
Estimated Fair Value |
|||||||||||||||
| Corporate debenture/bonds |
1 or less | $ | 8,615 | $ | — | $ | (3 | ) | $ | 8,612 | ||||||||||
| Municipal bonds |
1 or less | 8,390 | — | (6 | ) | 8,384 | ||||||||||||||
| Certificates of deposit |
1 or less | 4,319 | 2 | — | 4,321 | |||||||||||||||
| Government agency securities |
1 or less | 6,913 | — | (1 | ) | 6,912 | ||||||||||||||
| Marketable equity securities |
1 or less | 38 | — | — | 38 | |||||||||||||||
|
|
|
|
|
|
|
|
|
|||||||||||||
| Total short-term marketable securities |
28,275 | 2 | (10 | ) | 28,267 | |||||||||||||||
|
|
|
|
|
|
|
|
|
|||||||||||||
| Municipal bonds |
1 to 2 | 5,967 | 2 | — | 5,969 | |||||||||||||||
| Certificates of deposit |
1 to 2 | 3,797 | — | (9 | ) | 3,788 | ||||||||||||||
| Government agency securities |
1 to 2 | 3,734 | 4 | — | 3,738 | |||||||||||||||
|
|
|
|
|
|
|
|
|
|||||||||||||
| Total long-term marketable securities |
13,498 | 6 | (9 | ) | 13,495 | |||||||||||||||
|
|
|
|
|
|
|
|
|
|||||||||||||
| $ | 41,773 | $ | 8 | $ | (19 | ) | $ | 41,762 | ||||||||||||
|
|
|
|
|
|
|
|
|
|||||||||||||
The Company’s available-for-sale securities are carried on the consolidated balance sheet at fair market value with the related unrealized gains and losses included in accumulated other comprehensive (loss) income on the consolidated balance sheet, which is a separate component of stockholders’ equity. Realized gains and losses on the sale of available-for-sale marketable securities are determined using the specific-identification method.
At December 31, 2011 and 2010, the Company recorded net unrealized loss of $8,000, net of taxes, and net unrealized gains of $21,000, respectively. The Company’s net unrealized gains (loss) is the result of market conditions affecting its fixed-income debt securities, which are included in accumulated other comprehensive (loss) income on the consolidated balance sheet for the periods then ended.
As of December 31, 2011, the Company’s investment portfolio included $385,000 of marketable equity securities at original cost, with a fair value of $38,000. These securities are currently traded on the Over the Counter Bulletin Board (OTCBB) and are not traded on major exchanges such as the NYSE. During the year ended December 31, 2011, the Company recorded an other-than-temporary loss of $347,000 within other income (expense), net in the consolidated statement of operations.
Inventories
Inventories consist of the following (in thousands):
| December 31, | ||||||||
| 2011 | 2010 | |||||||
| Finished goods |
$ | 35,211 | $ | 36,764 | ||||
| Raw materials and components |
7,068 | 6,330 | ||||||
|
|
|
|
|
|||||
| $ | 42,279 | $ | 43,094 | |||||
|
|
|
|
|
|||||
F-18
Table of Contents
Property and Equipment
Property and equipment consists of the following (in thousands):
| December 31, | ||||||||
| 2011 | 2010 | |||||||
| Test equipment |
$ | 52,311 | $ | 48,689 | ||||
| Computer equipment and purchased software |
13,766 | 12,254 | ||||||
| Product tooling |
3,768 | 2,968 | ||||||
| Furniture and fixtures |
2,240 | 1,807 | ||||||
| Leasehold improvements |
5,628 | 3,786 | ||||||
|
|
|
|
|
|||||
| 77,713 | 69,504 | |||||||
| Less—accumulated depreciation and amortization |
(59,217 | ) | (48,223 | ) | ||||
|
|
|
|
|
|||||
| $ | 18,496 | $ | 21,281 | |||||
|
|
|
|
|
|||||
For the years ended December 31, 2011, 2010 and 2009, the Company recorded $70,000, $167,000 and $92,000, respectively, in its cost of net revenues as a result of its impairment analysis of property and equipment.
Depreciation and amortization expense relating to property and equipment was $11.1 million, $10.0 million and $11.4 million for the years ended December 31, 2011, 2010 and 2009, respectively.
Accrued Expenses
Accrued expenses consist of the following (in thousands):
| December 31, | ||||||||
| 2011 | 2010 | |||||||
| Royalties |
$ | 5,861 | $ | 6,461 | ||||
| Payroll and related |
8,706 | 5,704 | ||||||
| Product warranty |
1,525 | 2,279 | ||||||
| Market development fund and price protection |
1,750 | 1,452 | ||||||
| Deferred rent |
1,135 | 1,092 | ||||||
| Professional fees |
1,213 | 1,103 | ||||||
| Other |
4,854 | 7,959 | ||||||
|
|
|
|
|
|||||
| $ | 25,044 | $ | 26,050 | |||||
|
|
|
|
|
|||||
Accrued Warranty Obligations
Accrued warranty obligations consist of the following (in thousands):
| 2011 | 2010 | |||||||
| Warranty liability at beginning of period |
$ | 2,279 | $ | 3,039 | ||||
| Additions charged to operations |
2,642 | 1,350 | ||||||
| Deductions from liability |
(3,396 | ) | (2,110 | ) | ||||
|
|
|
|
|
|||||
| Warranty liability at end of period |
$ | 1,525 | $ | 2,279 | ||||
|
|
|
|
|
|||||
F-19
Table of Contents
| 5. | Intangible Assets |
The Company’s amortizable purchased intangible assets resulting from its acquisition of Enfora are composed of (in thousands):
| Years ended December 31, | ||||||||||||||||||||||||
| 2011 | 2010 | |||||||||||||||||||||||
| Gross (1) | Accumulated Amortization (1) |
Net | Gross | Accumulated Amortization |
Net | |||||||||||||||||||
| Developed technologies |
$ | 26,000 | $ | (4,163 | ) | $ | 21,837 | $ | 29,200 | $ | (371 | ) | $ | 28,829 | ||||||||||
| Trade name |
12,800 | (1,387 | ) | 11,413 | 12,800 | (107 | ) | 12,693 | ||||||||||||||||
| Other |
3,720 | (1,609 | ) | 2,111 | 2,220 | (356 | ) | 1,864 | ||||||||||||||||
|
|
|
|
|
|
|
|
|
|
|
|
|
|||||||||||||
| Total amortizable purchased intangible assets |
$ | 42,520 | $ | (7,159 | ) | $ | 35,361 | $ | 44,220 | $ | (834 | ) | $ | 43,386 | ||||||||||
|
|
|
|
|
|
|
|
|
|
|
|
|
|||||||||||||
| (1) | During the year ended December 31, 2011, the Company corrected its purchase price allocations to gross intangible assets and related amortization expense related to the 2010 Enfora acquisition (see Note 6). |
The following table presents details of the amortization of purchased intangible assets of Enfora included in the cost of net revenues and operating costs and expenses categories (in thousands):
| Years ended December 31, | ||||||||
| 2011 | 2010 | |||||||
| Cost of net revenues |
$ | 4,102 | $ | 655 | ||||
| General and administrative expenses |
2,220 | 179 | ||||||
|
|
|
|
|
|||||
| Total amortization expense |
$ | 6,322 | $ | 834 | ||||
|
|
|
|
|
|||||
The following table presents details of the amortization of existing amortizable purchased intangible assets of Enfora that is currently estimated to be expensed in the future (in thousands):
| Fiscal year: |
Amount | |||
| 2012 |
$ | 5,571 | ||
| 2013 |
5,333 | |||
| 2014 |
5,333 | |||
| 2015 |
5,226 | |||
| Thereafter |
13,898 | |||
|
|
|
|||
| Total |
$ | 35,361 | ||
|
|
|
|||
Additionally, at December 31, 2011 and 2010, the Company had net acquired software licenses of $341,000 and $879,000, respectively, net of accumulated amortization of $3.7 million and $3.2 million, respectively. The acquired software licenses represent rights to use certain software necessary for the development and commercial sale of the Company’s products.
The Company monitors its intangible and long-lived asset balances and conducts formal tests when impairment indicators are present. The Company recorded $133,000 of impairment loss related to acquired software licenses during the year ended December 31, 2011. There was no impairment loss recorded for the years ended December 31, 2010 or 2009.
Amortization expense relating to acquired software licenses was $422,000, $744,000 and $1.6 million for the years ended December 31, 2011, 2010 and 2009, respectively. Amortization expense related to licenses obtained for research purposes is recorded within research and development expense in the consolidated
F-20
Table of Contents
statements of operations. Amortization expense related to licenses obtained for commercial products is recorded in cost of net revenues in the consolidated statements of operations.
At December 31, 2011, the weighted average remaining useful life of the Company’s long-lived intangible assets is 7.0 years.
| 6. | Goodwill |
In the third quarter of 2011, the Company identified errors in its consolidated financial statements for the year ended December 31, 2010 and for each of the quarterly periods ended March 31, 2011 and June 30, 2011. The errors were due to the amount of recorded goodwill in connection with the 2010 acquisition of Enfora. The errors were made in connection with the Company’s initial allocation of the consideration transferred in the acquisition resulting in understated goodwill and overstated acquired intangibles at the time of the acquisition by $1.7 million. As a result, the Company adjusted the gross value of goodwill and acquired intangible by $1.7 million to reflect the proper allocation.
The changes in the carrying amount of goodwill for the years ended December 31, 2011 and 2010 are as follows (in thousands):
| M2M Products and Solutions | ||||||||
| 2011 | 2010 | |||||||
| Balance at beginning of period |
$ | 22,258 | $ | — | ||||
| Goodwill acquired during the period |
— | 22,258 | ||||||
| Goodwill acquisition price correction |
1,700 | — | ||||||
| Net deferred tax asset related adjustment due to goodwill correction |
(612 | ) | — | |||||
| Completion of deferred tax asset valuation (Note 2) |
(297 | ) | — | |||||
| Goodwill impairment during the period |
(3,277 | ) | — | |||||
|
|
|
|
|
|||||
| Balance at December 31, |
$ | 19,772 | $ | 22,258 | ||||
|
|
|
|
|
|||||
During the third quarter of 2011, the Company experienced a sustained, significant decline in its stock price and based on actual and forecasted operating results of the M2M products and solutions reporting unit, the Company determined there were sufficient indicators of impairment present to require an interim impairment analysis.
Based upon fair value tests performed by a third party independent appraisal, the Company recorded a preliminary pre-tax goodwill impairment charge of approximately $3.5 million during the third quarter of 2011. In the fourth quarter of 2011, the Company finalized the impairment by reducing the previous estimate of impairment by approximately $237,000 for a total goodwill impairment of $3.3 million in 2011.
There were no further adjustments to the goodwill during its annual impairment test in the fourth quarter of 2011. The Company used the third party independent appraisal report from the third quarter of 2011 as its basis for its annual impairment analysis.
F-21
Table of Contents
| 7. | Earnings Per Share |
The following table sets forth the computation of diluted weighted average common and potential common shares outstanding for the years ended December 31, 2011, 2010 and 2009, respectively (in thousands).
| Year Ended December 31, | ||||||||||||
| 2011 | 2010 | 2009 | ||||||||||
| Basic weighted average common shares outstanding |
32,043 | 31,494 | 30,648 | |||||||||
| Effect of dilutive securities: |
||||||||||||
| Options |
— | — | 159 | |||||||||
| Employee Stock Purchase Plan |
— | — | 238 | |||||||||
| Unvested Restricted Stock (including Restricted Stock Units) |
— | — | 179 | |||||||||
|
|
|
|
|
|
|
|||||||
| Diluted weighted average common and potential common shares outstanding |
32,043 | 31,494 | 31,224 | |||||||||
|
|
|
|
|
|
|
|||||||
Weighted average options, restricted stock units and ESPP shares to purchase a total of 4,656,929 shares, 3,675,163 shares and 3,149,937 shares of common stock for the years ended December 31, 2011, 2010 and 2009, respectively, were outstanding but not included in the computation of diluted earnings per share as their effect was anti-dilutive.
| 8. | Stockholders’ Equity |
Preferred Stock
The Company has a total of 2,000,000 shares of Series A and Series B preferred stock authorized for issuance at a par value of $0.001 per share. No preferred shares are currently issued or outstanding.
Common Shares Reserved for Future Issuance
The Company has reserved shares of common stock for possible future issuance as of December 31, 2011 as follows (in thousands):
| Shares | ||||
| Stock options outstanding under the 2009 Omnibus Incentive Compensation Plan and previous plans |
4,481 | |||
| Restricted stock units outstanding |
1,289 | |||
| Future grants of awards under the 2009 Omnibus Incentive Compensation Plan |
1,493 | |||
| Shares available under the Employee Stock Purchase Plan |
1,087 | |||
|
|
|
|||
| Total shares of common stock reserved for issuance |
8,350 | |||
|
|
|
|||
| 9. | Stock Incentive and Employee Stock Purchase Plans |
During the year ended December 31, 2011, the Company granted awards under the 2009 Omnibus Incentive Compensation Plan (the “2009 Plan”). The Compensation Committee of the Board of Directors administers the plan.
Under the 2009 Plan, a maximum of 2.5 million shares of common stock may be issued upon the exercise of stock options, in the form of restricted stock, or in settlement of restricted stock units or other awards, including awards with alternative vesting schedules such as performance-based criteria.
F-22
Table of Contents
For the years ended December 31, 2011, 2010 and 2009, the following table presents total share-based compensation expense in each functional line item on our consolidated statements of operations (in thousands):
| Year Ended December 31, | ||||||||||||
| 2011 | 2010 | 2009 | ||||||||||
| Cost of net revenues |
$ | 579 | $ | 645 | $ | 743 | ||||||
| Research and development |
2,088 | 2,368 | 2,608 | |||||||||
| Sales and marketing |
1,254 | 1,164 | 1,149 | |||||||||
| General and administrative |
2,062 | 2,294 | 2,382 | |||||||||
|
|
|
|
|
|
|
|||||||
| Totals |
$ | 5,983 | $ | 6,471 | $ | 6,882 | ||||||
|
|
|
|
|
|
|
|||||||
The per share fair values of stock options granted under the 2009 Plan and rights granted under the ESPP have been estimated with the following assumptions.
| Employee Stock Options | Employee Stock Purchase Rights | |||||||||||||||||||||||
| 2011 | 2010 | 2009 | 2011 | 2010 | 2009 | |||||||||||||||||||
| Expected dividend yield: |
0 | % | 0 | % | 0 | % | 0 | % | 0 | % | 0 | % | ||||||||||||
| Risk-free interest rate: |
1.2 | % | 2.2 | % | 1.9 | % | 0.2 | % | 0.5 | % | 0.5 | % | ||||||||||||
| Volatility: |
69 | % | 53 | % | 73 | % | 63 | % | 60 | % | 80 | % | ||||||||||||
| Expected term (in years): |
6.0 | 5.8 | 5.6 | 1.1 | 1.3 | 1.2 | ||||||||||||||||||
Stock Options
The Compensation Committee of the Board of Directors determines eligibility, vesting schedules and exercise prices for options granted. Options granted under the 2009 Plan and previous plans generally have a term of ten years, and in the case of new hires, generally vest and become exercisable at the rate of 25% after one year and ratably on a monthly basis over a period of 36 months thereafter. Subsequent option grants to existing employees generally vest and become exercisable ratably on a monthly basis over a period of 48 months measured from the date of grant.
A summary of stock option activity for the year ended December 31, 2011 is presented below (dollars and shares in thousands, except per share data):
| Stock Options Outstanding |
Weighted Average Exercise Price Per Option |
Weighted Average Remaining Contractual Term (Years) |
Aggregate Intrinsic Value |
|||||||||||||
| Options outstanding December 31, 2010 |
4,592 | $ | 10.88 | |||||||||||||
| Granted |
180 | $ | 5.55 | |||||||||||||
| Exercised |
(9 | ) | $ | 3.79 | ||||||||||||
| Cancelled |
(282 | ) | $ | 12.51 | ||||||||||||
|
|
|
|||||||||||||||
| Balance December 31, 2011 |
4,481 | $ | 10.58 | 5.43 | $ | 17 | ||||||||||
|
|
|
|||||||||||||||
| Options Exercisable, December 31, 2011 |
3,696 | $ | 11.39 | 4.82 | $ | 17 | ||||||||||
|
|
|
|||||||||||||||
The total intrinsic value of options exercised to purchase common stock during the years ended December 31, 2011, 2010 and 2009 was approximately $28,000, $364,000 and $633,000, respectively. As of December 31, 2011, total unrecognized share-based compensation cost related to unvested stock options was $3.0 million, which is expected to be recognized over a weighted average period of approximately 1.8 years. The total fair value of option awards recognized as expense during the years ended December 31, 2011, 2010 and
F-23
Table of Contents
2009 was approximately $2.7 million, $3.5 million and $3.6 million, respectively. The weighted average fair value of option awards granted during years ended December 31, 2011, 2010 and 2009 was $3.40, $3.62 and $4.07, respectively.
Restricted Stock Units
The Company may issue restricted stock units (“RSUs”) that, upon satisfaction of vesting conditions, allow for employees and non-employee directors to receive common stock. Issuances of such awards reduce common stock available under the 2009 Plan for stock incentive awards. The Company measures compensation cost associated with grants of RSUs at fair value, which is generally the closing price of the Company’s stock on the date of grant.
During 2011, the Compensation Committee of the Board of Directors, pursuant to the 2009 Plan, awarded employees a total of 903,214 RSUs at fair values ranging from $3.06 per share to $9.71 per share. Generally, one-third of the shares underlying each grant become issuable on the anniversary of each grant date, assuming continued employment or to the Company through such date. Based on the fair value of the Company’s common stock price at the grant dates, the Company estimated the aggregate fair value of these awards at approximately $4.9 million. The estimated fair value of these awards is being amortized to compensation expense for each grant on a straight-line basis over the estimated service period.
During 2010, the Compensation Committee of the Board of Directors, pursuant to the 2009 Plan, awarded employees a total of 620,236 RSUs, including 235,900 RSUs to Enfora employees in connection with the acquisition (the “Enfora RSUs”), at fair values ranging from $6.95 per share to $9.76 per share. Generally, one-third of the shares underlying each grant become issuable on the anniversary of each grant date, assuming continued employment or to the Company through such date. However, one-fourth of the shares underlying each grant of the Enfora RSUs become issuable on the anniversary of each grant date, assuming continued employment or to the Company through such date. Based on the fair value of the Company’s common stock price at the grant dates, the Company estimated the aggregate fair value of these awards at approximately $5.0 million. The estimated fair value of these awards is being amortized to compensation expense for each grant on a straight-line basis over the estimated service period.
During 2009, the Compensation Committee of the Board of Directors, awarded a total of 424,416 RSUs to employees at fair values ranging from $5.51 per share to $11.83 per share. Generally, one-third of the shares underlying each grant become issuable on the anniversary of each grant date, assuming continued employment or to the Company through such date. Based on the fair value of the Company’s common stock price at the grant dates, the Company estimated the aggregate fair value of these awards at approximately $2.5 million. The estimated fair value of these awards is being amortized to compensation expense for each grant on a straight-line basis, which is predominately over a three-year service period.
A summary of restricted stock unit activity for the year ended December 31, 2011 is presented below (shares in thousands):
| Shares | ||||
| Non-vested at December 31, 2010 |
829 | |||
| Granted |
903 | |||
| Vested |
(362 | ) | ||
| Forfeited |
(81 | ) | ||
|
|
|
|||
| Non-vested at December 31, 2011 |
1,289 | |||
|
|
|
|||
As of December 31, 2011, there was $6.8 million of unrecognized compensation expense related to non-vested RSUs. That expense is expected to be recognized over a weighted average period of 1.8 years. The
F-24
Table of Contents
total fair value of RSUs recognized as expense during the years ended December 31, 2011, 2010 and 2009 was $2.6 million, $1.7 million and $2.1 million, respectively.
2000 Employee Stock Purchase Plan
The Company’s 2000 Employee Stock Purchase Plan (the “ESPP”) permits eligible employees of the Company to purchase newly issued shares of common stock, at a price equal to 85% of the lower of the fair market value on (i) the first day of the offering period or (ii) the last day of each six-month purchase period, through payroll deductions of up to 10% of their annual cash compensation. In June 2009, the Company’s shareholders approved an amendment to the ESPP to increase the number of shares available for issuance under the ESPP by 750,000 shares, extend the term of the ESPP to June 2019, cease the automatic annual increase in the number of shares available for issuance under the ESPP and make certain other technical changes.
During the years ended December 31, 2011, 2010 and 2009, the Company issued 163,142 shares, 514,540 shares and 425,941 shares, respectively, under the ESPP. During the years ended December 31, 2011, 2010 and 2009, the Company received $470,000, $1.7 million and $1.3 million, respectively, in cash through employee withholdings.
On November 4, 2010, the Company announced the termination of the ESPP as of November 15, 2010 due to a lack of available shares. The cancellation of the awards was accounted for as a repurchase for no consideration. The previously unrecognized compensation cost as of November 15, 2010 of $316,000 was fully expensed in the fourth quarter of 2010. On August 30, 2011, the Company announced the reinstatement of the ESPP program effective as of September 8, 2011. The ESPP authorizes the Company to issue 1,250,111 shares of common stock for purchase by eligible employees.
The total fair value of ESPP awards recognized as expense during the years ended December 31, 2011, 2010 and 2009 was $707,000, $994,000 and $1.2 million, respectively.
| 10. | Income Taxes |
Total income taxes for the years ended December 31, 2011, 2010 and 2009 were allocated as follows (in thousands):
| Year Ended December 31, | ||||||||||||
| 2011 | 2010 | 2009 | ||||||||||
| To income |
$ | (9,503 | ) | $ | 7,893 | $ | 527 | |||||
| To stockholders’ equity |
240 | 277 | 232 | |||||||||
|
|
|
|
|
|
|
|||||||
| Total income taxes |
$ | (9,263 | ) | $ | 8,170 | $ | 759 | |||||
|
|
|
|
|
|
|
|||||||
Income (loss) before taxes for the years ended December 31, 2011, 2010 and 2009 is comprised of the following (in thousands):
| Year Ended December 31, | ||||||||||||
| 2011 | 2010 | 2009 | ||||||||||
| Domestic |
$ | (36,091 | ) | $ | (27,091 | ) | $ | 2,674 | ||||
| Foreign |
1,696 | 1,534 | 1,765 | |||||||||
|
|
|
|
|
|
|
|||||||
| Income (loss) before taxes |
$ | (34,395 | ) | $ | (25,557 | ) | $ | 4,439 | ||||
|
|
|
|
|
|
|
|||||||
F-25
Table of Contents
The provision (benefit) for income taxes for the years ended December 31, 2011, 2010 and 2009 is comprised of the following (in thousands):
| Year Ended December 31, | ||||||||||||
| 2011 | 2010 | 2009 | ||||||||||
| Current: |
||||||||||||
| Federal |
$ | (10,786 | ) | $ | (3,602 | ) | $ | 76 | ||||
| State |
— | 11 | 288 | |||||||||
| Foreign |
84 | 43 | (9 | ) | ||||||||
|
|
|
|
|
|
|
|||||||
| Total Current |
(10,702 | ) | (3,548 | ) | 355 | |||||||
|
|
|
|
|
|
|
|||||||
| Deferred: |
||||||||||||
| Federal |
(114 | ) | 9,882 | (230 | ) | |||||||
| State |
— | 789 | 1,054 | |||||||||
| Foreign |
1,313 | 770 | (652 | ) | ||||||||
|
|
|
|
|
|
|
|||||||
| Total Deferred |
1,199 | 11,441 | 172 | |||||||||
|
|
|
|
|
|
|
|||||||
| Provision (benefit) for income taxes |
$ | (9,503 | ) | $ | 7,893 | $ | 527 | |||||
|
|
|
|
|
|
|
|||||||
The Company’s deferred tax assets consist of the following (in thousands):
| December 31, | ||||||||
| 2011 | 2010 | |||||||
| Deferred tax assets: |
||||||||
| Accrued expenses |
$ | 4,941 | $ | 3,592 | ||||
| Inventory obsolescence provision |
1,647 | 2,510 | ||||||
| Depreciation and amortization |
4,626 | 4,166 | ||||||
| Deferred rent |
409 | 391 | ||||||
| Net operating loss and tax credit carryforwards |
32,569 | 22,911 | ||||||
| Stock-based compensation |
5,662 | 4,972 | ||||||
| Unrecognized tax benefits |
439 | 1,181 | ||||||
|
|
|
|
|
|||||
| Deferred tax assets |
50,293 | 39,723 | ||||||
| Deferred tax liabilities: |
||||||||
| Amortization of acquired intangibles |
(12,777 | ) | (15,619 | ) | ||||
|
|
|
|
|
|||||
| Net deferred tax assets |
37,516 | 24,104 | ||||||
| Valuation allowance |
(36,395 | ) | (21,783 | ) | ||||
|
|
|
|
|
|||||
| Net deferred tax assets |
$ | 1,121 | $ | 2,321 | ||||
|
|
|
|
|
|||||
The Company recognizes federal, state and foreign current tax liabilities or assets based on its estimate of taxes payable to or refundable by tax authorities in the current fiscal year. The Company also recognizes federal, state and foreign deferred tax liabilities or assets based on the Company’s estimate of future tax effects attributable to temporary differences and carry forwards. The Company records a valuation allowance to reduce any deferred tax assets by the amount of any tax benefits that, based on available evidence and judgment, are not expected to be realized.
The Company assesses whether a valuation allowance should be recorded against its deferred tax assets based on the consideration of all available evidence, using a “more likely than not” realization standard. The four sources of taxable income that must be considered in determining whether deferred tax assets will be realized are: (1) future reversals of existing taxable temporary differences (i.e., offset of gross deferred tax assets against gross deferred tax liabilities); (2) taxable income in prior carryback years, if carryback is permitted under the
F-26
Table of Contents
applicable tax law; (3) tax planning strategies; and (4) future taxable income exclusive of reversing temporary differences and carryforwards.
After a review of the four sources of taxable income described above and after being in a three year cumulative loss position at the end of 2011, the Company recognized an increase in the valuation allowance related to its U.S.-based deferred taxes created in 2011 and its Canadian deferred taxes, with a corresponding charge to income tax expense, of $14.6 million.
Related to the Company’s acquisition of Enfora on November 30, 2010, the Company assumed U.S. -based net deferred tax liabilities of $3.9 million. This net deferred tax liability predominantly resulted from the estimated future tax impact of fair values assigned to intangible assets purchased upon acquisition of Enfora as offset by Enfora related estimated deferred tax assets resulting from net operating loss and research and development tax credit carry forwards generated prior to the acquisition of Enfora by the Company. Consistent with accounting guidance, the Company released $4.8 million of its U.S.-based valuation allowance in 2010 and increased its allowance by $0.9 million in 2011 related to the then existing 100% valuation allowance against the Company’s U.S.-based deferred tax assets upon completion of its purchase price allocation.
At December 31, 2011, the valuation allowance consisted of $32.1 million relating to the Company’s domestic tax assets and $4.3 million related to the Company’s Canadian deferred tax assets. At December 31, 2010, the valuation allowance consisted of $18.9 million relating to the Company’s domestic tax assets and $2.9 million related to certain to the Company’s Canadian deferred tax assets.
The net unreserved portion of the Company’s remaining deferred tax assets at December 31, 2011 primarily related to research and development tax credits associated with the Company’s Canadian subsidiary.
During the years ended December 31, 2011 and 2010, the Company recorded deferred income tax expense of $14.6 million and $17.9 million, respectively, related to the changes in the valuation allowances on deferred tax assets. During the year ended 2009, the Company recorded a deferred income tax expense of $1.2 million related to the changes in the valuation allowances on deferred tax assets.
The provision (benefit) for income taxes reconciles to the amount computed by applying the statutory federal income tax rate of 34% in 2011, 2010 and 2009 to income before provision for income taxes as follows (in thousands):
| Year Ended December 31, | ||||||||||||
| 2011 | 2010 | 2009 | ||||||||||
| Federal tax provision, at statutory rate |
$ | (11,694 | ) | $ | (8,690 | ) | $ | 1,509 | ||||
| State tax, net of federal benefit |
(733 | ) | (509 | ) | 87 | |||||||
| Change in valuation allowance—current year |
14,612 | 7,888 | 1,152 | |||||||||
| Change in valuation allowance—prior year deferreds |
— | 14,840 | — | |||||||||
| Tax expense (benefit) from business combination |
909 | (4,838 | ) | — | ||||||||
| Research and development credits |
(1,731 | ) | (2,044 | ) | (3,073 | ) | ||||||
| Share-based compensation |
526 | 917 | 1,106 | |||||||||
| Merger fees |
— | 674 | — | |||||||||
| Uncertain tax positions |
(11,809 | ) | 322 | (528 | ) | |||||||
| Goodwill impairment |
596 | |||||||||||
| Other |
(179 | ) | (667 | ) | 274 | |||||||
|
|
|
|
|
|
|
|||||||
| $ | (9,503 | ) | $ | 7,893 | $ | 527 | ||||||
|
|
|
|
|
|
|
|||||||
At December 31, 2011, the Company has U.S. federal net operating loss carryforwards of approximately $63.0 million. Federal net operating loss carryforwards expire at various dates from 2026 through 2032. The
F-27
Table of Contents
Company has California net operating loss carryforwards of approximately $24.4 million, which expire at various dates from 2014 through 2032. The Company has California research and development tax credit carryforwards of approximately $5.0 million. The California tax credits have no expiration date. The Company also has federal research and development tax credit carryforwards of approximately $3.0 million. The federal tax credits expire at various dates from 2027 through 2031.
It is the Company’s intention to reinvest undistributed earnings of its foreign subsidiaries and thereby indefinitely postpone their remittance. Accordingly, no provision has been made for foreign withholding taxes on United States income taxes which may become payable if undistributed earnings of the foreign subsidiary were paid as dividends to the Company.
The Company follows the accounting guidance related to financial statement recognition, measurement and disclosure of uncertain tax positions. The Company recognizes the impact of an uncertain income tax position on an income tax return at the largest amount that is more-likely-than-not to be sustained upon audit by the relevant taxing authority. An uncertain income tax position will not be recognized if it has less than a 50% likelihood of being sustained. During the year ended December 31, 2011, the Company recognized approximately $9.5 million of income tax benefit plus $2.3 million of associated interest due to expiration of the applicable statutes of limitations for certain tax years. As of December 31, 2011 and 2010, the total liability for unrecognized tax benefits was $0.4 million and $12.0 million, respectively, and is included in other long-term liabilities.
A reconciliation of the beginning and ending amounts of unrecognized tax benefits is as follows (in thousands):
| Amount | ||||
| Unrecognized tax benefits balance at December 31, 2008 |
$ | 41,435 | ||
| Increases related to current and prior year tax positions |
2,590 | |||
| Settlements and lapses in statutes of limitations |
(2,890 | ) | ||
|
|
|
|||
| Unrecognized tax benefits balance at December 31, 2009 |
41,135 | |||
| Increases related to current and prior year tax positions |
251 | |||
| Settlements and lapses in statutes of limitations |
— | |||
|
|
|
|||
| Unrecognized tax benefits balance at December 31, 2010 |
41,386 | |||
| Increases related to current and prior year tax positions |
899 | |||
| Settlements and lapses in statutes of limitations |
(9,490 | ) | ||
|
|
|
|||
| Unrecognized tax benefits balance at December 31, 2011 |
$ | 32,795 | ||
|
|
|
|||
Included in the balances of unrecognized tax benefits at December 31, 2011 are $0.2 million of tax benefits that, if recognized, would affect the effective tax rate.
The Company recognizes interest and penalties related to unrecognized tax benefits in the provision for income taxes. As of December 31, 2011 and 2010, the Company recorded approximately $0.2 million and $2.3 million, respectively, of accrued interest related to uncertain tax positions.
In the third quarter of 2012, the Company may release $50,000 of its liability for unrecognized tax benefits due to the expiration of the statute of limitations applicable to the 2007 taxable year.
The Company and its subsidiaries file U.S., state, and foreign income tax returns in jurisdictions with various statutes of limitations. The California Franchise Tax Board is currently conducting an examination of the Company’s California income tax returns for 2006 and 2007. The State of Texas is currently conducting an examination of the Company’s 2007 Texas franchise tax return. The Company is also subject to various federal income tax examinations for the 2003 through 2010 calendar years due to the availability of net operating loss carryforwards. The Company believes appropriate provisions for all outstanding issues have been made for all
F-28
Table of Contents
jurisdictions and all open years. However, because audit outcomes and the timing of audit settlements are subject to significant uncertainty, the Company’s current estimate of the total amounts of unrecognized tax benefits could increase or decrease for all open years.
| 11. | Commitments and Contingencies |
Capital Leases
The Company did not purchase equipment under capital leases during the year ended December 31, 2011 or 2010. At December 31, 2011 and 2010, assets held under capital leases had a net book value of $52,000 and $154,000, respectively, net of accumulated amortization of $458,000 and $356,000, respectively. The present value of the net minimum lease payments as of December 31, 2011 is $47,000.
Operating Leases
The Company leases its office space and certain equipment under non-cancelable operating leases with various terms through 2016. The minimum annual rent on the Company’s office space is subject to increases based on stated rental adjustment terms, property taxes and operating costs and contains rent concessions. For financial reporting purposes, rent expense is recognized on a straight-line basis over the term of the lease. Accordingly, rent expense recognized in excess of rent paid is reflected as deferred rent. Rental expense under operating leases in 2011, 2010 and 2009 was $4.7 million, $3.5 million and $3.1 million, respectively. The Company’s office space lease contains incentives in the form of reimbursement from the landlord for a portion of the costs of leasehold improvements incurred by the Company which are recorded to rent expense on a straight-line basis over the term of the lease.
The minimum future lease payments under non-cancelable operating leases as of December 31, 2011 are as follows (in thousands):
| For the Period Ending December 31, |
Amount | |||
| 2012 |
$ | 3,238 | ||
| 2013 |
2,771 | |||
| 2014 |
2,806 | |||
| 2015 |
2,354 | |||
| 2016 |
2,425 | |||
|
|
|
|||
| Total minimum lease payments |
$ | 13,594 | ||
|
|
|
|||
Committed Purchase Orders
The Company has entered into purchase commitments totaling approximately $117.2 million with certain contract manufacturers under which the Company has committed to buy a minimum amount of designated products between January 2012 and December 2012. In certain of these agreements, the Company may be required to acquire and pay for such products up to the prescribed minimum or forecasted purchases.
Management Retention Agreements
During 2005 and 2004, the Company entered into management retention agreements with certain of the Company’s executive officers. The agreements entitle those employees to enumerated severance benefits if, within the one year period immediately following a change of control (as defined in the agreement) or at the direction of an acquirer in anticipation of such an event, the Company terminates the employee’s employment other than for cause or disability or the employee terminates his or her employment for good reason. These severance benefits would include a lump sum payment of three times the sum of the employee’s annual base salary then in effect and the applicable targeted annual bonus, continued employee benefits, accelerated vesting
F-29
Table of Contents
of the employee’s stock incentive awards, a tax equalization payment to eliminate the effects of any applicable excise tax and financial planning and outplacement services.
In November 2007, the Company entered into an employment agreement with the Company’s Chief Executive Officer, with an initial term of three years. Under the agreement, Mr. Leparulo will continue to serve as Chairman of the Board and as the Company’s most senior officer. The agreement entitles Mr. Leparulo to enumerated severance benefits under various circumstances if Mr. Leparulo’s employment with the Company is terminated. These enumerated severance benefits vary according to whether (a) Mr. Leparulo’s employment with the Company is terminated within the one year period immediately following a change in control (as defined in the agreement) or at the direction of an acquirer in anticipation of such an event; (b) the Company terminates his employment other than for cause or he terminates his employment for good reason; or (c) the Company terminates his employment for cause or he terminates his employment for other than good reason. Depending on the cause of the employment termination, the enumerated severance benefits include a lump sum payment ranging from one to three years annual base salary then in effect, an additional lump sum bonus payment representing certain multiples of his targeted bonus, and varying periods of ongoing employee benefits including health care and outplacement services.
Legal Matters and Indemnification
The Company is, from time to time, party to various legal proceedings arising in the ordinary course of business. For example, the Company is currently named as a defendant or co-defendant in a number of patent infringement lawsuits in the U.S. and is indirectly participating in other U.S. patent infringement actions pursuant to its contractual indemnification obligations to certain customers. Based on evaluation of these matters and discussions with Company’s counsel, the Company believes that liabilities arising from or sums paid in settlement of these existing matters would not have a material adverse effect on its consolidated results of operations or financial condition.
On September 15, 2008 and September 18, 2008, two putative securities class action lawsuits were filed in the United States District Court for the Southern District of California on behalf of persons who allegedly purchased our stock between February 5, 2007 and August 19, 2008. On December 11, 2008, these lawsuits were consolidated into a single action entitled Backe v. Novatel Wireless, Inc., et al., Case No. 08-CV-01689-H (RBB) (Consolidated with Case No. 08-CV-01714-H (RBB)) (U.S.D.C., S.D. Cal.). In May 2010, the district court re-captioned the case In re Novatel Wireless Securities Litigation. The plaintiffs filed the consolidated complaint on behalf of persons who allegedly purchased our stock between February 27, 2007 and November 10, 2008. The consolidated complaint names the Company and certain of our current and former officers as defendants. The consolidated complaint alleges generally that we issued materially false and misleading statements during the relevant time period regarding the strength of our products and market share, our financial results and our internal controls. The plaintiffs are seeking an unspecified amount of damages and costs. The court has denied defendants’ motions to dismiss. In May 2010, the court entered an order granting the plaintiffs’ motion for class certification and certified a class of purchasers of Company common stock between February 27, 2007 and September 15, 2008. On February 14, 2011, following extensive discovery, the Company filed a motion for summary judgment on all of plaintiffs’ claims. A trial date was set for May 10, 2011. On March 15, 2011, the case was reassigned to a new district judge, the Honorable Anthony J. Battaglia. Following the reassignment, the court vacated the trial date pending the court’s consideration of dispositive motions. Oral argument on the motion for summary judgment was heard by the court on June 17, 2011. On November 23, 2011, the court issued an order granting in part and denying in part the motion for summary judgment. A new trial date has not yet been set. The Company intends to defend this litigation vigorously. At this time, there can be no assurance as to the ultimate outcome of this litigation. We have not recorded any significant accruals for contingent liabilities associated with this matter based on our belief that a liability, while possible, is not probable. Further, any possible range of loss cannot be estimated at this time.
On October 8, 2008, a purported shareholder, Jerry Rosenbaum, filed a derivative action in the Superior Court for the State of California, County of San Diego, against the Company, as nominal defendant, and certain
F-30
Table of Contents
of our current and former officers and directors, as defendants. Two other purported shareholders, Mark Campos and Chris Arnsdorf, separately filed substantially similar lawsuits in the same court on October 20, 2008 and November 5, 2008, respectively. On October 16, 2009, the plaintiffs filed a consolidated complaint. The consolidated complaint, Case No. 37-2008-00093576-CU-NP-CTL, alleges claims for breaches of fiduciary duties, violations of certain provisions of the California Corporations Code, unjust enrichment, and gross mismanagement. In February 2010, the court granted the defendants’ motion to stay the action pending the resolution of the federal securities class action described above. In July 2010, the parties executed a memorandum of understanding setting forth the terms to be included in a contemplated settlement. Any settlement would be subject to court approval. The memorandum of understanding does not contemplate any restitution from the defendants. Following execution of the memorandum of understanding, plaintiffs conducted certain confirmatory discovery and sought to negotiate an award of legal fees as part of the terms to be included in a stipulation of settlement. Plaintiffs have since purported to terminate the memorandum of understanding. On January 28, 2011, the court held an informal status conference, at which plaintiffs requested that the court lift the stay of the action. The court declined plaintiffs’ request. Following certain additional confirmatory discovery and negotiations, on March 2, 2012, the parties executed a Stipulation of Settlement, which settlement will be submitted to the court for approval. The settlement, if approved, would require the Company to maintain and/or implement certain corporate governance measures and would provide for the payment of fees and expenses to the plaintiffs’ counsel of an amount not to exceed $900,000, $500,000 of which is expected to be paid out of insurance proceeds, and $400,000 to be paid by the Company.
In the normal course of business, the Company periodically enters into agreements that require the Company to indemnify and defend its customers for, among other things, claims alleging that the Company’s products infringe third-party patents or other intellectual property rights. The Company’s maximum exposure under these indemnification provisions cannot be estimated but the Company does not believe that there are any matters individually or collectively that would have a material adverse effect on its financial condition.
The Company has accrued $500,000 as of December 31, 2011 related to our best estimate of potential settlements on legal and indemnification matters for which we have deemed the outcome to be probable.
Credit Facility
During July 2011, the Company entered into a credit facility with a bank to allow margin borrowings based on the Company’s investments in cash equivalents and marketable securities held with the bank. This facility is collateralized by the Company’s cash equivalents and marketable securities held with the bank. Borrowings under the facility incur an interest rate at the bank’s base rate plus 1%. This margin account facility provides the Company with the flexibility to access cash for short periods of time and avoids the need to sell marketable securities for these short-term requirements. At December 31, 2011, the Company had approximately $25.1 million in cash equivalents and marketable securities held at this bank. Any monies borrowed and interest incurred are payable on demand, and there is no express expiration date to the credit facility. During the third quarter ended September 30, 2011, the Company borrowed $12.0 million and repaid the entire amount during the same period. As of December 31, 2011, the Company had no outstanding borrowings under the credit facility.
| 12. | Segment Information and Concentrations of Risk |
Segment Information
The Company operates in the wireless broadband technology industry and senior management makes decisions about allocating resources based on the following reportable segments:
Mobile Computing Products segment—includes our MiFi products, USB and PC-card modems and Embedded Modules that enable data transmission and services via cellular wireless networks. All products within the segment represent a single product family.
F-31
Table of Contents
M2M Products and Solutions segment—includes our intelligent asset-management solutions utilizing wireless technology and M2M communications acquired with our acquisition of Enfora (Note 2).
Segment net revenues and segment operating income (loss) represent the primary financial measures used by senior management to assess performance and include the net revenues, cost of net revenues, and operating expenses for which management is held accountable. Segment operating expenses include sales and marketing, research and development, general and administration, and amortization expenses that are directly related to individual segments. Segment earnings (loss) also may include acquisition-related costs, purchase price amortization, restructuring and integration costs.
The table below presents net revenues and operating income (loss) for our reportable segments (in thousands):
| Year Ended December 31, | ||||||||||||
| 2011 | 2010 | 2009 | ||||||||||
| Net revenues from reportable segment: |
||||||||||||
| Mobile Computing Products |
$ | 358,106 | $ | 332,464 | $ | 337,422 | ||||||
| M2M Products and Solutions |
44,756 | 6,478 | — | |||||||||
|
|
|
|
|
|
|
|||||||
| Total |
$ | 402,862 | $ | 338,942 | $ | 337,422 | ||||||
|
|
|
|
|
|
|
|||||||
| Operating income (loss): |
||||||||||||
| Mobile Computing Products |
$ | (13,764 | ) | $ | (23,027 | ) | $ | 2,750 | ||||
| M2M Products and Solutions |
(19,963 | ) | (1,975 | ) | — | |||||||
|
|
|
|
|
|
|
|||||||
| Total |
$ | (33,727 | ) | $ | (25,002 | ) | $ | 2,750 | ||||
|
|
|
|
|
|
|
|||||||
| December 31, | ||||||||
| 2011 | 2010 | |||||||
| Identifiable assets by reportable segment: |
||||||||
| Mobile Computing Products |
$ | 181,180 | $ | 217,445 | ||||
| M2M Products and Solutions |
67,999 | 84,663 | ||||||
|
|
|
|
|
|||||
| Total |
$ | 249,179 | $ | 302,108 | ||||
|
|
|
|
|
|||||
The Company has operations in the United States, Canada, Europe and Asia. The following table details the geographic concentration of the Company’s assets in the United States, Canada, Europe and Asia (in thousands):
| Year Ended December 31, | ||||||||
| 2011 | 2010 | |||||||
| United States |
$ | 243,030 | $ | 293,227 | ||||
| Canada |
4,764 | 8,059 | ||||||
| Europe |
280 | 318 | ||||||
| Asia |
1,105 | 504 | ||||||
|
|
|
|
|
|||||
| $ | 249,179 | $ | 302,108 | |||||
|
|
|
|
|
|||||
F-32
Table of Contents
The following table details the Company’s concentration of net revenues by geographic region based on shipping destination:
| Year Ended December 31, | ||||||||||||
| 2011 | 2010 | 2009 | ||||||||||
| North America |
93.5 | % | 95.0 | % | 93.0 | % | ||||||
| Europe |
4.0 | 4.7 | 6.6 | |||||||||
| Asia |
2.5 | 0.3 | 0.4 | |||||||||
|
|
|
|
|
|
|
|||||||
| 100.0 | % | 100.0 | % | 100.0 | % | |||||||
|
|
|
|
|
|
|
|||||||
Concentrations of Risk
Substantially all of the Company’s net revenues are derived from sales of wireless access products. Any significant decline in market acceptance of the Company’s products or in the financial condition of the Company’s customers would have an adverse effect on the Company’s results of operations and financial condition.
A significant portion of the Company’s net revenues come from a small number of customers. Two customers accounted for 50.8% and 13.1% of 2011 net revenues. Two customers accounted for 55.7% and 17.1% of 2010 net revenues. Three customers accounted for 38.1%, 20.5% and 10.7% of 2009 net revenues. All significant customers are included in the Company’s Mobile Computing Products segment.
A significant portion of the Company’s accounts receivables comes from a small number of customers. At December 31, 2011, the Company had two customers who accounted for 46.5% and 19.8% of total accounts receivable. At December 31, 2010, the Company had two customers who accounted for 35.04% and 30.9% of total accounts receivable.
The Company outsources its manufacturing to four third-party manufacturers. If they were to experience delays, disruptions, capacity constraints or quality control problems in its manufacturing operations, product shipments to the Company’s customers could be delayed or its customers could consequently elect to cancel the underlying order, which would negatively impact the Company’s net revenues and results of operations.
| 13. | Retirement Savings Plan |
The Company has a defined contribution 401(K) retirement savings plan (the “Plan”). Substantially all of the Company’s U.S. employees are eligible to participate in the Plan after meeting certain minimum age and service requirements. Employees may make discretionary contributions to the Plan subject to Internal Revenue Service limitations. Employer matching contributions under the plan amounted to approximately $1.1 million, $1.0 million and $858,000 for the years ended December 31, 2011, 2010 and 2009, respectively. Employer matching contributions vest over a two-year period. The Company has a registered retirement savings plan for its Canadian employees. Substantially all of the Company’s Canadian employees are eligible to participate in this plan. Employees make discretionary contributions to the plan subject to local limitations. Employer contributions to the Canadian plan amounted to approximately $280,000, $236,000 and $472,000 for the years ended December 31, 2011, 2010 and 2009, respectively.
F-33
Table of Contents
| 14. | Quarterly Financial Information (Unaudited) |
The following is a summary of unaudited quarterly results of operations for the years ended December 31, 2011 and 2010.
| Quarter | ||||||||||||||||
| First | Second | Third | Fourth | |||||||||||||
| (in thousands, except per share amounts) | ||||||||||||||||
| 2011: |
||||||||||||||||
| Net revenues |
$ | 61,784 | $ | 118,021 | $ | 113,263 | $ | 109,794 | ||||||||
| Gross profit |
5,994 | 26,182 | 26,690 | 25,726 | ||||||||||||
| Net loss applicable to common stockholders |
(22,088 | ) | (3,898 | ) | 4,498 | (3,404 | ) | |||||||||
| Basic net earning (loss) per common share |
(0.69 | ) | (0.12 | ) | 0.14 | (0.11 | ) | |||||||||
| Diluted net earnings (loss) per common share |
(0.69 | ) | (0.12 | ) | 0.14 | (0.11 | ) | |||||||||
| 2010: |
||||||||||||||||
| Net revenues |
$ | 72,239 | $ | 71,823 | $ | 75,602 | $ | 119,278 | ||||||||
| Gross profit |
17,769 | 13,592 | 13,190 | 21,743 | ||||||||||||
| Net loss applicable to common stockholders |
(3,389 | ) | (22,039 | ) | (7,105 | ) | (917 | ) | ||||||||
| Basic net loss per common share |
(0.11 | ) | (0.70 | ) | (0.22 | ) | (0.03 | ) | ||||||||
| Diluted net earnings (loss) per common share |
(0.11 | ) | (0.70 | ) | (0.22 | ) | (0.03 | ) | ||||||||
F-34
Table of Contents
NOVATEL WIRELESS, INC.
Valuation and Qualifying Accounts
For the Years Ended December 31, 2011, 2010 and 2009 (in thousands):
| Balance At Beginning of Year |
Additions Charged to Operations |
Deductions From Reserves |
Balance At End of Year |
|||||||||||||
| Allowance for Doubtful Accounts: |
||||||||||||||||
| December 31, 2011 |
$ | 228 | $ | 41 | $ | 24 | $ | 245 | ||||||||
| December 31, 2010 |
741 | 141 | 654 | 228 | ||||||||||||
| December 31, 2009 |
1,010 | 35 | 304 | 741 | ||||||||||||
| Warranty: |
||||||||||||||||
| December 31, 2011 |
2,279 | 2,642 | 3,396 | 1,525 | ||||||||||||
| December 31, 2010 |
3,039 | 1,350 | 2,110 | 2,279 | ||||||||||||
| December 31, 2009 |
3,471 | 2,580 | 3,012 | 3,039 | ||||||||||||
| Deferred Tax Asset Valuation Allowance: |
||||||||||||||||
| December 31, 2011 |
21,783 | 14,612 | — | 36,395 | ||||||||||||
| December 31, 2010 |
3,897 | 22,724 | 4,838 | 21,783 | ||||||||||||
| December 31, 2009 |
2,746 | 1,151 | — | 3,897 | ||||||||||||
| Sales Returns Allowance: |
||||||||||||||||
| December 31, 2011 |
346 | 911 | 712 | 545 | ||||||||||||
| December 31, 2010 |
303 | 188 | 145 | 346 | ||||||||||||
| December 31, 2009 |
478 | 194 | 369 | 303 | ||||||||||||
F-35
Table of Contents
EXHIBIT INDEX
The following Exhibits are filed as part of, or incorporated by reference into, this Report on Form 10-K:
| Exhibit Number |
Description | |
| 2.1 | Agreement and Plan of Merger, dated as of November 5, 2010, by and between Novatel Wireless, Inc., England Acquisition Corp. and Enfora, Inc. (incorporated by reference to Exhibit 2.1 to the Company’s Current Report on Form 8-K, filed on November 10, 2010). | |
| 3.1 | Amended and Restated Certificate of Incorporation (incorporated by reference to Exhibit 3.1 to the Company’s Annual Report on Form 10-K for the year ended December 31, 2000, filed March 27, 2001). | |
| 3.2 | Certificate of Amendment to Amended and Restated Certificate of Incorporation (incorporated by reference to Exhibit 3.1 to the Company’s Quarterly Report on Form 10-Q for the period ended September 30, 2002, filed November 14, 2002). | |
| 3.3 | Certificate of Amendment to Amended and Restated Certificate of Incorporation (incorporated by reference to Exhibit 3.2 to the Company’s Amendment No. 1 to Form 10-K on Form 10-K/A for the year ended December 31, 2003, filed March 31, 2004). | |
| 3.4 | Amended and Restated Certificate of Designation of Series A Convertible Preferred Stock (incorporated by reference to Exhibit 3.4 to the Company’s Amendment No. 1 to Form 10-K on Form 10-K/A for the year ended December 31, 2003, filed March 31, 2004). | |
| 3.5 | Certificate of Designation of Series B Convertible Preferred Stock (incorporated by reference to Exhibit 3.5 to the Company’s Amendment No. 1 to Form 10-K on Form 10-K/A for the year ended December 31, 2003, filed March 31, 2004). | |
| 3.6 | Bylaws (incorporated by reference to Exhibit 3.2 to the Company’s Annual Report on Form 10-K for the year ended December 31, 2000, filed on March 27, 2001). | |
| 4.1 | Amended and Restated Registration Rights Agreement, dated as of June 15, 1999, by and among the Company and certain of its stockholders (incorporated by reference to Exhibit 10.4 to the Company’s Registration Statement on Form S-1 (No. 333-42570), filed July 28, 2000, as amended). | |
| 4.2 | Form of Securities Purchase Agreement entered into in connection with the Company’s 2003 Series B Convertible Preferred Stock Financing (incorporated by reference to Exhibit 4.1 to the Company’s Current Report on Form 8-K, filed March 28, 2003). | |
| 4.3 | Registration Rights Agreement, dated as of March 12, 2003, entered into in connection with the Company’s 2003 Series B Convertible Preferred Stock Financing (incorporated by reference to Exhibit 4.8 to the Company’s Current Report on Form 8-K, filed March 28, 2003). | |
| 4.4 | Registration Rights Agreement, dated as of January 13, 2004, entered into in connection with the Company’s January 2004 Common Stock and Warrant Financing Transaction (incorporated by reference to Exhibit 10.21 to the Company’s Annual Report on Form 10-K for the year ended December 31, 2003, filed March 15, 2004). | |
| 10.1* | Amended and Restated 1997 Employee Stock Option Plan (“1997 Plan”) (incorporated by reference to Exhibit 10.1 to the Company’s Registration Statement on Form S-1 (No. 333-42570), filed July 28, 2000 as amended). | |
| 10.2* | Amended and Restated Novatel Wireless, Inc. 2000 Stock Incentive Plan (“2000 Plan”) (incorporated by reference to Exhibit 10.1 to the Company’s Quarterly Report on Form 10-Q for the quarter ended June 30, 2007, filed August 9, 2007). | |
| 10.3* | Form of Executive Officer Stock Option Agreement under the 2000 Plan (incorporated by reference to Exhibit 10.3 to the Company’s Annual Report on Form 10-K for the year ended December 31, 2005, filed March 16, 2006). | |
Table of Contents
| Exhibit Number |
Description | |
| 10.4* | Form of Director Stock Option Agreement under the 2000 Plan (incorporated by reference to Exhibit 10.4 to the Company’s Annual Report on Form 10-K for the year ended December 31, 2005, filed March 16, 2006). | |
| 10.5* | Form of Amendment of Stock Option Agreements, dated July 20, 2006, by and between the Company and Optionee with respect to the 1997 Plan (incorporated by reference to Exhibit 10.2 to the Company’s Quarterly Report on Form 10-Q for the period ended September 30, 2006, filed November 9, 2006). | |
| 10.6* | Form of Amendment of Stock Option Agreements, dated July 20, 2006, by and between the Company and Optionee with respect to the 2000 Plan (incorporated by reference to Exhibit 10.3 to the Company’s Quarterly Report on Form 10-Q for the period ended September 30, 2006, filed November 9, 2006). | |
| 10.7* | Form of Amendment of Stock Option Agreements, dated July 20, 2006, by and between the Company and Optionee with respect to the 2000 Plan and grants made pursuant thereto in 2004 and subsequently (incorporated by reference to Exhibit 10.4 to the Company’s Quarterly Report on Form 10-Q for the period ended September 30, 2006, filed November 9, 2006). | |
| 10.8* | Amended and Restated Novatel Wireless, Inc. 2000 Employee Stock Purchase Plan (incorporated by reference to Appendix A to the Company’s Proxy Statement on Schedule 14A filed May 2 2011). | |
| 10.9* | Form of Restricted Share Award Agreement for restricted stock granted to non-employee directors (incorporated by reference to Exhibit 10.10 to the Company’s Quarterly Report on Form 10-Q for the period ended June 30, 2006, filed August 9, 2006). | |
| 10.10* | Form of Restricted Share Award Agreement for restricted stock granted to executive officers (incorporated by reference to Exhibit 10.11 to the Company’s Quarterly Report on Form 10-Q for the period ended June 30, 2006, filed August 9, 2006). | |
| 10.11* | Form of Indemnification Agreement by and between the Company and each of its executive officers and directors (incorporated by reference to Exhibit 10.1 to the Company’s Quarterly Report on Form 10-Q for the period ended September 30, 2009, filed November 2, 2009). | |
| 10.12* | Form of Change of Control Letter Agreement by and between the Company and certain of its executive officers (incorporated by reference to Exhibit 10.1 to the Company’s Quarterly Report on Form 10-Q for the period ended June 30, 2004, filed August 16, 2004). | |
| 10.13* | Employment Agreement, dated November 2, 2007, by and between Peter V. Leparulo and the Company (incorporated by reference to Exhibit 10.1 to the Company’s Quarterly Report on Form 10-Q for the quarter ended September 30, 2007, filed November 9, 2007). | |
| 10.14* | 2009 Omnibus Incentive Compensation Plan (incorporated by reference to Appendix B to the Company’s Proxy Statement on Schedule 14A, filed May 2, 2011). | |
| 10.15* | 2010 Senior Management Incentive Plan (incorporated by reference to Exhibit 10.1 to the Company’s Current Report on Form 8-K, filed September 13, 2010). | |
| 10.16* | Form of Severance Agreement between Novatel Wireless, Inc. and each of Kenneth G. Leddon and Robert M. Hadley (incorporated by reference to Exhibit 10.1 to the Company’s Current Report on Form 8-K, filed August 2, 2010. | |
| 10.17 | 2011 Senior Management Incentive Plan (incorporated by reference to Exhibit 10.1 to the Company’s Quarterly Report on Form 10-Q for the period ended June 30, 2011, filed on August 9, 2011). | |
| 21** | Subsidiaries of Novatel Wireless, Inc. | |
| 23.1** | Consent of Independent Registered Public Accounting Firm. | |
| 24 | Power of Attorney (See signature page). | |
| 31.1** | Certification of our Principal Executive Officer adopted pursuant to Section 302 of the Sarbanes-Oxley Act of 2002. |
Table of Contents
| Exhibit Number |
Description | |
| 31.2** | Certification of our Principal Financial Officer adopted pursuant to Section 302 of the Sarbanes-Oxley Act of 2002. | |
| 32.1** | Certification of Principal Executive Officer and Principal Financial Officer pursuant to 18 U.S.C. Section 1350, as adopted pursuant to Section 906 of the Sarbanes-Oxley Act of 2002. | |
| 101 | The following financial statements and footnotes from the Novatel Wireless, Inc. Annual Report on Form 10-K for the year ended December 31, 2011 formatted in eXtensible Business Reporting Language (XBRL): (i) Consolidated Balance Sheets; (ii) Consolidated Statements of Operations; (iii) Consolidated Statements of Stockholders’ Equity and Comprehensive Income (Loss); (iv) Consolidated Statements of Cash Flows; and (v) the Notes to Consolidated Financial Statements, tagged as blocks of text. | |
| * | Management contract, compensatory plan, or arrangement |
| ** | Filed herewith |