Attached files
| file | filename |
|---|---|
| 8-K - FORM 8-K - LegacyTexas Financial Group, Inc. | d307960d8k.htm |
| EX-99.1 - EX-99.1 - LegacyTexas Financial Group, Inc. | d307960dex991.htm |
Exhibit 99.2

| 1 NASDAQ: VPFG Fourth Quarter 2011 Earnings Mark Hord - Interim President and Chief Executive Officer Patti McKee - Executive Vice President and Chief Financial Officer |
| 2 Safe Harbor Statement When used in this presentation, in filings by the Company with the Securities and Exchange Commission (the "SEC"), in the Company's press releases or other public or shareholder communications, and in oral statements made with the approval of an authorized executive officer, the words or phrases "will likely result," "are expected to," "will continue," "is anticipated," "estimate," "project," "intends" or similar expressions are intended to identify "forward-looking statements" within the meaning of the Private Securities Litigation Reform Act of 1995. Such statements are subject to certain risks and uncertainties, including, among other things, completion of our merger with Highlands Bancshares, Inc., changes in economic conditions, legislative changes, changes in policies by regulatory agencies, fluctuations in interest rates, the risks of lending and investing activities, including changes in the level and direction of loan delinquencies and write-offs and changes in estimates of the adequacy of the allowance for loan losses, the Company's ability to access cost-effective funding, fluctuations in real estate values and both residential and commercial real estate market conditions, demand for loans and deposits in the Company's market area, the industry-wide decline in mortgage production, competition, changes in management's business strategies and other factors set forth under Risk Factors in the Company's Form 10-K, that could cause actual results to differ materially from historical earnings and those presently anticipated or projected. The Company wishes to advise readers that the factors listed above could materially affect the Company's financial performance and could cause the Company's actual results for future periods to differ materially from any opinions or statements expressed with respect to future periods in any current statements. The Company does not undertake - and specifically declines any obligation - to publicly release the result of any revisions which may be made to any forward-looking statements to reflect events or circumstances after the date of such statements or to reflect the occurrence of anticipated or unanticipated events. This communication does not constitute an offer to sell or the solicitation of an offer to buy any securities of the Company or the solicitation of any vote or approval. In connection with the proposed merger, the Company filed with the SEC, and the SEC has declared effective, a Registration Statement on Form S-4 that includes a proxy statement of Highlands and that also constitutes a prospectus of the Company (the "Proxy Statement/Prospectus"). Investors are strongly urged to read the definitive Proxy Statement/Prospectus regarding the proposed merger and other documents filed with the SEC by the Company, because they contain important information about the proposed merger. Investors and security holders of the Company and Highlands may obtain free copies of the definitive Proxy Statement/Prospectus for the proposed merger and other documents filed with the SEC by the Company through the SEC's website at www.sec.gov. These documents are also available free of charge by accessing the Company's website (www.viewpointfinancialgroup.com, under "SEC Filings") or by contacting Mark Hord at (972) 578-5000, Ext. 7440. The Company and Highlands and their respective directors and certain of their executive officers, may be deemed to be participants in the solicitation of proxies in respect of the transactions contemplated by the agreement between the Company and Highlands. Information regarding the Company's directors and executive officers is contained in the Company's Annual Report on Form 10-K for the fiscal year ended December 31, 2011, which was filed with the SEC on February 28, 2012, and in its proxy statement prepared in connection with its 2011 Annual Meeting of Shareholders, which was filed with the SEC on April 18, 2011. Information regarding Highland's directors and officers and a more complete description of the interests of Highlands's directors and officers in the proposed transaction is available in the definitive Proxy Statement/Prospectus. |
| Record Earnings All-time high quarterly net income of $9.8 million, up 90% from Q3 Record full year 2011 net income of $26.3 million, up 48% from 2010 Strong Loan Growth While Maintaining Solid Asset Quality 29% increase ($463 million) over YE 2010 Led by increases in Warehouse Purchase Program ($340 million) and Commercial RE ($104 million) Converted from thrift to national bank charter (December 2011) Three New Full Service Bank Locations added in 2011 Highlands Bancshares, Inc. Acquisition Enhance ViewPoint's C&I program; excellent geographic fit Highlands Chairman/CEO Kevin Hanigan to become ViewPoint President/CEO upon closing Q4 and Full Year 2011 Accomplishments 3 |
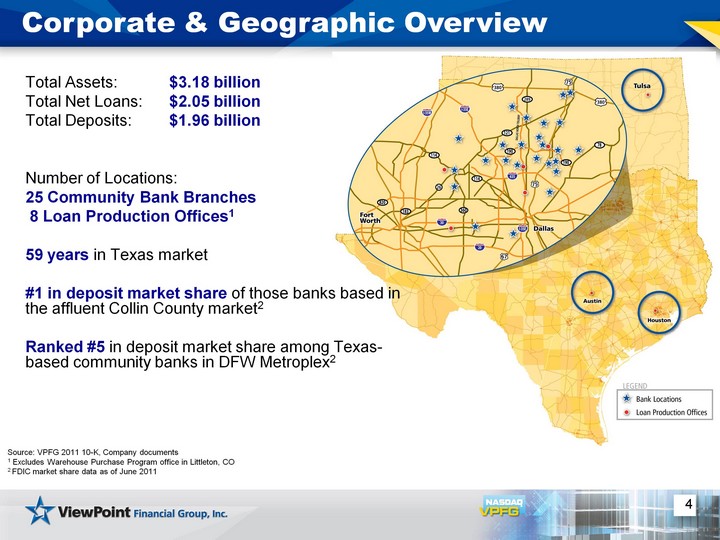
| 4 Corporate & Geographic Overview Total Assets: $3.18 billion Total Net Loans: $2.05 billion Total Deposits: $1.96 billion Number of Locations: 25 Community Bank Branches 8 Loan Production Offices1 59 years in Texas market #1 in deposit market share of those banks based in the affluent Collin County market2 Ranked #5 in deposit market share among Texas- based community banks in DFW Metroplex2 Source: VPFG 2011 10-K, Company documents 1 Excludes Warehouse Purchase Program office in Littleton, CO 2 FDIC market share data as of June 2011 |
| 5 Capitalize on a position of balance sheet strength Continue to grow organically in our economically stable and growing Texas market Grow existing lines of business, diversify our loan portfolio and develop and expand C&I lending Evaluate other opportunities to deploy capital New Locations Potential acquisitions Dividends Stock Repurchases Business Strategy |
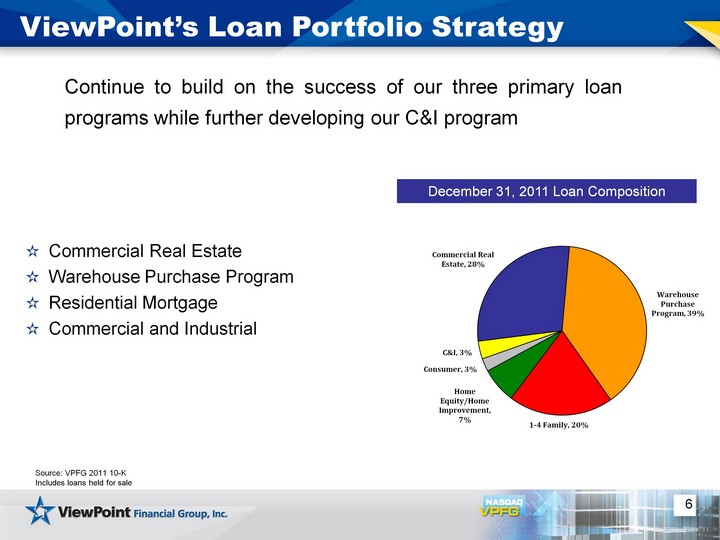
| 6 ViewPoint's Loan Portfolio Strategy Commercial Real Estate Warehouse Purchase Program Residential Mortgage Commercial and Industrial December 31, 2011 Loan Composition Source: VPFG 2011 10-K Includes loans held for sale (CHART) Continue to build on the success of our three primary loan programs while further developing our C&I program |
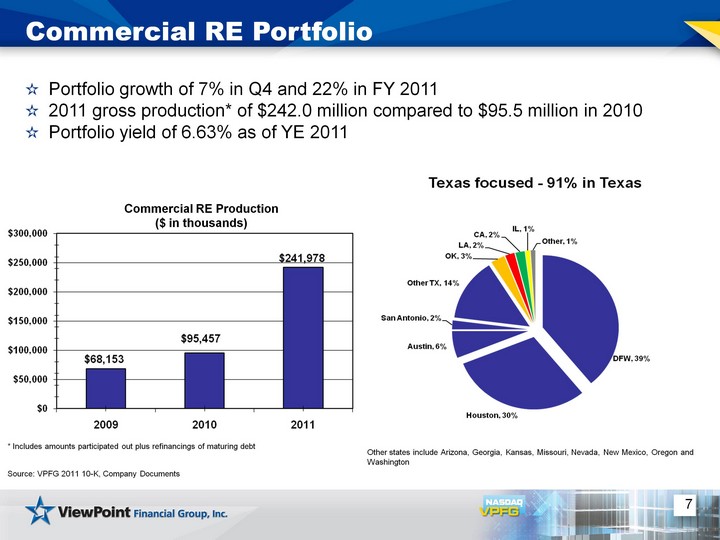
| 7 Commercial RE Portfolio Source: VPFG 2011 10-K, Company Documents Portfolio growth of 7% in Q4 and 22% in FY 2011 2011 gross production* of $242.0 million compared to $95.5 million in 2010 Portfolio yield of 6.63% as of YE 2011 Commercial RE Production ($ in thousands) Other states include Arizona, Georgia, Kansas, Missouri, Nevada, New Mexico, Oregon and Washington * Includes amounts participated out plus refinancings of maturing debt |
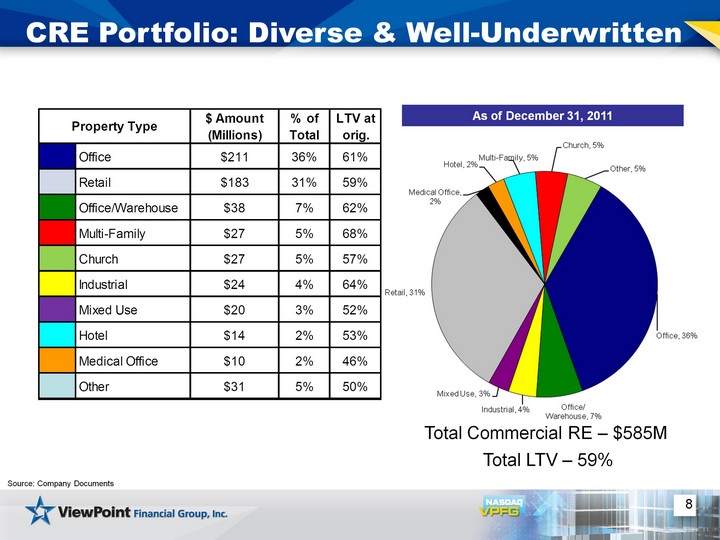
| 8 CRE Portfolio: Diverse & Well-Underwritten Total Commercial RE - $585M Total LTV - 59% Source: Company Documents As of December 31, 2011 |
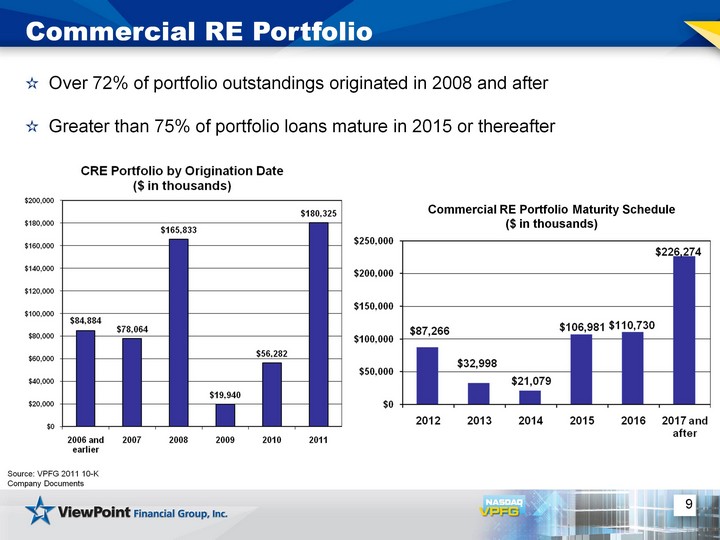
| 9 Commercial RE Portfolio Source: VPFG 2011 10-K Company Documents Commercial RE Portfolio Maturity Schedule ($ in thousands) Over 72% of portfolio outstandings originated in 2008 and after Greater than 75% of portfolio loans mature in 2015 or thereafter |
| 10 Warehouse Purchase Program Q4 2011 balance of $800.9 million, an increase of $137.1 million over Q3 Average portfolio balance increased $309.6 million for the same period Very low mortgage interest rates, refinance activity and correspondent market disruptions generated high WPP balances Facility utilization averaged 70% for Q4 compared to 47% for Q3 Average turn time of 26 days for Dec. compared to 17 days for Sept. Gross Average Yield of 4.22% for Q4 2011 vs. 4.87% for Q4 2010 Traditional seasonal fluctuations may return in 2012 Source: Company Documents at December 31, 2011 |
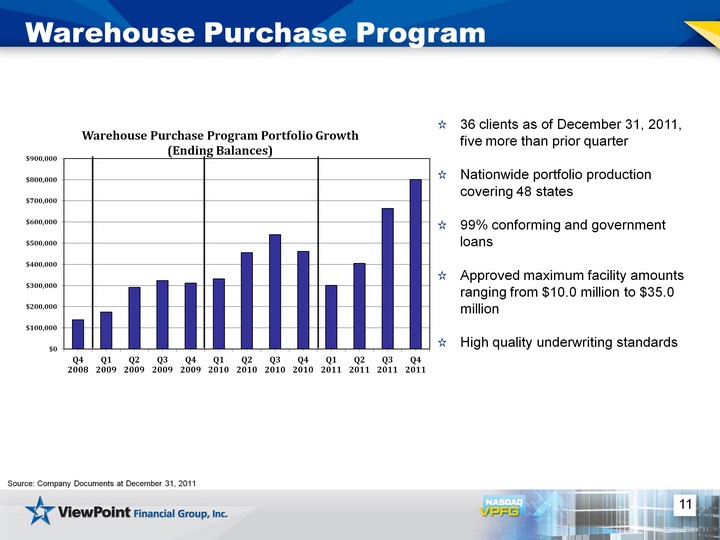
| 11 Warehouse Purchase Program Source: Company Documents at December 31, 2011 36 clients as of December 31, 2011, five more than prior quarter Nationwide portfolio production covering 48 states 99% conforming and government loans Approved maximum facility amounts ranging from $10.0 million to $35.0 million High quality underwriting standards (CHART) |
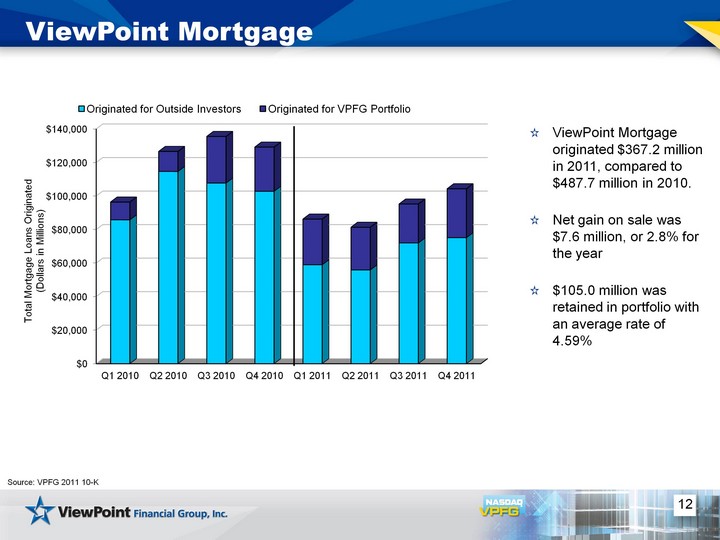
| 12 ViewPoint Mortgage ViewPoint Mortgage originated $367.2 million in 2011, compared to $487.7 million in 2010. Net gain on sale was $7.6 million, or 2.8% for the year $105.0 million was retained in portfolio with an average rate of 4.59% (CHART) Total Mortgage Loans Originated (Dollars in Millions) Source: VPFG 2011 10-K |
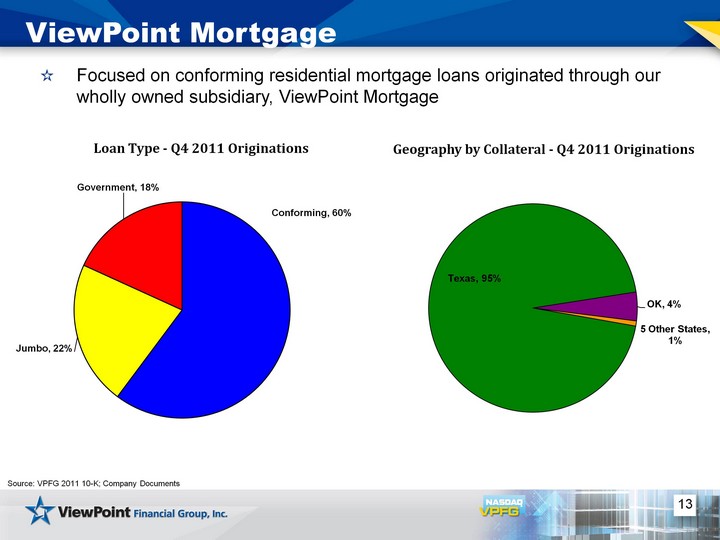
| 13 ViewPoint Mortgage Source: VPFG 2011 10-K; Company Documents Focused on conforming residential mortgage loans originated through our wholly owned subsidiary, ViewPoint Mortgage (CHART) (CHART) |
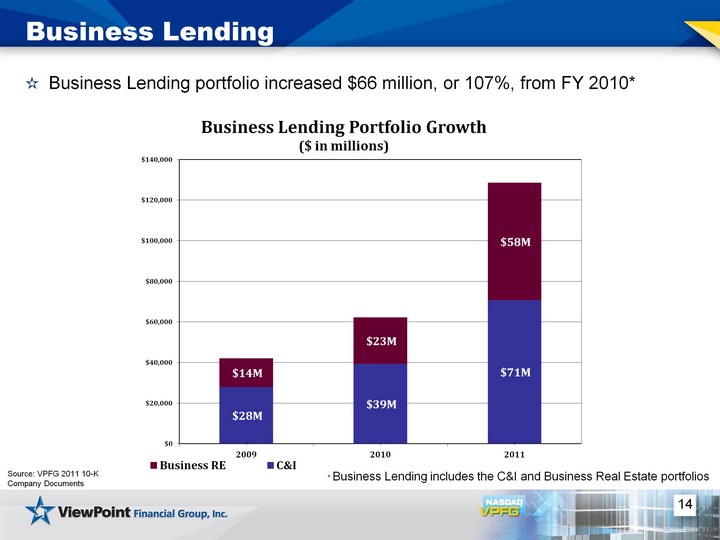
| (CHART) 14 Business Lending Source: VPFG 2011 10-K Company Documents Business Lending portfolio increased $66 million, or 107%, from FY 2010* * Business Lending includes the C&I and Business Real Estate portfolios |
| 15 Financial Summary - 2011 Record Earnings Annual earnings increased $8.5 million, or 47.9%; core earnings up $4.6 million, or 26.0% Q4 earnings increased by $4.6 million, or 90.0%, linked quarter, core earnings up $2.8 million, or 54.0%; driven by higher net interest income Net Interest Margin NIM increased 11 bps YOY, from 2.80% to 2.91% Q4 NIM increased 26 bps to 3.13% compared to Q3 2011 due to increased WPP volume and lower deposit costs Strong Loan Production Solid Credit Metrics Net charge-offs declined by $1.3 million YOY, to 0.09% NCO/Loans NPA/Assets Ratio is 0.80%, outperforming Industry and Texas Peers Source: VPFG 2011 10-K, Company Documents |
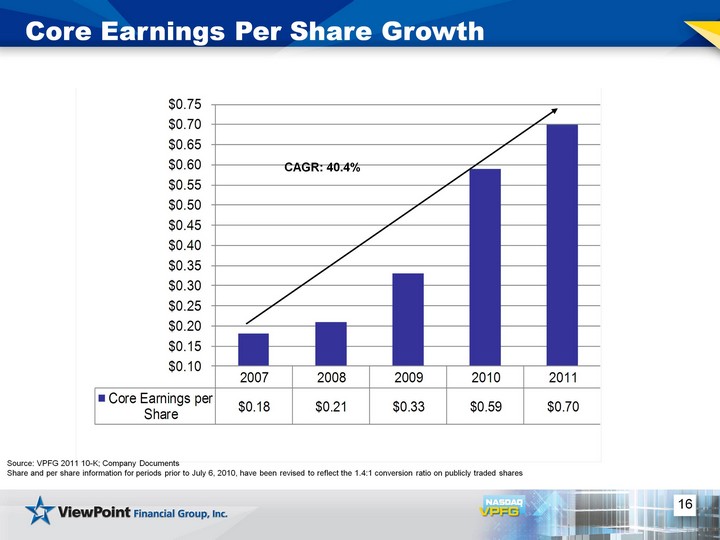
| 16 Core Earnings Per Share Growth CAGR: 40.4% Source: VPFG 2011 10-K; Company Documents Share and per share information for periods prior to July 6, 2010, have been revised to reflect the 1.4:1 conversion ratio on publicly traded shares |
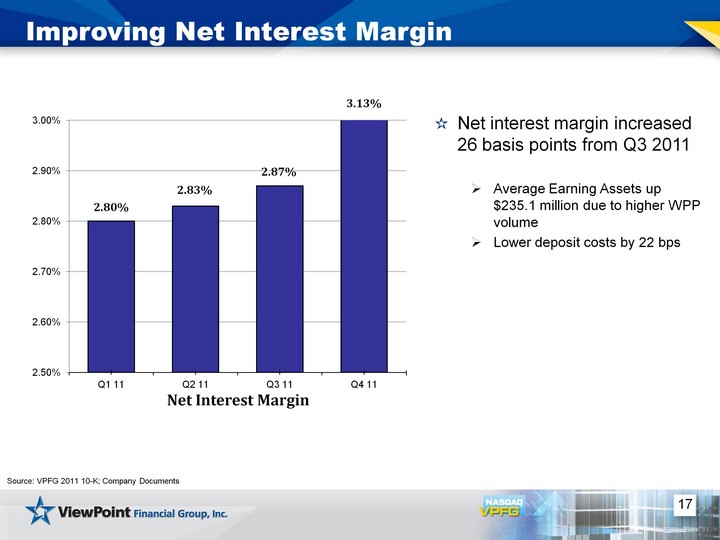
| 17 Improving Net Interest Margin Net interest margin increased 26 basis points from Q3 2011 Average Earning Assets up $235.1 million due to higher WPP volume Lower deposit costs by 22 bps (CHART) Source: VPFG 2011 10-K; Company Documents |
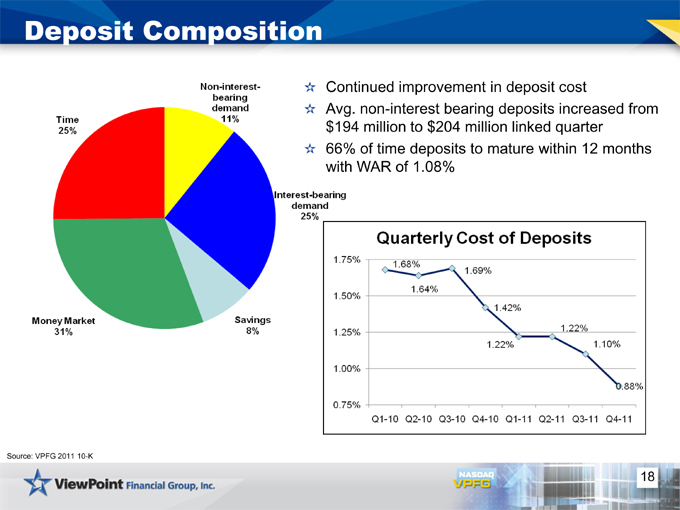
| 18 Deposit Composition Source: VPFG 2011 10-K Continued improvement in deposit cost Avg. non-interest bearing deposits increased from $194 million to $204 million linked quarter 66% of time deposits to mature within 12 months with WAR of 1.08% |
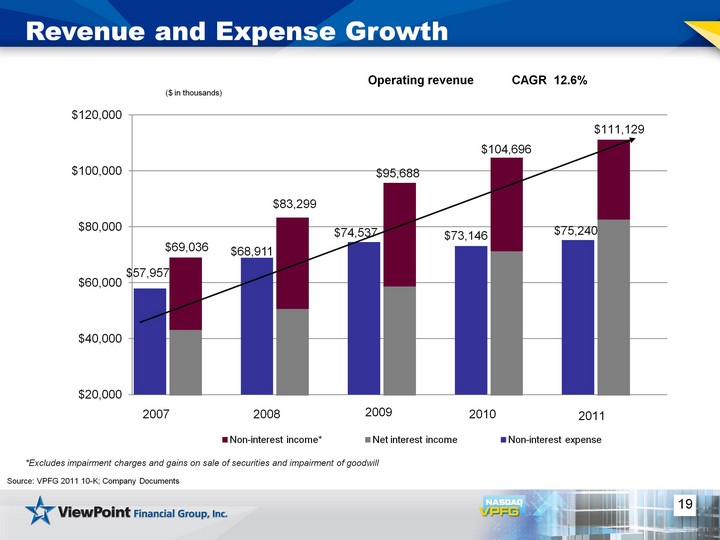
| Operating revenue CAGR 12.6% (CHART) 19 Revenue and Expense Growth ($ in thousands) *Excludes impairment charges and gains on sale of securities and impairment of goodwill 2007 Source: VPFG 2011 10-K; Company Documents |
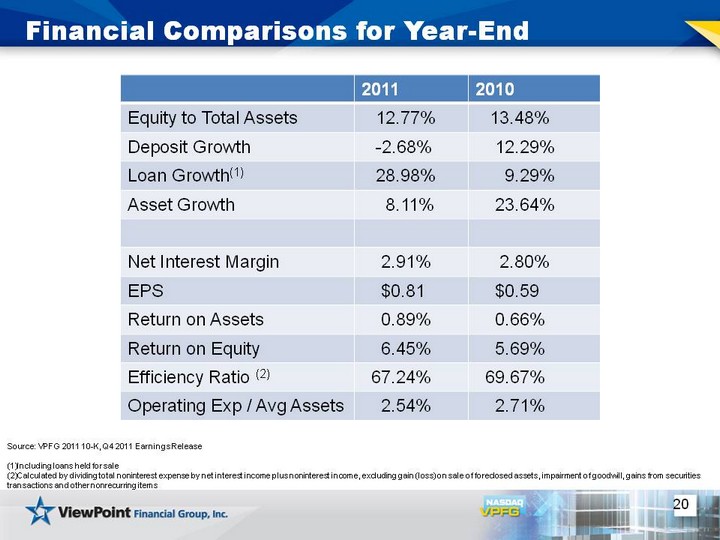
| 20 Financial Comparisons for Year-End Source: VPFG 2011 10-K, Q4 2011 Earnings Release Including loans held for sale Calculated by dividing total noninterest expense by net interest income plus noninterest income, excluding gain (loss) on sale of foreclosed assets, impairment of goodwill, gains from securities transactions and other nonrecurring items 2011 2010 Equity to Total Assets 12.77% 13.48% Deposit Growth -2.68% 12.29% Loan Growth(1) 28.98% 9.29% Asset Growth 8.11% 23.64% Net Interest Margin 2.91% 2.80% EPS $0.81 $0.59 Return on Assets 0.89% 0.66% Return on Equity 6.45% 5.69% Efficiency Ratio (2) 67.24% 69.67% Operating Exp / Avg Assets 2.54% 2.71% |
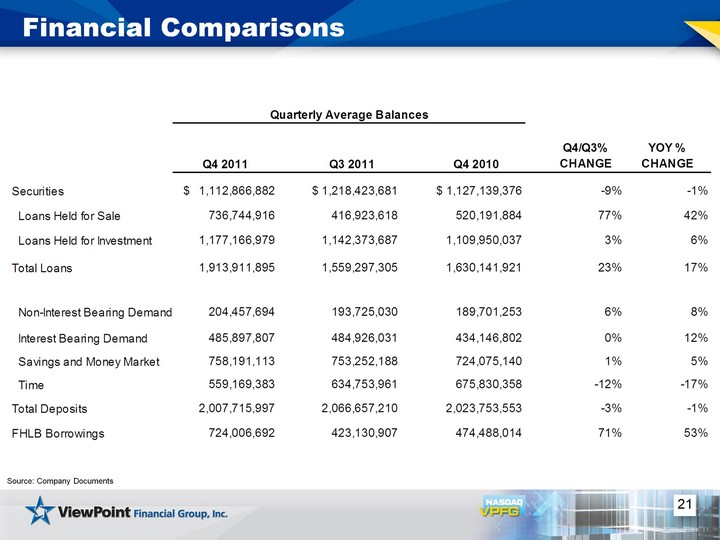
| 21 Financial Comparisons Source: Company Documents |
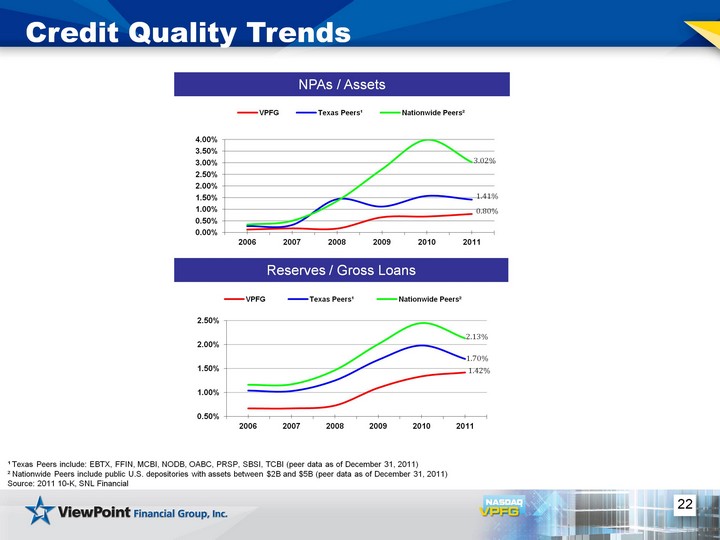
| 22 Credit Quality Trends (CHART) (CHART) NPAs / Assets 1 Texas Peers include: EBTX, FFIN, MCBI, NODB, OABC, PRSP, SBSI, TCBI (peer data as of December 31, 2011) 2 Nationwide Peers include public U.S. depositories with assets between $2B and $5B (peer data as of December 31, 2011) Source: 2011 10-K, SNL Financial Reserves / Gross Loans |
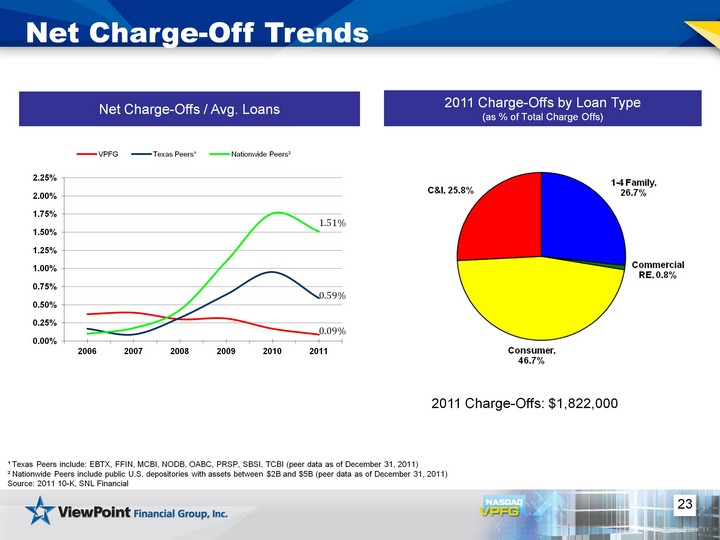
| 23 Net Charge-Off Trends 2011 Charge-Offs by Loan Type (as % of Total Charge Offs) (as % of Total Charge Offs) (as % of Total Charge Offs) Net Charge-Offs / Avg. Loans 2011 Charge-Offs: $1,822,000 1 Texas Peers include: EBTX, FFIN, MCBI, NODB, OABC, PRSP, SBSI, TCBI (peer data as of December 31, 2011) 2 Nationwide Peers include public U.S. depositories with assets between $2B and $5B (peer data as of December 31, 2011) Source: 2011 10-K, SNL Financial |
| 24 Closing Remarks Record earnings with positive growth trends One of the largest independent community banking franchises in the highly attractive Texas market Strong credit metrics reflecting disciplined underwriting standards and positive asset quality compared to Texas peers Well-capitalized and able to deploy capital |

| 25 Questions? |
| 26 Appendix The subsequent tables present non-GAAP reconciliations of the following calculations: TCE (Tangible Common Equity) to TCA (Tangible Common Assets) ratio TCE per share Price to TBV Core (non-GAAP) net income and earnings per share |
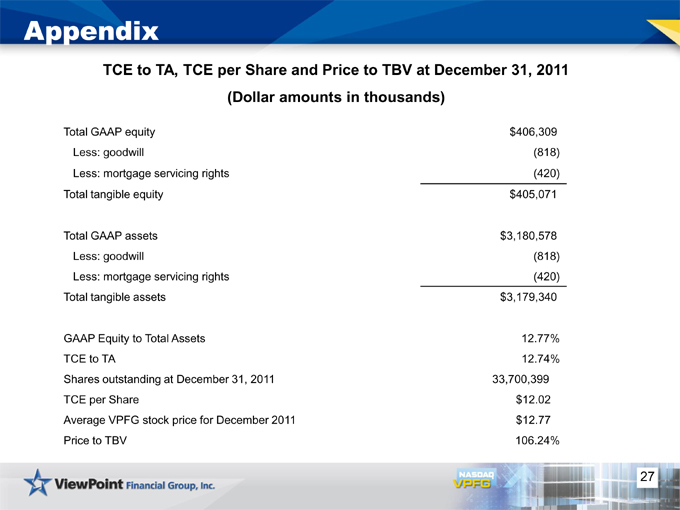
| 27 Appendix TCE to TA, TCE per Share and Price to TBV at December 31, 2011 (Dollar amounts in thousands) Total GAAP equity $406,309 Less: goodwill (818) Less: mortgage servicing rights (420) Total tangible equity $405,071 Total GAAP assets $3,180,578 Less: goodwill (818) Less: mortgage servicing rights (420) Total tangible assets $3,179,340 GAAP Equity to Total Assets 12.77% TCE to TA 12.74% Shares outstanding at December 31, 2011 33,700,399 TCE per Share $12.02 Average VPFG stock price for December 2011 $12.77 Price to TBV 106.24% |
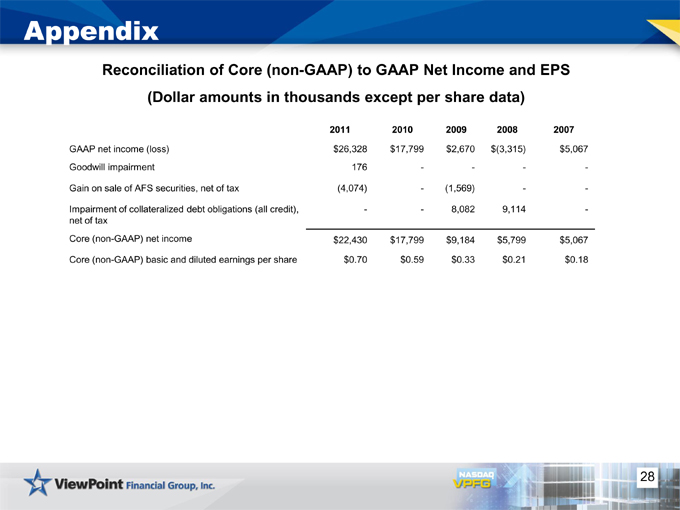
| 28 Appendix Reconciliation of Core (non-GAAP) to GAAP Net Income and EPS (Dollar amounts in thousands except per share data) 2011 2010 2009 2008 2007 GAAP net income (loss) $26,328 $17,799 $2,670 $(3,315) $5,067 Goodwill impairment 176 - - - - Gain on sale of AFS securities, net of tax (4,074) - (1,569) - - Impairment of collateralized debt obligations (all credit), net of tax - - 8,082 9,114 - Core (non-GAAP) net income $22,430 $17,799 $9,184 $5,799 $5,067 Core (non-GAAP) basic and diluted earnings per share $0.70 $0.59 $0.33 $0.21 $0.18 |