Attached files
| file | filename |
|---|---|
| EX-99.1 - PRESS RELEASE ISSUED JANUARY 9, 2010 - BLUCORA, INC. | d278620dex991.htm |
| EX-2.1 - AGREEMENT AND PLAN OF MERGER - BLUCORA, INC. | d278620dex21.htm |
| 8-K - CURRRENT REPORT ON FORM 8-K - BLUCORA, INC. | d278620d8k.htm |
 Acquisition
Overview January 9, 2011
1
Exhibit 99.2 |
 Safe Harbor
During the course
of this presentation, we may provide projections or
other forward-looking statements regarding future events and/or
future financial performance.
We wish to caution you that you should
not place undue reliance on such forward-looking statements because
they are just projections. Actual events or results may differ
materially due to risks, uncertainties, and other factors, including, but
not limited to: the successful execution of the Company’s strategic
initiatives, business integration and operating plans, and marketing
strategies; the timing and extent of market acceptance of products
and services; and general economic, industry, and market sector
conditions.
We refer you to the documents
InfoSpace files from time
to time with the Securities and Exchange Commission, and in
particular
the
risk
factors
identified
in
InfoSpace's most recent
Quarterly Report on Form 10-Q.
2 |
 Introducing…
3 |
 Transaction
Overview •
InfoSpace has agreed to acquire TaxACT for $287.5M in cash
•
Transaction represents an attractive return on shareholder capital
•
Anticipating debt financing of roughly $95M at the TaxACT subsidiary level,
leaving InfoSpace with an estimated excess of $90M of cash at closing
•
Expected to close in the first quarter of 2012
TaxACT
(millions)
Implied
Multiple
Enterprise Value /
Revenues
$78.1
3.7x
Enterprise Value /
Adjusted EBITDA
$37.8
7.6x
Enterprise Value /
Unlevered Free Cash
Flow
$37.3
7.7x
Deal Summary
(Twelve months ending Sept. 30, 2011)
Sources
Cash from Parent
$200.0
Senior Secured Subsidiary Debt
90.0
Revolver (drawn at close)
3.0
$293.0
Uses
Cash Consideration
$287.5
Transaction Expenses
5.5
$ 293.0
Sources and Uses
($ in millions)
4 |
 Investment
Highlights 5
Significant, Positive Step Forward for InfoSpace Shareholders
Large,
Growing
Market
TaxACT Well
Positioned
Track Record
of Execution
Financial
Return |
 Investment
Highlights •
Enduring category
•
Digital shift in its early stages
•
Evolving consumer needs and preferences
•
Shifting provider landscape
•
Enduring category
•
Digital shift in its early stages
•
Evolving consumer needs and preferences
•
Shifting provider landscape
6
Large,
Growing
Market
TaxACT Well
Positioned
Track Record of
Execution
Financial Return |
 •
Total
tax
year
2010
U.S.
individual
federal
tax
returns
of
~
140
million;
expected to grow at roughly 1%-2% per year
•
Digital do-it-yourself (‘DDIY’) tax preparation supplementing ‘paper
& pencil’ and professional preparation
•
Internet has increasingly become the preferred DIY platform
•
Approximately 30 million filers prepared taxes using an online solution in
2010, up from 17 million in 2007
7
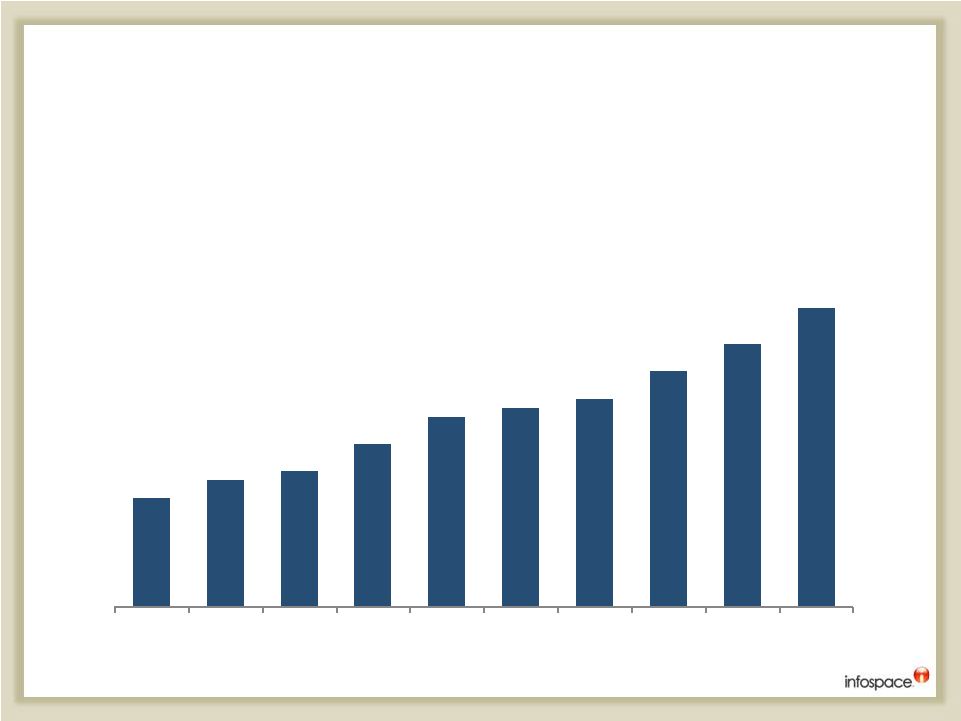
Digital Shift Underway in Tax Preparation
“DDIY”
Proportion of Total IRS Returns
(12% -
9 Year CAGR)
12%
14%
15%
18%
21%
22%
23%
26%
29%
33%
2002
2003
2004
2005
2006
2007
2008
2009
2010
2011 |
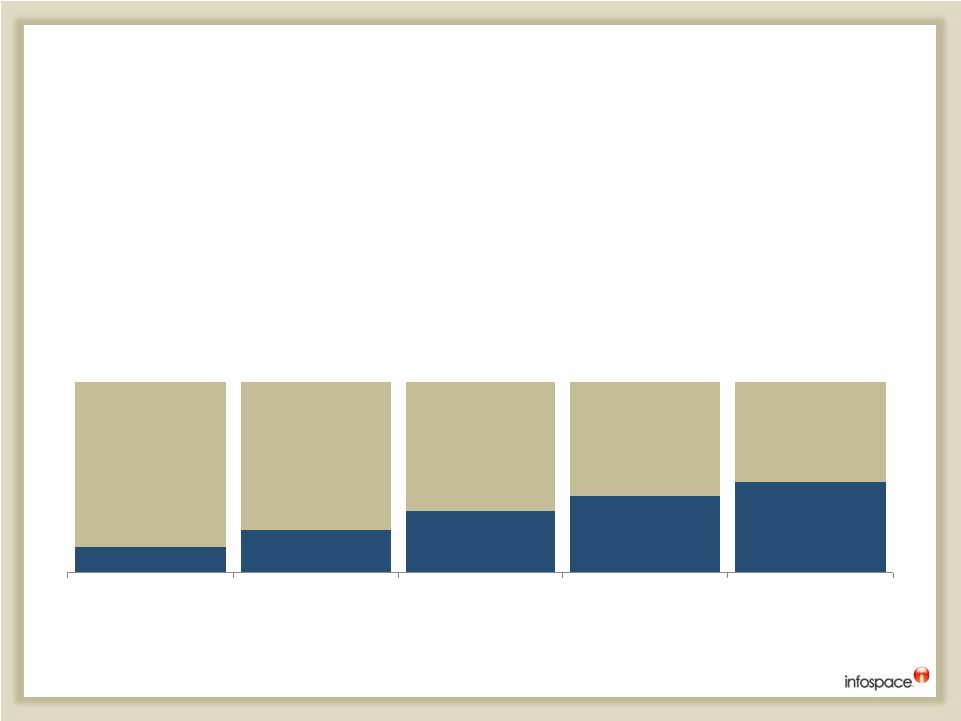 Market Supported
by Demographic Trends •
Online tax preparation market expected to grow at ~10% + annually over
the next few years, fueled by demographic shifts in the base of taxpayers
•
Online tax preparation providers are best positioned to meet evolving
consumer needs and preferences
8
*Data sourced from a proprietary survey conducted by a professional, third party market
research firm; Digital age defined by people born after 1971 Growth of “Digital
Age” as % of Filing Population* in US (1995-2015)
% of US “Filing Age”
Population (18+ Years)
= = Estimated = =
Digital Age 13%
Digital Age 22%
Digital Age 32%
Digital Age 40%
Digital Age 47%
Other Filing Age
87%
Other Filing Age
78%
Other Filing Age
68%
Other Filing Age
60%
Other Filing Age
53%
1995
2000
2005
2010
2015 |
 Investment
Highlights •
Competitive market position
•
Leading brand and value based-positioning
•
Loyal growing customer base
•
Competitive market position
•
Leading brand and value based-positioning
•
Loyal growing customer base
9
Large, Growing
Market
TaxACT Well
Positioned
Track Record of
Execution
Financial Return |
 Consumer Value
Proposition 10
•
Net promoter score that compares favorably with
leading global consumer brands
•
Recognized for ease of use, accessibility & reliability
•
Over 90% of taxpayers are paying more to file their
taxes than TaxAct charges
•
Compare TaxAct’s average $13/filing with:
o
H&R Block online: ~ $33
o
TurboTax: ~ $54
o
Tax Stores: ~ $180
o
Professional Accountant: ~ $225
•
TaxACT is solidly profitable
•
Advantageously positioned for future investment
(product enhancements, customer acquisition)
Well established brand, favorably positioned against
identified market trends.
Brand
Acceptance
Superior
Value
Financial
Strength |
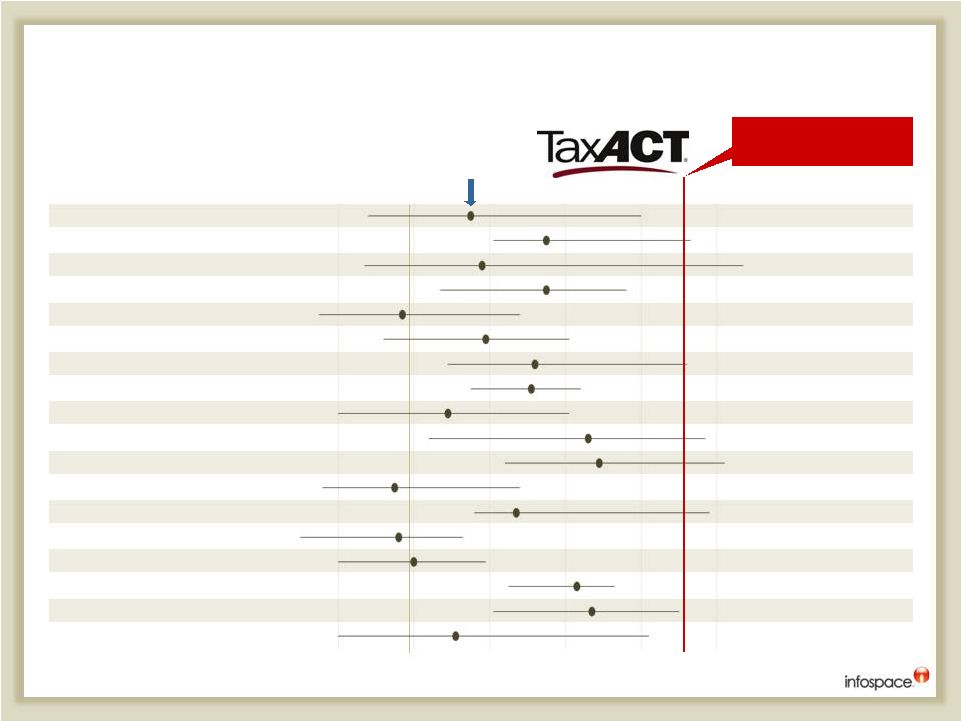 TaxACT NPS in
Context Net Promoter Score Ranges and Leaders by Industry (US)
Source: Satmetrix 2011 Net Promoter Benchmark Study of
U.S. Consumers; Bain analysis
11
-20%
0
20%
40%
60%
80%
Industry
Airlines
Auto Insurance
Banking
Brokerage and investments
Cable and satellite TV
Cellular phone service
Computer hardware
Consumer software
Credit cards
Dept., wholesale, specialty stores
Grocery and supermarkets
Health insurance
Homeowners insurance
Internet service
Life insurance
Online search and information
Online shopping
Quick-service restaurants
Leader
JetBlue/SWA
USAA
USAA
Vanguard
Verizon
MetroPCS
Apple
Symantec
AMEX
Costco
Trader Joe’s
Kaiser Permanente
USAA
Verizon
State Farm
Google/Facebook
Amazon.com
Chick-fil-A
TaxACT NPS
Among the Highest
Average
Score |
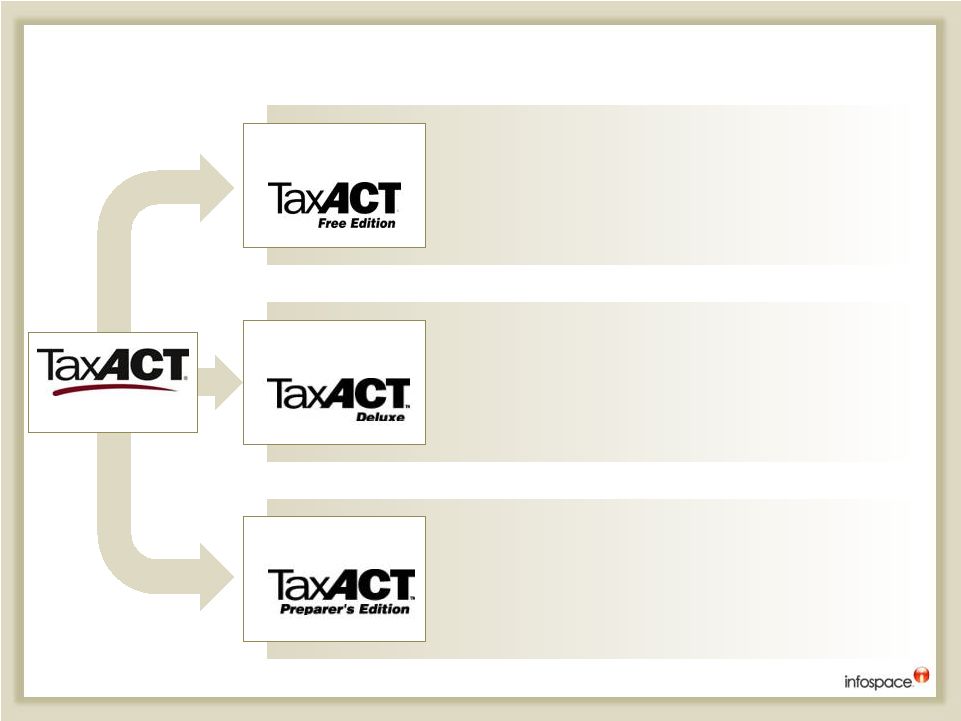 Product
Leadership “Deluxe”
-
$9.95; Enhanced feature set, including
additional reports, “life event”
interviews and in depth help
content
“State”
-
$14.95 for Free Federal customers; $8 for Deluxe
Consumer Paid
“Professional”
-
$119 to $619
•
•
Professional
“Free Federal for Everyone”
•
Full-featured, individual federal tax preparation
•
No-risk, no obligation solution
Consumer Free
Offerings
12
Toolkit for professional tax preparers includes client
organizers, invoicing, client letters, client manager, and
tax planning tools
Individual, partnership and corporate returns
“Other”
-
includes bundles , data archive services, refund
payment transfers, stored value card solutions, phone
support |
 Investment
Highlights •
In-market expertise & leadership in tax preparation
•
Dedicated, industry leading management team
•
Legacy of growth and profitability
•
In-market expertise & leadership in tax preparation
•
Dedicated, industry leading management team
•
Legacy of growth and profitability
13
Large, Growing
Market
TaxACT Well
Positioned
Track Record
of Execution
Financial Return |
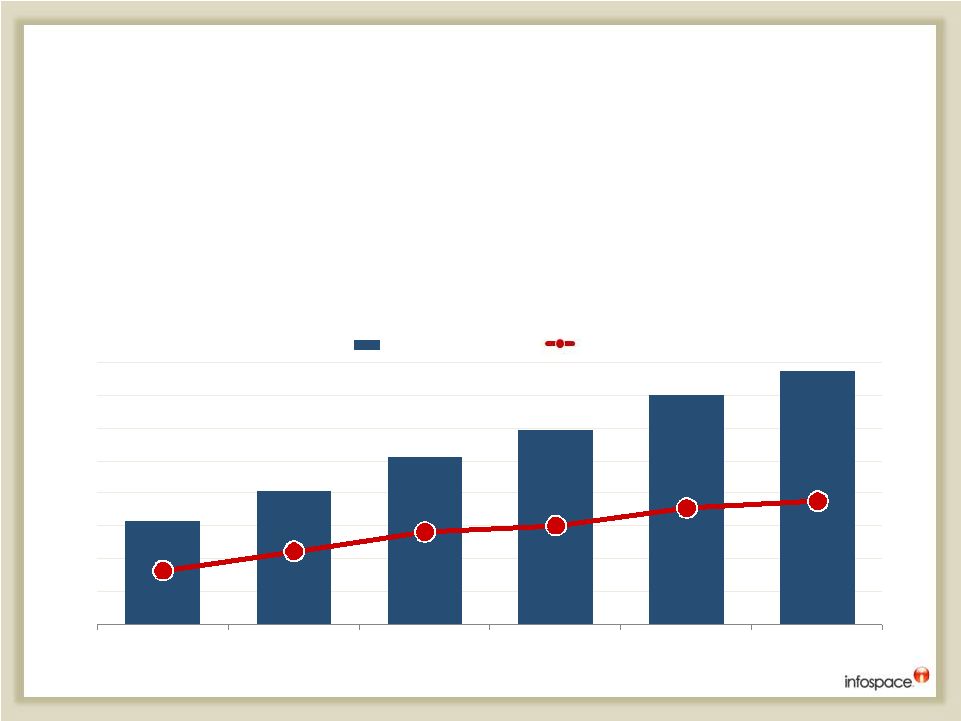 Sustained
Execution TaxACT Financial Performance
($ in millions)
14
•
Experienced management team lead by industry veterans
•
Proven online direct marketing capabilities
•
Consistent revenue growth and bottom line performance
$31.5
$40.6
$51.2
$59.6
$70.0
$77.6
$16.4
$22.3
$28.2
$30.1
$35.5
$37.6
FY2006
FY2007
FY2008
FY2009
FY2010
FY2011
Revenue
EBITDA |
 Investment
Highlights •
Strong, near-term return on shareholder capital
•
Pro-forma non-GAAP earnings per share of $1.21
•
Positioned for future growth and investment
•
Strong, near-term return on shareholder capital
•
Pro-forma non-GAAP earnings per share of $1.21
•
Positioned for future growth and investment
15
Large, Growing
Market
TaxACT Well
Positioned
Track Record of
Execution
Financial
Return |
 Superior Return
on Shareholder Capital 16
Adjusted EBITDA
$37,809
Less –
Cash Interest Expense
(4,500)
(a)
Less –
Cash Taxes
(650)
(b)
Less –
Capital Expenditures
(500)
Levered Free Cash Flow
$32,159
Cash from Parent
$200,000
ROE
16.1%
(a)
Interest expense estimated at $90.0 million of debt at a 5.0% interest rate
(b)
Cash taxes estimated at 2.0% of earnings before income taxes excluding non-recurring
income and expense ($ in thousands; financial figures represent twelve months ending
September 30, 2011) •
Transaction contemplates modest leverage (~ 2.5x LTM EBITDA); shareholders
realize superior return on capital
•
Infospace NOL meaningfully enhances ROE to shareholders (~ 50% on a pro
forma basis) |
 Pro
Forma Combined
Revenue
$211,882
$78,093
$289,975
Adj. EBITDA
$34,721
$37,809
$72,530
% Margin
16.4%
48.4%
25.0%
Non-GAAP Net Income
$13,796
$31,798
$45,594
Non-GAAP EPS -
Diluted
$0.36
$0.85
$1.21
Diluted Avg Shares
37,812
37,812
37,812
Compelling Pro Forma Financial Profile
17
Twelve months ending Sept. 30, 2011 ($ in Thousands)
|
 Future Growth
and Investment Potential Future Steps for Value Creation
18
Revenue $290M
Adjusted EBITDA $73M
Search
Revenue: $212M
EBITDA $35M
TaxACT
Revenue: $78M
EBITDA: $38M
Estimated Cash at Close in Excess of $90M
1
2
3
Optimize and grow existing businesses
Identify areas for future investment
Disciplined consideration of follow-on M&A opportunities
|
 Non-GAAP
Financial Measures Some
measures
presented
for
InfoSpace,
Inc.
("InfoSpace")
and
2
nd
Story Software, Inc. ("TaxACT") in this presentation are non-GAAP
financial measures within the meaning of the SEC's Regulation
G.
InfoSpace believes that presenting non-GAAP financial measures
is useful to financial statement users because it describes InfoSpace
and TaxAct operating performance, excluding some recurring and
non-recurring charges that are included in the most directly
comparable measures calculated and presented in accordance with
GAAP.
InfoSpace management uses these non-GAAP measures as
important indicators of the Company's historical performance and
in
planning and forecasting future performance.
The non-GAAP financial
measures that InfoSpace presents may not be comparable to
similarly-named financial measures used by other companies, and
financial statement users should not consider non-GAAP financial
measures in isolation from, or a substitute for, financial information
presented in compliance with GAAP.
You are encouraged to review
the reconciliation of non-GAAP financial measures to GAAP financial
measures included in the following pages of this presentation and in
InfoSpace's filings with the SEC.
19 |
 20
INSP
TaxACT
Pro Forma
Combined
GAAP pro forma net income, including pro forma interest on debt and pro forma income taxes
13,798
$
16,487
$
30,285
$
Discontinued operations
11,579
-
11,579
Depreciation and amortization of intangible assets
9,480
752
10,232
Stock-based compensation
11,560
35
11,595
Other loss (income), net, includes INSP's $19.0 million litigation settlement and TaxACT's $7.1
million in expenses related to the H&R Block failed transaction process
(19,125)
7,158
(11,967)
Pro forma adjustment for interest on debt
-
4,500
4,500
Pro forma income tax expense, calculated at 35% of pre-tax pro forma income
7,429
8,877
16,306
Adjusted pro forma EBITDA
34,721
$
37,809
$
72,530
$
InfoSpace, Inc.
Reconciliations of Non-GAAP Financial Measures to the Nearest Comparable GAAP Measure
Adjusted Pro Forma EBITDA Reconciliation
(Unaudited)
(Amounts in thousands)
12 Months Ended September 30, 2011 |
 21
INSP
TaxACT
Pro Forma
Combined
GAAP pro forma net income, including pro forma interest on debt and pro forma income taxes
13,798
$
16,487
$
30,285
$
Discontinued operations
11,579
-
11,579
Pro forma adjustment for legal settlement
(18,965)
-
(18,965)
Pro forma adjustment for expenses incurred related to the H&R Block failed transaction
process -
7,083
7,083
Pro forma income from continuing operations net of non-recurring items
6,412
23,570
29,982
Pro forma non-cash income tax expense from pro forma income from continuing operations net of
non- recurring items, calculated at 35% of pre-tax pro forma income from continuing
operations less 2% alternative minimum tax
7,384
8,228
15,612
Pro forma non-GAAP net income
13,796
$
31,798
$
45,594
$
Income from continuing operations net of non-recurring items - diluted
0.17
$
0.62
$
0.79
$
Non-cash income tax expense from continuing operations net of non-recurring items -
diluted 0.19
$
0.23
$
0.42
$
Pro forma non-GAAP net income per share - diluted
0.36
$
0.85
$
1.21
$
37,812
37,812
37,812
12 Months Ended September 30, 2011
InfoSpace, Inc.
Reconciliations of Non-GAAP Financial Measures to the Nearest Comparable GAAP Measure
Pro Forma Non-GAAP Net Income Reconciliation
(Unaudited)
(Amounts in thousands, except per share amounts) |