Attached files
| file | filename |
|---|---|
| 8-K - 8-K - SCHULMAN A INC | d267342d8k.htm |
 Fiscal 2011 Annual Meeting
December 8, 2011
Exhibit 99.1 |
 2
Safe Harbor
Cautionary Note on Forward-Looking Statements A number of the matters
discussed in this document that are not historical or current facts deal with potential future circumstances and
developments and may constitute “forward-looking statements” within the meaning of the
Private Securities Litigation Reform Act of 1995. Forward-looking statements can be
identified by the fact that they do not relate strictly to historic or current facts and relate to future events and
expectations. Forward-looking statements contain such words as “anticipate,”
“estimate,” “expect,” “project,” “intend,” “plan,” “believe,” and other
words and terms of similar meaning in connection with any discussion of future operating or financial
performance. Forward-looking statements are based on management’s current expectations
and include known and unknown risks, uncertainties and other factors, many of which management
is unable to predict or control, that may cause actual results, performance or achievements to differ materially from those expressed
or implied in the forward-looking statements. Important factors that could cause actual results to
differ materially from those suggested by these forward-looking statements, and that could
adversely affect the Company’s future financial performance, include, but are not limited to, the
following:
–
worldwide and regional economic, business and political conditions, including
continuing economic uncertainties in some or all of the Company’s major product markets;
–
the effectiveness of the Company’s efforts to improve operating margins through
sales growth, price increases, productivity gains, and improved purchasing techniques;
–
competitive factors, including intense price competition;
–
fluctuations in the value of currencies in major areas where the Company operates;
–
volatility of prices and availability of the supply of energy and raw materials that
are critical to the manufacture of the Company’s products, particularly plastic resins
derived from oil and natural gas;
–
changes in customer demand and requirements;
–
effectiveness of the Company to achieve the level of cost savings, productivity
improvements, growth and other benefits anticipated from acquisitions and restructuring
initiatives;
–
escalation in the cost of providing employee health care;
–
uncertainties regarding the resolution of pending and future litigation and other
claims;
–
the performance of the North American auto market; and
–
further adverse changes in economic or industry conditions, including global supply and
demand conditions and prices for products.
The risks and uncertainties identified above are not the only risks the Company faces. Additional risk
factors that could affect the Company’s performance are set forth in the Company’s
Annual Report on Form 10-K. In addition, risks and uncertainties not presently known to the Company
or that it believes to be immaterial also may adversely affect the Company. Should any known or
unknown risks or uncertainties develop into actual events, or underlying assumptions prove
inaccurate, these developments could have material adverse effects on the Company’s business,
financial condition and results of operations. This document contains time-sensitive information
that reflects management’s best analysis only as of the date of this document. The Company
does not undertake an obligation to publicly update or revise any forward-looking statements to reflect
new events, information or circumstances, or otherwise. Further information concerning issues that
could materially affect financial performance related to forward-looking statements can be
found in the Company’s periodic filings with the Securities and Exchange Commission. |
 3
Use of Non-GAAP Financial Measures
•
This presentation includes certain financial information determined by methods
other than in accordance with accounting principles
generally
accepted
in
the
United
States
(“GAAP”).
These
non-GAAP
financial
measures
include:
net
income
excluding certain items, net income per diluted share excluding certain items and
EBITDA excluding certain items, as well as certain non-GAAP supplemental
segment comparison financial information reflecting the operations of A. Schulman, Inc. (the
“Company”) as if it owned ICO, Inc. (“ICO”) at the beginning
first quarter of 2010. However, non-GAAP measures are not in accordance
with, nor are they a substitute for, GAAP measures, and tables included in this release reconcile each non-GAAP
financial measure with the most directly comparable GAAP financial measure. The
most directly comparable GAAP financial measures
for
these
purposes
are
income
from
continuing
operation
before
taxes,
net
income
and
net
income
per
diluted
share.
The Company's non-GAAP financial measures are not meant to be considered in
isolation or as a substitute for comparable GAAP financial measures, and
should be read only in conjunction with the Company's consolidated financial statements
prepared in accordance with GAAP.
•
The Company uses these non-GAAP financial measures to monitor and evaluate
Company performance and believes that they are useful to investors for
financial analysis, particularly with respect to understanding the significance of the ICO acquisition in
the third quarter of fiscal 2010. However, the non-GAAP supplemental financial
information is not necessarily indicative of what the combined financial
results would have actually been had the ICO acquisition taken place as of September 1, 2009, since
such financial information does not reflect any cost savings, operating synergies,
tax synergies or revenue enhancements, and includes certain estimated
additional depreciation amounts and estimates for amortization of the intangibles recorded as part of
the purchase price allocation.
•
While the Company believes that these non-GAAP financial measures provide
useful supplemental information to investors, there
are
very
significant
limitations
associated
with
their
use.
These
non-GAAP
financial
measures
are
not
prepared
in
accordance with GAAP, may not be reported by all of the Company's competitors and
may not be directly comparable to similarly
titled
measures
of
the
Company's
competitors
due
to
potential
differences
in
the
exact
method
of
calculation.
The
Company compensates for these limitations by using these non-GAAP financial
measures as supplements to GAAP financial measures and by reviewing the
reconciliations of the non-GAAP financial measures to their most comparable GAAP financial
measures. |
 A.
Schulman Milestones – FY 2011
•
Successfully completed Mash acquisition
•
Completed integration of ICO & McCann acquisitions
•
Further
strengthened
management
team
-
Joe
Levanduski
named
CFO
•
Continued realignment of assets to better meet market needs:
restructuring in the U.K
consolidation in Italy, Australia, U.S.
•
Board approved a share repurchase program for $100 million of common
stock and we committed to, and completed, the purchase of $30 million
over the past 6 month
•
Board
approved
an
increase
of
10%
in
quarterly
dividend
to
$0.17
per
common share, representing an annual yield of approximately 3.5%
•
Entered
into
a
joint
venture
with
Argentina-based
Surplast
S.A.
which
expanded our presence in rotomolding in S. America
4 |
 A.
Schulman Milestones – FY 2012
•
Continued restructuring in EMEA’s back office operations to better
leverage savings from Shared Service Center
•
Investment of approximately $7 million in Akron plant to add technical
compounding capabilities to facility
•
Final approval obtained to finish building plant in India
•
New lines to be added to address demand
Engineered Plastics lines in China and Mexico
Masterbatch line in Brazil
Specialty Powders line in Mexico
5 |
 6
ASI’s Strategy
Effectively Leverage A Core Competence
Effectively Leverage A Core Competence
Distribution
Distribution
–
Use synergies with other business units to achieve widest and most effective
market coverage while providing added value services
–
Leverage procurement of resins at best possible price
–
Capture new sources of polymers from specialty and strong producers
Be the #1 Niche Player Globally
Be the #1 Niche Player Globally
Engineered
Engineered
Plastics
Plastics
–
Lever our successful European model globally
–
Participate in the high value-added niche portion of the EP market and reduce
exposure to commodity market
–
Continue
development
of
sustainable
“Green”
products
Be the #1 Global Manufacturer
Be the #1 Global Manufacturer
Masterbatch
Masterbatch
–
Favored consolidator in highly fragmented market
–
Judicious acquisitions to speed entry into underserved markets and geographic
extension
–
Focus on new, higher margin products/applications
Be the #1 Global Manufacturer
Be the #1 Global Manufacturer
Specialty
Specialty
Powders
Powders
–
In North America, maintain a balanced position between low-cost and technology
leadership with focused R&D
–
In Europe and Asia, further our technology leadership in high-value
compounds –
Judicious acquisitions to speed entry into underserved markets and geographic
extension |
 7
Four Key Profit Drivers
»
Gradual market recoveries over time
»
Organic growth
»
Geographic growth
»
Continued leverage of global volume base
»
Seek opportunities for alternate sourcing from
Middle East and Asia
»
Align pricing strategies with purchasing strategies
»
Optimize footprint
»
SG&A leverage
»
Create higher-margin product portfolio
»
Support volume but primary focus on
increased profitability
ACQUISITIONS WILL ALSO PLAY KEY ROLE IN FUTURE GROWTH!
New Products
Continuous
Improvements
Purchasing
Savings/Smart Pricing
Slow and Steady
Volume Improvement
–
Realize
synergies
from
ICO,
McCann
and
Mash
acquisitions
–
Limit growth of SG&A, especially in developed markets
–
Admin optimization |
 8
FY11 Financial Highlights
•
Reported net income for FY 2011 was:
–
$41.0
million
or
$1.32
per
diluted
share
vs.
net
income
of
$43.9
million
or
$1.57 per diluted share in FY 2010
•
Excluding restructuring and acquisition-related items*, net income for FY
2011 was:
–
$58 million or $1.86 per diluted share vs. $48.2 million or $1.72 per diluted
share in FY 2010
•
Overall gross profit per pound for FY 2011 was:
•
Cash was $155.8 million at 8/31/11; net debt position of $40.4 million;
approximately $271.6 million of untapped credit lines
•
Days
of
working
capital
were
60
as
of
8/31/11
vs.
61
days
at
the
at
the
end
of last year.
* Please see the end of this presentation for the reconciliations of GAAP versus
non-GAAP financial measures. 13.9 cents vs. 14.7 cents last year. Had the Company owned ICO
at the beginning of fiscal 2010, would have improved by approximately 4% from FY 2010 –
|
 9
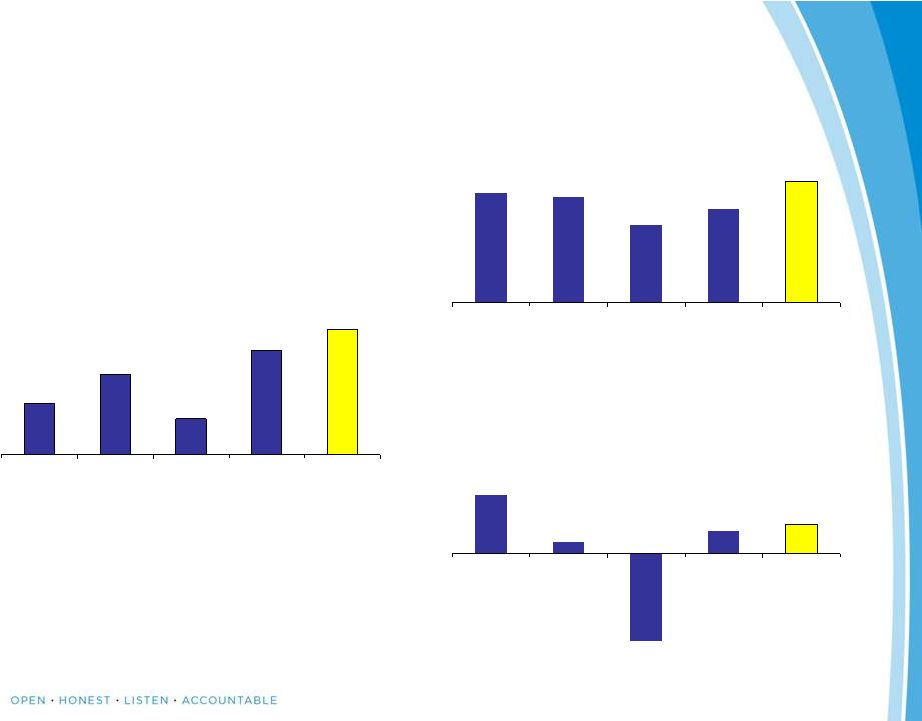
Actions taken before & during recession have improved net
income while protecting liquidity
Net Income from Operating Activity
$23.8
$37.2
$16.5
$48.2
$58.0
FY2007
FY2008
FY2009
FY2010
FY2011
Net Debt / (Net Cash)
$82.8
$16.1
($123.6)
$31.9
$40.4
FY2007
FY2008
FY2009
FY2010
FY2011
Pounds Sold
1,856.2
1,784.1
1,309.8
1,587.7
2,048.4
FY2007
FY2008
FY2009
FY2010
FY2011
20
Dollars in millions & excluding unusual items |
 10
Non-GAAP to GAAP Reconciliation
FY2011
A. SCHULMAN, INC.
Reconciliation of GAAP and Non-GAAP Financial Measures
Unaudited
(In thousands, except per share data)
Year Ended August 31, 2011
As Reported
Asset Write-downs
Costs Related to
Acquisitions
Restructuring
Related
Inventory Step-up
Tax Benefits
(Charges)
Before Certain
Items
Net sales
2,192,955
$
-
$
-
$
-
$
-
$
-
$
2,192,955
$
Cost of sales
1,907,409
-
-
-
(607)
-
1,906,802
Selling, general and administrative expenses
206,406
-
(1,429)
-
-
-
204,977
Interest expense, net
5,531
-
-
-
-
-
5,531
Foreign currency transaction (gains) losses
1,595
-
-
-
-
-
1,595
Other (income) expense
(1,720)
-
-
-
-
-
(1,720)
Asset impairment
8,150
(8,150)
-
-
-
-
-
Restructuring expense
8,117
-
-
(8,117)
-
-
-
Curtailment (gains) losses
-
-
-
-
-
-
-
Total costs and expenses, net
2,135,488
(8,150)
(1,429)
(8,117)
(607)
-
2,117,185
Income from continuing operations before taxes
57,467
8,150
1,429
8,117
607
-
75,770
Provision for U.S. and foreign income taxes
15,782
-
38
874
209
65
16,968
Income from continuing operations
41,685
8,150
1,391
7,243
398
(65)
58,802
Income (loss) from discontinued operations, net of tax of $0
-
-
-
-
-
-
-
Net income (loss)
41,685
8,150
1,391
7,243
398
(65)
58,802
Noncontrolling interests
(689)
-
-
-
(102)
-
(791)
Net income (loss) attributable to A. Schulman, Inc.
40,996
$
8,150
$
1,391
$
7,243
$
296
$
(65)
$
58,011
$
Diluted EPS
1.32
$
1.86
$
31,141
31,141
Weighted-average number of shares outstanding - diluted |
 11
Non-GAAP to GAAP Reconciliation
FY2010
A. SCHULMAN, INC.
Reconciliation of GAAP and Non-GAAP Financial Measures
Unaudited
(In thousands, except per share data)
Year ended August 31, 2010
As Reported
Asset Write-downs
Costs related to
Acquisitions
Restructuring
Related
Inventory Step-up
Tax Benefits
(Charges)
Before Certain
Items
Net sales
1,590,443
$
-
$
-
$
-
$
-
$
-
$
1,590,443
$
Cost of sales
1,357,575
(69)
-
-
(3,942)
-
1,353,564
Selling, general and administrative
expenses 179,821
-
(6,814)
-
-
-
173,007
Interest expense,
net 3,665
-
-
-
-
-
3,665
Foreign currency transaction (gains) losses
884
-
-
-
-
-
884
Other (income) expense
(2,425)
-
-
(44)
-
-
(2,469)
Asset
impairment 5,668
(5,668)
-
-
-
-
-
Restructuring expense
5,054
-
-
(5,054)
-
-
-
Curtailment (gains) losses
270
-
-
(270)
-
-
-
Total costs and expenses, net
1,550,512
(5,737)
(6,814)
(5,368)
(3,942)
-
1,528,651
Income from continuing operations before
taxes 39,931
5,737
6,814
5,368
3,942
-
61,792
Provision
(benefit) for U.S. and foreign income taxes (4,419)
127
6
1,198
1,036
15,448
13,396
Income from
continuing operations 44,350
5,610
6,808
4,170
2,906
(15,448)
48,396
Income
(loss) from discontinued operations, net of tax of $0 (239)
237
-
-
-
-
(2)
Net income (loss)
44,111
5,847
6,808
4,170
2,906
(15,448)
48,394
Noncontrolling interests
(221)
-
-
-
-
-
(221)
Net income (loss) attributable to A. Schulman, Inc.
43,890
$
5,847
$
6,808
$
4,170
$
2,906
$
(15,448)
$
48,173
$
Diluted EPS
1.57
$
1.72
$
Weighted-average number of shares outstanding - diluted
27,976
27,976
|
 12
Non-GAAP to GAAP Reconciliation
Q4 & FY2011
A. SCHULMAN, INC.
Reconciliation of GAAP and Non-GAAP Financial Measures
EBITDA Excluding Certain Items Reconciliation
Unaudited
(In thousands)
2011
2010
2011
2010
Income from continuing operations before taxes
8,213
$
8,671
$
57,467
$
39,931
$
Adjustments (pretax):
Depreciation and amortization
9,861
9,957
40,274
27,380
Interest expense, net
1,393
968
5,531
3,665
Asset
write-downs 6,225
37
8,150
5,737
Costs related to
acquisitions 553
1,498
1,429
6,814
Restructuring related
costs 2,338
2,817
8,117
5,368
Inventory
step-up 324
1,406
607
3,942
EBITDA excluding
certain items 28,907
$
25,354
$
121,575
$
92,837
$
Three months ended
August 31,
Year ended
August 31, |