Attached files
| file | filename |
|---|---|
| 8-K - FORM 8-K - BROCADE COMMUNICATIONS SYSTEMS INC | d256725d8k.htm |
| EX-99.1 - PRESS RELEASE - BROCADE COMMUNICATIONS SYSTEMS INC | d256725dex991.htm |
 Q4 FY 2011 EARNINGS
November 21, 2011
Page 1 of 33
Exhibit 99.2
Brocade Q4 FY 2011 Earnings
11/21/2011
©
2011 Brocade Communications Systems, Inc. |
| Prepared
comments provided by Rob Eggers, Investor Relations Thank you for your
interest in Brocade’s Q4 Fiscal 2011 earnings presentation, which includes prepared
remarks, slides, and a press release detailing fiscal fourth quarter 2011 financial
results. The press release was issued shortly after 1:00 p.m. Pacific time on
November 21, 2011, via Marketwire. The press release, along with these
prepared comments and slides, has been furnished to the SEC on Form 8-K and will be made available
on
Brocade’s
Investor
Relations
website
at
www.brcd.com. |
| Cautionary Statements and Disclosures
This presentation includes forward-looking statements regarding
Brocade’s financial results, plans, strategy and business outlook
as well as worldwide SAN, Ethernet and Federal government IT
spending, which are only predictions and involve risks and uncertainties such
that actual results may vary significantly. These and other risks are
set forth in more detail in our Form 10-Q for the fiscal quarter
ended July 30, 2011 and our Form 10-K for the fiscal year ended October 30, 2010. These
forward-looking statements reflect beliefs, assumptions, outlook, estimates
and predictions as of today, and Brocade expressly assumes no obligation
to update any such forward-looking statements.
In addition, this presentation includes various third-party estimates
regarding the total available market and other measures, which do not
necessarily reflect the views of Brocade. Further, Brocade does not
guarantee the accuracy or reliability of any such information or forecast.
Certain financial information is presented on a non-GAAP basis. The most
directly comparable GAAP information and a reconciliation between the
non-GAAP and GAAP figures are provided in the accompanying press
release, which has been furnished to the SEC on Form 8-K and posted on
Brocade’s website, and is included in the appendix to this
presentation. Please see risk factors on Forms 10-K and 10-Q
filed with the SEC Page 2 of 33
Brocade Q4 FY 2011 Earnings
11/21/2011
©
2011 Brocade Communications Systems, Inc. |
   Agenda
Dan Fairfax
CFO
Mike Klayko
CEO
Prepared comments followed by live Q&A call
Page 3 of 33
Brocade Q4 FY 2011 Earnings
11/21/2011
©
2011 Brocade Communications Systems, Inc. |
| Today’s
prepared
comments
include
remarks
by
Mike
Klayko,
Brocade
CEO,
regarding
the
company’s
quarterly
results, its strategy, and a review of operations, as well as industry trends and
market/technology drivers related to its business; and by Dan Fairfax,
Brocade CFO, who will provide a financial review. A management discussion and
live question-and-answer conference call will be webcast beginning at 2:30 p.m.
Pacific
time
on
November
21
at
www.brcd.com
and
will
be
archived
on
the
Brocade
Investor
Relations
web
site. |
 Fiscal 2011: Q4 Earnings
Mike Klayko, CEO
Page 4 of 33
Brocade Q4 FY 2011 Earnings
11/21/2011
©
2011 Brocade Communications Systems, Inc. |
| Prepared comments provided by Mike Klayko, CEO
|
 Executive Summary
* Non-GAAP, please see GAAP reconciliation in appendix
Page 5 of 33
Brocade Q4 FY 2011 Earnings
11/21/2011
©
2011 Brocade Communications Systems, Inc. |
| Brocade had an outstanding Q4 FY 11 that helped establish company records
in a number of areas. Brocade generated revenue of $550M in Q4, and $2.15B
for the full year—both company records. Q4 EPS was $.16 on a non-GAAP basis, a $.07
increase
Qtr./Qtr.
and
$.03
increase
Yr./Yr.
For
the
full
FY
11,
the
EPS
was
$.50
on
a
non-GAAP
basis.
The
Q4
and
full
FY
11
results indicate good progress on our long-term strategy.
Looking at this quarter in more depth, we saw 14% growth Qtr./Qtr. in our Ethernet
product revenue, led by strong results from our Enterprise and Federal
customers. For FY 11, Brocade grew our Ethernet product revenue 13% Yr./Yr. and generated
record revenue of $552M, which we believe outpaced the market and resulted in share
gains. We believe Brocade is well- positioned for continued Ethernet
revenue growth with our recently introduced campus LAN products targeted at enterprise
networking
customers,
our
expanding
portfolio
of
Ethernet
Fabric
solutions,
and
our
growing
momentum
in
Service
Provider
solutions
this year.
I will touch on these points in a moment.
Brocade also saw strong performance in Q4 in terms of Storage products revenue,
with 10% growth Qtr./Qtr. and a better-than- expected ramp of our 16
Gbps Fibre Channel SAN products that generated nearly $40M of revenue. The ramp of 16 Gpbs
products
is
a
faster
trajectory
than
what
we
saw
with
the
4
Gbps
to
8
Gbps
transition.
The
overall
end-user
demand
in
Storage
and
interest
in
our
next-generation
products
help
to
validate
the
longevity
we
anticipate
for
our
Fibre
Channel
business,
which
is
driven by strategic initiatives for CIOs such as server virtualization and Big
Data. |
 Initiatives to Drive Shareholder Value
Executing to our long-term strategy
Page 6 of 33
Brocade Q4 FY 2011 Earnings
11/21/2011
©
2011 Brocade Communications Systems, Inc. |
| As I mentioned at our recent Analyst Day, we are taking active steps
aimed at increasing shareholder value through a number of key business
initiatives. During Q4 we continued to focus on the fundamentals of our Playbook with the following results:
•Generated record revenues for Ethernet and for the overall company as we
remain focused on our long-term strategy; •Repurchased approximately
$200M of stock in the quarter, which was roughly 9% of the shares outstanding as of the end of
Q3;
•Increased emphasis on the most strategic areas of our business and divested a
non-essential area with the sale of the SBS
business unit;
•Generated record operating cash flow of $206M during the quarter;
•Continued to enforce stringent expense management controls throughout the
company to drive higher profitability; •And, repaid $50M on the term
loan, which reduced the remaining balance to $190M. We
will
continue
to
focus
on
the
fundamentals
of
our
Playbook
as
we
enter
FY
12.
Now
I
will
cover
other
highlights
for
Q4
and
FY 11 in more detail. |
 Network Transformation Creating Opportunities
Brocade: Differentiation through Innovation
Page 7 of 33
Brocade Q4 FY 2011 Earnings
11/21/2011
©
2011 Brocade Communications Systems, Inc. |
| The networking industry is in the midst of a major transformation
necessitated by disruptive IT forces such as enterprise mobility, Big Data,
cloud computing, and virtualization of data centers. We view network transformation as a new business
opportunity and a way to differentiate ourselves by out-innovating the
competition. In fact, I can point to several areas where I believe we are
seizing the innovation opportunities that are available to us, namely:
•Creating the Ethernet Fabric
market through our pioneering efforts in bringing purpose-built solutions for
flatter, faster, simpler networks;
•Redefining
the
economics
of
IT
hardware
acquisition
with
Brocade
Network
Subscription
by
delivering
a
monthly
subscription model that aligns network expense with business needs;
•Driving
the
technology
transition
in
the
storage
industry
with
our
new
16
Gbps
Fibre
Channel
products;
•Challenging
the
status
quo
with
the
new
Brocade
ICX
6610
Switch
in
the
campus
networking
market
by
delivering
innovative
solutions that clearly differentiate themselves against the overpriced and
over-engineered offerings of our competitors. In addition,
we
are
leading
with
the
best
price-performance
100
GbE
routing
solution
in
an
expanding
Service
Provider
marketplace. |
 Brocade VDX/Ethernet Fabric Progress and Roadmap
Networks that just work
Page 8 of 33
Brocade Q4 FY 2011 Earnings
11/21/2011
©
2011 Brocade Communications Systems, Inc. |
| Looking at the Ethernet Fabric category, we’ve been executing
extremely well to our strategy and delivering on our roadmap since
we
introduced
our
vision
at
our
2010
Technology
Day.
Since
then,
we
have
consistently
delivered
results
such
as
being
the first vendor to ship an Ethernet Fabric solution in January of this year and
reaching the 100 Brocade VDX customer mark in Q2 11.
In
Q4,
we
extended
our
leadership
by
introducing
our
second
wave
of
Ethernet
Fabric
solutions
at
VMworld
just
as
competitors
were bringing their first-generation products to market. Specifically, we
introduced two new Brocade VDX switches, the Brocade VDX 6710 and Brocade
VDX 6730, which added new features, performance, and functionality to this growing product family.
These products are purpose-built to meet the new rigors of
highly-virtualized data centers and private/public cloud
computing.
In
terms
of
customer
adoption,
Brocade
now
has
over
300
customers
who
have
deployed
the
Brocade
VDX
line
of
Ethernet Fabric-enabled solutions, with nearly 20% returning as repeat
customers. |
 Ethernet Fabric Case Study
Mission-critical and revenue-generating deployment
at Tier-4 data center
Page 9 of 33
Brocade Q4 FY 2011 Earnings
11/21/2011
©
2011 Brocade Communications Systems, Inc. |
| Tissat, a leading data center and cloud services provider in Spain, is a
useful case study for a successful Ethernet Fabric deployment. In support of
its strategic objectives, Tissat deployed our Ethernet Fabric solution inside of its Tier-4 data center, a
level of certification which is only assigned to data centers with less than one
hour of downtime per year. Our solution has resulted in dramatically
simplifying network management, saving costs, and improving network performance for this early
adopter of Ethernet Fabrics. This successful deployment demonstrates that Brocade
Ethernet Fabrics are capable and proven to operate in mission-critical
environments that correlate to our Storage heritage of supporting the most demanding applications
and data centers in the world. |
 Challenging the Status Quo in Campus Networking
Advanced technology for dynamic enterprise networks
Page 10 of 33
Brocade Q4 FY 2011 Earnings
11/21/2011
©
2011 Brocade Communications Systems, Inc. |
| Moving onto the campus networking market, Brocade is delivering key
innovations in this customer segment that we believe are challenging the
status quo in terms of performance, value, and functionality. Earlier this month we introduced new campus
networking solutions that we believe will reset the price/performance ratio in this
market. Specifically: •
The new Brocade ICX 6610 Switch, a high-performance Ethernet access switch that
combines chassis-like reliability and performance with the flexibility
and affordability of a stackable switch. It delivers five times the stacking bandwidth of the
leading
competitor
while
offering
a
35%
improvement
in
total
cost
of
ownership
(TCO).
•
New high-density 10 GbE options for the Brocade FastIron SX Series that provide
significant performance and scalability enhancements for chassis-based
aggregation and core switching. These blades enable customers to deploy up to 128 ports
of
10
GbE
in
a
single
switch
at
up
to
50%
lower
cost
than
the
leading
competitor.
These new leading-edge products allow us to better participate in a market that
continues to generate more than $13B in revenue worldwide and also position
Brocade well in high-performance segments. |
 Ethernet Business Progress
*
Business revenue includes both products and services/support
Outpaced Ethernet market in FY 11
Page 11 of 33
Brocade Q4 FY 2011 Earnings
11/21/2011
©
2011 Brocade Communications Systems, Inc. |
| Growing our Ethernet business was a consistent theme throughout FY 11. As
I mentioned earlier, we are executing well in this area with Ethernet
product
revenue
in
FY
11
growing
13%
compared
to
FY
10.
In
terms
of
our
Ethernet
business,
which
includes
products
and
services, Brocade ended Q4 with revenues of $189M, up 11% Yr./Yr.
For the full year, Brocade’s Ethernet business revenue was nearly $670M, a
record performance, and up 11% compared to FY 10. Driving this Ethernet
performance in Q4 was strength in the Enterprise and Federal segments, with the Enterprise business growing 19%
Qtr./Qtr. and 19% for FY 11. The Federal Ethernet business grew 39% Qtr./Qtr,
although it was down 14% Yr./Yr. in a more challenging spending
environment.
We
also
saw
record
revenue
for
our
Service
Provider
business
in
FY
11,
which
increased
33%
compared
to
FY
10.
Finally,
we
have
built
a
solid
foundation
with
hundreds
of
early
adopters
of
Brocade
VDX
switches
and
we
believe
this
will
be
critical
to
long-
term growth in our Ethernet business.
There are several other notable trends in our Ethernet business that’s worth
mentioning: •
One, Q4 was a record quarter in terms of revenue in both our Americas, excluding
federal, and EMEA geographies. In fact, EMEA
improved
its
business
nearly
60%
Yr./Yr.
•
Two, we are seeing some very positive customer trend data such as Brocade acquiring
more new Ethernet customers in Q4 than any quarter before. In addition, we
are seeing great traction in our top 100 accounts, which are foundational for this
business.
We
were
very
pleased
to
see
that
95
out
of
these
Top
100
accounts
made
purchases
in
Q4
with
average
deal
size
per
account
up nearly 20% Qtr./Qtr.
•
Three, we are also making great progress in being able to sell Ethernet solutions
into our top SAN accounts. At the end of Q4 we can now point to 60%
penetration of Ethernet sales into our top 100 SAN accounts with more than half of those customers purchasing Brocade
Ethernet products in the quarter. This demonstrates that a majority of our large
SAN customers trust Brocade as a complete networking solutions
provider. |
 Leveraging the Power of the Channel
Brocade value proposition is compelling
Page 12 of 33
Brocade Q4 FY 2011 Earnings
11/21/2011
©
2011 Brocade Communications Systems, Inc. |
| We recognize that the channel is also critical to the growth of our
Ethernet business over the long term. We believe we offer our channel
partners
a
number
of
unique
value
propositions
in
the
form
of
the
“Three
Ps,”
namely
roduct
differentiation,
partner
rofitability,
and
account
ull
to
create
demand.
These
value
propositions
have
helped
Brocade
generate
more
revenue through the
channel year-over-year, particularly for our Ethernet products.
In addition, our channel efforts paid off in Q4 with several important industry
recognitions: •Tech
Data,
a
global
distributor
serving
thousands
of
resellers,
named
Brocade
as
their
“Vendor
Partner
of
the
Year”
at
their annual event,
beating out HP, Cisco, VMware, IBM, and others. Tech Data cited two main factors
for awarding Brocade the honor: Brocade’s projected
year-over-year revenue growth of over 30 percent and the growth of our
unique customer count by over 35% year-to-date; •Insight,
a
global
value
added
reseller
with
nearly
$5B
in
revenue,
named
Brocade
as
their
“Partner
of
the
Year”
in
several categories,
including Top Sales and Profitability Partner, Top Partner Alignment, and Top
Insight Values Representative; •Brocade was also honored with the Global
Technology Distribution Council's (GTDC) Silver Rising Star award based on
Brocade’s strong performance in the $100 million to $500 million
category for year-over-year U.S. revenue growth through distributors.
As announced last week, Brocade continues to invest and enhance its Alliance
Partner Network, or APN, program in an effort to make channel partners more
profitable and successful in meeting the needs of our customers. P
P
P |
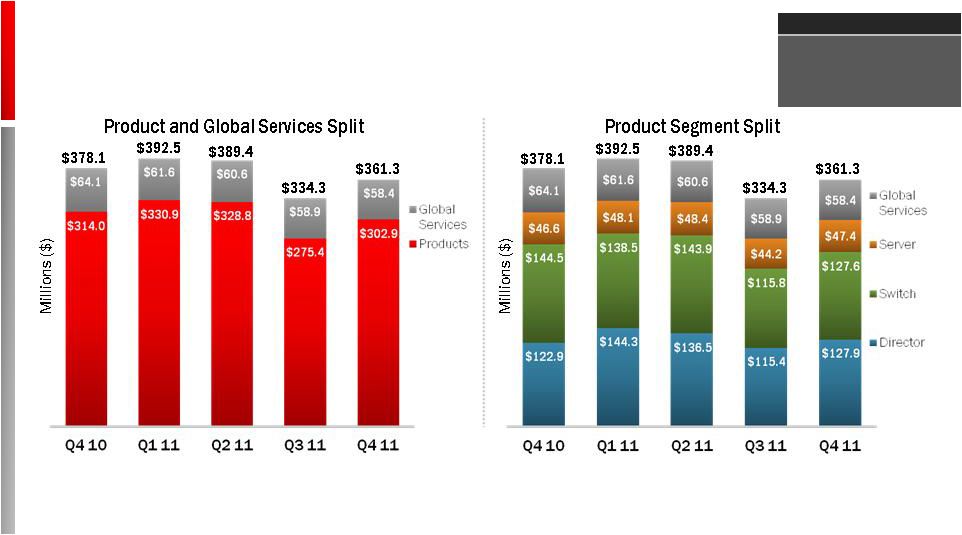
 •
Q4 Storage business revenue of
$361M, up 8% Qtr./Qtr.
•
Q4 Storage product revenue of $303M,
up 10% Qtr./Qtr.
•
Director revenue up 11% Qtr./Qtr.
•
Switch revenue up 10% Qtr./Qtr.
•
Embedded switch revenue up 8% Qtr./Qtr.
Storage Business Progress
Strength across all product segments
Page 13 of 33
Brocade Q4 FY 2011 Earnings
11/21/2011
©
2011 Brocade Communications Systems, Inc. |
| A consistent theme and Playbook fundamental is maintaining our leadership
in the SAN market. Brocade accomplished this in Q4 and throughout FY 11 by
delivering advanced solutions that enable our customers to increase performance, consolidate,
and increase business agility. Storage business revenue, including products and
services, was over $361M in Q4, up 8% Qtr./Qtr. We saw a slightly higher
growth rate for our Storage products revenue, which was up 10% Qtr./Qtr. We saw good
sequential
growth
across
all
product
segments
for
Storage
in
the
quarter,
including
our
16
Gbps
products. |
 World’s Fastest Storage Area Networks
Page 14 of 33
Brocade Q4 FY 2011 Earnings
11/21/2011
©
2011 Brocade Communications Systems, Inc. |
| One of the drivers behind our strong Storage results was Brocade
seeing a better-than-expected ramp of our 16 Gbps products,
which generated approximately $40M in revenue in Q4. We attribute part of this
strong performance to the fastest, and perhaps the smoothest, qualification
process for any new product portfolio among our key OEMs. To date, EMC, Fujitsu, HDS, HP, IBM,
and NetApp have qualified our next-generation Storage portfolio and made it
generally available to customers. We are also seeing good traction and strong
demand for our Storage products in emerging markets. For example, in Q4
Brocade closed a number of large director deals in these countries and elsewhere,
indicating that the number and size of new data center and storage
networking opportunities remain very healthy. This correlates well with the data we shared at Analyst
Day from industry research and from our own customer survey showing Fibre Channel
to be a mission-critical technology, which will be in demand for years
to come. The results for our Storage business in Q4 as well as the
significant progress we’ve made in transitioning to the next-generation
SAN technology, serve as important proof points to the customer confidence and
reliance of this tried-and-tested data center foundation.
|
 •
Record Ethernet revenue for quarter
and year
•
Strong Storage revenue growth and faster-
than-expected ramp of 16 Gbps products
•
300+ Brocade VDX accounts in deployment
•
Record operating cash flow quarter
•
~$200M share repurchase
Q4 2011 Summary
Executing to our long-term strategy
Page 15 of 33
Brocade Q4 FY 2011 Earnings
11/21/2011
©
2011 Brocade Communications Systems, Inc. |
| In summary, we believe that we have created good momentum exiting the
year and look forward to leveraging our position of technology leadership,
new products, and expanding routes to market into the new fiscal year. |
 FY12 Playbook
1.
Differentiate Through Innovation
2.
Grow Top Line Profitably
3.
Execute on 2011 Investments
4.
Increase Shareholder Value
5.
Be an Employer of Choice
Page 16 of 33
Brocade Q4 FY 2011 Earnings
11/21/2011
©
2011 Brocade Communications Systems, Inc. |
| Looking forward to FY 12, we plan to execute on our business strategies
as outlined in our Playbook with the following fundamentals:
•
Differentiate through innovation
•
Grow top line profitably
•
Execute on 2011 investments
•
Increase shareholder value
•
Be an employer of choice
I look forward to reporting our progress on these fundamentals throughout FY
12. |
 Q4 FY 2011 Financials
Dan Fairfax, CFO
Page 17 of 33
Brocade Q4 FY 2011 Earnings
11/21/2011
©
2011 Brocade Communications Systems, Inc. |
| Prepared comments provided by Dan Fairfax, CFO
|
 Key Financial Metrics
*
Non-GAAP, please see GAAP reconciliation in appendix
Q4 10
Q1 11
Q2 11
Q3 11
Q4 11
Q4 11
Qtr./Qtr.
Q4 11
Yr./Yr.
Revenue
$549M
$546M
$548M
$503M
$550M
+9%
+0.3%
Storage product revenue
$314M
$331M
$329M
$275M
$303M
+10%
-4%
Ethernet product revenue
$143M
$126M
$129M
$139M
$158M
+14%
+11%
Global Services revenue
$92M
$89M
$91M
$89M
$89M
+1%
-3%
Non-GAAP gross margin*
62.2%
62.0%
63.4%
61.8%
62.9%
+1.1 pts
+0.7 pts
Non-GAAP operating margin*
20.2%
17.1%
17.9%
14.0%
21.0%
+7.0 pts
+0.8 pts
Non-GAAP EPS—diluted*
$0.13
$0.12
$0.12
$0.09
$0.16
+$0.07
+$0.03
GAAP EPS—diluted
$0.05
$0.05
$0.05
$0.00
-$0.01
-$0.01
-$0.06
Operating cash flow
$106M
$118M
$114M
$11M
$206M
+1,765%
+94%
Net debt
$624M
$503M
$394M
$374M
$382M
+2%
-39%
Page 18 of 33
Brocade Q4 FY 2011 Earnings
11/21/2011
©
2011 Brocade Communications Systems, Inc. |
| In
Q4
11,
Brocade
generated
revenue
of
$550M,
which
was
up
over
9%
Qtr./Qtr.
and
slightly
above
Q4
10
results.
Revenue
for
FY
11
was
$2,147M,
up
3%
from
FY 10. Storage product revenue grew 10% Qtr./Qtr. driven by good
growth across all Storage segments and a faster-than-expected ramp of 16
Gbps products. OEM inventory was reduced to a little more than one week of
supply exiting Q4, compared to approximately two weeks exiting Q3. This is the lowest level of
inventory held by our OEMs since Q1 09. Storage product revenue represented 55% of
total revenue in Q4, unchanged versus Q3. Ethernet product revenue was up 14%
Qtr./Qtr., achieving a new record for the company, with Federal and Enterprise segments driving the sequential growth in
the quarter. We continued to see good Ethernet growth Yr./Yr. across our customers,
segments, and product offerings. Ethernet product revenue in Q4 represented
29% of total revenue, up from 28% in Q3. During FY 11 our Ethernet product revenue grew 13%, which we believe was significantly faster than
the market growth.
Global Services revenue was approximately $89M, up slightly sequentially driven by
higher support revenue. At the end of September, we completed the sale of
our
SBS
consulting
business
which
reduced
our
professional
services
revenue
by
$2M
and
slightly
increased
services
gross
margins
in
the
quarter.
The
SBS
workforce was approximately 120 employees. Our Global Services revenue represented
approximately 16% of total Q4 revenue, slightly down from Q3.
Non-GAAP
gross
margins
were
62.9%
in
Q4,
better
than
the
guidance
range
we
provided
for
the
quarter
and
up
110
basis
points
from
Q3.
The
higher-than-
expected gross margins were driven by higher revenue, favorable product mix, and
lower manufacturing overhead than anticipated. Non-GAAP operating
margins improved to 21.0% in Q4, driven primarily by the increase in revenue and
lower operating expenses than we incurred in Q3. Non-GAAP EPS on a diluted
basis was $0.16 for Q4. GAAP EPS was a loss of $.01 for the quarter, driven
by the divestiture of SBS and the tax rate impact of using repatriated cash
used for stock repurchase in Q4. The Q4 effective non-GAAP tax rate was 22.9% and effective GAAP tax rate was 110.5%. The higher-
than-usual GAAP tax rate was impacted by repatriating the cash for the share
repurchase. Other Income/Expense in the quarter was ($13.6M), approximately
$3.5M better than Q3 and slightly better than our guidance for Q4. This quarter now
reflects the full benefit of the lower interest rate on our term debt and lower
related amortization of issuance costs and debt discount from the refinancing in
June. During
Q4
we
generated
a
record
of
$206M
in
operating
cash
flow.
We
repatriated
$200M
from
our
offshore
operations
in
a
cash
tax
efficient
transaction
by
offsetting the US income generated against available net operating loss
carry-forwards. Further we paid down $50M of term debt and repurchased
approximately
46.5M
shares.
Net
debt
was
$382M
exiting
2011,
down
from
$624M
at
the
end
of
fiscal
2010.
Weighted
average
diluted
shares
were
486M
in
Q4,
down 24M from Q3. We will see the full EPS benefit of the Q4 share repurchase in
our Q1 12 outlook. |
 Total +11%
Enterprise
Service Provider
Federal -29%
Total Ethernet Business Revenue
Record Ethernet Business Revenue in Q4 11 and FY 11
23%
FY 11 Yr./Yr. Compares
Page 19 of 33
Brocade Q4 FY 2011 Earnings
11/21/2011
©
2011 Brocade Communications Systems, Inc. |
| Looking at our Ethernet business, including hardware and
Ethernet-based support and services, Q4 revenue was $189.2M, up 11% Yr./Yr. and
up 12% from Q3, achieving the largest Ethernet revenue quarter in the history of the
company. Ethernet business revenue for FY 11 was a record $669.8M, up 11%
compared to FY 10. From an Ethernet product segment view, we continued to see
good growth with both our fixed form-factor and chassis products in the quarter.
Sequential
revenue
growth
in
the
quarter
was
led
by
the
Brocade
FCX
stackable
switches,
up
36%
Qtr./Qtr.,
and
Brocade
MLX
router
chassis,
up 21% Qtr./Qtr., with both product families achieving record revenue in Q4. We
also continued to see good growth with Brocade ADX Layer 4–7 product
revenue in Q4, which was up over 55% Yr./Yr. As we drill down into the
Ethernet business details in Q4, we are pleased with the Yr./Yr. growth in our Service Provider and Enterprise
segments. Q4 revenues from Enterprise and Service Provider businesses collectively
were up 18% Yr./Yr. and up 8% sequentially, showing continued
growth
across
our
product
portfolio
and
customer
base.
Our
Enterprise
business
generated
record
revenue
of
$108.1M
for
Brocade
in Q4 and record revenue of $390.1M for FY 11 on growth of 19% Yr./Yr. Our Service
Provider business continued to perform well in Q4, generating
$47.2M
in
revenue
and
also
achieved
record
revenue
of
$182.4M
in
FY
11
with
33%
growth
Yr./Yr.
From a geographic viewpoint both EMEA and Americas, excluding Federal, were up
quarter-over-quarter, while APAC and Japan were both lower. Our Q4
Federal Ethernet business was $33.9M, up 39% from the previous quarter, reflecting strong improvement in Federal orders in
the quarter and was down 14% Yr./Yr.
We continue to be pleased with Ethernet Fabric-enabled Brocade VDX product
revenue, which grew 16% sequentially. We now have over 300 Brocade VDX
customers as Mike had mentioned previously and have generated more than $15M of revenue this year from this important new
product family. We believe we are in a leading competitive position and expect
these products to drive meaningful growth for us during FY 12. Total
converged networking product revenue in Q4, including the Brocade 8000, FCoE blades for Brocade DCX backbones, Brocade VDX
switches, and Converged Network Adapters, was up nearly 200% Yr./Yr.
|
 Total SAN Business Revenue
Total -1%
Support -4%
Products 0%
FY 11 Yr./Yr. Compares
Page 20 of 33
Brocade Q4 FY 2011 Earnings
11/21/2011
©
2011 Brocade Communications Systems, Inc. |
| Looking at our Storage business, including hardware and Storage-based
support and services, Q4 revenue was $361.3M, up 8% sequentially and down 4%
from Q4 10. Storage business revenue was $1,478M in FY 11, slightly lower than the $1,490M reported in FY
10. We saw end-user demand for our storage products increase 8% Yr./Yr., which
was offset by approximately a one and one-half week reduction in OEM
inventory levels during the year. I
want
to
spend
a
minute
discussing
our
OEM
inventory
metric.
In
the
past,
we
have
provided
OEM
inventory
turns
measured
on a
consolidated basis across all products in recognition of the significance of OEMs
to our historical selling models. This metric provided the estimated
number
of
weeks
of
product
shipments
that
could
be
fulfilled
from
inventory
held
by
OEMs
regardless
of
product
family.
With
the
relatively small OEM contribution to our Ethernet revenue and changes in sales
focus for our Ethernet products, we will now report OEM weeks of inventory
solely on our Storage business. This new metric will be based on OEM Storage inventory and estimated Storage
business revenue going forward. We believe that this updated metric will help
provide improved visibility to the inventory position at our OEMs and
eliminate the impact from any material changes in segment mix. For comparison purposes, Q4 inventory levels were a little
more than one and one-half weeks using the new metric based on only Storage
business revenue as compared to just over one week under the old metric
based on overall company revenue. Demand for Storage products was greater
than expected in our seasonally strong Q4 and resulted in Storage product revenue of $302.9M
in the quarter, up 10% sequentially. We experienced good growth across our
Director, Switch, and Server product segments in Q4. Demand for our 16 Gbps
portfolio of products was higher than expected for the quarter, as end-user interest was strong and all the major
OEMs
are
now
qualified
and
shipping
product.
Revenue
for
16
Gbps
products
was
nearly
$40M
in
Q4.
Our
Server
product
group,
including
embedded
switches
and
Server
adapter
products
(HBAs
and
Mezzanine
Cards),
posted
revenue
of
$47.4M, up 7% from Q3 and up 2% Yr./Yr. Embedded switch revenue was up 2% Yr./Yr.
while our Server adapter product revenue was down slightly Yr./Yr.
|
 Revenue: Routes to Market,
10% Customers, Geographic Splits
Page 21 of 33
Brocade Q4 FY 2011 Earnings
11/21/2011
©
2011 Brocade Communications Systems, Inc. |
| In Q4, Brocade had three customers (EMC, HP, and IBM) that each
contributed revenue of at least 10% of the total company revenue. These three
customers contributed 41% of revenue in Q4, down from 43% in Q3 when we had the
same
three
10%
customers.
Other
OEMs
represented
21%
of
revenues
in
Q4,
versus
18%
in
Q3,
driven
by
higher
revenue
contribution from HDS and Dell. Channel and Direct were 38% of revenue in Q4, a
slight decrease from 39% in Q3. The mix of business based on ship-to
location was 62% domestic and 38% international in the quarter, reflecting a slight
shift in mix to domestic revenue from Q3. |
 Revenues and Non-GAAP Gross Margins*
* Non-GAAP, please see GAAP reconciliation in appendix
Page 22 of 33
Brocade Q4 FY 2011 Earnings
11/21/2011
©
2011 Brocade Communications Systems, Inc. |
| Q4 non-GAAP Company gross margins of 62.9% were above the range of
61.0% to 62.0% provided for the quarter. Gross margins improved 110 basis
points quarter-over-quarter driven by better Storage product and Global Services gross margins in
the quarter. Gross margins were higher by 70 basis points Yr./Yr. on improved
product margins, including progress on our Ethernet product margins
initiatives. Q4 Product non-GAAP gross margins were 64.7%, up from
64.5% in Q3 and 63.9% in Q4 10 driven by improving margins for both Ethernet
and Storage products. Q4 Ethernet non-GAAP gross margins were 49.1%, down slightly from 49.7% reported
in
Q3 and up 130 basis points from 47.8% reported in Q4 10. The Ethernet gross margin
improvement year-over-year was driven primarily by a more profitable
product mix. Q4 Storage non-GAAP gross margins were 72.8%, up 80 basis points from 72.0% in
Q3 and up 160 basis points from 71.2% in Q4 10, driven by a favorable product mix.
The Q4 impact on overall non-GAAP gross margins from higher Product
gross margins was approximately +25 basis points. With consolidation of our
supply chain nearly complete and the continued blending of Ethernet and Fibre Channel technology in
our converged products and Ethernet Fabric switches, we believe individual product
family gross margins are becoming less meaningful and relevant to management
and investors. We will begin highlighting our Product gross margins during our earnings
calls going forward and will provide you color on the segment and product mix
dynamics as they relate to the changes in overall Product gross margins. The
blended Product non-GAAP gross margin target for FY12 is 63% to 66%, which assumes roughly
two-thirds Storage mix and one-third Ethernet mix of total product revenue.
We have been operating within or better than that target each of the past
five quarters. Global Services non-GAAP gross margins were 53.4% in Q4,
an improvement from 49.5% reported in Q3, due to the sale of SBS
during
the
quarter,
higher
support
revenue,
as
well
as
lower
support
spending
in
the
quarter.
The
Q4
impact
on
overall
non-
GAAP gross margins from higher sequential Global Services gross margins was
approximately +65 basis points. |
 Operating Performance vs. Target Model (FY 11)
*
Non-GAAP, please see GAAP reconciliation in appendix
Page 23 of 33
Brocade Q4 FY 2011 Earnings
11/21/2011
©
2011 Brocade Communications Systems, Inc. |
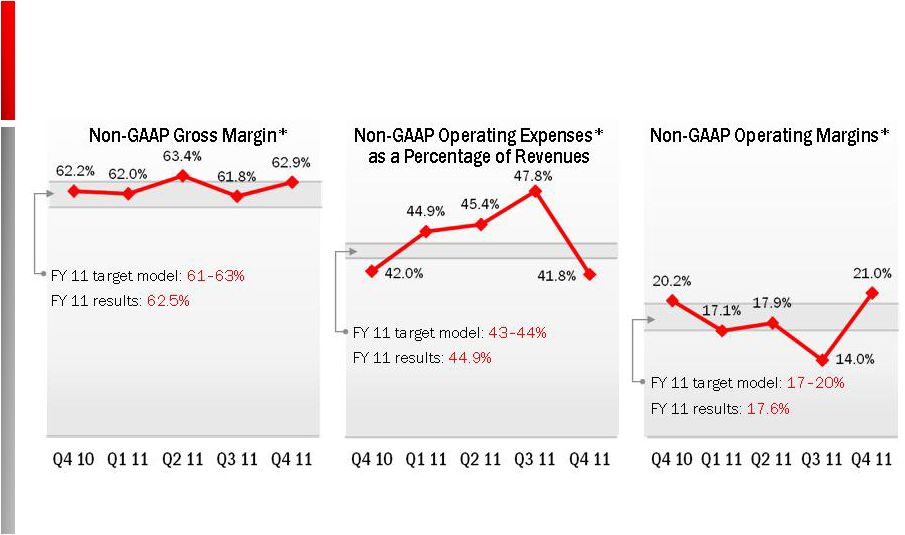
| Company non-GAAP gross margins were 62.9% for Q4 and 62.5% for FY 11.
Gross margins for the year were relatively flat compared to FY 10 and near
the top of the target range of 61% to 63% for FY 11. On a non-GAAP basis,
total operating expenses were 41.8% of revenues in Q4 versus 47.8% in Q3. Operating expenses
on a dollar basis decreased $10.3M from Q3, demonstrating our ability to manage our
expenses very tightly and our commitment to driving higher levels of
productivity. Headcount was down 226 sequentially, which was primarily
driven by the sale of SBS (120 personnel) during the quarter. The majority
of headcount savings from that divestiture was captured in our Global Services gross margin results.
Operating expenses for FY 11 were 44.9% of revenues, just above our target range of
43% to 44% for FY11. Non-GAAP operating margins were 21.0% in Q4, an
increase from Q3 as well as Q4 10, and better than our expected range,
driven by higher revenue, higher gross margins, and reduced operating expenses. Operating margins for FY 11
were 17.6%, within our target range of 17% to 20% for FY 11.
|
 Balance Sheet and Cash Flow Highlights
* Adjusted EBITDA is as defined in the term debt credit agreement
Q4 10
Q1 11
Q2 11
Q3 11
Q4 11
Q4 11
Qtr./Qtr.
Q4 11
Yr./Yr.
Cash from operations
$106M
$118M
$114M
$11M
$206M
+1,765%
+94%
Capital expenditures
$46M
$23M
$27M
$26M
$20M
-23%
-56%
Free cash flow
$61M
$95M
$87M
($15M)
$186M
–
+206%
Debt payments
$30.2M
$39.7M
$58.9M
$12.3M
$50M
+307%
+66%
Cash, equivalents, and
short-term investments
$336M
$416M
$466M
$473M
$415M
-12%
+24%
Senior secured debt
$960M
$919M
$860M
$847M
$797M
-6%
-17%
Adjusted EBITDA*
$126M
$114M
$121M
$91M
$138M
+51%
+9%
Stock repurchase
$0
$0
$0
$10M
$201M
+1,898%
–
Senior secured leverage ratio
1.93x
2.01x
1.86x
1.87x
1.72x
-8%
-11%
Covenant
2.5x
2.5x
2.5x
2.5x
2.5x
–
–
Fixed charge coverage ratio
1.66x
1.79x
2.26x
2.29x
2.63x
+15%
+58%
Covenant
1.25x
1.5x
1.5x
1.5x
1.5x
–
–
As of October 29, 2011
Page 24 of 33
Brocade Q4 FY 2011 Earnings
11/21/2011
©
2011 Brocade Communications Systems, Inc. |
| Cash
generated
from
operations
was
$206M
in
Q4,
up
significantly
quarter-over-quarter
due
to
improved
shipment
linearity
in
Q4, resulting in DSOs of 41 days, higher overall revenue, and profitability, as well
as the typical cash flow pattern for the company, which is seasonally
stronger in Q4. Total capital expenditures in the quarter were $20M, versus $26M in Q3.
Cash, equivalents, and short-term investments were $415M, down $58M from Q3,
reflecting the cash used for the share repurchase and term debt retirement
in the quarter that Mike mentioned. Our cash and equivalents are up $79M from Q4 10. In
Q4, we reduced our term debt principal by another $50M and our term debt loan
balance is now $190M exiting the year. We now have $178M remaining of our
Board-authorized stock repurchase program. Adjusted EBITDA in the
quarter was $137.8M, which was a significant increase from the Q3 level of $91.3M. The Senior
Secured Leverage Ratio of 1.72x and the Fixed Charge Coverage Ratio of 2.63x are
both well within the covenant requirements of our term credit agreement.
|
 Strong Cash Flow—Reducing Debt and Repurchasing Shares
* Cash, cash equivalents, and short-term investments
Page 25 of 33
Brocade Q4 FY 2011 Earnings
11/21/2011
©
2011 Brocade Communications Systems, Inc. |
| With the strong operating cash flow of $449M that the company generated
during FY 11, I am pleased that we have been able to reduce our term debt by
over $160M or nearly 46% this year, repurchase over 48M shares to significantly
reduce the shares outstanding as we enter FY 12, and grow our cash balance by
approximately 24% year-over-year. Our top priorities for cash going
forward are to maintain a prudent balance sheet in the face of continued macro
economic
uncertainty,
reduce
our
term
debt
and
opportunistically
repurchase
stock. |
 Q1 2012 Planning Assumptions and Outlook
IT market conditions
•
Uncertainty around macro economic conditions
•
IT spending is growing but at slower pace
•
Federal spending will be seasonally down
Brocade business
•
Planning for annual growth rate of 2–5% for storage
•
Impact of SBS divestiture (lower revenue,
higher margin) to Global Services
Other P&L items
•
Full EPS benefit of Q4 share repurchase
•
Structural tax rate assumes no R&D tax credit
renewal in 2012
OEM inventories
•
Expect to remain relatively flat Qtr./Qtr.
* Non-GAAP, please see GAAP reconciliation in appendix
Financial Outlook
Q1 12
Revenue range
$530M–$550M
Non-GAAP gross margin*
62.0%–63.0%
Non-GAAP operating expenses*
44.0%–45.0%
Non-GAAP operating margin*
17.0%–19.0%
Other income/other expense
($13M)
Non-GAAP tax rate*
25%–27%
Fully diluted shares outstanding
465M–475M
Non-GAAP EPS*
$0.12–$0.14
Operating cash flow
$50M–$70M
Capital expenditures
$20M–$23M
Free cash flow
$27M–$30M
Page 26 of 33
Brocade Q4 FY 2011 Earnings
11/21/2011
©
2011 Brocade Communications Systems, Inc. |
| Looking forward to Q1 12, we contemplated the following in setting our
outlook: •The current macro environment and economy continue to show
uncertainty, especially within the Eurozone countries. •IT spending is
growing but at lower levels than anticipated in early calendar 2011.
•We
saw
greater-than-expected
demand
for
16
Gbps
products
in
Q4,
but
continue
to
plan
our
Storage
business
around
expected
long-term
industry growth rates of 2-5% per year.
•We expect Federal spending to be seasonally weak in Q1 and are cautious as we
enter the quarter ahead of Federal budget uncertainity. •The recent
flooding in Thailand has not impacted Brocade directly, but we continue to monitor the potential impact to our partners and the
broader supply chain.
•We expect to see the full impact of the divestiture of SBS, which will reduce
our professional services revenue by another $3M in Q1. •We expect to
see some increases in operating expense dollars, driven primarily by our annual employee cost of living increase, but
anticipate holding headcount relatively flat at Q4 levels.
•Exiting
Q4,
OEM
inventory
was
a
little
more
than
one
and
one-half
weeks
based
on
Storage
business
revenue.
Exiting
our
Q1,
we
expect
OEMs to continue to hold approximately the same level of inventory going into the
weaker part of the year for them. •We
expect
to
see
the
full
EPS
benefit
of
the
$200M
share
repurchase
in
our
Q1
results
and
anticipate
using
more
of
our
available
cash
for
debt reduction.
•From
a
tax
rate
perspective,
we
plan
at
a
structural
rate
of
25%
to
27%
non-GAAP,
assuming
that
the
Federal
R&D
Tax
Credit
will
expire at
the end of December 2011. If the Tax Credit is renewed for Calendar 2012, we
would expect our structural rate to be reduced by 2 to 3 points. Discrete
events can impact our tax rate from time to time. However we do not provide guidance on such events due to the inherent
uncertainty of their timing. |
     Prepared Comments and Live Conference Call
Jason Nolet
VP of Data Center
and Enterprise
Networking
Dan Fairfax
CFO
John McHugh
CMO & VP of
Marketing
Ian Whiting
SVP of WW Sales
Mike Klayko
CEO
Dave Stevens
CTO & VP of
Corporate
Development
November 21, 2011, 2:30pm
Page 27 of 33
Brocade Q4 FY 2011 Earnings
11/21/2011
©
2011 Brocade Communications Systems, Inc. |
| Prepared
comments provided by Rob Eggers, Investor Relations That concludes
Brocade’s prepared comments. At 2:30 p.m. Pacific Time on November 21
Brocade
will
host
a
webcast
conference
call
at
www.brcd.com.
Thank you for your interest in Brocade. |
 Appendix and Reconciliations
Page 28 of 33
Brocade Q4 FY 2011 Earnings
11/21/2011
©
2011 Brocade Communications Systems, Inc. |
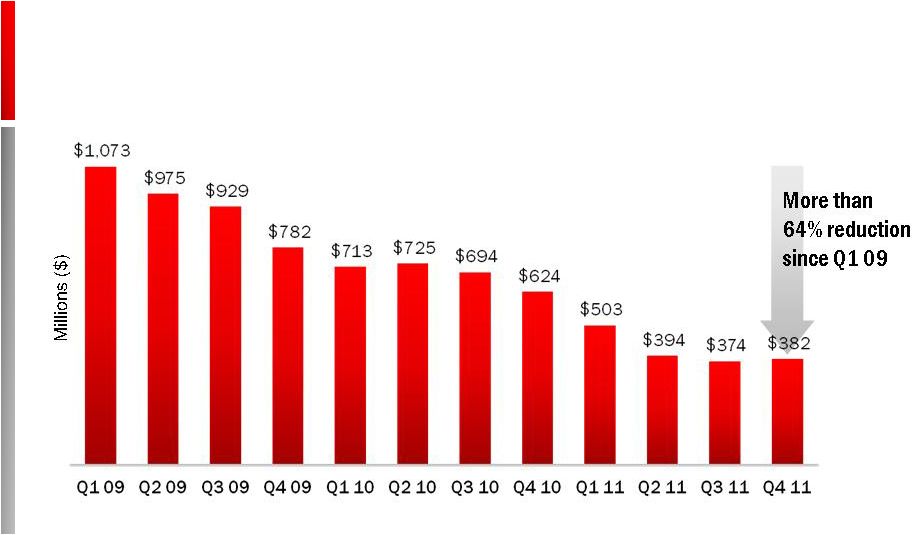 Net Debt: Defined as Total Debt Less Total Cash
Decreased by nearly $700M from Q1 09 to Q4 11
Page 29 of 33
Brocade Q4 FY 2011 Earnings
11/21/2011
©
2011 Brocade Communications Systems, Inc. |
 Quarterly Net Income (Loss)
GAAP/Non-GAAP Reconciliation
(In Thousands)
Q4 10
Q1 11
Q2 11
Q3 11
Q4 11
Net income (loss) on a GAAP basis
22,227
26,918
26,079
1,937
(4,324)
Gross margin adjustments:
Stock-based compensation
3,179
2,860
4,167
4,234
4,345
Amortization of acquired intangibles
14,466
14,466
14,466
14,466
14,090
Provision for (benefit from) certain pre-acquisition litigation
–
–
–
(14,334)
–
Legal fees associated with certain pre-acquisition litigation
243
77
216
92
59
Total gross margin adjustments
17,888
17,403
18,849
4,458
18,494
Operating expense adjustments:
Stock-based compensation
22,096
17,046
18,363
16,733
15,326
Amortization of acquired intangibles
16,190
16,190
15,023
15,023
14,476
Legal fees associated with indemnification obligations and other
related costs, net
(666)
124
–
–
–
Restructuring costs and facility lease losses, net
1,059
–
–
–
–
Loss on sale of subsidiary
–
–
–
–
12,756
Total operating expense adjustments
38,679
33,360
33,386
31,756
42,558
Total operating income adjustments
56,567
50,763
52,235
36,214
61,052
Original issue discount and debt issuance costs of debt related to lenders
that did not participate in the refinancing
–
–
–
25,465
–
Income tax effect of adjustments
(14,049)
(17,208)
(17,037)
(17,657)
22,018
Non-GAAP net income
64,745
60,473
61,277
45,959
78,746
Page 30 of 33
Brocade Q4 FY 2011 Earnings
11/21/2011
©
2011 Brocade Communications Systems, Inc. |
 Q4 2011 Cash and Debt Covenant
*
Adjusted EBITDA is as defined in the term debt credit agreement
** Cash, equivalents and short-term investments
Page 31 of 33
Brocade Q4 FY 2011 Earnings
11/21/2011
©
2011 Brocade Communications Systems, Inc. |
 Adjusted EBITDA and Sr. Secured Leverage Ratio
Consolidated Senior Secured Leverage Ratio
Q4 FY 10
Q1 FY 11
Q2 FY 11
Q3 FY 11
Q4 FY 11
$ Thousand
Actual
Actual
Actual
Actual
Actual
Consolidated Net Income (Loss)
$22,226
$26,918
$26,079
$1,937
($4,324)
plus
(i) Consolidated Interest Charges
$22,202
$21,546
$20,745
$42,066
$13,483
(ii) Provision for Federal, state, local and foreign income taxes payable
$5,432
$0
$0
$0
$45,446
(iii) Depreciation and amortization expense
$51,532
$52,522
$51,712
$51,220
$50,898
(iv) Fees, costs and expenses incurred on or prior to the Acquisition Closing
Date in connection with the Acquisition and the financing thereof
$0
$0
$0
$0
$0
(v) Any cash restructuring charges and integration costs in connection with the
Acquisition, in an aggregate amount not to exceed $75,000,000
$0
$0
$0
$0
$0
(vi) Non-cash restructuring charges incurred in connection with the
Transaction, all as approved by Arrangers $930
$848
$779
$687
$580
(vii) Other non-recurring expenses reducing such Consolidated Net Income
which do not represent a cash item in such period or any future period
(in each case of or by the Borrower and its Subsidiaries for such Measurement
Period)
$574
$175
$1,735
$136
$13,035
(viii) Any non-cash charges for stock compensation expense in compliance
with FAS 123R and amortization of the fair value of unvested options
under the Acquired Business’ employee stock option plan assumed by
the Borrower $25,275
$19,906
$22,530
$20,969
$19,670
(ix)
Legal fees and expenses relating to the Borrower’s indemnification
obligations for the benefit of its former officers and directors in
connection with its historical stock option litigation $22
$15
$0
$0
$0
Minus
(i)
Federal, state, local and foreign income tax credits
$0
$5,717
$612
$10,300
$0
(ii)
All non-cash items increasing Consolidated Net Income (in each case of or by
the Borrower and its Subsidiaries for such Measurement Period)
$2,212
$1,995
$1,992
$15,408
$1,024
Consolidated EBITDA
$125,981
$114,218
$120,976
$91,307
$137,764
4 Quarter Trailing Consolidated EBITDA
$497,098
$458,465
$463,371
$452,483
$464,266
Consolidated Senior Secured Debt
$959,491
$919,312
$859,983
$847,031
$796,782
Consolidated Senior Secured Leverage Ratio (x)
1.93
2.01
1.86
1.87
1.72
As defined in the term credit agreement
Page 32 of 33
Brocade Q4 FY 2011 Earnings
11/21/2011
©
2011 Brocade Communications Systems, Inc. |
 Thank You
www.brcd.com
Page 33 of 33
Brocade Q4 FY 2011 Earnings
11/21/2011
©
2011 Brocade Communications Systems, Inc. |