Attached files
| file | filename |
|---|---|
| 8-K - FORM 8-K - Woodward, Inc. | c24982e8vk.htm |
| EX-99.1 - EXHIBIT 99.1 - Woodward, Inc. | c24982exv99w1.htm |
| EX-99.2 - EXHIBIT 99.2 - Woodward, Inc. | c24982exv99w2.htm |
Exhibit 99.3

| November 14, 2011 FY 2011 Fourth Quarter Results |

| Today's Agenda Highlights & Market Review Tom Gendron Financial Results & Outlook Bob Weber Q&A 2 |

| Cautionary Statement 3 Information in this conference call and slide presentation contains forward-looking statements within the meaning of the Private Securities Litigation Reform Act of 1995 that involve risks and uncertainties, including, but not limited to, statements regarding future sales, earnings, liquidity, relative profitability, and the impact of economic conditions and downturns on Woodward. Readers are cautioned that these forward-looking statements are only predictions and are subject to risks, uncertainties, and assumptions that are difficult to predict. Factors that could cause actual results and the timing of certain events to differ materially from the forward-looking statements include, but are not limited to, a decline in business with, or financial distress of, our significant customers; instability in the financial markets or other prolonged unfavorable economic and other industry conditions; any failure to fully comply with the Company's administrative agreement with the U.S. Department of Defense; Woodward's ability to obtain financing, on acceptable terms or at all; Woodward's ability to implement and realize the intended effects of restructuring efforts; Woodward's ability to successfully manage competitive factors; Woodward's ability to manage expenses while responding to sales increases or decreases; the ability of Woodward's subcontractors and suppliers to meet their obligations; the success of, or expenses associated with, Woodward's product development activities; Woodward's ability to integrate acquisitions and manage costs thereto; Woodward's debt obligations, debt service requirements and ability to operate its business and pursue its business strategies in light of restrictive covenants in its outstanding debt agreements; risks related to U.S. Government contracting activities; future impairment charges resulting from changes in the estimates of fair value of reporting units or of long-lived assets; future subsidiary results or changes in domestic and international tax statutes; environmental liabilities; Woodward's continued access to a stable workforce and favorable labor relations; Woodward's ability to successfully manage regulatory, tax and legal matters; liabilities that may result from legal and regulatory proceedings, inquiries, or investigations by private or U.S. Government persons or entities; risk of operating internationally including the impact on reported earnings from fluctuations in foreign currency exchange rates; fair value of defined benefit plan assets and assumptions used in determining Woodward's retirement pension and other postretirement benefit obligations and related expenses, and other risk factors described in Woodward's Annual Report on Form 10-K for the year ended September 30, 2011 which we expect to file shortly. |
| Q4 FY 2011 Fiscal Highlights Net Sales of $489 million Up 19% YOY Earnings of $0.60 per diluted share, up from $0.47 last year 28% increase YOY Significant increases in Variable compensation R&D EBIT of $65 million Up 15% YOY Free cash flow of $52 million 4 |

| Business Highlights - Aerospace Aftermarket WWD commercial aftermarket +36% in Q4 Traffic remained solid Good exposure on A320, 777 fleets OEM Strong 2011 industry orders, production rates Ramping 787 and 747-8 deliveries WWD share gain with GEnx engine Regional & business jet - recovery 737 MAX & A320neo Important recent WWD wins LEAP-X PurePower Step change in content, share Military Challenging market Foreign military - offsetting US headwind KC-46 tanker win - significant boom controls 5 Airbus A320 737 MAX |
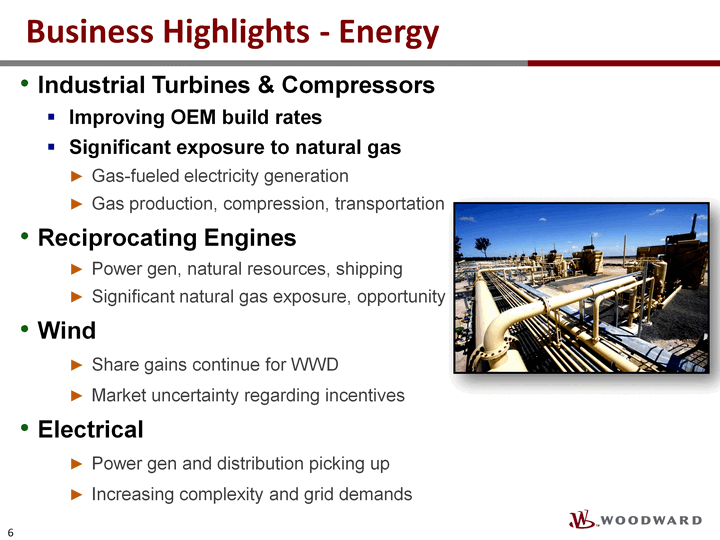
| Business Highlights - Energy Industrial Turbines & Compressors Improving OEM build rates Significant exposure to natural gas Gas-fueled electricity generation Gas production, compression, transportation Reciprocating Engines Power gen, natural resources, shipping Significant natural gas exposure, opportunity Wind Share gains continue for WWD Market uncertainty regarding incentives Electrical Power gen and distribution picking up Increasing complexity and grid demands 6 |
| Woodward Business Summary Rising OEM production rates, equipment usage In Aerospace and Energy Woodward long-term investments Technology and capabilities Delivering share gains on next generation of OEM platforms 2012 outlook favorable Moderate growth rates in our markets Share gains support growth 7 |

| Q4 Consolidated Results 8 * Earnings attributable to Woodward |

| Aerospace Q4 Results Revenues Improvement in Aerospace revenues Commercial Aftermarket Sales OEM Sales for Commercial and Business Jets Earnings Increased volumes & price increases, partially offset by Increased variable compensation Increased R&D for new platforms 9 |

| 10 Aerospace Segment - 2011 Sales Civil 61% Military 39% Aftermarket 38% Original Equipment 62% Propulsion Control 56% Motion Control 44% |
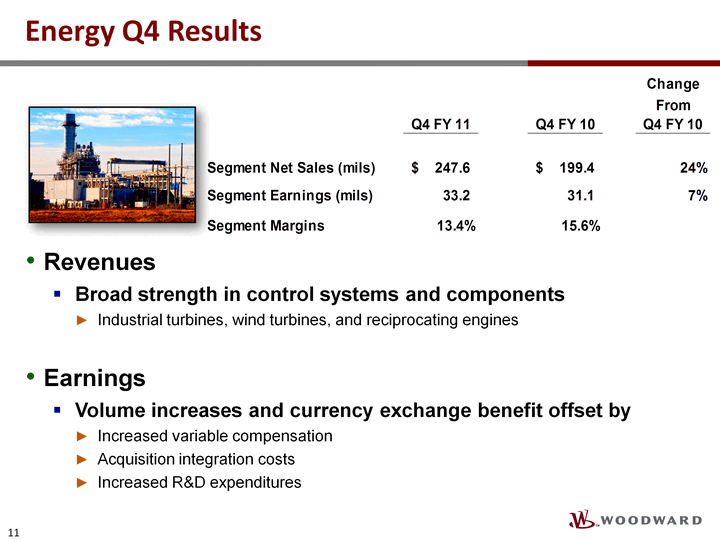
| Energy Q4 Results Revenues Broad strength in control systems and components Industrial turbines, wind turbines, and reciprocating engines Earnings Volume increases and currency exchange benefit offset by Increased variable compensation Acquisition integration costs Increased R&D expenditures 11 |

| (CHART) 12 Energy Segment - 2011 Sales Reciprocating Engines 43% Wind 15% |

| Selected Financial Items - Q4 13 * Gross margin defined as (Net Sales less Cost of Goods Sold) / (Net Sales); ** EBT defined as Net Earnings Before Taxes *** EBITDA reconciliation to Net Earnings and Free Cash Flow calculation are shown in the appendix |
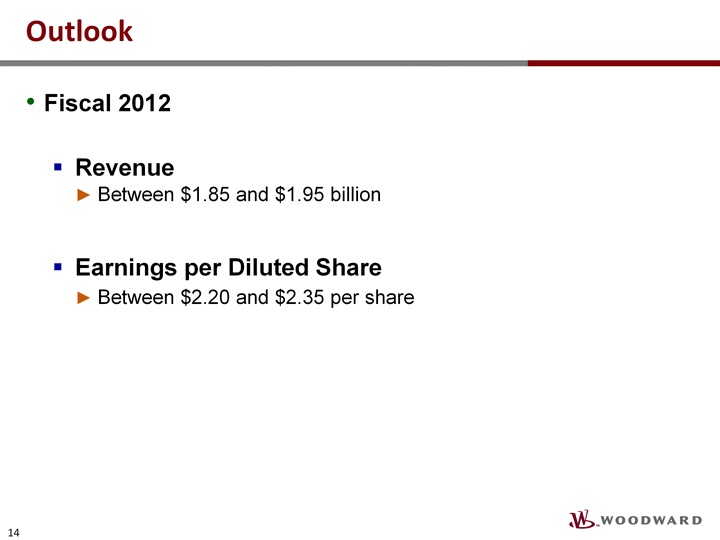
| Outlook Fiscal 2012 Revenue Between $1.85 and $1.95 billion Earnings per Diluted Share Between $2.20 and $2.35 per share 14 |

| Appendix |

| Q4 EBITDA, Free Cash Flow & Leverage Ratio * Non-US GAAP Measures: EBIT (Earnings Before Interest and Taxes), EBITDA (Earnings Before Interest, Taxes, Depreciation and Amortization) and free cash flow are non-US GAAP financial measures. The use of these measures is not intended to be considered in isolation of, or as a substitute for, the financial information prepared and presented in accordance with accounting principles generally accepted in the United States of America. Securities analysts, investors, and others frequently use EBIT, EBITDA and free cash flow in their evaluation of companies, particularly those with significant property, plant, and equipment, and intangible assets that are subject to amortization. Management uses EBIT to evaluate its performance without financing and tax related considerations, as these elements may not fluctuate with operating results. EBITDA is used in reviewing compliance with our debt covenants and in evaluating capital structure impacts of various strategic scenarios. Free cash flow is a non-US GAAP financial measure which Woodward and others define as cash from operations less capital expenditures. (Unaudited) (Unaudited) 16 |

| Long Term Targeted Segment Operating Margins Aerospace Segment ~20% Energy Segment ~16% 17 |
