Attached files
| file | filename |
|---|---|
| EX-99.1 - PRESS RELEASE DATED NOVEMBER 14, 2011 - HANMI FINANCIAL CORP | d255820dex991.htm |
| 8-K - FORM 8-K - HANMI FINANCIAL CORP | d255820d8k.htm |
Exhibit 99.2
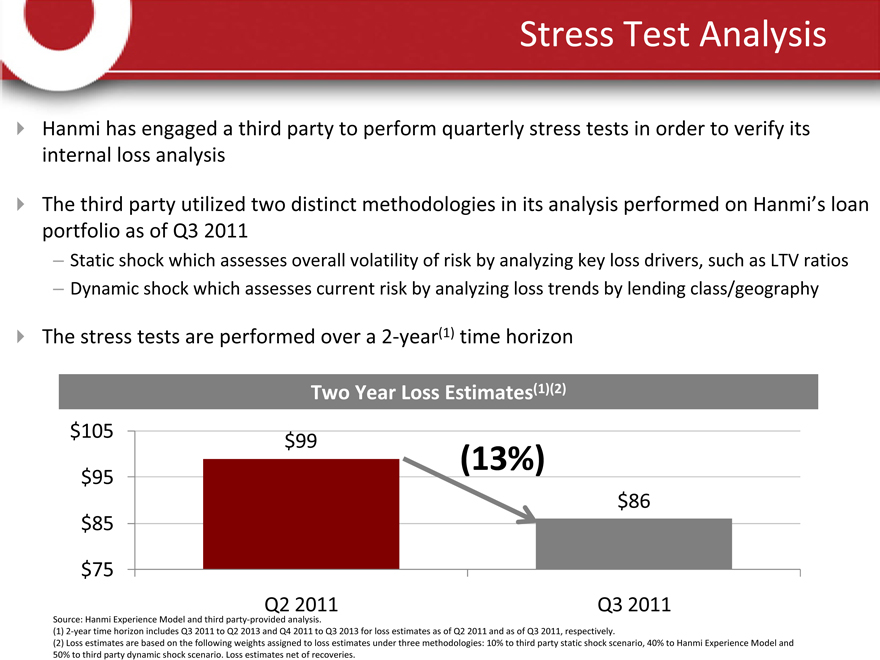
Stress Test Analysis
Hanmi has engaged a third party to perform quarterly stress tests in order to verify its internal loss analysis
The third party utilized two distinct methodologies in its analysis performed on Hanmi’s loan portfolio as of Q3 2011
– Static shock which assesses overall volatility of risk by analyzing key loss drivers, such as LTV ratios
– Dynamic shock which assesses current risk by analyzing loss trends by lending class/geography The stress tests are performed over a 2-year(1) time horizon
Two Year Loss Estimates(1)(2)
$105 $95 $85 $75
$99 $86
(13%)
Q2 2011
Q3 2011
Source: Hanmi Experience Model and third party-provided analysis.
(1) 2-year time horizon includes Q3 2011 to Q2 2013 and Q4 2011 to Q3 2013 for loss estimates as of Q2 2011 and as of Q3 2011, respectively.
(2) Loss estimates are based on the following weights assigned to loss estimates under three methodologies: 10% to third party static shock scenario, 40% to Hanmi Experience Model and 50% to third party dynamic shock scenario. Loss estimates net of recoveries.
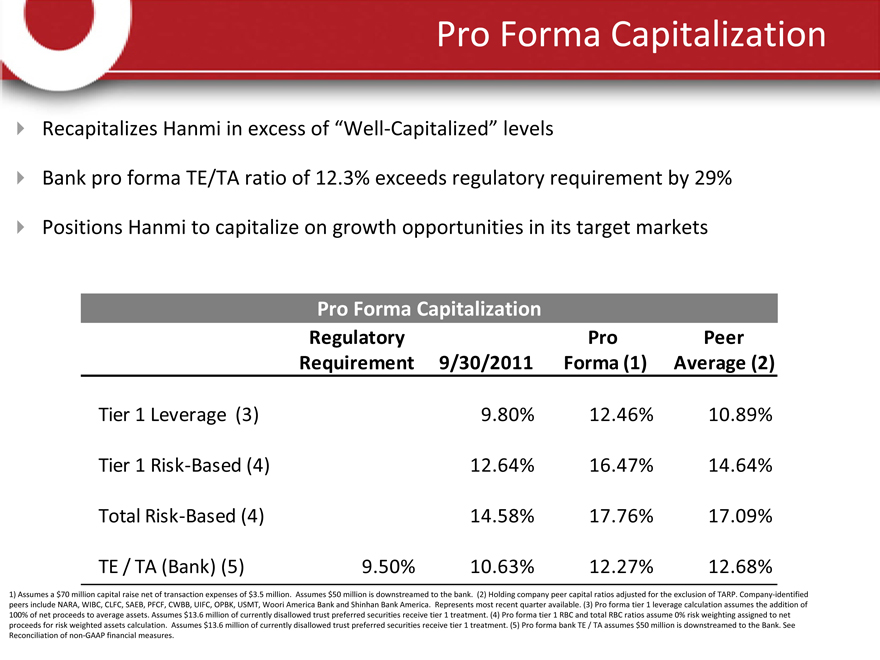
Pro Forma Capitalization
Recapitalizes Hanmi in excess of “Well-Capitalized” levels
Bank pro forma TE/TA ratio of 12.3% exceeds regulatory requirement by 29%
Positions Hanmi to capitalize on growth opportunities in its target markets
Pro Forma Capitalization
Regulatory Pro Peer Requirement 9/30/2011 Forma (1) Average (2)
Tier 1 Leverage (3) Tier 1 Risk-Based (4) Total Risk-Based (4) TE / TA (Bank) (5)
9.50%
9.80% 12.64% 14.58% 10.63%
12.46% 16.47% 17.76% 12.27%
10.89% 14.64% 17.09% 12.68%
1) Assumes a $70 million capital raise net of transaction expenses of $3.5 million. Assumes $50 million is downstreamed to the bank. (2) Holding company peer capital ratios adjusted for the exclusion of TARP. Company-identified peers include NARA, WIBC, CLFC, SAEB, PFCF, CWBB, UIFC, OPBK, USMT, Woori America Bank and Shinhan Bank America. Represents most recent quarter available. (3) Pro forma tier 1 leverage calculation assumes the addition of 100% of net proceeds to average assets. Assumes $13.6 million of currently disallowed trust preferred securities receive tier 1 treatment. (4) Pro forma tier 1 RBC and total RBC ratios assume 0% risk weighting assigned to net proceeds for risk weighted assets calculation. Assumes $13.6 million of currently disallowed trust preferred securities receive tier 1 treatment. (5) Pro forma bank TE / TA assumes $50 million is downstreamed to the Bank. See Reconciliation of non-GAAP financial measures.
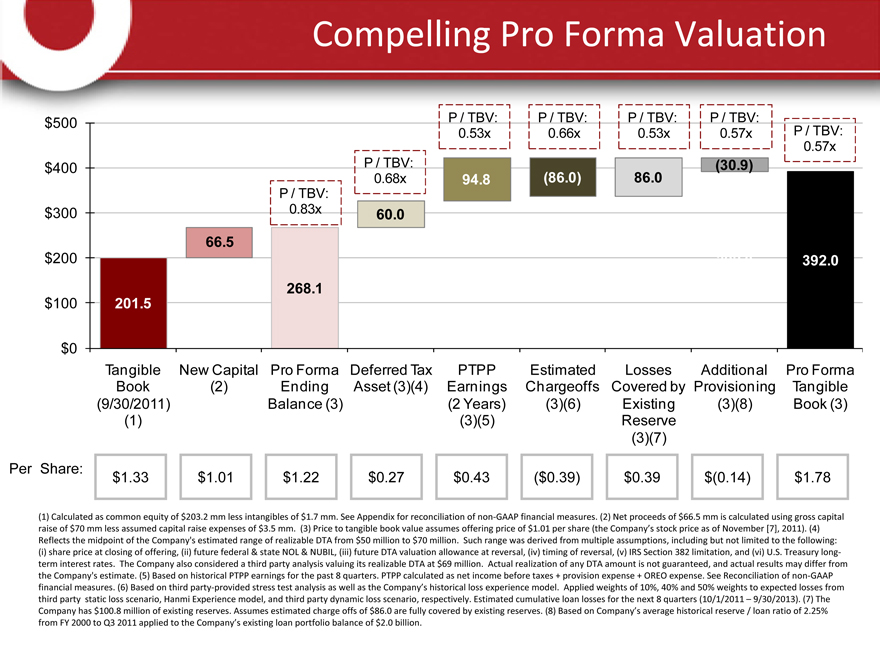
Compelling Pro Forma Valuation
$500 $400 $300 $200 $100 $0
201.5
66.5
P / TBV: 0.83x
268.1
P / TBV: 0.68x
60.0
P / TBV: 0.53x
94.8
P / TBV: 0.66x
(86.0)
P / TBV: 0.53x
86.0
P / TBV: 0.57x
(30.9)
P / TBV:
0.57x
392.0
Tangible Book (9/30/2011) (1)
New Capital (2)
Pro Forma Ending Balance (3)
Deferred Tax Asset (3)(4)
PTPP Earnings
(2 Years) (3)(5)
Estimated Chargeoffs (3)(6)
Losses Covered by Existing Reserve (3)(7)
Additional Provisioning (3)(8)
Pro Forma Tangible Book (3)
Per Share:
$1.33 $1.01 $1.22 $0.27 $0.43 ($0.39) $0.39 $(0.14) $1.78
(1) Calculated as common equity of $203.2 mm less intangibles of $1.7 mm. See Appendix for reconciliation of non-GAAP financial measures. (2) Net proceeds of $66.5 mm is calculated using gross capital raise of $70 mm less assumed capital raise expenses of $3.5 mm. (3) Price to tangible book value assumes offering price of $1.01 per share (the Company’s stock price as of November [7], 2011). (4) Reflects the midpoint of the Company's estimated range of realizable DTA from $50 million to $70 million. Such range was derived from multiple assumptions, including but not limited to the following: (i) share price at closing of offering, (ii) future federal & state NOL & NUBIL, (iii) future DTA valuation allowance at reversal, (iv) timing of reversal, (v) IRS Section 382 limitation, and (vi) U.S. Treasury long-term interest rates. The Company also considered a third party analysis valuing its realizable DTA at $69 million. Actual realization of any DTA amount is not guaranteed, and actual results may differ from the Company's estimate. (5) Based on historical PTPP earnings for the past 8 quarters. PTPP calculated as net income before taxes + provision expense + OREO expense. See Reconciliation of non-GAAP financial measures. (6) Based on third party-provided stress test analysis as well as the Company’s historical loss experience model. Applied weights of 10%, 40% and 50% weights to expected losses from third party static loss scenario, Hanmi Experience model, and third party dynamic loss scenario, respectively. Estimated cumulative loan losses for the next 8 quarters (10/1/2011 – 9/30/2013). (7) The Company has $100.8 million of existing reserves. Assumes estimated charge offs of $86.0 are fully covered by existing reserves. (8) Based on Company’s average historical reserve / loan ratio of 2.25% from FY 2000 to Q3 2011 applied to the Company’s existing loan portfolio balance of $2.0 billion.
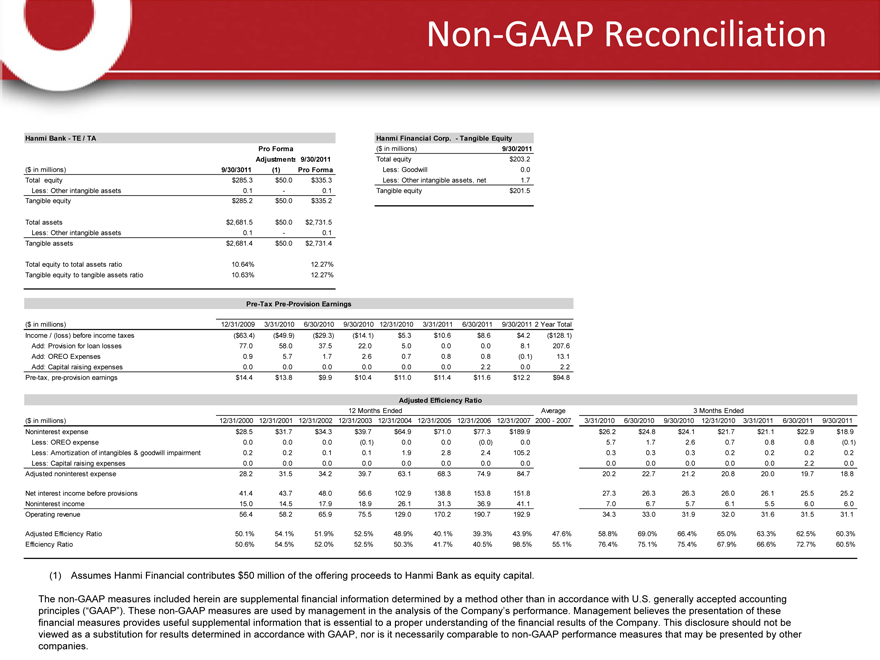
Non-GAAP Reconciliation
Hanmi Bank—TE / TA
Pro Forma
Adjustments 9/30/2011
($ in millions) 9/30/3011(1) Pro Forma
Total equity $285.3 $50.0 $335.3
Less: Other intangible assets 0.1—0.1
Tangible equity $285.2 $50.0 $335.2
Total assets $2,681.5 $50.0 $2,731.5
Less: Other intangible assets 0.1—0.1
Tangible assets $2,681.4 $50.0 $2,731.4
Total equity to total assets ratio 10.64% 12.27%
Tangible equity to tangible assets ratio 10.63% 12.27%
Hanmi Financial Corp.—Tangible Equity
($ in millions) 9/30/2011
Total equity $203.2
Less: Goodwill 0.0
Less: Other intangible assets, net 1.7
Tangible equity $201.5
Pre-Tax Pre-Provision Earnings
($ in millions) 12/31/2009 3/31/2010 6/30/2010 9/30/2010 12/31/2010 3/31/2011 6/30/2011 9/30/2011 2 Year Total
Income / (loss) before income taxes ($63.4) ($49.9) ($29.3) ($14.1) $5.3 $10.6 $8.6 $4.2 ($128.1)
Add: Provision for loan losses 77.0 58.0 37.5 22.0 5.0 0.0 0.0 8.1 207.6
Add: OREO Expenses 0.9 5.7 1.7 2.6 0.7 0.8 0.8 (0.1) 13.1
Add: Capital raising expenses 0.0 0.0 0.0 0.0 0.0 0.0 2.2 0.0 2.2
Pre-tax, pre-provision earnings $14.4 $13.8 $9.9 $10.4 $11.0 $11.4 $11.6 $12.2 $94.8
Adjusted Efficiency Ratio
| 12 |
|
Months Ended Average 3 Months Ended |
($ in millions) 12/31/2000 12/31/2001 12/31/2002 12/31/2003 12/31/2004 12/31/2005 12/31/2006 12/31/2007 2000—2007 3/31/2010 6/30/2010 9/30/2010 12/31/2010 3/31/2011 6/30/2011 9/30/2011
Noninterest expense $28.5 $31.7 $34.3 $39.7 $64.9 $71.0 $77.3 $189.9 $26.2 $24.8 $24.1 $21.7 $21.1 $22.9 $18.9
Less: OREO expense 0.0 0.0 0.0 (0.1) 0.0 0.0 (0.0) 0.0 5.7 1.7 2.6 0.7 0.8 0.8 (0.1)
Less: Amortization of intangibles & goodwill impairment 0.2 0.2 0.1 0.1 1.9 2.8 2.4 105.2 0.3 0.3 0.3 0.2 0.2 0.2 0.2
Less: Capital raising expenses 0.0 0.0 0.0 0.0 0.0 0.0 0.0 0.0 0.0 0.0 0.0 0.0 0.0 2.2 0.0
Adjusted noninterest expense 28.2 31.5 34.2 39.7 63.1 68.3 74.9 84.7 20.2 22.7 21.2 20.8 20.0 19.7 18.8
Net interest income before provisions 41.4 43.7 48.0 56.6 102.9 138.8 153.8 151.8 27.3 26.3 26.3 26.0 26.1 25.5 25.2
Noninterest income 15.0 14.5 17.9 18.9 26.1 31.3 36.9 41.1 7.0 6.7 5.7 6.1 5.5 6.0 6.0
Operating revenue 56.4 58.2 65.9 75.5 129.0 170.2 190.7 192.9 34.3 33.0 31.9 32.0 31.6 31.5 31.1
Adjusted Efficiency Ratio 50.1% 54.1% 51.9% 52.5% 48.9% 40.1% 39.3% 43.9% 47.6% 58.8% 69.0% 66.4% 65.0% 63.3% 62.5% 60.3%
Efficiency Ratio 50.6% 54.5% 52.0% 52.5% 50.3% 41.7% 40.5% 98.5% 55.1% 76.4% 75.1% 75.4% 67.9% 66.6% 72.7% 60.5%
| (1) |
|
Assumes Hanmi Financial contributes $50 million of the offering proceeds to Hanmi Bank as equity capital. |
The non-GAAP measures included herein are supplemental financial information determined by a method other than in accordance with U.S. generally accepted accounting principles (“GAAP”). These non-GAAP measures are used by management in the analysis of the Company’s performance. Management believes the presentation of these financial measures provides useful supplemental information that is essential to a proper understanding of the financial results of the Company. This disclosure should not be viewed as a substitution for results determined in accordance with GAAP, nor is it necessarily comparable to non-GAAP performance measures that may be presented by other companies.