Attached files
| file | filename |
|---|---|
| EX-99.3 - TRANSCRIPT OF THE COMPANY'S CONFERENCE CALL HELD ON NOVEMBER 3, 2011 - SNYDER'S-LANCE, INC. | d253187dex993.htm |
| EX-99.1 - PRESS RELEASE, DATED NOVEMBER 3, 2011 - SNYDER'S-LANCE, INC. | d253187dex991.htm |
| 8-K - FORM 8-K - SNYDER'S-LANCE, INC. | d253187d8k.htm |
EXHIBIT 99.2

Earnings Call – November 3,2011 Sybder’s-Lance INCORPORATED
“Forward Looking Statements” During this discussion, we may make forward-looking statements within the meaning of applicable securities laws. The statements may include projections regarding future earnings and results which are based upon the company’s current expectations and assumptions, which are subject to a number of risks and uncertainties. Factors that could cause actual results to differ include: general economic conditions; increases in cost or availability of ingredients, packaging, energy and employees; price competition and industry consolidation; loss of major customers or changes in product offerings with significant customers; business disruption from merger integration and conversion of our distribution network to independent operators, including failure to realize anticipated synergies in a timely manner or the loss of key personnel; failure to maintain proper and effective internal controls; ability to execute strategic initiatives; product recalls and concerns surrounding the quality or safety of products and ingredients; disruptions to our supply chain or information technology systems; changes in consumer preferences; inability to maintain existing markets or expand to other geographic markets; potential threats to trademarks and other proprietary intellectual rights; food industry and regulatory factors; interest rate and foreign exchange rate risks; and the interests of significant stockholders may conflict with those of other stockholders, which have been discussed in greater detail in our most recent Form 10-K and other reports filed with the Securities and Exchange Commission. 2 Sybder’s-Lance INCORPORATED
Overall Review David V. Singer CEO 3 Sybder’s-Lance INCORPORATED
Operation Discussion Carl E. Lee, Jr. President and COO 4 Sybder’s-Lance INCORPORATED
Third Quarter 2011 Financial Review Rick Puckett EVP, CFO, and Treasurer 5 Sybder’s-Lance INCORPORATED
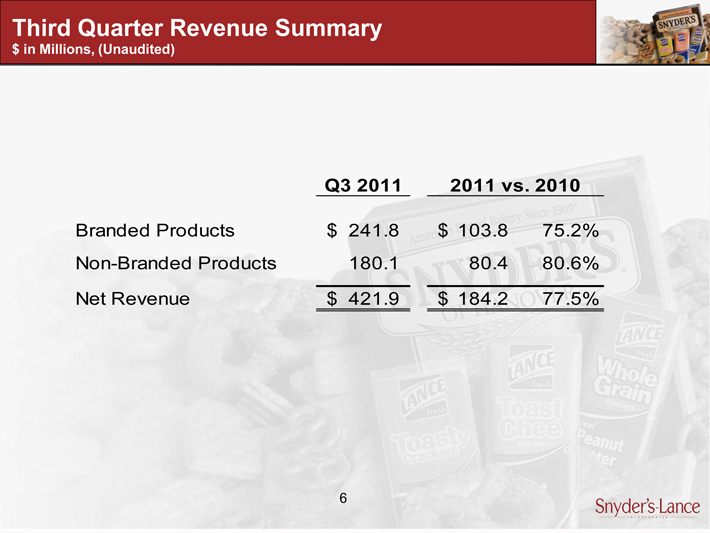
Third Quarter Revenue Summary $ in Millions, (Unaudited) (Unaudited) Q3 2011 2011 vs. 2010 Branded Products $ 241.8 $ 103.8 75.2% Non-Branded Products 180.1 80.4 80.6% Net Revenue $ 421.9 $ 184.2 77.5% 6 Sybder’s-Lance INCORPORATED
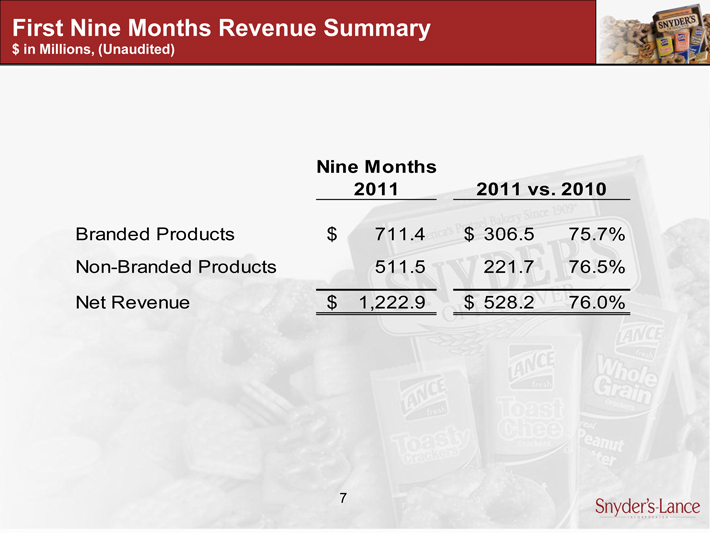
First Nine Months Revenue Summary $ in Millions, (Unaudited) Millions, (Unaudited) Nine Months 2011 2011 vs. 2010 Branded Products $ 711.4 $ 306.5 75.7% Non-Branded Products 511.5 221.7 76.5% Net Revenue $ 1,222.9 $ 528.2 76.0% 7 Sybder’s-Lance INCORPORATED
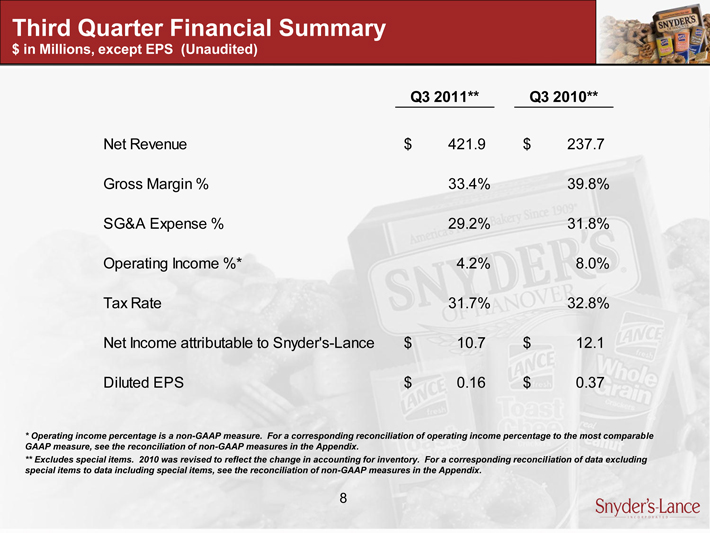
Third Quarter Financial Summary $ in Millions, except EPS (Unaudited) Q3 2011** Q3 2010** Net Revenue $ 421.9 $ 237.7 Gross Margin % 33.4% 39.8% SG&A Expense % 29.2% 31.8% Operating Income %* 4.2% 8.0% Tax Rate 31.7% 32.8% Net Income attributable to Snyder’s-Lance $ 10.7 $ 12.1 Diluted EPS $ 0.16 $ 0.37 * Operating income percentage is a non-GAAP measure. For a corresponding reconciliation of operating income percentage to the most comparable GAAP measure, see the reconciliation of non-GAAP measures in the Appendix. ** Excludes special items. 2010 was revised to reflect the change in accounting for inventory. For a corresponding reconciliation of data excluding special items to data including special items, see the reconciliation of non-GAAP measures in the Appendix. 8 Sybder’s-Lance INCORPORATED
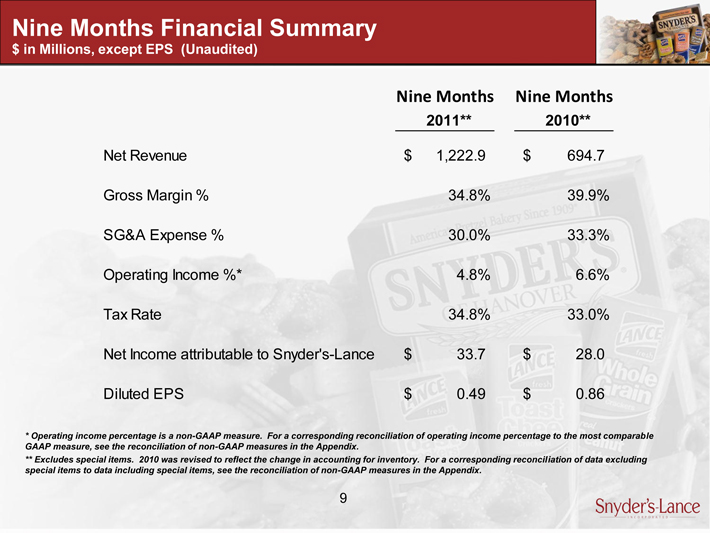
Nine Months Financial Summary $ in Millions, except EPS (Unaudited) Nine Months Nine Months 2011** 2010** Net Revenue $ 1,222.9 $ 694.7 Gross Margin % 34.8% 39.9% SG&A Expense % 30.0% 33.3% Operating Income %* 4.8% 6.6% Tax Rate 34.8% 33.0% Net Income attributable to Snyder’s-Lance $ 33.7 $ 28.0 Diluted EPS $ 0.49 $ 0.86 [Graphic Appears Here] * Operating income percentage is a non-GAAP measure. For a corresponding reconciliation of operating income percentage to the most comparable GAAP measure, see the reconciliation of non-GAAP measures in the Appendix. ** Excludes special items. 2010 was revised to reflect the change in accounting for inventory. For a corresponding reconciliation of data excluding special items to data including special items, see the reconciliation of non-GAAP measures in the Appendix. 9 Sybder’s-Lance INCORPORATED
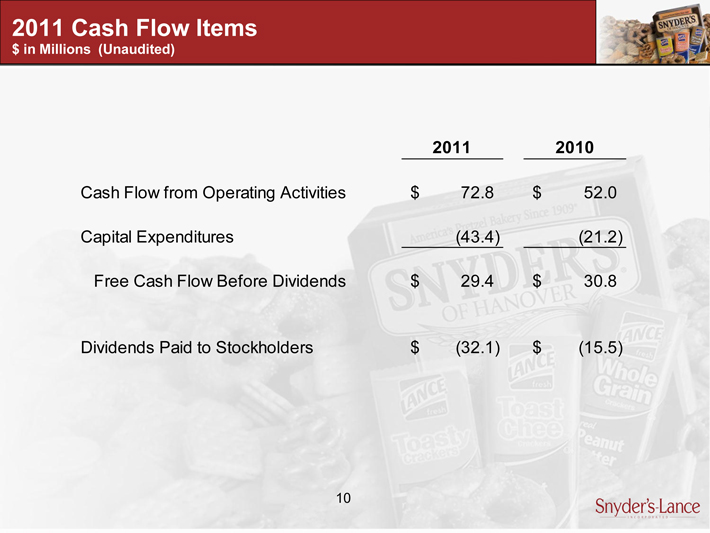
2011 Cash Flow Items $ in Millions (Unaudited) 2011 2010 Cash Flow from Operating Activities $ 72.8 $ 52.0 Capital Expenditures(43.4)(21.2) Free Cash Flow Before Dividends $ 29.4 $ 30.8 Dividends Paid to Stockholders $ (32.1) $ (15.5) 10 Sybder’s-Lance INCORPORATED
Estimates for 2011 11 Sybder’s-Lance INCORPORATED
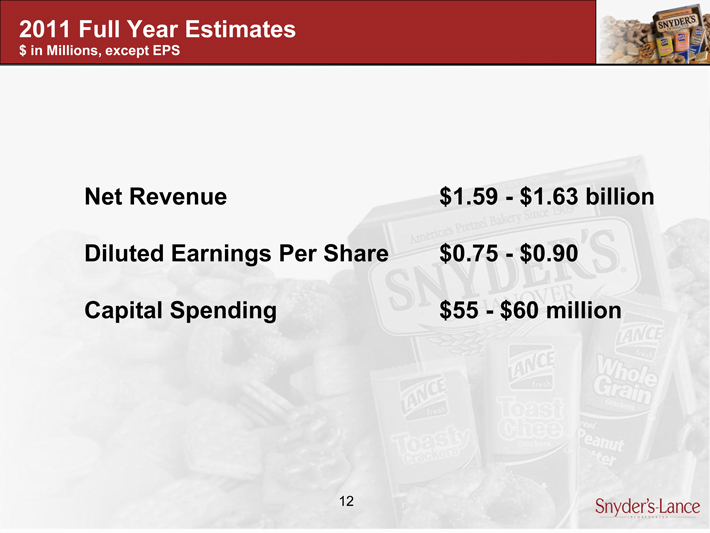
2011 Full Year Estimates $ in Millions, except EPS Net Revenue $1.59—$1.63 billion Diluted Earnings Per Share $0.75—$0.90 Capital Spending $55—$60 million 12 Sybder’s-Lance INCORPORATED

Questions? 13 Sybder’s-Lance INCORPORATED
Appendix 14 Sybder’s-Lance INCORPORATED
Reconciliation of Non-GAAP Measures This presentation includes certain measures not derived in accordance with generally accepted accounting principles (“GAAP”) . Such measures should not be considered substitutes for any measures derived in accordance with GAAP and may also be inconsistent with similar measures presented by other companies. Reconciliation of these non-GAAP financial measures to the most nearly comparable GAAP measures, if applicable, is presented on the slides that follow. The Company believes these non-GAAP financial measures provide useful information to investors as the measures emphasize core ongoing operations and are helpful in comparing past and present operating results. The Company uses these measures to evaluate past performance and prospects for future performance. The presentation of non-GAAP financial measures by the Company should not be considered in isolation or as a substitute for the Company’s financial results prepared in accordance with GAAP. 15 Sybder’s-Lance INCORPORATED
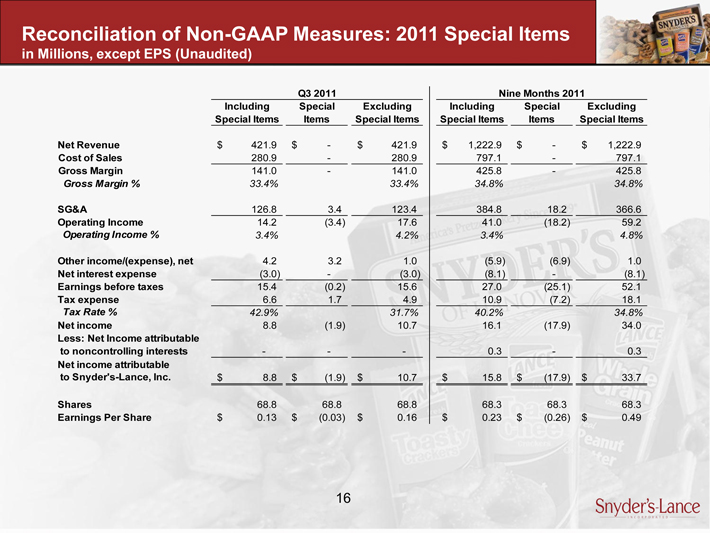
Reconciliation of Non-GAAP Measures: 2011 Special Items in Millions, except EPS (Unaudited) Q3 2011 Nine Months 2011 Including Special Excluding Including Special Excluding Special Items Items Special Items Special Items Items Special Items Net Revenue $ 421.9 $—$ 421.9 $ 1,222.9 $—$ 1,222.9 Cost of Sales 280.9—280.9 797.1—797.1 Gross Margin 141.0—141.0 425.8—425.8 Gross Margin % 33.4% 33.4% 34.8% 34.8% SG&A 126.8 3.4 123.4 384.8 18.2 366.6 Operating Income 14.2(3.4) 17.6 41.0(18.2) 59.2 Operating Income % 3.4% 4.2% 3.4% 4.8% Other income/(expense), net 4.2 3.2 1.0(5.9)(6.9) 1.0 Net interest expense(3.0) -(3.0)(8.1) -(8.1) Earnings before taxes 15.4(0.2) 15.6 27.0(25.1) 52.1 Tax expense 6.6 1.7 4.9 10.9(7.2) 18.1 Tax Rate % 42.9% 31.7% 40.2% 34.8% Net income 8.8(1.9) 10.7 16.1(17.9) 34.0 Less: Net Income attributable to noncontrolling interests—— 0.3—0.3 Net income attributable to Snyder’s-Lance, Inc. $ 8.8 $(1.9) $ 10.7 $ 15.8 $(17.9) $ 33.7 Shares 68.8 68.8 68.8 68.3 68.3 68.3 Earnings Per Share $ 0.13 $(0.03) $ 0.16 $ 0.23 $(0.26) $ 0.49 16 Sybder’s-Lance INCORPORATED
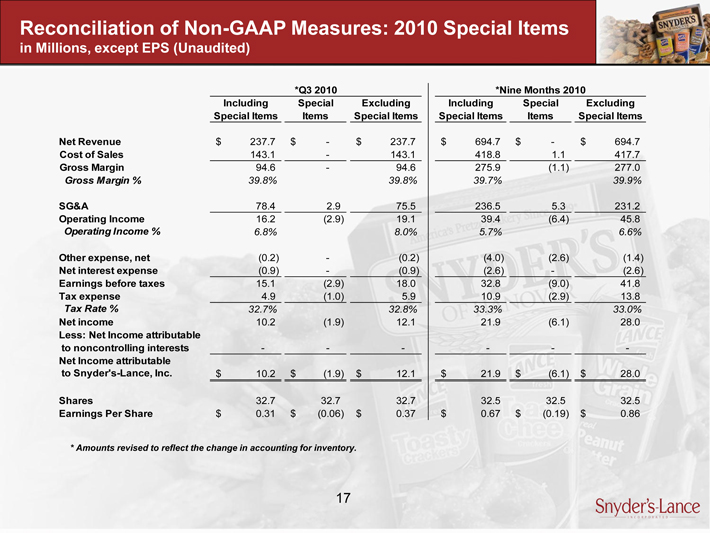
ReReconciliation of Non-GAAP Measures: 2010 Special Items in Millions, except EPS (Unaudited) *Q3 2010*Nine Months 2010 Including Special Excluding Including Special Excluding Special Items Items Special Items Special Items Items Special Items Net Revenue $ 237.7 $—$ 237.7 $ 694.7 $—$ 694.7 Cost of Sales 143.1—143.1 418.8 1.1 417.7 Gross Margin 94.6—94.6 275.9(1.1) 277.0 Gross Margin % 39.8% 39.8% 39.7% 39.9% SG&A 78.4 2.9 75.5 236.5 5.3 231.2 Operating Income 16.2(2.9) 19.1 39.4(6.4) 45.8 Operating Income % 6.8% 8.0% 5.7% 6.6% Other expense, net(0.2) -(0.2)(4.0)(2.6)(1.4) Net interest expense(0.9) -(0.9)(2.6) -(2.6) Earnings before taxes 15.1(2.9) 18.0 32.8(9.0) 41.8 Tax expense 4.9(1.0) 5.9 10.9(2.9) 13.8 Tax Rate % 32.7% 32.8% 33.3% 33.0% Net income 10.2(1.9) 12.1 21.9(6.1) 28.0 Less: Net Income attributable to noncontrolling interests Net Income attributable to Snyder’s-Lance, Inc. $ 10.2 $(1.9) $ 12.1 $ 21.9 $(6.1) $ 28.0 Shares 32.7 32.7 32.7 32.5 32.5 32.5 Earnings Per Share $ 0.31 $(0.06) $ 0.37 $ 0.67 $(0.19) $ 0.86 * Amounts revised to reflect the change in accounting for inventory. 17 Sybder’s-Lance INCORPORATED
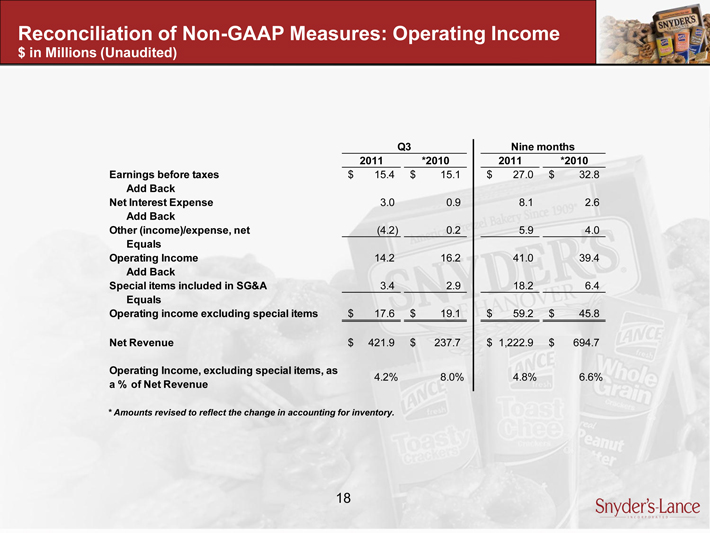
Reconciliation of Non-GAAP Measures: Operating Income $ in Millions (Unaudited) Operating Income $ in Millions (Unaudited) Q3 Nine months 2011*2010 2011* 2010 Earnings before taxes $ 15.4 $ 15.1 $ 27.0 $ 32.8 Add Back Net Interest Expense 3.0 0.9 8.1 2.6 Add Back Other (income)/expense, net (4.2) 0.2 5.9 4.0 Equals Operating Income 14.2 16.2 41.0 39.4 Add Back Special items included in SG&A 3.4 2.9 18.2 6.4 Equals Operating income excluding special items $ 17.6 $ 19.1 $ 59.2 $ 45.8 Net Revenue $ 421.9 $ 237.7 $ 1,222.9 $ 694.7 Operating Income, excluding special items, as 4.2% 8.0% 4.8% 6.6% a % of Net Revenue * Amounts revised to reflect the change in accounting for inventory. 18 Sybder’s-Lance INCORPORATED