Attached files
| file | filename |
|---|---|
| 8-K - FORM 8-K - REGAL BELOIT CORP | c23994e8vk.htm |
| EX-99.1 - EXHIBIT 99.1 - REGAL BELOIT CORP | c23994exv99w1.htm |
Exhibit 99.2
| Jonathan J. Schlemmer Chief Operating Officer Chuck Hinrichs Vice President Chief Financial Officer Mark J. Gliebe President and Chief Executive Officer John M. Perino Vice President Investor Relations |
| Safe Harbor Statement This presentation contains "forward-looking statements" as defined in the Private Securities Litigation Reform Act of 1995. Forward-looking statements represent our management's judgment regarding future events. In many cases, you can identify forward-looking statements by terminology such as "may," "will," "plan," "expect," "anticipate," "estimate," "believe," or "continue" or the negative of these terms or other similar words. Actual results and events could differ materially and adversely from those contained in the forward-looking statements due to a number of factors, including: actions taken by our competitors and our ability to effectively compete in the increasingly competitive global electric motor, power generation and mechanical motion control industries; our ability to develop new products based on technological innovation and the marketplace acceptance of new and existing products; fluctuations in commodity prices and raw material costs; our dependence on significant customers; issues and costs arising from the integration of acquired companies and businesses, including the timing and impact of purchase accounting adjustments; our dependence on key suppliers and the potential effects of supply disruptions; infringement of our intellectual property by third parties, challenges to our intellectual property, and claims of infringement by us of third party technologies; increases in our overall debt levels as a result of acquisitions or otherwise and our ability to repay principal and interest on our outstanding debt; product liability and other litigation, or the failure of our products to perform as anticipated, particularly in high volume applications; unanticipated costs or expenses we may incur related to product warranty issues; economic changes in global markets where we do business, such as reduced demand for the products we sell, currency exchange rates, inflation rates, interest rates, recession, foreign government policies and other external factors that we cannot control; unanticipated liabilities of acquired businesses; cyclical downturns affecting the global market for capital goods; difficulties associated with managing foreign operations; and other risks and uncertainties including but not limited to those described in Item 1A-Risk Factors of the Company's Annual Report on Form 10-K filed on March 2, 2011 and from time to time in our reports filed with U.S. Securities and Exchange Commission. All subsequent written and oral forward-looking statements attributable to us or to persons acting on our behalf are expressly qualified in their entirety by the applicable cautionary statements. The forward-looking statements included in this presentation are made only as of their respective dates, and we undertake no obligation to update these statements to reflect subsequent events or circumstances. 1 |
| Non-GAAP Financial Measures 2 We prepare financial statements in accordance with accounting principles generally accepted in the United States (GAAP). We also disclose adjusted diluted earnings per share (EPS), adjusted gross profit, adjusted gross profit as a percentage of net sales, and free cash flow which are non-GAAP financial measures. We use these measures in our internal performance reporting and for reports to the Board of Directors. We also disclose these measures in our quarterly earnings releases, on investor conference calls, and in investor presentations and similar events. We believe that adjusted diluted EPS, adjusted gross profit, adjusted gross profit as a percentage of net sales and free cash flow are useful measures for providing investors with additional insight into our operating performance. This additional information is not meant to be considered in isolation or as a substitute for our results of operations prepared and presented in accordance with GAAP. Adjusted diluted earnings per share, adjusted gross profit and adjusted gross profit as a percentage of net sales exclude the effects of certain items that are not comparable from one period to the next. Free cash flow is defined as net cash provided by operating activities less additions to property, plant and equipment. e |
| Agenda 3 Mark Gliebe, CEO - Opening Comments Chuck Hinrichs, CFO - Financial Update Jon Schlemmer, COO - Products, Markets & Operations Update Mark Gliebe - 2nd Quarter Outlook & Current View of EPC Transaction Questions & Answers Mark Gliebe - Closing Comments Mark Gliebe, CEO - Opening Comments Chuck Hinrichs, CFO - Financial Update Jon Schlemmer, COO -Operations Update Mark Gliebe - Summary Comments Questions & Answers Close |
| Opening Comments 4 Solid 3rd Quarter Results - Adjusted EPS Exceeded Guidance EPC - Meeting / Exceeding Expectations Record Quarterly Sales, Adjusted EPS and Cash Flow Strength in C&I, Mechanical, International and EPC Continued Weakness in HVAC Free Cash Flow 133% of Net Income Acquisition Pipeline Remains Active |
| Quarter Highlights 5 Closing of EPC Acquisition Strength in C&I, Mechanical, International and EPC Businesses Strong Free Cash Flow Continued Energy Efficient Product Introductions Pricing and Productivity Offset Inflation in Quarter |
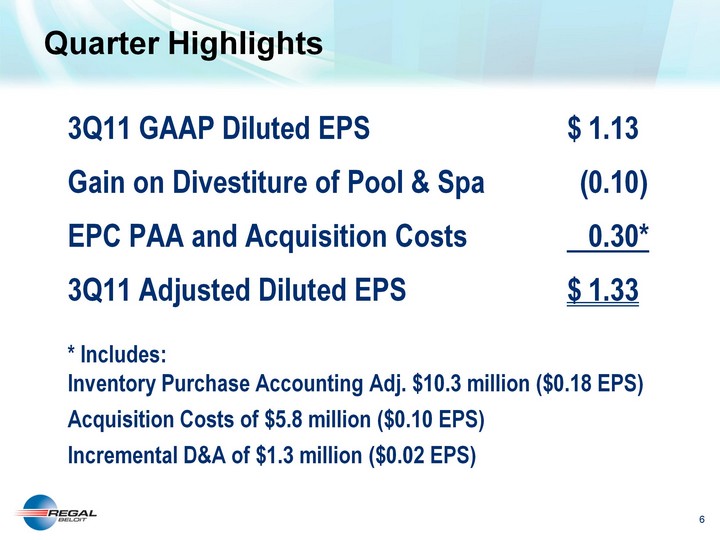
| Quarter Highlights 6 3Q11 GAAP Diluted EPS $ 1.13 Gain on Divestiture of Pool & Spa (0.10) EPC PAA and Acquisition Costs 0.30* 3Q11 Adjusted Diluted EPS $ 1.33 * Includes: Inventory Purchase Accounting Adj. $10.3 million ($0.18 EPS) Acquisition Costs of $5.8 million ($0.10 EPS) Incremental D&A of $1.3 million ($0.02 EPS) |
| Quarter Highlights 7 EPC and C&I Outperformed Expectations + Stronger Sales Implemented Cost and Spending Controls Foreign Currency Gains + Commodity Costs + HVAC Sales - |
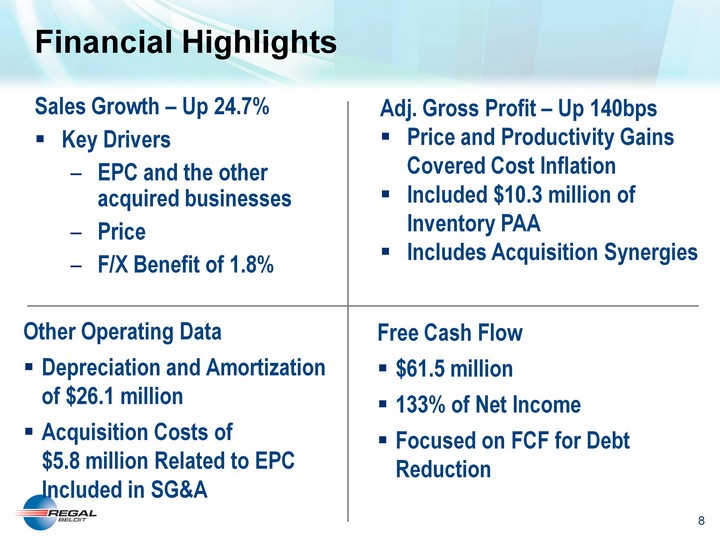
| (CHART) 8 Sales Growth - Up 24.7% Key Drivers EPC and the other acquired businesses Price F/X Benefit of 1.8% Financial Highlights Adj. Gross Profit - Up 140bps Price and Productivity Gains Covered Cost Inflation Included $10.3 million of Inventory PAA Includes Acquisition Synergies Free Cash Flow $61.5 million 133% of Net Income Focused on FCF for Debt Reduction |
| Fourth Quarter 2011 Guidance Adjusted EPS Guidance of $0.67 to $0.73 Includes EPC Operating Results Excludes $15 million ($0.25 EPS) of Inventory PAA at EPC Lower Sales Volume Impacted By: Continued Weak HVAC China Slowing EPC Seasonality Commodity Costs Moderating 9 |
| Operations Update - Sales 10 North American C&I Up 15% Global Generators Up 31% Mechanical Sales Up 10% Sales Outside US Up 44% NA Residential HVAC Sales decreased 20% |
| Operations Update - New Products 11 Energy Efficient Sales 15% of Sales Launched 12 New Products In Q3 On Track for 50 New Product Introductions in 2011 |
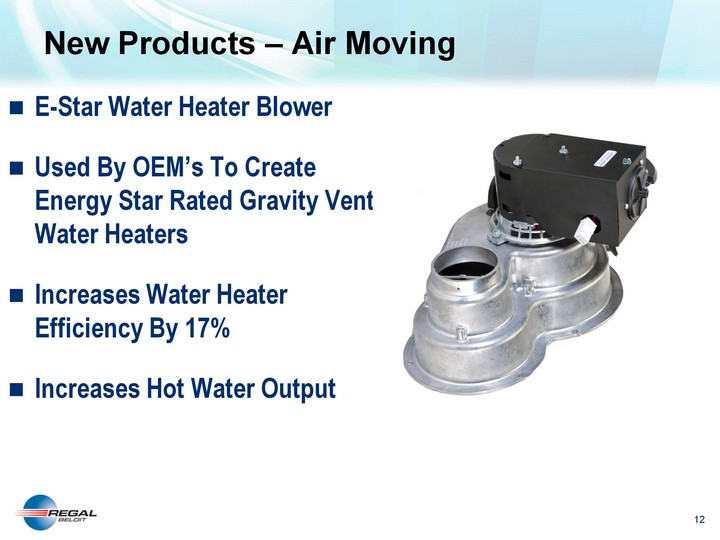
| New Products - Air Moving 12 E-Star Water Heater Blower Used By OEM's To Create Energy Star Rated Gravity Vent Water Heaters Increases Water Heater Efficiency By 17% Increases Hot Water Output |
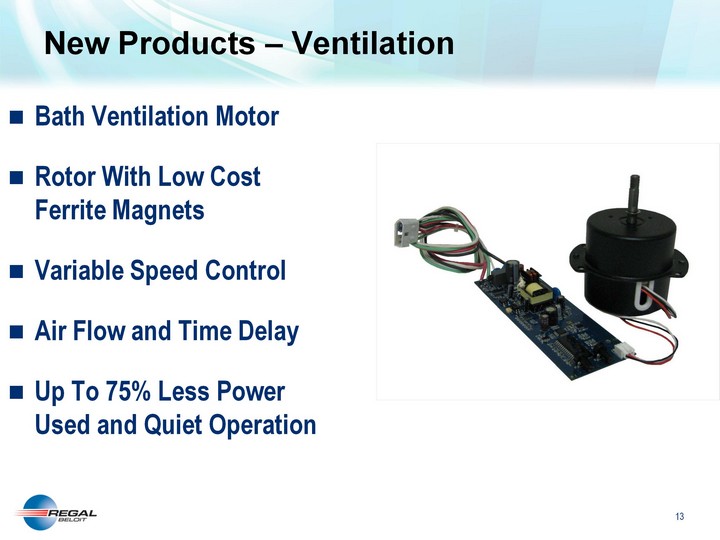
| 13 New Products - Ventilation Bath Ventilation Motor Rotor With Low Cost Ferrite Magnets Variable Speed Control Air Flow and Time Delay Up To 75% Less Power Used and Quiet Operation |
| Operations Update 14 EPC Integration Management Talent Customer Focus Accelerating Cost Synergy Realization Identifying Cross Selling Opportunities Meeting / Exceeding Acquisition Targets |
| Summary 15 EPC Integration Progressing Very Well Pricing Initiatives Offset Current Commodity Inflation New Product Introductions Continue to Provide Exciting Solutions for Our Customers 4th Quarter Guidance Reflects Strength in Most Businesses Continuing to Generate Strong Free Cash Flow |

| 16 Questions and Answers |
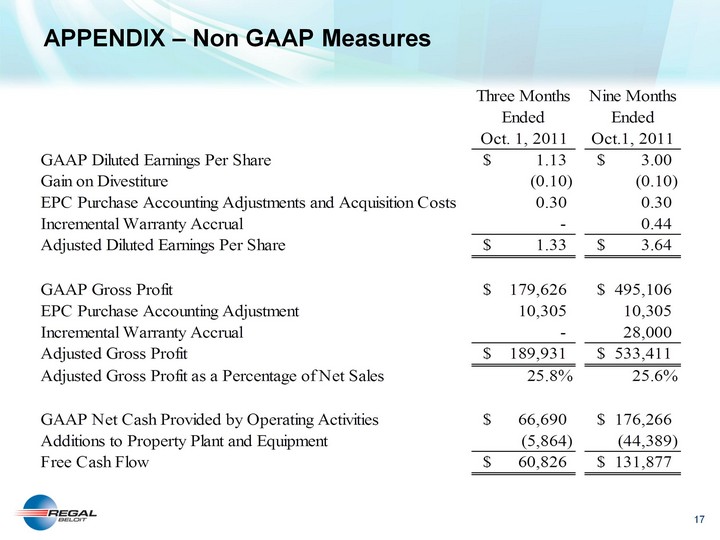
| APPENDIX - Non GAAP Measures 17 |
| Thank you |